Visual Analytics for Complex Engineering Systems:...
10
1803 1077-2626 © 2014 IEEE. Personal use is permitted, but republication/redistribution requires IEEE permission. See http://www.ieee.org/publications_standards/publications/rights/index.html for more information. Visual Analytics for Complex Engineering Systems: Hybrid Visual Steering of Simulation Ensembles Kreˇ simir Matkovi´ c, Member, IEEE CS, Denis Graˇ canin, Senior Member, IEEE, Rainer Splechtna, Member, IEEE CS, Mario Jelovi´ c, Benedikt Stehno, Helwig Hauser, Member, IEEE CS, Werner Purgathofer, Member, IEEE CS Abstract—In this paper we propose a novel approach to hybrid visual steering of simulation ensembles. A simulation ensemble is a collection of simulation runs of the same simulation model using different sets of control parameters. Complex engineering systems have very large parameter spaces so a na¨ ıve sampling can result in prohibitively large simulation ensembles. Interactive steering of simulation ensembles provides the means to select relevant points in a multi-dimensional parameter space (design of experiment). Interactive steering efficiently reduces the number of simulation runs needed by coupling simulation and visualization and allowing a user to request new simulations on the fly. As system complexity grows, a pure interactive solution is not always sufficient. The new approach of hybrid steering combines interactive visual steering with automatic optimization. Hybrid steering allows a domain expert to interactively (in a visualization) select data points in an iterative manner, approximate the values in a continuous region of the simulation space (by regression) and automatically find the “best” points in this continuous region based on the specified constraints and objectives (by optimization). We argue that with the full spectrum of optimization options, the steering process can be improved substantially. We describe an integrated system consisting of a simulation, a visualization, and an optimization component. We also describe typical tasks and propose an interactive analysis workflow for complex engineering systems. We demonstrate our approach on a case study from automotive industry, the optimization of a hydraulic circuit in a high pressure common rail Diesel injection system. Index Terms—Interactive Visual Analysis, Integrated Design Environment, Simulation, Visual Steering, Automatic Optimization 1 I NTRODUCTION Recent advances in computation technologies provide an opportunity to compute large simulation ensembles — multiple simulation runs of the same simulation model using different sets of control parame- ters. Parameter spaces of complex engineering systems, if not care- fully sampled, can result in prohibitively large simulation ensembles. Current emission regulations and efficiency goals are great chal- lenges for automotive systems designers. In order to meet strict time constraints and reduce the time to market, system designers of mod- ern automotive systems need powerful design tools to understand the systems, their behavior, and their responses to changes of the design parameters. In this paper, we present a case study dealing with an in- jection system, i.e., one of the key components of modern car engines. Target users of the proposed solution are designers of complex sys- tems that are based on simulation ensembles. This paper is a result of a long-term collaboration between visualization and simulation experts. We, a team of visualization, simulation, and injection experts, devel- oped the proposed approach, inspired by the actual application in the automotive industry. Our collaboration included numerous interviews and common sessions. We had regular meetings on a weekly basis for more than six months. One of the injection experts with more then 15 • Kreˇ simir Matkovi´ c is with VRVis Research Center, Vienna, Austria. E-mail: [email protected]. • Denis Graˇ canin is with Virginia Tech, Blacksburg, VA USA. E-mail: [email protected]. • Mario Jelovi´ c is with AVL-AST Zagreb, Croatia. E-mail: [email protected]. • Rainer Splechtna is with VRVis Research Center, Vienna, Austria. E-mail: [email protected]. • Benedikt Stehno is with VRVis Research Center, Vienna, Austria. E-mail: [email protected]. • Helwig Hauser is with University of Bergen, Norway. E-mail: [email protected]. • Werner Purgathofer is with Vienna University of Technology, Austria. E-mail: [email protected]. For information on obtaining reprints of this article, please send e-mail to: [email protected]. years experience in simulation, also coauthors the paper. Additionally we observed and interviewed four more simulation experts. Hence, when we say we throughout the paper, we mean the whole team, the visualization and the simulation experts. In our opinion, neither group alone could come to such a solution. The new approach is the result of a long-term research effort to address and overcome the described ob- stacles in the design of a complex system. Although we developed the newly proposed approach with experts from the automotive industry we are confident that the proposed approach can be used in other do- mains where complex simulation data in high dimensional parameter spaces have to be explored and understood. Properly specifying the simulation parameters is a tedious task, and, at the same time, crucial for the effective utilization of simulation. There is an inherent trade-off between the simulation accuracy and its speed. Better accuracy requires more simulation points (i.e., sim- ulation runs) to better cover the parameter space. More simulation runs increase the simulation time and lengthen the design process. A system designer needs help to navigate the simulation space and explore the most promising combinations of simulation parameters. With proper support, the designer can be more efficient and produc- tive. Simulation results often have a complex structure and a simplified representation. A common workflow includes the extraction of certain scalar features prior to the analysis. These features are then studied in the automatic and interactive analysis. Current state of the art tech- niques also support the consideration of complex data in interactive studies [17], but these techniques do not support an automatic anal- ysis at the same time. Our work targets the interactive hybrid visual steering of a simulation ensemble which combines simulation and op- timization with interactive visual steering to provide an integrated de- sign environment. The identified tasks for an integrated, hybrid steering environment are summarized in Table 1. These tasks are abstractions of the ob- served real-world practices and concrete tasks/activities in the auto- motive design workflow. Supporting these tasks is the key require- ment that guided the development of our integrated, hybrid steering environment and our hybrid visual steering approach. The main contributions of this paper are: (1) A case study demon- strating Hybrid Visual Steering, a novel simulation ensembles steering and exploration approach. This approach combines interactive explo- Manuscript received 31 Mar. 2014; accepted 1 Aug. 2014 ate of publication 2014; date of current version 2014. 11Aug. 9 Nov. D . Digital Object Identifier 10.1109/TVCG.2014.2346744 IEEE TRANSACTIONS ON VISUALIZATION AND COMPUTER GRAPHICS, VOL. 20, NO. 1 , C BER 2014 2 DE EM
Transcript of Visual Analytics for Complex Engineering Systems:...

1803
1077-2626 © 2014 IEEE. Personal use is permitted, but republication/redistribution requires IEEE permission.See http://www.ieee.org/publications_standards/publications/rights/index.html for more information.
Visual Analytics for Complex Engineering Systems:Hybrid Visual Steering of Simulation Ensembles
Kresimir Matkovic, Member, IEEE CS, Denis Gracanin, Senior Member, IEEE, Rainer Splechtna, Member, IEEE CS,Mario Jelovic, Benedikt Stehno, Helwig Hauser, Member, IEEE CS, Werner Purgathofer, Member, IEEE CS
Abstract—In this paper we propose a novel approach to hybrid visual steering of simulation ensembles. A simulation ensemble is acollection of simulation runs of the same simulation model using different sets of control parameters. Complex engineering systemshave very large parameter spaces so a naıve sampling can result in prohibitively large simulation ensembles. Interactive steering ofsimulation ensembles provides the means to select relevant points in a multi-dimensional parameter space (design of experiment).Interactive steering efficiently reduces the number of simulation runs needed by coupling simulation and visualization and allowing auser to request new simulations on the fly. As system complexity grows, a pure interactive solution is not always sufficient. The newapproach of hybrid steering combines interactive visual steering with automatic optimization. Hybrid steering allows a domain expertto interactively (in a visualization) select data points in an iterative manner, approximate the values in a continuous region of thesimulation space (by regression) and automatically find the “best” points in this continuous region based on the specified constraintsand objectives (by optimization). We argue that with the full spectrum of optimization options, the steering process can be improvedsubstantially. We describe an integrated system consisting of a simulation, a visualization, and an optimization component. We alsodescribe typical tasks and propose an interactive analysis workflow for complex engineering systems. We demonstrate our approachon a case study from automotive industry, the optimization of a hydraulic circuit in a high pressure common rail Diesel injection system.
Index Terms—Interactive Visual Analysis, Integrated Design Environment, Simulation, Visual Steering, Automatic Optimization
1 INTRODUCTION
Recent advances in computation technologies provide an opportunityto compute large simulation ensembles — multiple simulation runsof the same simulation model using different sets of control parame-ters. Parameter spaces of complex engineering systems, if not care-fully sampled, can result in prohibitively large simulation ensembles.
Current emission regulations and efficiency goals are great chal-lenges for automotive systems designers. In order to meet strict timeconstraints and reduce the time to market, system designers of mod-ern automotive systems need powerful design tools to understand thesystems, their behavior, and their responses to changes of the designparameters. In this paper, we present a case study dealing with an in-jection system, i.e., one of the key components of modern car engines.Target users of the proposed solution are designers of complex sys-tems that are based on simulation ensembles. This paper is a result of along-term collaboration between visualization and simulation experts.We, a team of visualization, simulation, and injection experts, devel-oped the proposed approach, inspired by the actual application in theautomotive industry. Our collaboration included numerous interviewsand common sessions. We had regular meetings on a weekly basis formore than six months. One of the injection experts with more then 15
• Kresimir Matkovic is with VRVis Research Center, Vienna, Austria.E-mail: [email protected].
• Denis Gracanin is with Virginia Tech, Blacksburg, VA USA. E-mail:[email protected].
• Mario Jelovic is with AVL-AST Zagreb, Croatia. E-mail:[email protected].
• Rainer Splechtna is with VRVis Research Center, Vienna, Austria. E-mail:[email protected].
• Benedikt Stehno is with VRVis Research Center, Vienna, Austria. E-mail:[email protected].
• Helwig Hauser is with University of Bergen, Norway. E-mail:[email protected].
• Werner Purgathofer is with Vienna University of Technology, Austria.E-mail: [email protected].
For information on obtaining reprints of this article, please sende-mail to: [email protected].
years experience in simulation, also coauthors the paper. Additionallywe observed and interviewed four more simulation experts. Hence,when we say we throughout the paper, we mean the whole team, thevisualization and the simulation experts. In our opinion, neither groupalone could come to such a solution. The new approach is the result ofa long-term research effort to address and overcome the described ob-stacles in the design of a complex system. Although we developed thenewly proposed approach with experts from the automotive industrywe are confident that the proposed approach can be used in other do-mains where complex simulation data in high dimensional parameterspaces have to be explored and understood.
Properly specifying the simulation parameters is a tedious task, and,at the same time, crucial for the effective utilization of simulation.There is an inherent trade-off between the simulation accuracy andits speed. Better accuracy requires more simulation points (i.e., sim-ulation runs) to better cover the parameter space. More simulationruns increase the simulation time and lengthen the design process.A system designer needs help to navigate the simulation space andexplore the most promising combinations of simulation parameters.With proper support, the designer can be more efficient and produc-tive.
Simulation results often have a complex structure and a simplifiedrepresentation. A common workflow includes the extraction of certainscalar features prior to the analysis. These features are then studiedin the automatic and interactive analysis. Current state of the art tech-niques also support the consideration of complex data in interactivestudies [17], but these techniques do not support an automatic anal-ysis at the same time. Our work targets the interactive hybrid visualsteering of a simulation ensemble which combines simulation and op-timization with interactive visual steering to provide an integrated de-sign environment.
The identified tasks for an integrated, hybrid steering environmentare summarized in Table 1. These tasks are abstractions of the ob-served real-world practices and concrete tasks/activities in the auto-motive design workflow. Supporting these tasks is the key require-ment that guided the development of our integrated, hybrid steeringenvironment and our hybrid visual steering approach.
The main contributions of this paper are: (1) A case study demon-strating Hybrid Visual Steering, a novel simulation ensembles steeringand exploration approach. This approach combines interactive explo-
Manuscript received 31 Mar. 2014; accepted 1 Aug. 2014 ate ofpublication 2014; date of current version 2014.11 Aug. 9 Nov.
D.
Digital Object Identifier 10.1109/TVCG.2014.2346744
IEEE TRANSACTIONS ON VISUALIZATION AND COMPUTER GRAPHICS, VOL. 20, NO. 1 , C BER 20142 DE EM

1804 IEEE TRANSACTIONS ON VISUALIZATION AND COMPUTER GRAPHICS, VOL. 20, NO. 12, DECEMBER 2014
Table 1. Hybrid steering tasks abstractions.A Explore and Analyze the Ensemble
A1 Parameters’Sensitivity
Identify simulation results for certaincontrol parameters and explore theparameters’ sensitivity.
A2 ModelReconstruction
Identify control parameters for adesired output.
A3 Comparison Compare output results related todifferent areas of the parameter space.
R Compute the Regression ModelR1 Model
ValidationShow the model accuracy across theparameter space.
R2 ModelDefinition
Partition the parameter space and definerelevant parts for the regression modelbuilding.
R3 AutomaticOptimization
Automatic optimization using theregression model.
D Generate the DataD1 Initial
ParameterSpace Sampling
Select regions in the parameter space tobe initially sampled.
D2 InteractiveRefinement
Select regions in parameter space whichhave to be resampled.
D3 AutomaticOptimizationRefinement
Choose refinement regions based onautomatic optimization.
ration and analysis with automatic optimization based on regressionmodels; (2) The task abstractions (Table 1) and the supporting visual-ization system, including two improved views, the Parameters Explo-ration View and Regression Exploration View. (3) The tight integra-tion of all relevant components in an interactive workflow; and (4) Anevaluation of the proposed approach based on a case study from theautomotive industry including user feedback.
We build on our previous work [17, 18, 19, 21, 20] which integratesmultiple simulation runs and visualization and focuses exclusively onthe interactive exploration and steering. Here we introduce the adap-tive exploration of the simulation space, based on regression modelingand the use of optimization to find an optimum within a subset of thesimulation space. This new approach covers the spectrum between afully automatic simulation and the manual adjustment of simulationparameters.
2 RELATED WORK
Simulations are usually computationally intensive and are often com-bined with interpolation for sensitivity analysis and optimization. Anexample is the Kriging interpolator, representing a global metamodelthat covers the whole experimental area [40]. However, we can alsoiteratively refine the simulation model, in addition to the refinement ofthe simulation parameter values.
If data analysis is a postprocessing step after a simulation batchis completed, errors invalidating the results of the entire simulationmay be detected too late [25]. Computational steering and interac-tive visualization started in 1980s and 1990s as useful visualizationparadigms for the computational sciences [11] enabling users to in-teractively steer computations, change simulation parameters and in-stantly see the simulation results. The simulation results are usuallypresented using scientific visualization methods [14].
Computational steering integrates modeling, computation, dataanalysis, visualization, and data management components of a sim-ulation [25]. However, integrating simulation within computationalsteering can be a very difficult problem. We need to address four facetsof the problem [15]: control structures, data distribution, data presen-tation, and user interfaces. Since computational steering is a highly in-teractive process, the user interface is a critical component [23]. Thisearly simulation steering approaches usually deal with a single simula-
tion run which lasts for a long time. The idea is to monitor simulationexecution and to change some parameters if preliminary results seemto be wrong. We do rely on basic simulation steering principles, but wedeal with simulation ensemble steering. Our simulation can be com-puted relatively fast, and we steer the ensemble creation, not a singlesimulation run.
In each iteration of computational steering the user can define a re-gion of interest in the parameter space that should be explored in moredetail. Additional simulation runs are needed to cover that region,constituting a new “simulation experiment”. The design of such anexperiment, i.e., the selection of the simulation points in the region ofinterest, is very important since we would like to reduce the numberof simulation runs while providing a good coverage of the region ofinterest [16, 24].
While the support for a user controlled simulation is at the very coreof computational steering, there is very limited support for user con-trolled optimization [3]. Very often there is no clear or unique optimalsolution. A user has to analyze, in an interactive fashion, trade-offs andinterdependencies between objectives [29, 32, 34]. Using an analyticalrepresentation of the objective function the user can explore the valuesof the objective function in the region of interest [22]. Such values canbe dynamically updated in all views and brushes (selections) [28]. Allthese solutions are not integrated in an interactive steering environ-ment. They focus on optimization based on a batch of precomputedsimulation runs. In our case, we use optimization as a guideline ininteractive steering in a fully integrated workflow.
The simulation data consists of discrete simulation points while theregion of interest is usually a continuous space. We can use the simu-lation points to “span” that space using a surrogate (regression) modelthat approximates simulation results over the entire region of inter-est. The number of grid points in full grid methods depends expo-nentially on the number of dimensions. However, using sparse gridscan reduce the dimensionality problem under some smoothness con-ditions. The sparse grid method, originally developed for the solutionof partial differential equations [42], is also used for interpolation andapproximation. The properties of the hierarchical representation andapproximation properties of sparse grids are discussed by Bungartzand Griebel [9]. Improvements over the classical sparse grid approachinclude spatially adaptive refinement, modified ansatz functions, andefficient regularization techniques [26].
Simulation steering and dealing with ensemble simulations requirecontrol over multiple heterogeneous simulation runs. World lines [41]integrate simulation, visualization and computational steering to dealwith the extended solution space by representing simulation runs ascausally connected tracks that share a common time axis. The user hasto select parameter combinations for new runs, there is no automaticsupport in selection of the new design points. Konyha et al. [17] andMatkovic et al. [19, 21] use interactive visual analysis for engineeringproblems with large parameter spaces. This is a purely interactive so-lution without an automatic support for steering. Berger et al. [2] em-ploy statistical learning methods to predict results in real-time at anyuser-defined point and its neighborhood. The user is guided to poten-tially interesting parameter regions and the uncertainty of predictionsis shown using 2D scatterplots and parallel coordinates. Booshehrianet al. [7] present a parameter space exploration approach from the fish-ery domain. These systems are not coupled with simulation, they op-erate on a set of predefined simulation runs. Engel et al. [13] describea novel interactive visual framework for dimensionality reduction ofhigh-dimensional single particle mass spectrometry data. Bergner etal. [4] present ParaGlide, a visualization system designed for interac-tive exploration of parameter spaces of multidimensional simulationmodels. They do initiate new data generation from the visualization,but the selection of points is based solely on user input, there is nosupport from automatic methods.
Machine learning techniques such as support vector machines [8,12, 33] or relevance vector machines [36] can be used to create linear,quadratic or nonlinear surrogate models. The validation of a surro-gate model is difficult in general [27]. We assume that our regressionmodels are validated.
Figure 1. Overview of the proposed approach. Standard simulation: A collection of control parameter values is used for a single simulationrun to determine and visualize simulation results (extracted scalar features). Ensemble simulation: Design of experiment methods are used tocreate several collections of control parameters. The resulting output values are aggregated and visualized together with the control parametervalues. Automatic optimization: Aggregated parameter values are used to create a regression model which is used for optimization using thedefined optimization constraints. This approach is usually decoupled from visual analysis, or visualization is used to show optimization resultsonly. Complex simulation results: All complex simulation results are visualized. Ensemble steering: During visual exploration additionalcontrol parameter values for new simulation runs are selected by means of visualization. Hybrid steering: A unified approach which enables theexploration of parameters, complex results, extracted features and optimization results. Furthermore, it uses results from automatic optimizationto guide the user during interactive visual steering. The hybrid steering also supports regression model building and optimization constraints andgoals specification, all within the same framework.
Figure 2. Simulation ensemble data model: control data points, output data points and features. For each output data point yi, there can be anoutput value yi
j that is a time series (a curve). The time series is replaced by one or more scalar values (feature f ) in the feature space.
Although the related work covers parts of our proposed solution,none of these approaches, according to our best knowledge, integratesall components in a unified framework.
3 SIMULATION AND VISUALIZATION
Figure 1 illustrates our Hybrid Visual Steering approach and its evo-lution. The basic workflow in simulation includes model definition,setting of control parameters, simulation, feature extraction from com-plex simulation results, and the visualization of the extracted features.Feature extraction is necessary if the simulation produces complexdata that is not suitable for standard direct visualization. The blueparts in Figure 1 correspond to such a traditional procedure. Advancesin computation make it possible to compute many runs for the samesimulation model with different sets of control parameters — a simu-lation ensemble.
In this case the parameter space has to be sampled and differentcombinations of control parameters have to be chosen. This is a well-known problem (design of experiment) for which there are severalavailable techniques. A simulation ensemble results in a combina-tion of multiple complex simulation results and multiple scalar fea-tures (red parts in Figure 1). If an automatic optimization is desired,a regression model can be computed based on the control parametersand the extracted scalar features. This step is usually decoupled fromthe visualization (light red parts in Figure 1). In our previous work wehave demonstrated that also complex simulation results can be inte-
grated in the visual analysis [17, 19] (green parts in Figure 1). Ensem-ble steering makes it possible to select new sets of control parametersfrom the visualization [20] (purple parts in Figure 1) in an iterative,interactive manner.
When the simulation space is very large, the iterative design processcan be time consuming and tedious. We would like to help the domainexpert by automatizing this process as much as possible. Therefore,we couple automatic optimization with the visualization in a hybridvisual steering environment (orange parts in Figure 1). Our frameworksupports all identified tasks for a complex system design.
Integrated design environments are not readily available for indus-trial design. Tools are used separately or as partially integrated toolswhich significantly reduces efficiency. The integrated design environ-ment we developed for the common rail injection design resulted, ac-cording to the domain expert, in a speed up factor of at least ten com-pared to the conventional approach where all tools are used separately.We also talked with four more domain experts at the AVL companyworking on optimization, timing drive, hybrid vehicle, and crankshaftdesign. They informally evaluated our integrated design environmentprototypes and estimated a similar potential for speed up.
3.1 Formal Background
We often model the simulation process as a function S that maps thecontrol parameters x = (x1, . . . ,xm) (a control data point in Rm) to theoutput values y = (y1, . . . ,yn) (an output data point in Rn) where m is

MATKOVIĆ ET AL.: VISUAL ANALYTICS FOR COMPLEX ENGINEERING SYSTEMS: HYBRID VISUAL STEERING OF SIMULATION ENSEMBLES 1805
Table 1. Hybrid steering tasks abstractions.A Explore and Analyze the EnsembleA1 Parameters’
SensitivityIdentify simulation results for certaincontrol parameters and explore theparameters’ sensitivity.
A2 ModelReconstruction
Identify control parameters for adesired output.
A3 Comparison Compare output results related todifferent areas of the parameter space.
R Compute the Regression ModelR1 Model
ValidationShow the model accuracy across theparameter space.
R2 ModelDefinition
Partition the parameter space and definerelevant parts for the regression modelbuilding.
R3 AutomaticOptimization
Automatic optimization using theregression model.
D Generate the DataD1 Initial
ParameterSpace Sampling
Select regions in the parameter space tobe initially sampled.
D2 InteractiveRefinement
Select regions in parameter space whichhave to be resampled.
D3 AutomaticOptimizationRefinement
Choose refinement regions based onautomatic optimization.
ration and analysis with automatic optimization based on regressionmodels; (2) The task abstractions (Table 1) and the supporting visual-ization system, including two improved views, the Parameters Explo-ration View and Regression Exploration View. (3) The tight integra-tion of all relevant components in an interactive workflow; and (4) Anevaluation of the proposed approach based on a case study from theautomotive industry including user feedback.
We build on our previous work [17, 18, 19, 21, 20] which integratesmultiple simulation runs and visualization and focuses exclusively onthe interactive exploration and steering. Here we introduce the adap-tive exploration of the simulation space, based on regression modelingand the use of optimization to find an optimum within a subset of thesimulation space. This new approach covers the spectrum between afully automatic simulation and the manual adjustment of simulationparameters.
2 RELATED WORK
Simulations are usually computationally intensive and are often com-bined with interpolation for sensitivity analysis and optimization. Anexample is the Kriging interpolator, representing a global metamodelthat covers the whole experimental area [40]. However, we can alsoiteratively refine the simulation model, in addition to the refinement ofthe simulation parameter values.
If data analysis is a postprocessing step after a simulation batchis completed, errors invalidating the results of the entire simulationmay be detected too late [25]. Computational steering and interac-tive visualization started in 1980s and 1990s as useful visualizationparadigms for the computational sciences [11] enabling users to in-teractively steer computations, change simulation parameters and in-stantly see the simulation results. The simulation results are usuallypresented using scientific visualization methods [14].
Computational steering integrates modeling, computation, dataanalysis, visualization, and data management components of a sim-ulation [25]. However, integrating simulation within computationalsteering can be a very difficult problem. We need to address four facetsof the problem [15]: control structures, data distribution, data presen-tation, and user interfaces. Since computational steering is a highly in-teractive process, the user interface is a critical component [23]. Thisearly simulation steering approaches usually deal with a single simula-
tion run which lasts for a long time. The idea is to monitor simulationexecution and to change some parameters if preliminary results seemto be wrong. We do rely on basic simulation steering principles, but wedeal with simulation ensemble steering. Our simulation can be com-puted relatively fast, and we steer the ensemble creation, not a singlesimulation run.
In each iteration of computational steering the user can define a re-gion of interest in the parameter space that should be explored in moredetail. Additional simulation runs are needed to cover that region,constituting a new “simulation experiment”. The design of such anexperiment, i.e., the selection of the simulation points in the region ofinterest, is very important since we would like to reduce the numberof simulation runs while providing a good coverage of the region ofinterest [16, 24].
While the support for a user controlled simulation is at the very coreof computational steering, there is very limited support for user con-trolled optimization [3]. Very often there is no clear or unique optimalsolution. A user has to analyze, in an interactive fashion, trade-offs andinterdependencies between objectives [29, 32, 34]. Using an analyticalrepresentation of the objective function the user can explore the valuesof the objective function in the region of interest [22]. Such values canbe dynamically updated in all views and brushes (selections) [28]. Allthese solutions are not integrated in an interactive steering environ-ment. They focus on optimization based on a batch of precomputedsimulation runs. In our case, we use optimization as a guideline ininteractive steering in a fully integrated workflow.
The simulation data consists of discrete simulation points while theregion of interest is usually a continuous space. We can use the simu-lation points to “span” that space using a surrogate (regression) modelthat approximates simulation results over the entire region of inter-est. The number of grid points in full grid methods depends expo-nentially on the number of dimensions. However, using sparse gridscan reduce the dimensionality problem under some smoothness con-ditions. The sparse grid method, originally developed for the solutionof partial differential equations [42], is also used for interpolation andapproximation. The properties of the hierarchical representation andapproximation properties of sparse grids are discussed by Bungartzand Griebel [9]. Improvements over the classical sparse grid approachinclude spatially adaptive refinement, modified ansatz functions, andefficient regularization techniques [26].
Simulation steering and dealing with ensemble simulations requirecontrol over multiple heterogeneous simulation runs. World lines [41]integrate simulation, visualization and computational steering to dealwith the extended solution space by representing simulation runs ascausally connected tracks that share a common time axis. The user hasto select parameter combinations for new runs, there is no automaticsupport in selection of the new design points. Konyha et al. [17] andMatkovic et al. [19, 21] use interactive visual analysis for engineeringproblems with large parameter spaces. This is a purely interactive so-lution without an automatic support for steering. Berger et al. [2] em-ploy statistical learning methods to predict results in real-time at anyuser-defined point and its neighborhood. The user is guided to poten-tially interesting parameter regions and the uncertainty of predictionsis shown using 2D scatterplots and parallel coordinates. Booshehrianet al. [7] present a parameter space exploration approach from the fish-ery domain. These systems are not coupled with simulation, they op-erate on a set of predefined simulation runs. Engel et al. [13] describea novel interactive visual framework for dimensionality reduction ofhigh-dimensional single particle mass spectrometry data. Bergner etal. [4] present ParaGlide, a visualization system designed for interac-tive exploration of parameter spaces of multidimensional simulationmodels. They do initiate new data generation from the visualization,but the selection of points is based solely on user input, there is nosupport from automatic methods.
Machine learning techniques such as support vector machines [8,12, 33] or relevance vector machines [36] can be used to create linear,quadratic or nonlinear surrogate models. The validation of a surro-gate model is difficult in general [27]. We assume that our regressionmodels are validated.
Figure 1. Overview of the proposed approach. Standard simulation: A collection of control parameter values is used for a single simulationrun to determine and visualize simulation results (extracted scalar features). Ensemble simulation: Design of experiment methods are used tocreate several collections of control parameters. The resulting output values are aggregated and visualized together with the control parametervalues. Automatic optimization: Aggregated parameter values are used to create a regression model which is used for optimization using thedefined optimization constraints. This approach is usually decoupled from visual analysis, or visualization is used to show optimization resultsonly. Complex simulation results: All complex simulation results are visualized. Ensemble steering: During visual exploration additionalcontrol parameter values for new simulation runs are selected by means of visualization. Hybrid steering: A unified approach which enables theexploration of parameters, complex results, extracted features and optimization results. Furthermore, it uses results from automatic optimizationto guide the user during interactive visual steering. The hybrid steering also supports regression model building and optimization constraints andgoals specification, all within the same framework.
Figure 2. Simulation ensemble data model: control data points, output data points and features. For each output data point yi, there can be anoutput value yi
j that is a time series (a curve). The time series is replaced by one or more scalar values (feature f ) in the feature space.
Although the related work covers parts of our proposed solution,none of these approaches, according to our best knowledge, integratesall components in a unified framework.
3 SIMULATION AND VISUALIZATION
Figure 1 illustrates our Hybrid Visual Steering approach and its evo-lution. The basic workflow in simulation includes model definition,setting of control parameters, simulation, feature extraction from com-plex simulation results, and the visualization of the extracted features.Feature extraction is necessary if the simulation produces complexdata that is not suitable for standard direct visualization. The blueparts in Figure 1 correspond to such a traditional procedure. Advancesin computation make it possible to compute many runs for the samesimulation model with different sets of control parameters — a simu-lation ensemble.
In this case the parameter space has to be sampled and differentcombinations of control parameters have to be chosen. This is a well-known problem (design of experiment) for which there are severalavailable techniques. A simulation ensemble results in a combina-tion of multiple complex simulation results and multiple scalar fea-tures (red parts in Figure 1). If an automatic optimization is desired,a regression model can be computed based on the control parametersand the extracted scalar features. This step is usually decoupled fromthe visualization (light red parts in Figure 1). In our previous work wehave demonstrated that also complex simulation results can be inte-
grated in the visual analysis [17, 19] (green parts in Figure 1). Ensem-ble steering makes it possible to select new sets of control parametersfrom the visualization [20] (purple parts in Figure 1) in an iterative,interactive manner.
When the simulation space is very large, the iterative design processcan be time consuming and tedious. We would like to help the domainexpert by automatizing this process as much as possible. Therefore,we couple automatic optimization with the visualization in a hybridvisual steering environment (orange parts in Figure 1). Our frameworksupports all identified tasks for a complex system design.
Integrated design environments are not readily available for indus-trial design. Tools are used separately or as partially integrated toolswhich significantly reduces efficiency. The integrated design environ-ment we developed for the common rail injection design resulted, ac-cording to the domain expert, in a speed up factor of at least ten com-pared to the conventional approach where all tools are used separately.We also talked with four more domain experts at the AVL companyworking on optimization, timing drive, hybrid vehicle, and crankshaftdesign. They informally evaluated our integrated design environmentprototypes and estimated a similar potential for speed up.
3.1 Formal Background
We often model the simulation process as a function S that maps thecontrol parameters x = (x1, . . . ,xm) (a control data point in Rm) to theoutput values y = (y1, . . . ,yn) (an output data point in Rn) where m is

1806 IEEE TRANSACTIONS ON VISUALIZATION AND COMPUTER GRAPHICS, VOL. 20, NO. 12, DECEMBER 2014
the number of control parameters and n is the number of outputs. Dueto the physical constraints of the simulated system, the set of feasiblecontrol data points C is a subset of Rm and the set of feasible outputdata points O is a subset of Rn. A simulation ensemble E is a set ofpairs of data points (x,y), x ∈C and y ∈ O.
Traditional data analysis approaches, such as statistics or OLAPtechniques [35], usually use a relatively simple multi-dimensionalmodel [10, 31] (simple with respect to the types of data dimensions)using data tables to capture relations among control parameter valuesfor the same simulation run. While the control parameters are almostalways numerical, scalar values, the output values also often includetime/data series so O is no longer a subset of Rn.
Since simple data tables [10] are not sufficient, we need an adequatesimulation ensemble data model to deal with more complex data. Oursimulation ensemble data model uses a two-level data hierarchy forthe output data points (Figure 2).
For each output data point yi and yij that is a data series, we have a
separate set of “sub-points” with its own length and number of dimen-sions (parameters). Our discussion is limited to two dimensions. Wecan select one of the data series dimensions as the independent vari-able (e.g., time) and the other dimension as the dependent variable.Such data series can be considered a function of one variable and rep-resented as a curve. The curve is replaced by one or more scalar values(features f ) to create a feature point zi in the feature space F , a subsetof Rn′ , n′ ≥ n.
In other words, the scalar values yis from yi are directly used in the
feature space as the corresponding values zis in zi while each data series
value yij from yi is replaced by one or more scalar values (features f )
in zi.
3.2 Regression ModelIf we can approximate the mapping S from the control parameter val-ues to the simulation results using a regression model, we can esti-mate the simulation results much faster, compared to actually runningthe simulation. In order to estimate S, a number of simulation runsare executed to get a set of input-feature pairs (simulation ensemble),{(xi,zi)} as training data. A regression model R is built from the train-ing data as the surrogate model of the simulation.
After the regression model is trained, we can then use it to estimatethe simulation results for arbitrary input values. Or, more importantly,it can be applied in an optimization process, of which the goal is toobtain a set of control parameters so that the simulation results sat-isfy a set of desired constraints, such as the maximization of a linearcombination of the output variables.
4 INTEGRATED INTERACTIVE STEERING WORKFLOW
Hybrid Visual Steering integrates simulation, optimization, and visual-ization in a unified framework enabling the user to conduct simulationensemble steering. After the computation of a set of initial runs theuser explores the simulation ensemble, and detects a region of interest.New simulation runs are conducted to adaptively increase the resolu-tion of the simulation points in that region and augment the simulationensemble. Automatic optimization supports the user in identifying re-gions of interest. However, since the proposed optimum values arebased on regression models (approximation) built based on scalar fea-tures extracted from actually more complex simulation data (again, anapproximation), we can not rely on them. The user needs a hint onthe regression model accuracy in the detected region, and dependenton this accuracy more or fewer additional runs will be computed. Theoverall workflow can be summarized as:
• Conduct simulation runs based on the design of experiment in thepreceding iteration (for the first iteration create an initial designof experiment).
• Integrate the new simulation runs with the existing data (if thereare any).
• Visually analyze the data and select an objective function.
• Set a regression model to explore the objective function.
• Identify a region of interest.
• Use optimization to determine (seemingly) optimal value(s).
• If the result of this optimization is not satisfactory, create a newdesign of experiment with an increased resolution.
The realization of a hybrid visual steering framework also repre-sents a technical challenge. All components do exist in current designprocesses, but they are not coupled in a unified framework. Further-more, not all of the components support the identified tasks, and theyhave to be extended. The following components are needed to realizean integrated hybrid visual steering environment:
• Design of Experiment (DOE) Component: supports the spec-ification of a subspace of possible input values (a shape in amulti-dimensional space) and the specification of a distributionof points within this space.
• Simulation Component: simulates the phenomena of interest ata comparably accurate level.
• Analysis and Exploration Component: supports feature ex-traction, advanced interaction, and the visualization of complexand scalar simulation results. In the case of steering, it alsosupports the interactive selection of subspaces in the parameterspace, and the specification of new design points. Finally, it alsocontrols regression model building, evaluates it, and shows opti-mization results.
• Regression Model Building Component: builds a regressionmodel from (a subset of) the already computed simulation runs.
• Automatic Optimization Component: computes an optimumusing the regression model, subject to the interactively specifiedconstraints.
We use AVL’s [1] Design Explorer which supports DOE definition,regression model building, and automatic optimization and AVL’sCruiseM for simulation. We extend the existing interactive analysisand exploration component to support all analysis tasks listed in Ta-ble 1. We exploit the well-known principle of coordinated multipleviews and integrate all components in a unified framework.
5 TASKS AND STEERING DESIGN
We have identified three main groups of tasks (Table 1). Each group oftasks has specific requirements. The main questions are how to visual-ize control parameters and simulation results, how to design the inter-action, both for ensemble exploration and for optimization constraintsas well as goals definition, and how to specify new points in the param-eter space. Based on our accumulated experience and the current stateof the art in exploratory visualization, we rely on the coordinated mul-tiple views principle. The main idea is to depict multiple dimensionsusing several views and to allow the user to interactively select (brush)subsets of the data in a view. Consequently, all the corresponding dataitems in all linked views will be consistently highlighted.
5.1 Control Parameters VisualizationThere are several possibilities for sampling the parameter space. Theparameter space can be continuous, or discrete. However, even if theparameter space is continuous, we only select a limited, discrete set ofparameters, resulting in a discrete parameter sample.
As we deal with a multi-dimensional parameter space, well-knowntechniques from visualization can be used. In the case of a continu-ous parameter space, parallel coordinates are often used [27]. Projec-tions to 2D using scatterplots are also frequently used. Furthermore,histograms and bar charts are also regularly used to show values ofdifferent parameters [7].
We needed a view which supports the identified tasks (Table 1, tasksA1–A3, R1–R3, D1–D3). We can abstract the tasks on a finer levelwhen it comes to the parameter space visualization and identify gen-eral task requirements:
Figure 3. Parameters Exploration View: a) Histogram for one parameter. Note that bins which are shown empty might also contain just a few itemswhich are not visible if the display resolution is too low. b) Empty bins are shown in a different color (grey). This design was preferred by domainexperts over highlighting non-empty bins. c) Histogram showing brushed runs (red) in relation to the overall distribution (blue). d) Constraints barbelow the histogram that is used to specify optimization constraints. e) Six parameters shown in the view. f) Six parameters with constraints andoptimum values. Some items are brushed and they are shown in red.
• Show the distribution of each parameter (A1–A3, R2, D1, D2).
• Show the distribution of brushed simulation runs (A1, A2, A3).
• Support the interactive specification of optimization constraintsfor the parameters (R3).
• Initiate regression model building (R2).
• Show the automatically computed optimum values (A3, R3).
• Keep track of the automatic optimization process (R3).
None of the standard views supports all these requirements. We de-signed a new view — the Parameters Exploration View which meetsthe design requirements. It is inspired by the attribute explorer [39].We add additional bars for specifying optimization constraints and ad-ditional interaction capabilities.
The basic idea is to show each parameter as a histogram with a userdefined bin count. Figure 3a shows the histogram for one parameter.Basic information, like the parameter name, its range, and the maxi-mum number of counts across all bins are shown on the left. We donot show this information under the histogram as we stack histogramsvertically. There are five bins in the histogram in Figure 3 that seem tobe empty. As the number of runs per bin can vary, and the histogramshave a limited vertical space, some non-empty bins can occupy onlyone or even less than one pixel. We realized that it is important to markreally empty bins.
During an informal user study with five engineers at the AVL com-pany, we presented them with two alternatives, explicitly markingempty bins and explicitly marking non-empty bins. All engineers pre-ferred the solution where empty bins are marked with a gray rectangle.Figure 3b shows such a solution. We see that there are only four emptybins. There is a bin with just a few runs, which is not marked as empty.This information cannot be seen in Figure 3a.
The view is fully integrated in the coordinated multiple views en-vironment and also shows the brushed runs. Figure 3c shows one his-togram showing brushed runs (red) in addition to the overall distribu-tion (blue).
When designing a complex system the user wants to test varioushypotheses and adjust optimization constraints. The optimization con-straints change during the analysis process. We add a constraints barbelow the histogram (green bars in Figure 3d) to support the interac-tive specification of constraints. The constraints bar is used to specifyconstraints for each parameter. As we binned the parameters a simpleclick in the constraints bar sets the constraints to the specified bin. Theuser can extend the constraints bar by additional clicks or simply bydragging one side of any rectangle in the bar. The dragging includesadditional bins per default, but it can also be set to specify ranges notaligned with the borders of the bins.
Figure 3e shows the Parameters Exploration View for six controlparameters. The computation of a new regression model is also ini-tiated from the Parameters Exploration View. In the left part of theview, which we call view control (not shown in Figure 3), there aretwo buttons which start the process. One initiates the use of all sim-ulation runs and the other computes the regression model based onthe brushed runs only. The user can also choose a regression buildingmethod.
We also want to show the computed optimum values. We depictthem as a polyline, passing through all histograms, similar to a paral-lel coordinates polyline. The line passes through the constraints baras well. The lines are depicted in two colors, depending if they are aresult from a regression model that was computed based on all runsor only on a subset of all runs. As the user hovers over the optimumline, corresponding constraints are shown in the constraints bar. Theuser can also hide the optimum lines if they are not of interest. Thereis a list of all computed optimum values (not shown in the figures)with user specified names, so the user can activate hidden optima ondemand. Figure 3f shows the view for six parameters with an auto-matically computed optimum. The view does not only show brushedvalues but can be used to brush as well. A simple click on a bin selectsthe corresponding parameter values.
5.2 Simulation Results VisualizationBoth parameters and the simulation results have to be shown together.As described in Section 5.1, we deal with a complex data model wherescalars and curves are considered as elementary data units. In the caseof an ensemble, this means that for each dimension we have a collec-tion of scalars (as usual) or a collection of curves. We call all curves inan ensemble that belong to the same dimension a family of curves [17].
When it comes to the exploration and analysis of ensemble simu-lation data (tasks A1, A2, and A3), we have to show the simulationresults. Standard views, such as scatterplots, parallel coordinates, orhistograms are most often used during our study. For more complexoutputs, in particular for the families of curves, we use a curve viewwhich depicts all curves simultaneously also employing a certain den-sity mapping, when needed. Brushing is extensively used in the explo-ration of such ensemble simulation data. Having all complex outputsdepicted, we can easily realize the reconstruction of a model (task A2)which is a tedious or impossible task using analytical methods only.
We use regression models that are evaluated and tuned. There aremultiple methods for evaluating and tuning a regression model (a de-tailed description is beyond the scope of this paper). We are dealingwith a high-dimensional space and many time-dependent state vari-ables are represented by aggregates. Although the model is tuned, it ispractically impossible to find a model which fits all simulation points.Therefore, we also need to show the accuracy of the regression model(task R1). If an automatically computed optimum belongs to an area

MATKOVIĆ ET AL.: VISUAL ANALYTICS FOR COMPLEX ENGINEERING SYSTEMS: HYBRID VISUAL STEERING OF SIMULATION ENSEMBLES 1807
the number of control parameters and n is the number of outputs. Dueto the physical constraints of the simulated system, the set of feasiblecontrol data points C is a subset of Rm and the set of feasible outputdata points O is a subset of Rn. A simulation ensemble E is a set ofpairs of data points (x,y), x ∈C and y ∈ O.
Traditional data analysis approaches, such as statistics or OLAPtechniques [35], usually use a relatively simple multi-dimensionalmodel [10, 31] (simple with respect to the types of data dimensions)using data tables to capture relations among control parameter valuesfor the same simulation run. While the control parameters are almostalways numerical, scalar values, the output values also often includetime/data series so O is no longer a subset of Rn.
Since simple data tables [10] are not sufficient, we need an adequatesimulation ensemble data model to deal with more complex data. Oursimulation ensemble data model uses a two-level data hierarchy forthe output data points (Figure 2).
For each output data point yi and yij that is a data series, we have a
separate set of “sub-points” with its own length and number of dimen-sions (parameters). Our discussion is limited to two dimensions. Wecan select one of the data series dimensions as the independent vari-able (e.g., time) and the other dimension as the dependent variable.Such data series can be considered a function of one variable and rep-resented as a curve. The curve is replaced by one or more scalar values(features f ) to create a feature point zi in the feature space F , a subsetof Rn′ , n′ ≥ n.
In other words, the scalar values yis from yi are directly used in the
feature space as the corresponding values zis in zi while each data series
value yij from yi is replaced by one or more scalar values (features f )
in zi.
3.2 Regression ModelIf we can approximate the mapping S from the control parameter val-ues to the simulation results using a regression model, we can esti-mate the simulation results much faster, compared to actually runningthe simulation. In order to estimate S, a number of simulation runsare executed to get a set of input-feature pairs (simulation ensemble),{(xi,zi)} as training data. A regression model R is built from the train-ing data as the surrogate model of the simulation.
After the regression model is trained, we can then use it to estimatethe simulation results for arbitrary input values. Or, more importantly,it can be applied in an optimization process, of which the goal is toobtain a set of control parameters so that the simulation results sat-isfy a set of desired constraints, such as the maximization of a linearcombination of the output variables.
4 INTEGRATED INTERACTIVE STEERING WORKFLOW
Hybrid Visual Steering integrates simulation, optimization, and visual-ization in a unified framework enabling the user to conduct simulationensemble steering. After the computation of a set of initial runs theuser explores the simulation ensemble, and detects a region of interest.New simulation runs are conducted to adaptively increase the resolu-tion of the simulation points in that region and augment the simulationensemble. Automatic optimization supports the user in identifying re-gions of interest. However, since the proposed optimum values arebased on regression models (approximation) built based on scalar fea-tures extracted from actually more complex simulation data (again, anapproximation), we can not rely on them. The user needs a hint onthe regression model accuracy in the detected region, and dependenton this accuracy more or fewer additional runs will be computed. Theoverall workflow can be summarized as:
• Conduct simulation runs based on the design of experiment in thepreceding iteration (for the first iteration create an initial designof experiment).
• Integrate the new simulation runs with the existing data (if thereare any).
• Visually analyze the data and select an objective function.
• Set a regression model to explore the objective function.
• Identify a region of interest.
• Use optimization to determine (seemingly) optimal value(s).
• If the result of this optimization is not satisfactory, create a newdesign of experiment with an increased resolution.
The realization of a hybrid visual steering framework also repre-sents a technical challenge. All components do exist in current designprocesses, but they are not coupled in a unified framework. Further-more, not all of the components support the identified tasks, and theyhave to be extended. The following components are needed to realizean integrated hybrid visual steering environment:
• Design of Experiment (DOE) Component: supports the spec-ification of a subspace of possible input values (a shape in amulti-dimensional space) and the specification of a distributionof points within this space.
• Simulation Component: simulates the phenomena of interest ata comparably accurate level.
• Analysis and Exploration Component: supports feature ex-traction, advanced interaction, and the visualization of complexand scalar simulation results. In the case of steering, it alsosupports the interactive selection of subspaces in the parameterspace, and the specification of new design points. Finally, it alsocontrols regression model building, evaluates it, and shows opti-mization results.
• Regression Model Building Component: builds a regressionmodel from (a subset of) the already computed simulation runs.
• Automatic Optimization Component: computes an optimumusing the regression model, subject to the interactively specifiedconstraints.
We use AVL’s [1] Design Explorer which supports DOE definition,regression model building, and automatic optimization and AVL’sCruiseM for simulation. We extend the existing interactive analysisand exploration component to support all analysis tasks listed in Ta-ble 1. We exploit the well-known principle of coordinated multipleviews and integrate all components in a unified framework.
5 TASKS AND STEERING DESIGN
We have identified three main groups of tasks (Table 1). Each group oftasks has specific requirements. The main questions are how to visual-ize control parameters and simulation results, how to design the inter-action, both for ensemble exploration and for optimization constraintsas well as goals definition, and how to specify new points in the param-eter space. Based on our accumulated experience and the current stateof the art in exploratory visualization, we rely on the coordinated mul-tiple views principle. The main idea is to depict multiple dimensionsusing several views and to allow the user to interactively select (brush)subsets of the data in a view. Consequently, all the corresponding dataitems in all linked views will be consistently highlighted.
5.1 Control Parameters VisualizationThere are several possibilities for sampling the parameter space. Theparameter space can be continuous, or discrete. However, even if theparameter space is continuous, we only select a limited, discrete set ofparameters, resulting in a discrete parameter sample.
As we deal with a multi-dimensional parameter space, well-knowntechniques from visualization can be used. In the case of a continu-ous parameter space, parallel coordinates are often used [27]. Projec-tions to 2D using scatterplots are also frequently used. Furthermore,histograms and bar charts are also regularly used to show values ofdifferent parameters [7].
We needed a view which supports the identified tasks (Table 1, tasksA1–A3, R1–R3, D1–D3). We can abstract the tasks on a finer levelwhen it comes to the parameter space visualization and identify gen-eral task requirements:
Figure 3. Parameters Exploration View: a) Histogram for one parameter. Note that bins which are shown empty might also contain just a few itemswhich are not visible if the display resolution is too low. b) Empty bins are shown in a different color (grey). This design was preferred by domainexperts over highlighting non-empty bins. c) Histogram showing brushed runs (red) in relation to the overall distribution (blue). d) Constraints barbelow the histogram that is used to specify optimization constraints. e) Six parameters shown in the view. f) Six parameters with constraints andoptimum values. Some items are brushed and they are shown in red.
• Show the distribution of each parameter (A1–A3, R2, D1, D2).
• Show the distribution of brushed simulation runs (A1, A2, A3).
• Support the interactive specification of optimization constraintsfor the parameters (R3).
• Initiate regression model building (R2).
• Show the automatically computed optimum values (A3, R3).
• Keep track of the automatic optimization process (R3).
None of the standard views supports all these requirements. We de-signed a new view — the Parameters Exploration View which meetsthe design requirements. It is inspired by the attribute explorer [39].We add additional bars for specifying optimization constraints and ad-ditional interaction capabilities.
The basic idea is to show each parameter as a histogram with a userdefined bin count. Figure 3a shows the histogram for one parameter.Basic information, like the parameter name, its range, and the maxi-mum number of counts across all bins are shown on the left. We donot show this information under the histogram as we stack histogramsvertically. There are five bins in the histogram in Figure 3 that seem tobe empty. As the number of runs per bin can vary, and the histogramshave a limited vertical space, some non-empty bins can occupy onlyone or even less than one pixel. We realized that it is important to markreally empty bins.
During an informal user study with five engineers at the AVL com-pany, we presented them with two alternatives, explicitly markingempty bins and explicitly marking non-empty bins. All engineers pre-ferred the solution where empty bins are marked with a gray rectangle.Figure 3b shows such a solution. We see that there are only four emptybins. There is a bin with just a few runs, which is not marked as empty.This information cannot be seen in Figure 3a.
The view is fully integrated in the coordinated multiple views en-vironment and also shows the brushed runs. Figure 3c shows one his-togram showing brushed runs (red) in addition to the overall distribu-tion (blue).
When designing a complex system the user wants to test varioushypotheses and adjust optimization constraints. The optimization con-straints change during the analysis process. We add a constraints barbelow the histogram (green bars in Figure 3d) to support the interac-tive specification of constraints. The constraints bar is used to specifyconstraints for each parameter. As we binned the parameters a simpleclick in the constraints bar sets the constraints to the specified bin. Theuser can extend the constraints bar by additional clicks or simply bydragging one side of any rectangle in the bar. The dragging includesadditional bins per default, but it can also be set to specify ranges notaligned with the borders of the bins.
Figure 3e shows the Parameters Exploration View for six controlparameters. The computation of a new regression model is also ini-tiated from the Parameters Exploration View. In the left part of theview, which we call view control (not shown in Figure 3), there aretwo buttons which start the process. One initiates the use of all sim-ulation runs and the other computes the regression model based onthe brushed runs only. The user can also choose a regression buildingmethod.
We also want to show the computed optimum values. We depictthem as a polyline, passing through all histograms, similar to a paral-lel coordinates polyline. The line passes through the constraints baras well. The lines are depicted in two colors, depending if they are aresult from a regression model that was computed based on all runsor only on a subset of all runs. As the user hovers over the optimumline, corresponding constraints are shown in the constraints bar. Theuser can also hide the optimum lines if they are not of interest. Thereis a list of all computed optimum values (not shown in the figures)with user specified names, so the user can activate hidden optima ondemand. Figure 3f shows the view for six parameters with an auto-matically computed optimum. The view does not only show brushedvalues but can be used to brush as well. A simple click on a bin selectsthe corresponding parameter values.
5.2 Simulation Results VisualizationBoth parameters and the simulation results have to be shown together.As described in Section 5.1, we deal with a complex data model wherescalars and curves are considered as elementary data units. In the caseof an ensemble, this means that for each dimension we have a collec-tion of scalars (as usual) or a collection of curves. We call all curves inan ensemble that belong to the same dimension a family of curves [17].
When it comes to the exploration and analysis of ensemble simu-lation data (tasks A1, A2, and A3), we have to show the simulationresults. Standard views, such as scatterplots, parallel coordinates, orhistograms are most often used during our study. For more complexoutputs, in particular for the families of curves, we use a curve viewwhich depicts all curves simultaneously also employing a certain den-sity mapping, when needed. Brushing is extensively used in the explo-ration of such ensemble simulation data. Having all complex outputsdepicted, we can easily realize the reconstruction of a model (task A2)which is a tedious or impossible task using analytical methods only.
We use regression models that are evaluated and tuned. There aremultiple methods for evaluating and tuning a regression model (a de-tailed description is beyond the scope of this paper). We are dealingwith a high-dimensional space and many time-dependent state vari-ables are represented by aggregates. Although the model is tuned, it ispractically impossible to find a model which fits all simulation points.Therefore, we also need to show the accuracy of the regression model(task R1). If an automatically computed optimum belongs to an area

1808 IEEE TRANSACTIONS ON VISUALIZATION AND COMPUTER GRAPHICS, VOL. 20, NO. 12, DECEMBER 2014
where the regression model is not a good approximation of the simu-lation results, we need more simulation runs.
In order to show the model’s accuracy, we simultaneously showsimulation results and approximated results (from the regressionmodel) in the Regression Exploration View. The Regression Explo-ration View uses a projection of the high-dimensional output (solu-tion) space (simulation results and regression model results) onto aplane determined by two selected output values (a scatter plot). Dur-ing the design process a designer should always explore several suchprojections (different pairs of output values).
There are several ways to visualize pairs of points in the scatterplot.We showed different designs to five experts from the AVL company.We did not end with a uniquely preferred solution, as different tasksrequire different approaches. Throughout the following examples thesimulation based points are orange and the regression model basedpoints are blue. Of course, the user can also configure these colors.
The first idea is to show the pairs of points and connecting lines.Figure 4a shows such a case. In an ideal case the orange and the bluepoints would overlap and there would be no lines. In a realistic casethe lines depict the accuracy of the regression model. The lines helpin deciding if a computed point is a good enough approximation in acertain region. In case of many points (Figure 4a) there is a large over-lapping problem and the user gets just a rough impression of accuracy.However, during a drill-down process in the analysis, the number ofrelevant pairs is reduced and the view becomes more useful. Figure 4bshows the same view for a subset of points. The lines are easier toidentify now, and there is in general less clutter.
We also enable the user to show only simulation or only approxi-mation points, and then, to use color coding and point size to encodethe accuracy (the line length in the other solution). The view is lesscluttered as it has less points (Figures 4c and 4d). We also offer a de-sign where only color or only point size is used, but all domain expertspreferred the combined approach. Figure 4e shows the same data asin Figure 4c using color only. The user can turn the context on or off.The context use was very task specific, users sometimes preferred tosee the context and sometimes they wanted no context.
Furthermore, the users are also considering the direction and mag-nitude of the lines. Inspired by the work of Turkay et al. [38, 37],we also show only the deviation lines. In this case all start points aremoved to the origin, and the lines and the end points are shown. Inan ideal case there would be no lines, again. With this setup, it iseasy to brush all lines that have a certain slope and/or magnitude. Fig-ure 4f shows such a visualization. Figure 5 shows two different areas,one where the model is more accurate (Figure 5a) and one where dif-ferences between the simulation and the regression are much bigger(Figure 5b). Figure 5b also shows the context.
6 CASE STUDY
We use an example from the automotive industry to evaluate our pro-posed approach. Together with five domain experts we conducted sev-eral analysis sessions in order to optimize a common rail Diesel injec-tion system. All of these experts have a long (10–20 years) experiencein automotive simulation. The sessions were conducted at AVL [1],one of the worldwide leaders in powertrain measurement and simula-tion systems.
Modern simulation software can be used to simulate injection sys-tems and to help engineers to understand and tune injection param-eters. Many phenomena can not be easily measured experimentallyand the only way to get more information is through computationalsimulation. We used the AVL CruiseM simulation software to simu-late a complete injection system [1]. We simulate an injection systemconsisting of four injectors. The injectors are produced by only fewmanufacturers. Hence the engine manufacturers have to tune them ac-cording to their specific needs. The whole system, including the railand high-pressure pipes, is also different for each engine. The simu-lation model has more than 200 elements. Each element in the simu-lation model has several control and state variables. In this case studywe focus on 6 parameters and explore different simulation results.
Figure 4. Regression Exploration View: A projection of the high-dimensional data points on a plane determined by two output values,X max and Q in j max. The simulation results are shown in orange. Theregression model results are shown in blue. a) Simulation points andcorresponding regression model points are connected by a line to makethe difference between them visually explicit. The view is cluttered dueto the large number of points. b) Only brushed points are visualized. Asthere are much less points, clutter is also reduced. The context shownin gray can be turned off. c) and d) Alternative visualizations whereonly simulation points (c), or only regression points (d) are shown. Thelength of the lines (inverse accuracy of the model) is coded using colorand point size at the same time. All points are shown (as in c). e) Onlycolor is used to code the accuracy, the view c is preferred by domain ex-perts. f) All lines are drawn from the origin which eases to brush pointshaving a large deviation, or which deviate in a certain direction.
The main principle of a common rail system is the use of a high-pressure rail, common to all cylinders. The high pressure in the railis used to precisely inject fuel into the cylinders. Electronically con-trolled actuators open and close the injectors. Sometimes, in one cycle,the main injection is preceded by a pilot injection, or even several ofthem. All this happens at least several hundred times per second. Amore detailed description of common rail injection is beyond the scopeof this paper [5, 6].
Due to high pressures and quick changes in the system, a moderncommon rail injection system operates in a condition which cannot bedescribed sufficiently precise using classical fluid mechanics. Further-
Figure 5. Two interesting areas are brushed. a) The regression modelis quite accurate here. b) A much less accurate area is identified.
Figure 6. A modern common rail injection system used in Diesel en-gines of cars. There is one injector for each cylinder, and a commonrail which utilizes high pressure (over 1500 bar) to precisely control theinjectors’ opening and closing.
more, in a common rail system each cylinder and injector is influencedby the others through the rail. This requires a careful rethinking of tra-ditional system design. Figure 6 shows a modern injection system fora four-cylinder engine.
When tuning an injection system, engineers have a set of goals theyhave to meet. If the process values are not within a certain range,the engine will either run inefficiently or not at all. These results in-clude mass injection rates, injection pressures (for each injector andthe overall system), and the pilot and main injections time intervals.Corresponding control parameters for the desired ranges have to be ex-plored (task A2, model reconstruction). A poor injection automaticallyleads to poor combustion, thereby increasing consumption, pollution,and power loss. An additional challenge in the design of a commonrail injection system is to understand and prevent the appearance ofunwanted pressure oscillations. Modern systems operate at a pressureof over 1500 bar. The oscillations can lead to amplitude jumps of over400 bar. Such large oscillations can cause an undesirable behaviorof individual injectors and introduce differences among the injectors.This results in a reduced efficiency and an increased emission — ex-actly the opposite of the design goals.
In this case study, we are interested in the high-pressure pipe ge-ometry and the common rail itself. We have studied the geometry ofthe common rail and the high pressure pipes and the influence of thecommon-rail pressure and the pilot injection timings on the overallsystem performance.
There are four injectors with pilot and main injections, four high-pressure pipes and the common rail. We need advanced tools to com-prehend the behavior of such a complex system. We assume that theindividual injectors are tuned, and we study (for two pilot injections
and the main injection) the injection pressure, the amount of injectedfuel, the needle opening velocity and the needle closing velocity.
We are exploring the system at the individual cylinder level and atthe overall system level. At the cylinder level we aim at the following:
• Small differences among injection pressures of the individual pi-lot injections.
• Small differences among the amounts of the injected fuel duringthe individual pilot injections.
• Maximum possible needle opening and closing velocities for twopilot injections and the main injection.
• Good damping of pressure oscillations that can occur within thehigh-pressure pipe.
On the overall system level we are looking for minimum possible dif-ferences among injection pressures for the individual cylinders andamong the injected amounts of fuel for the individual cylinders. Be-sides these goals, the injection curves have to be of certain shapes,depending on the engine operation regime.
6.1 Iterative AnalysisAfter creating the model we need to decide which parameters willbe varied. We focus on the six most relevant parameters: L line andD line (the length and diameter of the high pressure pipe), V rail andrail pressure (the volume of the rail and the pressure inside the rail),V inlet (the volume of a junction between the rail and the high pres-sure pipe) and pilot start (the starting time of the first pilot injectionmeasured in degrees of crankshaft rotation).
We vary each control parameter and compute 2700 simulation runs.One simulation run takes approximately 200 milliseconds on a stan-dard single core desktop PC. Several simulations can run simultane-ously when multiple cores are available.
More than 30 output values (time series — functions of the crankangle) are computed per run. Once the simulation values are com-puted, more than 30 features per run are computed as well. Some ofthe features are computed from one curve (e.g., its maximum), andsome are based on several curves. Table 2 shows a small subset of thecomputed scalar features.
All values of each run are computed for two revolutions of thecrankshaft (720 degrees). The result is a complex data set where eachrecord has some scalar attributes and some time series attributes (allstate parameters). Since the computation of the regression model andthe optimization expect scalar values, extracted scalar features are usedto approximate the model.
After the computation of the initial set of runs we started the dataexploration and analysis. Not all of the runs generate feasible results.Some the high pressure parameter combinations result in a too lowinjected fuel mass, for example. Figure 7 shows the initial setup ofour analysis. The Parameters Exploration View is placed in the upperleft corner and it remained there during the whole session. The otherviews are often reconfigured, depending on the current analysis goals.
Table 2. Scalar features of time series simulation values.State parameter ExplanationP m diff Absolute difference between the maximum
pressure during the main injection for thefirst and the third cylinder.
m m diff Absolute difference between the injectedfuel mass during the injection into the firstand the third cylinder.
K d 3 A damping value.P3 pt diff Absolute difference between the maximum
pressure for the first and the second pilot in-jection (third cylinder).
m3 pt diff Absolute difference between the injectedfuel mass during the first and the second pi-lot injection (third cylinder).

MATKOVIĆ ET AL.: VISUAL ANALYTICS FOR COMPLEX ENGINEERING SYSTEMS: HYBRID VISUAL STEERING OF SIMULATION ENSEMBLES 1809
where the regression model is not a good approximation of the simu-lation results, we need more simulation runs.
In order to show the model’s accuracy, we simultaneously showsimulation results and approximated results (from the regressionmodel) in the Regression Exploration View. The Regression Explo-ration View uses a projection of the high-dimensional output (solu-tion) space (simulation results and regression model results) onto aplane determined by two selected output values (a scatter plot). Dur-ing the design process a designer should always explore several suchprojections (different pairs of output values).
There are several ways to visualize pairs of points in the scatterplot.We showed different designs to five experts from the AVL company.We did not end with a uniquely preferred solution, as different tasksrequire different approaches. Throughout the following examples thesimulation based points are orange and the regression model basedpoints are blue. Of course, the user can also configure these colors.
The first idea is to show the pairs of points and connecting lines.Figure 4a shows such a case. In an ideal case the orange and the bluepoints would overlap and there would be no lines. In a realistic casethe lines depict the accuracy of the regression model. The lines helpin deciding if a computed point is a good enough approximation in acertain region. In case of many points (Figure 4a) there is a large over-lapping problem and the user gets just a rough impression of accuracy.However, during a drill-down process in the analysis, the number ofrelevant pairs is reduced and the view becomes more useful. Figure 4bshows the same view for a subset of points. The lines are easier toidentify now, and there is in general less clutter.
We also enable the user to show only simulation or only approxi-mation points, and then, to use color coding and point size to encodethe accuracy (the line length in the other solution). The view is lesscluttered as it has less points (Figures 4c and 4d). We also offer a de-sign where only color or only point size is used, but all domain expertspreferred the combined approach. Figure 4e shows the same data asin Figure 4c using color only. The user can turn the context on or off.The context use was very task specific, users sometimes preferred tosee the context and sometimes they wanted no context.
Furthermore, the users are also considering the direction and mag-nitude of the lines. Inspired by the work of Turkay et al. [38, 37],we also show only the deviation lines. In this case all start points aremoved to the origin, and the lines and the end points are shown. Inan ideal case there would be no lines, again. With this setup, it iseasy to brush all lines that have a certain slope and/or magnitude. Fig-ure 4f shows such a visualization. Figure 5 shows two different areas,one where the model is more accurate (Figure 5a) and one where dif-ferences between the simulation and the regression are much bigger(Figure 5b). Figure 5b also shows the context.
6 CASE STUDY
We use an example from the automotive industry to evaluate our pro-posed approach. Together with five domain experts we conducted sev-eral analysis sessions in order to optimize a common rail Diesel injec-tion system. All of these experts have a long (10–20 years) experiencein automotive simulation. The sessions were conducted at AVL [1],one of the worldwide leaders in powertrain measurement and simula-tion systems.
Modern simulation software can be used to simulate injection sys-tems and to help engineers to understand and tune injection param-eters. Many phenomena can not be easily measured experimentallyand the only way to get more information is through computationalsimulation. We used the AVL CruiseM simulation software to simu-late a complete injection system [1]. We simulate an injection systemconsisting of four injectors. The injectors are produced by only fewmanufacturers. Hence the engine manufacturers have to tune them ac-cording to their specific needs. The whole system, including the railand high-pressure pipes, is also different for each engine. The simu-lation model has more than 200 elements. Each element in the simu-lation model has several control and state variables. In this case studywe focus on 6 parameters and explore different simulation results.
Figure 4. Regression Exploration View: A projection of the high-dimensional data points on a plane determined by two output values,X max and Q in j max. The simulation results are shown in orange. Theregression model results are shown in blue. a) Simulation points andcorresponding regression model points are connected by a line to makethe difference between them visually explicit. The view is cluttered dueto the large number of points. b) Only brushed points are visualized. Asthere are much less points, clutter is also reduced. The context shownin gray can be turned off. c) and d) Alternative visualizations whereonly simulation points (c), or only regression points (d) are shown. Thelength of the lines (inverse accuracy of the model) is coded using colorand point size at the same time. All points are shown (as in c). e) Onlycolor is used to code the accuracy, the view c is preferred by domain ex-perts. f) All lines are drawn from the origin which eases to brush pointshaving a large deviation, or which deviate in a certain direction.
The main principle of a common rail system is the use of a high-pressure rail, common to all cylinders. The high pressure in the railis used to precisely inject fuel into the cylinders. Electronically con-trolled actuators open and close the injectors. Sometimes, in one cycle,the main injection is preceded by a pilot injection, or even several ofthem. All this happens at least several hundred times per second. Amore detailed description of common rail injection is beyond the scopeof this paper [5, 6].
Due to high pressures and quick changes in the system, a moderncommon rail injection system operates in a condition which cannot bedescribed sufficiently precise using classical fluid mechanics. Further-
Figure 5. Two interesting areas are brushed. a) The regression modelis quite accurate here. b) A much less accurate area is identified.
Figure 6. A modern common rail injection system used in Diesel en-gines of cars. There is one injector for each cylinder, and a commonrail which utilizes high pressure (over 1500 bar) to precisely control theinjectors’ opening and closing.
more, in a common rail system each cylinder and injector is influencedby the others through the rail. This requires a careful rethinking of tra-ditional system design. Figure 6 shows a modern injection system fora four-cylinder engine.
When tuning an injection system, engineers have a set of goals theyhave to meet. If the process values are not within a certain range,the engine will either run inefficiently or not at all. These results in-clude mass injection rates, injection pressures (for each injector andthe overall system), and the pilot and main injections time intervals.Corresponding control parameters for the desired ranges have to be ex-plored (task A2, model reconstruction). A poor injection automaticallyleads to poor combustion, thereby increasing consumption, pollution,and power loss. An additional challenge in the design of a commonrail injection system is to understand and prevent the appearance ofunwanted pressure oscillations. Modern systems operate at a pressureof over 1500 bar. The oscillations can lead to amplitude jumps of over400 bar. Such large oscillations can cause an undesirable behaviorof individual injectors and introduce differences among the injectors.This results in a reduced efficiency and an increased emission — ex-actly the opposite of the design goals.
In this case study, we are interested in the high-pressure pipe ge-ometry and the common rail itself. We have studied the geometry ofthe common rail and the high pressure pipes and the influence of thecommon-rail pressure and the pilot injection timings on the overallsystem performance.
There are four injectors with pilot and main injections, four high-pressure pipes and the common rail. We need advanced tools to com-prehend the behavior of such a complex system. We assume that theindividual injectors are tuned, and we study (for two pilot injections
and the main injection) the injection pressure, the amount of injectedfuel, the needle opening velocity and the needle closing velocity.
We are exploring the system at the individual cylinder level and atthe overall system level. At the cylinder level we aim at the following:
• Small differences among injection pressures of the individual pi-lot injections.
• Small differences among the amounts of the injected fuel duringthe individual pilot injections.
• Maximum possible needle opening and closing velocities for twopilot injections and the main injection.
• Good damping of pressure oscillations that can occur within thehigh-pressure pipe.
On the overall system level we are looking for minimum possible dif-ferences among injection pressures for the individual cylinders andamong the injected amounts of fuel for the individual cylinders. Be-sides these goals, the injection curves have to be of certain shapes,depending on the engine operation regime.
6.1 Iterative AnalysisAfter creating the model we need to decide which parameters willbe varied. We focus on the six most relevant parameters: L line andD line (the length and diameter of the high pressure pipe), V rail andrail pressure (the volume of the rail and the pressure inside the rail),V inlet (the volume of a junction between the rail and the high pres-sure pipe) and pilot start (the starting time of the first pilot injectionmeasured in degrees of crankshaft rotation).
We vary each control parameter and compute 2700 simulation runs.One simulation run takes approximately 200 milliseconds on a stan-dard single core desktop PC. Several simulations can run simultane-ously when multiple cores are available.
More than 30 output values (time series — functions of the crankangle) are computed per run. Once the simulation values are com-puted, more than 30 features per run are computed as well. Some ofthe features are computed from one curve (e.g., its maximum), andsome are based on several curves. Table 2 shows a small subset of thecomputed scalar features.
All values of each run are computed for two revolutions of thecrankshaft (720 degrees). The result is a complex data set where eachrecord has some scalar attributes and some time series attributes (allstate parameters). Since the computation of the regression model andthe optimization expect scalar values, extracted scalar features are usedto approximate the model.
After the computation of the initial set of runs we started the dataexploration and analysis. Not all of the runs generate feasible results.Some the high pressure parameter combinations result in a too lowinjected fuel mass, for example. Figure 7 shows the initial setup ofour analysis. The Parameters Exploration View is placed in the upperleft corner and it remained there during the whole session. The otherviews are often reconfigured, depending on the current analysis goals.
Table 2. Scalar features of time series simulation values.State parameter ExplanationP m diff Absolute difference between the maximum
pressure during the main injection for thefirst and the third cylinder.
m m diff Absolute difference between the injectedfuel mass during the injection into the firstand the third cylinder.
K d 3 A damping value.P3 pt diff Absolute difference between the maximum
pressure for the first and the second pilot in-jection (third cylinder).
m3 pt diff Absolute difference between the injectedfuel mass during the first and the second pi-lot injection (third cylinder).
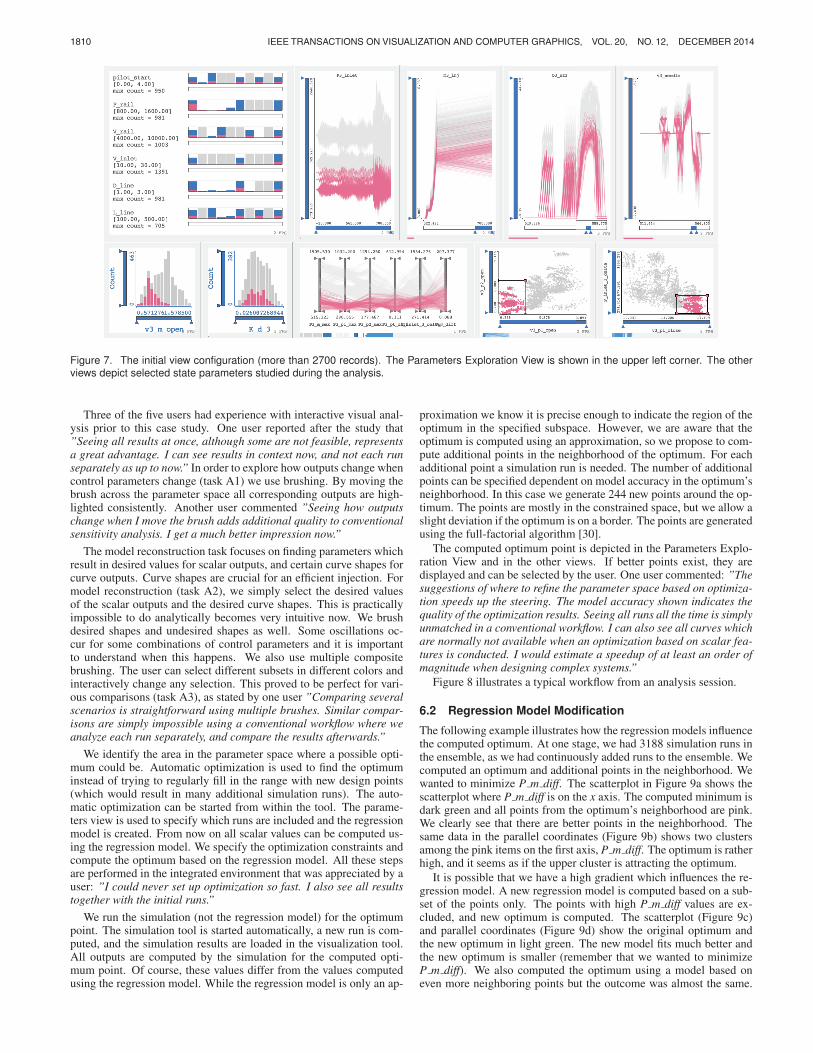
1810 IEEE TRANSACTIONS ON VISUALIZATION AND COMPUTER GRAPHICS, VOL. 20, NO. 12, DECEMBER 2014
Figure 7. The initial view configuration (more than 2700 records). The Parameters Exploration View is shown in the upper left corner. The otherviews depict selected state parameters studied during the analysis.
Three of the five users had experience with interactive visual anal-ysis prior to this case study. One user reported after the study that”Seeing all results at once, although some are not feasible, representsa great advantage. I can see results in context now, and not each runseparately as up to now.” In order to explore how outputs change whencontrol parameters change (task A1) we use brushing. By moving thebrush across the parameter space all corresponding outputs are high-lighted consistently. Another user commented ”Seeing how outputschange when I move the brush adds additional quality to conventionalsensitivity analysis. I get a much better impression now.”
The model reconstruction task focuses on finding parameters whichresult in desired values for scalar outputs, and certain curve shapes forcurve outputs. Curve shapes are crucial for an efficient injection. Formodel reconstruction (task A2), we simply select the desired valuesof the scalar outputs and the desired curve shapes. This is practicallyimpossible to do analytically becomes very intuitive now. We brushdesired shapes and undesired shapes as well. Some oscillations oc-cur for some combinations of control parameters and it is importantto understand when this happens. We also use multiple compositebrushing. The user can select different subsets in different colors andinteractively change any selection. This proved to be perfect for vari-ous comparisons (task A3), as stated by one user ”Comparing severalscenarios is straightforward using multiple brushes. Similar compar-isons are simply impossible using a conventional workflow where weanalyze each run separately, and compare the results afterwards.”
We identify the area in the parameter space where a possible opti-mum could be. Automatic optimization is used to find the optimuminstead of trying to regularly fill in the range with new design points(which would result in many additional simulation runs). The auto-matic optimization can be started from within the tool. The parame-ters view is used to specify which runs are included and the regressionmodel is created. From now on all scalar values can be computed us-ing the regression model. We specify the optimization constraints andcompute the optimum based on the regression model. All these stepsare performed in the integrated environment that was appreciated by auser: ”I could never set up optimization so fast. I also see all resultstogether with the initial runs.”
We run the simulation (not the regression model) for the optimumpoint. The simulation tool is started automatically, a new run is com-puted, and the simulation results are loaded in the visualization tool.All outputs are computed by the simulation for the computed opti-mum point. Of course, these values differ from the values computedusing the regression model. While the regression model is only an ap-
proximation we know it is precise enough to indicate the region of theoptimum in the specified subspace. However, we are aware that theoptimum is computed using an approximation, so we propose to com-pute additional points in the neighborhood of the optimum. For eachadditional point a simulation run is needed. The number of additionalpoints can be specified dependent on model accuracy in the optimum’sneighborhood. In this case we generate 244 new points around the op-timum. The points are mostly in the constrained space, but we allow aslight deviation if the optimum is on a border. The points are generatedusing the full-factorial algorithm [30].
The computed optimum point is depicted in the Parameters Explo-ration View and in the other views. If better points exist, they aredisplayed and can be selected by the user. One user commented: ”Thesuggestions of where to refine the parameter space based on optimiza-tion speeds up the steering. The model accuracy shown indicates thequality of the optimization results. Seeing all runs all the time is simplyunmatched in a conventional workflow. I can also see all curves whichare normally not available when an optimization based on scalar fea-tures is conducted. I would estimate a speedup of at least an order ofmagnitude when designing complex systems.”
Figure 8 illustrates a typical workflow from an analysis session.
6.2 Regression Model Modification
The following example illustrates how the regression models influencethe computed optimum. At one stage, we had 3188 simulation runs inthe ensemble, as we had continuously added runs to the ensemble. Wecomputed an optimum and additional points in the neighborhood. Wewanted to minimize P m diff. The scatterplot in Figure 9a shows thescatterplot where P m diff is on the x axis. The computed minimum isdark green and all points from the optimum’s neighborhood are pink.We clearly see that there are better points in the neighborhood. Thesame data in the parallel coordinates (Figure 9b) shows two clustersamong the pink items on the first axis, P m diff. The optimum is ratherhigh, and it seems as if the upper cluster is attracting the optimum.
It is possible that we have a high gradient which influences the re-gression model. A new regression model is computed based on a sub-set of the points only. The points with high P m diff values are ex-cluded, and new optimum is computed. The scatterplot (Figure 9c)and parallel coordinates (Figure 9d) show the original optimum andthe new optimum in light green. The new model fits much better andthe new optimum is smaller (remember that we wanted to minimizeP m diff). We also computed the optimum using a model based oneven more neighboring points but the outcome was almost the same.
Figure 8. An example of a typical analysis iteration. 1. The Parameters Exploration View is used to set the initial ranges of the control parameters.2. A regression model is computed based on the already computed simulation runs. Time series data are aggregated. 3. The ParametersExploration View shows the first computed optimum. The green poly-line connects the optimal control parameters. 4. Left: the points in theneighborhood of the computed optimum are simulated and depicted in pink. Right: the corresponding curves. It is obvious that there are betterpoints than the automatically suggested one. 5. We additionally check if the curves have acceptable shapes. Left: the selected points and theoptimum are highlighted. Right: the corresponding curves.
Figure 9. a) A scatterplot showing the first optimum (P m diff), darkgreen. b) The parallel coordinates showing the first optimum, darkgreen. c) The scatterplot showing the first and the second optimums(P m diff), light green. d) The parallel coordinates showing the first andthe second optimums, light green.
The curve shapes for the new optimum are examined and verified byusers: ”Hybrid steering makes us aware of automatic optimizationlimits. We can easily see if results are right or not, and we can quicklyrefine the model if needed. I used steering before, but the addition ofautomatic optimization improves it significantly.”
7 DISCUSSION AND CONCLUSIONS
The new Hybrid Visual Steering approach represents an integrated de-sign environment for simulation, visualization, and optimization. Thedevelopment of this approach would have been impossible without aclose collaboration with domain experts through numerous sessionsover several months. The improvements and time savings are signifi-cant when compared to the conventional approach. The integrated de-sign environment manages complex data (no tedious file conversions),keeps track of the process and of all optima found during the process.
We illustrated the approach on the common rail injection systemdesign but the approach is not limited to the injection design only.We talked to the domain experts working on different automotive sys-tems (timing drive, crankshaft balancing, and overall driving comfort)
and they anticipate similar potential speed ups for their design prob-lems. The approach can be applied whenever there is a complex sys-tem that can be represented by a simulation model with a multidimen-sional parameter space (either continuous or discrete), and relativelyfast simulation. The simulation could be any algorithm that computessomething based on control parameters. We are currently exploringapplying the approach to image segmentation in the medical domain.We are also planning to extend the system for air flow simulation andtraffic simulation.
The initial discussions we had with experts from all these domainsmake us confident that Hybrid Visual Steering can be applied in manyscientific and engineering domains. Of course, the individual compo-nents of the system (simulation tool, regression model building tool,optimization, and visualization) should be modified according to thespecific domain, but the main methodology and the workflow (see Sec-tion 4) remains the same. The modifications should be done in con-sultation with the domain experts as every domain has its own require-ments, conventions and standards.
The interplay between the parameters of complex systems is so in-tricate that the expert’s intuition and knowledge can not be representedby an automatic system. Hence it is important to have an interactivesystem. Only human experience, knowledge, and imagination, sup-ported by automatic methods can yield the best-possible results.
In this paper we described our experiences with the injection systemdesign. Initially, the common rail injection system design process wasdone using a number of isolated tools. It was necessary to create anintegrated design environment (Figure 1) that supports simulation, vi-sualization and optimization. The evaluation of the proposed approachby five domain experts demonstrates the viability of the proposed ap-proach, advantages over the existing design practice, and its useful-ness in everyday industrial design. The integrated design environmentwhich was deployed in the context of the case study is currently usedby AVL. The intent is to make it a standard part of AVL’s commerciallyavailable software suite.
ACKNOWLEDGMENTS
Part of this work was done in the scope of the K1 program at the VRVisResearch Center.

MATKOVIĆ ET AL.: VISUAL ANALYTICS FOR COMPLEX ENGINEERING SYSTEMS: HYBRID VISUAL STEERING OF SIMULATION ENSEMBLES 1811
Figure 7. The initial view configuration (more than 2700 records). The Parameters Exploration View is shown in the upper left corner. The otherviews depict selected state parameters studied during the analysis.
Three of the five users had experience with interactive visual anal-ysis prior to this case study. One user reported after the study that”Seeing all results at once, although some are not feasible, representsa great advantage. I can see results in context now, and not each runseparately as up to now.” In order to explore how outputs change whencontrol parameters change (task A1) we use brushing. By moving thebrush across the parameter space all corresponding outputs are high-lighted consistently. Another user commented ”Seeing how outputschange when I move the brush adds additional quality to conventionalsensitivity analysis. I get a much better impression now.”
The model reconstruction task focuses on finding parameters whichresult in desired values for scalar outputs, and certain curve shapes forcurve outputs. Curve shapes are crucial for an efficient injection. Formodel reconstruction (task A2), we simply select the desired valuesof the scalar outputs and the desired curve shapes. This is practicallyimpossible to do analytically becomes very intuitive now. We brushdesired shapes and undesired shapes as well. Some oscillations oc-cur for some combinations of control parameters and it is importantto understand when this happens. We also use multiple compositebrushing. The user can select different subsets in different colors andinteractively change any selection. This proved to be perfect for vari-ous comparisons (task A3), as stated by one user ”Comparing severalscenarios is straightforward using multiple brushes. Similar compar-isons are simply impossible using a conventional workflow where weanalyze each run separately, and compare the results afterwards.”
We identify the area in the parameter space where a possible opti-mum could be. Automatic optimization is used to find the optimuminstead of trying to regularly fill in the range with new design points(which would result in many additional simulation runs). The auto-matic optimization can be started from within the tool. The parame-ters view is used to specify which runs are included and the regressionmodel is created. From now on all scalar values can be computed us-ing the regression model. We specify the optimization constraints andcompute the optimum based on the regression model. All these stepsare performed in the integrated environment that was appreciated by auser: ”I could never set up optimization so fast. I also see all resultstogether with the initial runs.”
We run the simulation (not the regression model) for the optimumpoint. The simulation tool is started automatically, a new run is com-puted, and the simulation results are loaded in the visualization tool.All outputs are computed by the simulation for the computed opti-mum point. Of course, these values differ from the values computedusing the regression model. While the regression model is only an ap-
proximation we know it is precise enough to indicate the region of theoptimum in the specified subspace. However, we are aware that theoptimum is computed using an approximation, so we propose to com-pute additional points in the neighborhood of the optimum. For eachadditional point a simulation run is needed. The number of additionalpoints can be specified dependent on model accuracy in the optimum’sneighborhood. In this case we generate 244 new points around the op-timum. The points are mostly in the constrained space, but we allow aslight deviation if the optimum is on a border. The points are generatedusing the full-factorial algorithm [30].
The computed optimum point is depicted in the Parameters Explo-ration View and in the other views. If better points exist, they aredisplayed and can be selected by the user. One user commented: ”Thesuggestions of where to refine the parameter space based on optimiza-tion speeds up the steering. The model accuracy shown indicates thequality of the optimization results. Seeing all runs all the time is simplyunmatched in a conventional workflow. I can also see all curves whichare normally not available when an optimization based on scalar fea-tures is conducted. I would estimate a speedup of at least an order ofmagnitude when designing complex systems.”
Figure 8 illustrates a typical workflow from an analysis session.
6.2 Regression Model Modification
The following example illustrates how the regression models influencethe computed optimum. At one stage, we had 3188 simulation runs inthe ensemble, as we had continuously added runs to the ensemble. Wecomputed an optimum and additional points in the neighborhood. Wewanted to minimize P m diff. The scatterplot in Figure 9a shows thescatterplot where P m diff is on the x axis. The computed minimum isdark green and all points from the optimum’s neighborhood are pink.We clearly see that there are better points in the neighborhood. Thesame data in the parallel coordinates (Figure 9b) shows two clustersamong the pink items on the first axis, P m diff. The optimum is ratherhigh, and it seems as if the upper cluster is attracting the optimum.
It is possible that we have a high gradient which influences the re-gression model. A new regression model is computed based on a sub-set of the points only. The points with high P m diff values are ex-cluded, and new optimum is computed. The scatterplot (Figure 9c)and parallel coordinates (Figure 9d) show the original optimum andthe new optimum in light green. The new model fits much better andthe new optimum is smaller (remember that we wanted to minimizeP m diff). We also computed the optimum using a model based oneven more neighboring points but the outcome was almost the same.
Figure 8. An example of a typical analysis iteration. 1. The Parameters Exploration View is used to set the initial ranges of the control parameters.2. A regression model is computed based on the already computed simulation runs. Time series data are aggregated. 3. The ParametersExploration View shows the first computed optimum. The green poly-line connects the optimal control parameters. 4. Left: the points in theneighborhood of the computed optimum are simulated and depicted in pink. Right: the corresponding curves. It is obvious that there are betterpoints than the automatically suggested one. 5. We additionally check if the curves have acceptable shapes. Left: the selected points and theoptimum are highlighted. Right: the corresponding curves.
Figure 9. a) A scatterplot showing the first optimum (P m diff), darkgreen. b) The parallel coordinates showing the first optimum, darkgreen. c) The scatterplot showing the first and the second optimums(P m diff), light green. d) The parallel coordinates showing the first andthe second optimums, light green.
The curve shapes for the new optimum are examined and verified byusers: ”Hybrid steering makes us aware of automatic optimizationlimits. We can easily see if results are right or not, and we can quicklyrefine the model if needed. I used steering before, but the addition ofautomatic optimization improves it significantly.”
7 DISCUSSION AND CONCLUSIONS
The new Hybrid Visual Steering approach represents an integrated de-sign environment for simulation, visualization, and optimization. Thedevelopment of this approach would have been impossible without aclose collaboration with domain experts through numerous sessionsover several months. The improvements and time savings are signifi-cant when compared to the conventional approach. The integrated de-sign environment manages complex data (no tedious file conversions),keeps track of the process and of all optima found during the process.
We illustrated the approach on the common rail injection systemdesign but the approach is not limited to the injection design only.We talked to the domain experts working on different automotive sys-tems (timing drive, crankshaft balancing, and overall driving comfort)
and they anticipate similar potential speed ups for their design prob-lems. The approach can be applied whenever there is a complex sys-tem that can be represented by a simulation model with a multidimen-sional parameter space (either continuous or discrete), and relativelyfast simulation. The simulation could be any algorithm that computessomething based on control parameters. We are currently exploringapplying the approach to image segmentation in the medical domain.We are also planning to extend the system for air flow simulation andtraffic simulation.
The initial discussions we had with experts from all these domainsmake us confident that Hybrid Visual Steering can be applied in manyscientific and engineering domains. Of course, the individual compo-nents of the system (simulation tool, regression model building tool,optimization, and visualization) should be modified according to thespecific domain, but the main methodology and the workflow (see Sec-tion 4) remains the same. The modifications should be done in con-sultation with the domain experts as every domain has its own require-ments, conventions and standards.
The interplay between the parameters of complex systems is so in-tricate that the expert’s intuition and knowledge can not be representedby an automatic system. Hence it is important to have an interactivesystem. Only human experience, knowledge, and imagination, sup-ported by automatic methods can yield the best-possible results.
In this paper we described our experiences with the injection systemdesign. Initially, the common rail injection system design process wasdone using a number of isolated tools. It was necessary to create anintegrated design environment (Figure 1) that supports simulation, vi-sualization and optimization. The evaluation of the proposed approachby five domain experts demonstrates the viability of the proposed ap-proach, advantages over the existing design practice, and its useful-ness in everyday industrial design. The integrated design environmentwhich was deployed in the context of the case study is currently usedby AVL. The intent is to make it a standard part of AVL’s commerciallyavailable software suite.
ACKNOWLEDGMENTS
Part of this work was done in the scope of the K1 program at the VRVisResearch Center.

1812 IEEE TRANSACTIONS ON VISUALIZATION AND COMPUTER GRAPHICS, VOL. 20, NO. 12, DECEMBER 2014
REFERENCES
[1] AVL. AVL List GmbH. http://www.avl.com/, 2013. [last ac-cessed 25 June 2014].
[2] W. Berger, H. Piringer, P. Filzmoser, and E. Groller. Uncertainty-awareexploration of continuous parameter spaces using multivariate prediction.Computer Graphics Forum, 30(3):911–920, June 2011.
[3] W. Berger and H. Pringer. Interactive visual analysis of multiobjectiveoptimizations. In Proceedings of the 2010 IEEE Symposium on VisualAnalytics Science and Technology, pages 215–216, 24–29 Oct. 2010.
[4] S. Bergner, M. Sedlmair, T. Moller, S. N. Abdolyousefi, and A. Saad.ParaGlide: Interactive parameter space partitioning for computer simu-lations. IEEE Transactions on Visualization and Computer Graphics,19(9):1499–1512, Sept. 2013.
[5] F. Boecking, U. Dohle, J. Hammer, and S. Kampmann. Passenger carcommon rail systems for future emissions standards. MTZ worldwide,66(7–8):552–557, 2005.
[6] W. Boehner and K. Hummel. Common Rail Injection System for Com-mercial Diesel Vehicles. SAE Transactions, (SAE 970345), 1997.
[7] M. Booshehrian, T. Moller, R. M. Peterman, and T. Munzner. Vis-mon: Facilitating analysis of trade-offs, uncertainty, and sensitivity infisheries management decision making. Computer Graphics Forum,31(3pt3):1235–1244, June 2012.
[8] B. E. Boser, I. M. Guyon, and V. N. Vapnik. A training algorithm foroptimal margin classifiers. In Proceedings of the Fifth Annual Workshopon Computational Learning Theory (COLT ’92), pages 144–152, NewYork, 1992. ACM.
[9] H.-J. Bungartz and M. Griebel. Sparse grids. Acta Numerica, 13:147–269, 2004.
[10] S. K. Card, J. Mackinlay, and B. Shneiderman, editors. Readings in In-formation Visualization: Using Vision to Think. Interactive Technologies.Morgan Kaufmann, 1999.
[11] J. X. Chen, D. Rine, and H. D. Simon. Advancing interactive visualiza-tion and computational steering. IEEE Computational Science & Engi-neering, 3(4):13–17, Winter 1996.
[12] C. Cortes and V. Vapnik. Support-vector networks. Machine Learning,20(3):273–297, 1995.
[13] D. Engel, K. Greff, C. Garth, K. Bein, A. Wexler, B. Hamann, and H. Ha-gen. Visual steering and verification of mass spectrometry data factor-ization in air quality research. IEEE Transactions on Visualization andComputer Graphics, 18(12):2275–2284, Dec. 2012.
[14] H. Hagen, A. Ebert, R. H. van Lengen, and G. Scheuermann. Scien-tific visualization: methods and applications. In Proceedings of the 19thspring conference on Computer graphics (SCCG ’03), pages 23–33, NewYork, NY, USA, 2003. ACM.
[15] C. Johnson, S. G. Parker, C. Hansen, G. L. Kindlmann, and Y. Livnat.Interactive simulation and visualization. IEEE Computer, 32(12):59–65,Dec. 1999.
[16] J. P. C. Kleijnen. Design and Analysis of Simulation Experiments. Inter-national Series in Operations Research & Management Science. Springer,New York, 2007.
[17] Z. Konyha, K. Matkovic, D. Gracanin, M. Jelovic, and H. Hauser. Inter-active visual analysis of families of function graphs. IEEE Transactionson Visualization and Computer Graphics, 12(6):1373–1385, Nov./Dec.2006.
[18] K. Matkovic, M. Djuras, D. Gracanin, R. Splechtna, B. Stehno, andH. Hauser. Interactive visual analysis in the concept stage of a hybrid-vehicle design. In Proceedings of the EuroVA 2013 - EuroVis Workshopon Visual Analytics, 17–18 June 2013.
[19] K. Matkovic, D. Gracanin, M. Jelovic, A. Ammer, A. Lez, and H. Hauser.Interactive visual analysis of multiple simulation runs using the simu-lation model view: Understanding and tuning of an electronic unit in-jector. IEEE Transactions on Visualization and Computer Graphics,16(6):1449–1457, Nov.-Dec. 2010.
[20] K. Matkovic, D. Gracanin, M. Jelovic, and H. Hauser. Interactive vi-sual steering — rapid visual prototyping of a common rail injectionsystem. IEEE Transactions on Visualization and Computer Graphics,14(6):1699–1706, Nov.-Dec. 2008.
[21] K. Matkovic, D. Gracanin, M. Jelovic, and H. Hauser. Interactive vi-sual analysis supporting design, tuning, and optimization of diesel engineinjection. In VisWeek 2011: Discovery Exhibition, 23–28 Oct. 2011.
[22] K. Miettinen and M. M. Makela. Synchronous approach in interactivemultiobjective optimization. European Journal of Operational Research,
170(3):909–922, May 2006.[23] J. D. Mulder, J. J. van Wijk, and R. van Liere. A survey of computational
steering environments. Future Generation Computer Systems, 15(1):119–129, 1999.
[24] L. C. Onyiah. Design and Analysis of Experiments: Classical and Re-gression Approaches with SAS. Statistics: Textbooks and Monographs.CRC Press, Boca Raton, FL, 2009.
[25] S. G. Parker, C. J. Johnson, and D. Beazley. Computational steering:Software systems and strategies. IEEE Computational Science & Engi-neering, 4(4):50–59, Oct.-Dec. 1997.
[26] D. Pfluger, B. Peherstorfer, and H.-J. Bungartz. Spatially adaptive sparsegrids for high-dimensional data-driven problems. Journal of Complexity,26(5):508–522, Oct. 2010.
[27] H. Piringer, W. Berger, and J. Krasser. HyperMoVal: Interactive vi-sual validation of regression models for real-time simulation. ComputerGraphics Forum, 29(3):983–992, June 2010.
[28] H. Piringer, C. Tominski, P. Muigg, and W. Berger. A multi-threadingarchitecture to support interactive visual exploration. IEEE Transactionson Visualization and Computer Graphics, 15(6):1113–1120, Nov.–Dec.2009.
[29] H. Pirkul, R. Gupta, and E. Rolland. VisOpt: a visual interactiveoptimization tool for P-median problems. Decision Support Systems,26(3):209–223, Sept. 1999.
[30] F. Pukelsheim. Optimal Design of Experiments, volume 50 of Classics inApplied Mathematics. SIAM, Philadelphia, 2006.
[31] H. Samet. Foundations of Multidimensional and Metric Data Structures.Elsevier, Amsterdam, 2006.
[32] J. Seo, M. Bakay, Y.-W. Chen, S. Hilmer, B. Shneiderman, and E. P. Hoff-man. Interactively optimizing signal-to-noise ratios in expression profil-ing: project-specific algorithm selection and detection p-value weightingin Affymetrix microarrays. Bioinformatics, 20(16):2534–2544, 2004.
[33] A. J. Smola and B. Scholkopf. A tutorial on support vector regression.Statistics and Computing, 14(3):199–222, 2004.
[34] S. Tarkkanen, K. Miettinen, and J. Hakanen. Interactive poster: Inter-active multiobjective optimization — a new application area for visualanalytics. In Proceedings of the 2009 IEEE Symposium onVisual Analyt-ics Science and Technology (VAST 2009), pages 237–238, Oct. 2009.
[35] E. Thomsen. OLAP Solutions: Building Multidimensional InformationSystems. John Wiley & Sons, Inc., New York, 1997. CD-ROM included.
[36] M. E. Tipping. Sparse bayesian learning and the relevance vector ma-chine. Journal of Machine Learning Research, 1:211–244, June 2001.
[37] C. Turkay, A. Lundervold, A. Lundervold, and H. Hauser. Hypothe-sis generation by interactive visual exploration of heterogeneous medicaldata. In Human-Computer Interaction and Knowledge Discovery in Com-plex, Unstructured, Big Data, volume 7947 of Lecture Notes in ComputerScience, pages 1–12. Springer, 2013.
[38] C. Turkay, J. Parulek, and H. Hauser. Dual analysis of DNA microarrays.In Proceedings of the 12th International Conference on Knowledge Man-agement and Knowledge Technologies, pages 26:1–8, New York, 2012.ACM.
[39] L. Tweedie, B. Spence, D. Williams, and R. Bhogal. The attribute ex-plorer. In Conference Companion on Human Factors in Computing Sys-tems (CHI’94), pages 435–436, New York, 1994. ACM.
[40] W. C. M. van Beers and J. P. C. Kleijnen. Kriging interpolation in sim-ulation: a survey. In WSC ’04: Proceedings of the 36th conference onWinter simulation, pages 113–121. Winter Simulation Conference, 2004.
[41] J. Waser, R. Fuchs, H. Ribicic, B. Schindler, G. Bloschl, and M. E.Groller. World lines. IEEE Transactions on Visualization and ComputerGraphics, 16(6):1458–1467, Nov.–Dec. 2010.
[42] C. Zenger. Sparse grids. In W. Hackbush, editor, Parallel Algorithms forPartial Differential Equations, Proceedings of the Sixth GAMM-Seminar,Kiel, 1990, volume 31 of Notes on Numerical Fluid Mechanics, pages241–251. Vieweg-Verlag, 1991.