![Academic Year 2011-2012 [subject] [Dr. GIUSEPPE DE MARINIS] University of Macerata.](https://static.fdocuments.us/doc/165x107/56649dd45503460f94acc273/academic-year-2011-2012-subject-dr-giuseppe-de-marinis-university-of-macerata.jpg)
Academic Year 2011-2012 [subject] [Dr. GIUSEPPE DE MARINIS] University of Macerata.

Visual Analyticsand Information Retrieval
Giuseppe SantucciDipartimento di Informatica e Sistemistica
Sapienza Università di [email protected]

Who am I? (University of Rome is so big…)
• VisDis and the Database & User Interface groups are two tightly connected research groups at the Department of Computer and System Science (32 full professors, 19 associate ,and 13 assistant professors) of Rome Faculty of Engineering & ICT ?
• The VisDis and the Database/Interface group background is about:– Visual Information Access– Data quality– Data integration– User Centered Design– Usability and Accessibility– Infovis evaluation– Visual quality metrics– Visual Analytics
• Data sampling • Density map optimization
– Information Retrieval (&VA)
Fire 2012, Kolkata 19 December 2012 VA & IR - Giuseppe Santucci 2

Outline
• Information Visualization– Definitions– Main issues
• Data overloading– Visual Analytics– Visual Analytics challenges
• One methodological examples• VA and Information Retrieval• Demo
Fire 2012, Kolkata 19 December 2012 VA & IR - Giuseppe Santucci 3

Information Visualization?
• Old stuff…
Fire 2012, Kolkata 19 December 2012 VA & IR - Giuseppe Santucci 4

Visualization for Problem Solving
• Mystery: what is causing a cholera epidemic in London in 1854?
Fire 2012, Kolkata 19 December 2012 VA & IR - Giuseppe Santucci 5

Visualization for Problem Solving
Fire 2012, Kolkata 19 December 2012 VA & IR - Giuseppe Santucci 6
Illustration of Dr. John Snow (1854)
Dots indicate location of deaths
X indicate the locationof water pumps
[From Visual Explanations by Edward Tufte, Graphics Press, 1997]

Visualization for Problem Solving
7
Dr. Snow deducted that the cholera epidemic was caused by a contaminated water pump !!!Closing that pump quickly solved the problem
B.T.W., workers at the nearby brewery were noted to be relatively free of cholera…
The actual John Snow pub in London close to the water pump !!!

Visualization for Explaining
Fire 2012, Kolkata 19 December 2012 VA & IR - Giuseppe Santucci 8
What happened during the Napoleon’s Russian Campaign?

The Charles Joseph Minard’s map (1861)
Fire 2012, Kolkata 19 December 2012 VA & IR - Giuseppe Santucci 9

Visualization for Making decision
Fire 2012, Kolkata 19 December 2012 VA & IR - Giuseppe Santucci 10
Traveling in London by underground
How can I get Queens Park from Victoria station?

London Underground Map 1927
Fire 2012, Kolkata 19 December 2012 VA & IR - Giuseppe Santucci 11

The Harry Beck’s idea
• Real position (when traveling in underground) does not matter
• Only station sequences matter together with their connections
• Beck proposed a “distorted” map• Actually all the underground
maps in the world follow the Beck’s approach
• He got a little payment (London underground was not sure about the idea)
• Still true right now: infovis people do not become rich…
• Likely that holds for VA and IR as well L
Fire 2012, Kolkata 19 December 2012 VA & IR - Giuseppe Santucci 12

London Underground Map 1990s
Fire 2012, Kolkata 19 December 2012 VA & IR - Giuseppe Santucci 13

Moving to the present time
• What is modern Information Visualization ?
• First of all, what is Visualization ?
• Visualize: to form a mental model or mental image of something
• It is a cognitive activity and it has nothing to do with computers
Fire 2012, Kolkata 19 December 2012 VA & IR - Giuseppe Santucci 14

What is Information Visualization?
Information visualization is the use of computer-supported, interactive, visual representations
of abstract data to amplify cognition.
[Card et al. ‘99]
Fire 2012, Kolkata 19 December 2012 VA & IR - Giuseppe Santucci 15

Information visualization !
1. Infovis is perfect for exploration, when we don’t know exactly what to look at. It supports vague goals
2. Infovis is perfect to explain complex data and to support decisions
• Other approaches to data analysis– Statistics: strong verification but does not support exploration
and vague goals– Data mining: actionable and reliable but black box, not
interactive, question-response style– Visual Analytics (formerly Visual Data Mining) is trying to join
the two worlds

…computer supported and interactive
• Computer-supported– Yes we use computers, but we have to
always remember that a cognitive activityis involved in the process
• Interactive– To exploit the full power of Infovis techniques
interaction is mandatory.
Fire 2012, Kolkata 19 December 2012 VA & IR - Giuseppe Santucci 17
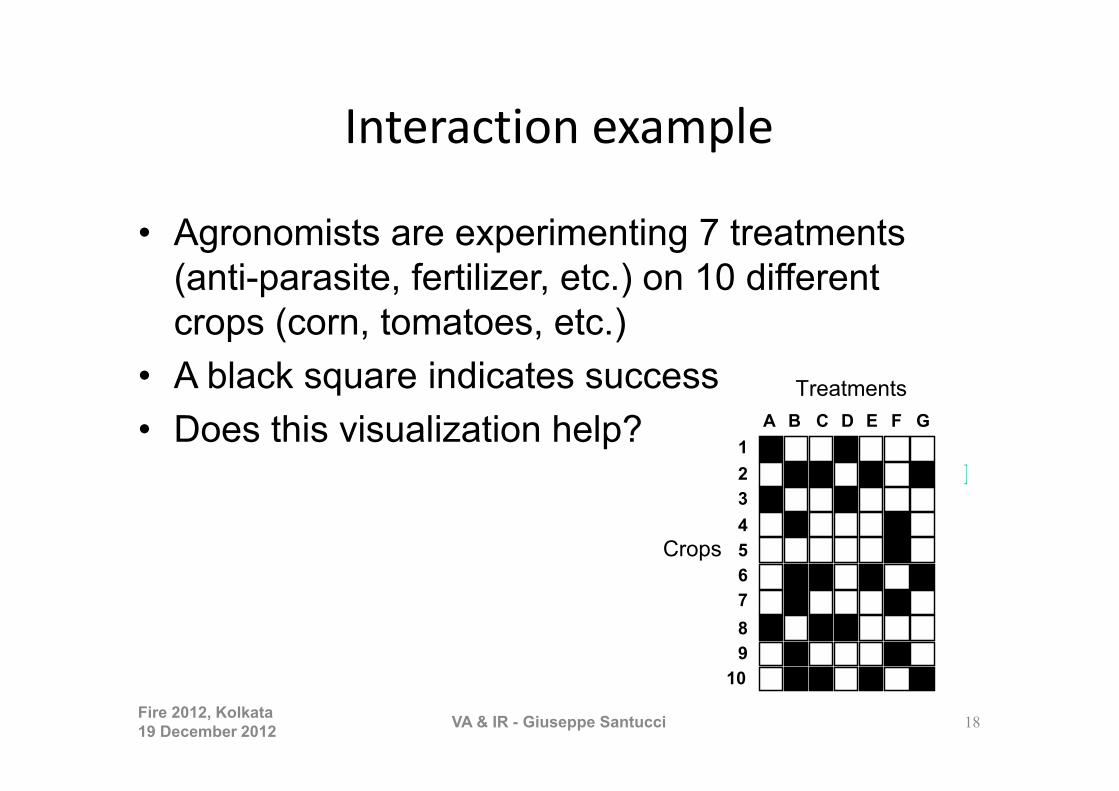
Interaction example
• Agronomists are experimenting 7 treatments (anti-parasite, fertilizer, etc.) on 10 different crops (corn, tomatoes, etc.)
• A black square indicates success• Does this visualization help?
Fire 2012, Kolkata 19 December 2012 VA & IR - Giuseppe Santucci 18
TreatmentsA B C D E F G
123456789
10
Crops
Rearrange

Interaction example• Let’s rearrange the rows
Fire 2012, Kolkata 19 December 2012 VA & IR - Giuseppe Santucci 19
TreatmentsA B C D E F G
123456789
10
Crops10
A D C E G B F13826
4795
Treatments
Crops
Rearrange
(10! L, VA can help…)

…it is about abstract data
• Abstract data– Information visualization deals with images that does not
refer to physical situation. In other words it is NOT scientific visualization/geographic visualization
• Scientific visualization primarily relates to and represents something physical or geometric
• Examples– Air flow over a wing– Weather over USA– Torrents inside a tornado– Organs in the human body– Molecular bonding…
Fire 2012, Kolkata 19 December 2012 VA & IR - Giuseppe Santucci 20

Scientific/geographic visualization
Fire 2012, Kolkata 19 December 2012 VA & IR - Giuseppe Santucci 21
Earthquake intensity

…abstract data
• Items that do not have a direct physical/visual correspondence• Examples: sport statistics, stock trends, query results, software data,
IR metrics, etc…• Items are represented on a 2D / 3D physical space using their
numerical characteristics (attributes)• The visualization is useful for analysis and decision-making (not just
for fun or colors)• E.g. : Postal parcels
– Shipping date– Volume– Weight– Sender country– Receiver country– …
Fire 2012, Kolkata 19 December 2012 VA & IR - Giuseppe Santucci 22

Abstract data
Fire 2012, Kolkata 19 December 2012 VA & IR - Giuseppe Santucci 23
A 2D Scatterplot showing about 200.000 postal parcels

Mixed visualization
Byte traffic into the ANS/NSFNET T3 backbone in 1993

Amplify cognition using the human vision
• Highest bandwidth human sense• Fast, parallel• Pattern recognition• Extends memory and cognitive capacity• People think visually (I see… means also I understand in
most languages)• Amplify cognition• Pre-attentive (we use only the eyes, not the brain)
• Two quick examples (4 seconds each)

Three simple questions

The quick answers

One (very) simple question
• How many 3s here ?• You have 4 seconds…
458757626808609928083982698028747976296262867897187743671947746588786758967329667287682085

So ?
• Time was not enough?
• You can do that in less than 0.2 seconds !
• Let’s try a different visualization…

• Color is pre-attentive (pops up)• No cognitive effort is required• A lot of issues are already clear• Most of people ignore them...• It is not enough to use wrist and
bells

Canonical steps in Infovis – STEP 1
Fire 2012, Kolkata 19 December 2012 VA & IR - Giuseppe Santucci 31
DATA InternalRepresentation
Encoding of valuesUnivariate dataBivariate dataTrivariate dataMultidimensional data
Encoding of relationshipsTemporal dataMap & DiagramsGraphs/TreesData streams
Sport
Literature
Mathematics
Physics
History
Geography
Art
Chemistry

Canonical steps in infovis – STEP 2
Fire 2012, Kolkata 19 December 2012 VA & IR - Giuseppe Santucci 32
InternalRepresentation
Space limitationsScrollingOverview + detailsDistortionSuppressionZoom & panSemantic zoom
Time limitationPerceptual issuesCognitive issues
Presentation

Problem solved!
Fire 2012, Kolkata 19 December 2012 VA & IR - Giuseppe Santucci 33
We have (∼) agreed and (∼) mature solutions forPresentationRepresentation
of a large variety of data
So I’m done!
Questions ?

Data size and complexity !
• 100 million FedEx transactions per day• 150 million VISA credit card transactions per day • 300 million long distance ATT calls per day• 50 billion e-mails per day• 600 billion IP packets per day• 1 trillion (1012) of web pages (according to
Google), corresponding to about 3 petabytes of data
• Google processes 20 petabytes of data per dayFire 2012, Kolkata 19 December 2012 VA & IR - Giuseppe Santucci

Size matters but complexity matters as well!
• Formal definition of the PROMISE experimental data (FIRE will use very similar pieces of information)
• Metadata– ~100 metrics per topic – It is not a BIG number but…
• Different level of analysis – per topic– per experiment– ...
• Different level of abstraction– Simple (!) metrics– Aggregate metrics– Statistics– Meta statistics (e.g., correlation, ANOVA, etc…)
Fire 2012, Kolkata 19 December 2012 VA & IR - Giuseppe Santucci 35

Rescuing information• In different situations people need to exploit and to use hidden
information resting in unexplored large and/or complex data sets• Several techniques exist devoted to this aim
– Automatic analysis techniques (e.g., data mining)– Manual analysis techniques (e.g., Information visualization)
• Large and complex datasets require a joint effort:
Fire 2012, Kolkata 19 December 2012 VA & IR - Giuseppe Santucci 36

Visual Analytics
Fire 2012, Kolkata 19 December 2012 VA & IR - Giuseppe Santucci 37

VA is highly interdisciplinary
Fire 2012, Kolkata 19 December 2012 VA & IR - Giuseppe Santucci 38
Scientific & Information
Visualisation
Data Management
Data Mining
Spatio-Temporal
Data
Human Perception+CognitionInfrastructure Infrastructure
Evaluation Evaluation
Each component presents challenging issues

Perception and cognition
• A critical element is the human being (☺)– Visual analysis tasks require the careful
design of apt human-computer interfaces– Challenges: need to integrate Psychology,
Sociology, Neurosciences, and Design issues
Fire 2012, Kolkata 19 December 2012 VA & IR - Giuseppe Santucci 39

Fire 2012, Kolkata 19 December 2012 VA & IR - Giuseppe Santucci 40
Let’s have fun: different kinds of blindness
In the movie, the girl with the white t-shirt is going to receive the ball several timesCount how many times she receives (disregarding knocking up on the floor)

Fire 2012, Kolkata 19 December 2012 VA & IR - Giuseppe Santucci 41
Ready ?

Fire 2012, Kolkata 19 December 2012 VA & IR - Giuseppe Santucci 42
So...
• 6 times ?• 7 times ?• 8 times ?• 9 times ?• 10 times ?

Fire 2012, Kolkata 19 December 2012 VA & IR - Giuseppe Santucci 43
Fine… and now another question…
• How many gorillas were in the video ?

Fire 2012, Kolkata 19 December 2012 VA & IR - Giuseppe Santucci 44
Let us to have a closer look
Same video…

Fire 2012, Kolkata 19 December 2012 VA & IR - Giuseppe Santucci 45
Inattentional blindness• Just one gorilla…
• It looks like a joke but reflects real problems that we have not to neglect
• Inattentional (and change) blindness must to be carefully considered when designing (critical) systems
• Animation, interaction, and alternative communication means (e.g., sounds) can mitigate the problem

A methodologicalexample

A Visual Analytics exampleDeriving new values from the dataset for ad-
hoc visualization• How to visually compare J. London and M. Twain
books ?• [D. A. Keim and D. Oelke. Literature Fingerprinting: A New Method for Visual
Literary Analysis. 2007 IEEE Symp. on Visual Analytics Science andTechnology (VAST '07) ]
1. Split the book in several text block (e.g., pages, paragraph, sentences)
2. Measure, for each text block, a relevant feature (e.g., average sentence length, word usage, etc. )
3. Associate the relevant feature to a visual attribute (e.g., color)
4. Visualize itFire 2012, Kolkata 19 December 2012 VA & IR - Giuseppe Santucci 47

J.London vs M.Twain average sentence lengths
Fire 2012, Kolkata 19 December 2012 VA & IR - Giuseppe Santucci 48

User interaction (a non uniform book?)
Fire 2012, Kolkata 19 December 2012 VA & IR - Giuseppe Santucci 49

Details of a book
Fire 2012, Kolkata 19 December 2012 VA & IR - Giuseppe Santucci 50

What about the Bible?
Fire 2012, Kolkata 19 December 2012 VA & IR - Giuseppe Santucci 51

The Vismaster CA European project
Fire 2012, Kolkata 19 December 2012 VA & IR - Giuseppe Santucci 52

The new (European) book on VA • Illuminating the path : The
Research and Development Agenda for Visual Analytics– 2005, focusing on USA
homeland security
• Managing the Information Age Solving Problems with Visual Analytics– One of the major outcome of
Vismaster– 2010, much broader focus
Fire 2012, Kolkata 19 December 2012 VA & IR - Giuseppe Santucci 53

Now, let’s move to IRA case study: the Promise Project
• Step 1: Data preprocessing
Fire 2012, Kolkata 19 December 2012 VA & IR - Giuseppe Santucci 54

1: Clear understanding of experimental data
Fire 2012, Kolkata 19 December 2012 VA & IR - Giuseppe Santucci 55
Enriching the data Define a data structure
Define formal transformations on the data

2: Visualization
Fire 2012, Kolkata 19 December 2012 VA & IR - Giuseppe Santucci 56

2a: Define a visual reference architecture
Fire 2012, Kolkata 19 December 2012 VA & IR - Giuseppe Santucci 57

2a: Define a set of visualizations
Fire 2012, Kolkata 19 December 2012 VA & IR - Giuseppe Santucci 58

3: Defining analytical models and their relationship with visualizations
Fire 2012, Kolkata 19 December 2012 VA & IR - Giuseppe Santucci 59

3: Automated analysis (machine learning, clustering, etc.) for ranking analysis
• Emanuele Di Buccio, Marco Dussin, Nicola Ferro, Ivano Masiero, Giuseppe Santucci and Giuseppe Tino - To Re-Rank or To Re-Query: Can Visual Analytics Solve This Dilemma? -Proc of the CLEF 2011 , Amsterdam.
• Marco Angelini, Nicola Ferro, Granato Guido, Giuseppe Santucci, Gianmaria Silvello -Information Retrieval Failure Analysis: Visual Analytics as a Support for Interactive ”What-If” Investigation - VAST 2012 , 2012

4: Knowledge(hum, waiting for the system being used
by real IR experts…)
Fire 2012, Kolkata 19 December 2012 VA & IR - Giuseppe Santucci 61

Demo
Fire 2012, Kolkata 19 December 2012 VA & IR - Giuseppe Santucci 62

Demo!
Fire 2012, Kolkata 19 December 2012 VA & IR - Giuseppe Santucci 63

Conclusions• Visual Analytics is a new (exciting) emerging
research field• Infovis and data mining are core components of
VA• It is highly interdisciplinary and require a
collaborative approach• It is more a methodology than a technique• To succeed it has to challenge several high-risk
issues• It is the only chance we have to dominate large
and complex datasets• Including IR evaluation dataFire 2012, Kolkata 19 December 2012 VA & IR - Giuseppe Santucci 64