Changzhou New District Experimental Middle School Zhang Lijun.
Visual Analysis of Complex Networks and
Community Structure
Bin Wu, Qi Ye, Yi Wang, Ran Bi, Lijun Suo, Deyong Hu, and Shengqi Yang
Beijing Key Laboratory of Intelligent Telecommunications Software and Multimedia,School of Computer Science, Beijing University of Posts and Telecommunications,
Beijing 100876, [email protected]
Abstract. Many real-world domains can be represented as complex net-works.A good visualization of a large and complex network is worth morethan millions of words. Visual depictions of networks, which exploit hu-man visual processing, are more prone to cognition of the structure ofsuch complex networks than the computational representation. We starby briefly introducing some key technologies of network visualization,such as graph drawing algorithm and community discovery methods.The typical tools for network visualization are also reviewed. A newlydeveloped software framework JSNVA for network visual analysis is in-troduced. Finally,the applications of JSNVA in bibliometric analysis andmobile call graph analysis are presented.
Keywords: Visual Analytics, Complex Network, Community Structure.
1 Introduction
An explosion of network research catalyses the emergence of network science,which not limited to physics, but captures biology, computer science, mathemat-ics and the social sciences [1]. In network science, more efforts have been devotedto empirical studies of large-scale networks while classical random graph models,such as the Erdos& Renyi (ER) model, belong to pure theoretical study. Alongwith research of complex network, software packages have also been developedto assist scientists to tackle the real complex network datasets from modeling,analyzing to visualizing. Visualization can help make the complex network dataeasier to read or understand. The visualization of networks is possible to greatlyimprove the sense making of analytical results but also for the communication ofresults within and across disciplinary boundaries but also to the general public.Hence visualizations have played an important role in generating new insightsin network science.
Visualization is often used as an additional or standalone data analysismethod. Network visualization is a technique to graphically represent sets ofnetwork data. Visualization techniques can be applied to communicate the re-sults of network measurement, modeling and validation or to visually compare
J. Zhou (Ed.): Complex 2009, Part II, LNICST 5, pp. 2171–2183, 2009.
c© ICST Institute for Computer Sciences, Social Informatics and Telecommunications Engineering 2009

2172 B. Wu et al.
the structure and dynamics of empirical and simulated networks [2]. Visualiza-tion has become an indispensable part of any network analysis toolkit. Withrespect to visualization, network analysis tools are used to change the layout,colors, size and other properties of the network representation. Large networkvisualization has recently received a lot of attention from researchers in both in-formation visualization and network science communities. Although some newlyavailable techniques are quite capable of visualizing large graphs of thousandsto hundred thousands of nodes and edges, visualization of large graphs, is stilla challenge problem due to the size and complexity of real networks and thediversity of the network science applications.
In this paper, we begin with a brief review of network visualization techniquesand representative software packages. Since scalability is a key issue for networkvisualization paradigms, we overview the methods of graph clustering for largedatasets, which can quickly discover the community structure embedded in alarge graph and divide the graph into densely connected sub-graphs. A newlydeveloped software framework JSNVA [3] for network visual analysis is also intro-duced. Finally, some applications of JSNVA ,such as investigating the structuralfeatures of scholarly networks and exploring temporal communications in mobilecall graphs are discussed.
2 Network Visualization Basics and Typical Tools
2.1 Network Visualization Basics
A good visualization system for very large network should be a combinationof three components including graph drawing, graph clustering and interaction.Network visualization techniques range from the layout of networks, to the vi-sualization of network dynamics and the tight coupling of data analysis andvisualization. The basics of visualization design include major matrix, tree, andgraph layout algorithms. The visualization of network dynamics shows the evo-lution of networks in terms of attribute changes or structural changes. The tightcoupling of data analysis and visualization has been more related to a new bodyof research: visual analytics [4], which is the science of analytical reasoning sup-ported by highly interactive visual interfaces.
2.2 Algorithms for Drawing Large Graphs
Visualizing large graphs presents unique problems which require non-orthodoxsolutions [7]. Drawing which displays the entire graph has the advantage ofshowing the global structure of the graphs. In the last decade several algorithmsthat generate string-line drawings of general large graphs have been invented.
Fruchterman and Reingold citefr propose a heuristic force-directed algorithmbased on the model of the Spring algorithm of Eades. This algorithm is widelyused in many tools and framework, such as JUNG, Prefuse, Pajek etc. The naivealgorithm is based on a model of pairwise repelling charged particles (nodes) and

Visual Analysis of Complex Networks and Community Structure 2173
attracting springs (edges). Their layout algorithm needs Θ(|V |2) time per itera-tion to calculate the repulsive forces between all pairs of nodes. In order to speedup this algorithm, they present a variation that called the grid-variant algorithmbased on the technique in n-body simulations to approximate the distant bod-ies as a single pole. If the number of iterations is assumed to be constant, thebest-case running time of grid-variant algorithm is Θ(|V |+ |E|). The worst-caserunning time, however, remains Θ(|V |2 + |E|) [5,12]. Frich et al. [6] present arandomized adaptive layout algorithm call GEM for nicely drawing undirectedgraphs that is based on the Spring algorithm and contains several new heuristicsto improve the convergence, including local temperatures, gravitational forcesand the detection of rotations and oscillations.
Faced with the problem of drawing a large graph, it is natural to associate witha hierarchy of graphs and produce a drawing starting with the smallest graphin the hierarchy, and drawing larger and larger graphs using previous drawing.Harel and Koren [9] use an O(k|V |) algorithm that finds a 2-approximative solu-tion of the k-center problem. They divide the graph into a sequence of subgraphswhich is determined by the approximative solution of the k-center problem. Theyuse a variation of the algorithm of Kamada and Kawai [10] as force-directed al-gorithm to draw each level. The asymptotic running time of their algorithm isΘ(|V ||E|) and Θ(|V |2) memory is needed to store the distances between all pairsof nodes [12]. Gajer et al. [7,8] propose a hierarchical force-directed layout al-gorithm called GRIP for drawing large graphs. The algorithm are composed oftwo phrases. A coarsening phase in which a sequence of coarse graphs with de-creasing sizes is computed and a refinement phase in which successively drawingof finer graphs are computed, using the drawings of the next coarser graphs anda variant of suitable force directed algorithm. However, the GRIP algorithm isused for drawing the networks which contains only one component and it is hardto use it to get the overview of real-world networks directly.
Koren et al. [11] present a fast graph drawing algorithm ACE for drawinglarge graphs. ACE finds an optimal drawing by minimizing a quadratic energyfunction. The minimization problem is expressed as a generalized eigenvalueproblem, which is solved rapidly using a novel algebraic multigrid techniqueinstead of calculating the eigenvectors directly. The ACE algorithm is muchfaster than the force-directed algorithms for nearly all kind graphs. However,the authors do not give an upper bound on the asymptotic running time of ACEin the number of nodes and edges [12].
The ability to find and analyze such communities can provide invaluable helpin understanding and visualizing the structure of networks [22]. The communitydetecting algorithms will great influence the results of network visualization,however, there are lots of metrics on community detecting has been proposed.Newman and Girvan [22] use the famous GN algorithm to discover natural di-visions of co-authorship network. They get an overview of the relationships be-tween different communities by applying the shortest-path betweenness versionof the GN community structure algorithm. Palla et al. [18] use the k-clique-community detecting algorithm to get the overview of the protein-protein inter-action network.

2174 B. Wu et al.
2.3 Network Visualization Typical Tools
There are various network visualization tools developed in resent years. Thesetools can be broadly divided into two categories: special-purpose tools or general-purpose tools. Those special-purpose tools are domain-specific. Social networkanalysis and biology are always the most popular domains. The typical tools in-clude: NetDraw in UCINET [27], NetMiner, igraph, Cytoscape etc. Those generalpurpose tools can visualize arbitrary network data that can be expressed as aset of nodes, links, or paths. The typical software packages include: Pajek [26],JUNG [28], Prefuse [13], Graphviz, GUESS in Network Workbench etc.
NetMiner is an innovative software tool for Exploratory Analysis and Visu-alization of Network Data [29]. NetMiner allows user to explore social networkdata visually and interactively, and helps user to detect underlying patterns andstructures of the network.It is a comprehensive package for the analysis of socialnetwork data, which can handle tens of thousands of nodes. Social network anal-ysis methods include centrality measures, subgroup identification, role analysis,elementary graph theory, and permutation-based statistical analysis.
Cytoscape is an open-source, cross-platform network visualization and analy-sis application [19]. Cytoscape has it’s roots in Systems Biology and is thereforewell suited for analyzing data from high-throughput experimentation as well asother molecular state information. The central organizing metaphor of Cytoscapeis a network (graph), with genes, proteins, and molecules represented as nodesand interactions represented as edges between nodes. The core functionality in-cludes the visualization, layout, and manipulation of networks in addition to datahandling services needed for importing, exporting, and managing network data.
Network Workbench [25] is a Large-Scale Network Analysis, Modeling andVisualization Toolkit for Biomedical, Social Science and Physics Research. Thisproject will design, evaluate, and operate a unique distributed, shared resourcesenvironment for large-scale network analysis, modeling, and visualization, namedNetwork Workbench (NWB). NWB integrates the excellent GUESS visualizationtool to interactively explore and understand specific networks, as well as theirinteraction with other types of networks.
3 JSNVA: A Framework for Network Visual Analysis
To gain insight into today’s large data resources, data mining extracts interestingpatterns. To generate knowledge from patterns and benefit from human cognitiveabilities, meaningful visualization of patterns are crucial [14]. Although informa-tion visualization technologies are indispensable in complex data analysis, wide-spread tools still need to be developed, as successful information visualizationapplications often require domain-specific customization.
In order to explore the link relations in real-world networks explicitly, wepropose JSNVA (Java Straight-line Drawing Network Visual Analysis frame-work) [3], a lightweight framework for network visual analysis. The goal ofJSNVA is to give simple and elegant solutions to analyze real-world networksvividly and intuitively, so we both focus on drawing graphs and analysis. To

Visual Analysis of Complex Networks and Community Structure 2175
evaluate its function, we apply JSNVA to analyze real-world networks in differ-ent large scale data sets and we can get their underlying structure intuitivelyand quickly.
3.1 Architecture
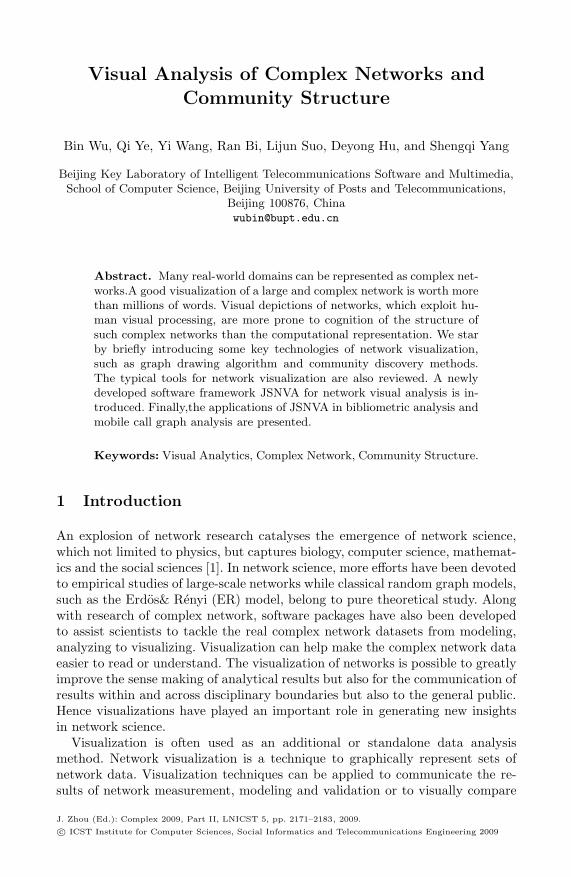
A framework is a set of cooperating classes that make up a reusable designfor a specific class of software [15]. JSNVA is written in Java programminglanguage using Java2D graphics, and it provides a clear framework for graphbased visual analysis. JSNVA draws from pioneering work on drawing graphs andexisting system like JUNG, prefuse. To make JSNVA more flexible, reusable andunderstandable, we apply some design patterns in it and divide the frameworkinto different modules based on their functions. JSNVA is mainly composed ofthe following core modules: Graph module, Layout module, Algorithm moduleand Paint module.
Fig. 1. The architecture of JSNVA
Graph Module. The Graph module implements the underlying data structure ofthe graph to be drawn or analyzed. The graph data structure can store attributesby different attribute keys. JSNVA provides both a directed graph interface andan undirected graph interface for abstract graphs. These graph interfaces enableus to handle general graph structures, so that we are not restricted to specialgraph structures such as general tree or rooted tree structures. In the same time,we can use the graph structures to analyze real-world network efficiently as ageneral graph library independent of other modules.

2176 B. Wu et al.
Layout Module. The Layout module is the core module of JSNVA which de-termines the positions of vertices under geometric constraints. In this module,developer can implement different layout algorithms strictly and don’t need toconnect them together, for which can be done in the Engine module. Layoutmodule supplies different drawings algorithms to map the vertices’ positions ofabstract graph to the panel and store the positions of vertices in the graphstructure. JSNVA implements many general layout algorithms, including forceddirected layout [5,10], radical layout [16] etc.
Algorithm Module. The Algorithm module focuses on implementing the algo-rithms from graph theory. This module only use the basic graph structure in theGraph module, and it is still under development. We have implemented somebasic algorithms on graph theory, such as Dijkstra algorithm, Kruskal algorithmand Prim algorithm etc. In order to get deep understanding of the different large-scale networks, we divide two sub-modules in the algorithm module, which arecentrality sub-module and community sub-module. We have also implementedsome community detecting algorithms, such as maximal clique detecting algo-rithm, GN algorithm [17], K-clique-community detecting algorithm [18] in thecommunity sub-module. We also implement some well known centrality algo-rithms in the centrality sub-module such as degree centrality, betweenness cen-trality, closeness centrality etc.
Paint Module. The Paint module is the top one of the framework, and it useother modules to draw a network on a panel. In the Paint module there is asubmodule called Controler module which enable JSNVA to handle interactiveevents, such as mouse event, saving images event etc. The GraphCanvas sub-classes Swing’s JPanel and it can be used in any Java Swing application. TheLayoutEngine use a Scheduler pattern to provide dynamic visualization [24]which updates visual properties and redraws the network at regular time in-tervals. Following the Template Method pattern [15], the LayoutEngine definesthe skeleton of drawing algorithm by using the layout algorithms provided bythe Layout Module to display a network on the GraphCanvas. At each step ofdisplaying the graph, the Scheduler in the LayoutEngine will call the layoutmethod in the Layout interface to redraw the network on the GraphCanvasdynamically.
The vertices and edges are drawn by Renderer submodule. This submoduleseparate visual components from their rendering methods, allowing dynamicdetermination of visual appearances [24]. Changing the appearance of verticesand edges just requires overriding the paint methods in the submodule. Theelements in network can be drawn as different styles, for example, for example,we can change the sizes, shapes, colors of vertices and we can also change thecolors, thickness of edges. In the Render submodule there is a submodule calledassignment module which is used to set visual attributes in the graph structure,such as sizes, colors, labels, fonts etc. for rendering the elements.

Visual Analysis of Complex Networks and Community Structure 2177
4 Applications
4.1 Co-authorship Network
Here we build a co-authorship network to investigate kinship patterns, commu-nity structure in it. We get the published papers written by the students andfaculty at Beijing University of Posts and Telecommunications from 1998 to2004, which are indexed by SCI, EI and ISTP. There are about 1990 papers inthe data set. We extract authors’ names from the files and put the first name be-fore the surname manually and connect all the authors in each paper together.In the co-authorship network, the size of the giant component is 1453, filling87.4% of the total volume. In the following parts of this paper, we only focus oncharacters of the giant component.
Community Detecting. Detecting the relations among communities is alsocrucial to the understanding of structural and functional properties of networks,and it is a useful way to handle information overload to get an overview ofthe network. There are two kinds of famous community detecting algorithms tofind the clusters in network. One method is to divide the network into differentseparated sets of communities, and the other method is trying to detect sets ofoverlapping communities.
Separated Communities. Here we set the collaboration times between authorsas the weights of edges, then use the algorithm provided by Newman [23] inthe Algorithm module to detecting community structures in the weighted giantcomponent, which is implemented in the Algorithm module. Through the algo-rithm, we get 34 communities in the component and all of them are in differentcolors. The thickness of edges in Fig. 2 indicates the collaboration times betweenauthors and the size of vertices shows the productivity of authors. We choose thelargest community which is to show the detailed view. Fig. 2 shows the largestcommunity in the giant component. To avoid the graph image confused by au-thors’ names, we label some famous authors in the community. We find some ofthe authors labeled are professors in the school of Telecommunication Engineer-ing, while others are in the school of Science. PeiDa Ye is an academician fromChinese Academy of Sciences and JinTong Lin used to be a student of professorPeiDa Ye. Both of them are in the Optical Communication Center in the school.BoJun Yang and XiaoGuang Zhang et al. are professors in the school of Science.Although the authors are from different schools, they are in the same researchfield of Optical Communication.
Overlapping Communities. To uncover the stable communities, we will filter theunstable links in it and link these communities together to show their researchfields. We use the k-clique-community detecting algorithm [18] in the Algorithmmodule to connect these highly overlapping cliques in this network. At last, wefind 29 4-clique-communities in the stable network. We find out the most com-mon used school name in each community to describe it. As shown in Fig. 3,

2178 B. Wu et al.
Fig. 2. The largest community in the giant component
the green vertices represent authors from the school of Telecommunication En-gineering; the yellow ones are from the school of Science ; the dark blue onesare from the school of Computer Science; the purple ones are from the school ofElectrical Engineering; the pink ones are from the school of Information Engi-neering; the red ones are the people belong to different communities. Throughthis figure, we find most of communities are from the school of Telecommunica-tion Engineering which indicates the main research interest of the university isrelated to telecommunication. We can also find that the authors from the schoolof Science are closely connected with the authors from the school of Telecommu-nication Engineering because they are all have a main common research interestin Optical Communication.
4.2 VAST2008 Challenge
We explored the temporal communication patterns of Catalano/Vidro socialnetwork which is reflected in the mobile call data in the mobile call mini challengeof VAST 2008 contest [20]. Our team got the Cell Phone Mini Challenge Awardon social network accuracy. In this challenge, we focus on detecting the hierarchyof the social network and try to get the important actors in it. We present ourtools and methods in this summary. By using the visual analytic approaches, wecan find out not only the temporal communication patterns in the social networkbut also the hierarchy of it.
Data Set. The mobile call records cover a ten-day period in June 2006, andare narrowed to about 400 unique mobile phones during this period. The dataset includes records with the following fields: identifier for caller, identifier forreceiver, time, duration and call origination cell tower. The challenge includes

Visual Analysis of Complex Networks and Community Structure 2179
Fig. 3. An overview of the research fields of these communities at the university
questions about the social structure of the call network. Furthermore, we needto answer and characterize the changes to the social network over the ten days.
Temporal Relationship. In order to detect the communication patterns, weconstruct call graphs based on the call records. According to the mobile phonecall records from June 1st 2006 to June 10th 2006, we find that the social networkstructure changed greatly on June 8th 2006. In the first 7 days, the leader ofthe social network was 200. We use the PageRank value of each individual inthe directed call graph formed in these 10 days to show the importance of theindividual [21]. The sizes of vertices indicate the importance of vertices. We findan interesting pattern that all the neighbors of 200 vanished in the call graphformed on June 8th 2006 and there were some actors with large degrees replacedtheir positions.
Equivalent Actors. The problem of detecting similar vertices in a network isnot a new one. There are a lot of measures to show the similarity between dataobjects, such as simple matching coefficient, Jaccard coefficient, cosine similar-ity, Pearson’s correlation coefficient etc. In order to get the similarity betweentwo vertices in the call graph formed in these 10 days, we choose the Jaccardcoefficient to measure how many common neighbors they share. Let N(i) be theneighborhood of vertex i in a network and |x| be the size of set x. Then theJaccard coefficient of an actor pair (i, j), which is symbolized by J(i, j), is givenby the following equation:
J(i, j) = J(j, i) =|N(i) ∩ N(j)||N(i) ∪ N(j)|
2180 B. Wu et al.
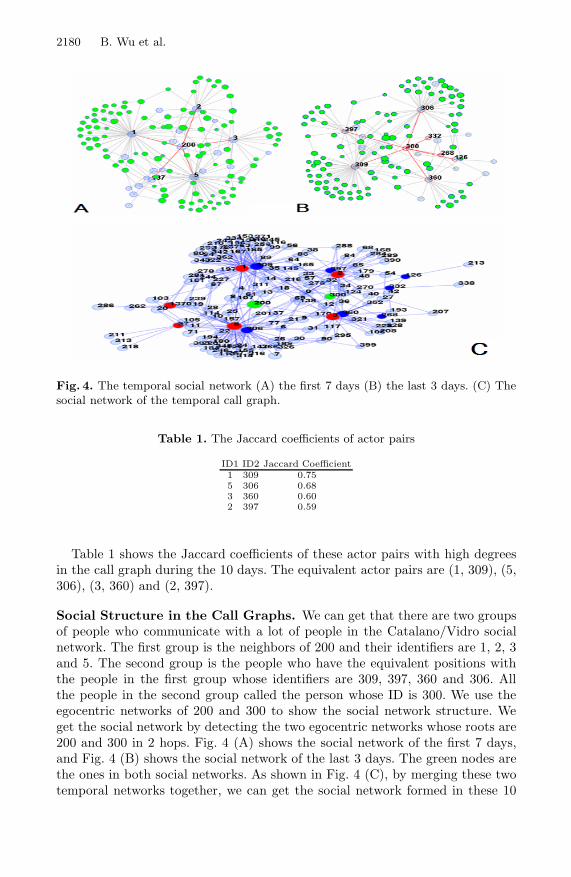
Fig. 4. The temporal social network (A) the first 7 days (B) the last 3 days. (C) Thesocial network of the temporal call graph.
Table 1. The Jaccard coefficients of actor pairs
ID1 ID2 Jaccard Coefficient1 309 0.755 306 0.683 360 0.602 397 0.59
Table 1 shows the Jaccard coefficients of these actor pairs with high degreesin the call graph during the 10 days. The equivalent actor pairs are (1, 309), (5,306), (3, 360) and (2, 397).
Social Structure in the Call Graphs. We can get that there are two groupsof people who communicate with a lot of people in the Catalano/Vidro socialnetwork. The first group is the neighbors of 200 and their identifiers are 1, 2, 3and 5. The second group is the people who have the equivalent positions withthe people in the first group whose identifiers are 309, 397, 360 and 306. Allthe people in the second group called the person whose ID is 300. We use theegocentric networks of 200 and 300 to show the social network structure. Weget the social network by detecting the two egocentric networks whose roots are200 and 300 in 2 hops. Fig. 4 (A) shows the social network of the first 7 days,and Fig. 4 (B) shows the social network of the last 3 days. The green nodes arethe ones in both social networks. As shown in Fig. 4 (C), by merging these twotemporal networks together, we can get the social network formed in these 10

Visual Analysis of Complex Networks and Community Structure 2181
days. In Fig. 4 (C), the green nodes are the core actors in the social networkand the blue and red ones are their neighbors, respectively. We suspect that thenetwork may reflect a social structure crackdown, and the positions of the 200,1, 2, 3 and 5 may be replaced by 300, 309, 397, 360 and 306.
5 Conclusion
In this paper, network visualization technologies,such as layout algorithms fordrawing large graphs and community detecting algorithms for graph clustering,are reviewed. Some typical network visualization tools are also introduced.Alightweight framework for network visual analysis JSNVA: Java Straight-lineDrawing Network Visual Analysis framework is presented.
We present two applications to show its flexibility and performance. In thefirst application, we try to analyze the statistical and clustering features of aco-authorship network. By using focus+ detail views, we show an overview ofthe relations between different communities and the detailed relations betweenauthors in the largest community. After finding the clustering and labeling theinstitute names in different stable communities, we can get an overview of thedifferent research fields of the university and their relations. In the second ap-plication,we analyze the social network structure of an organism, based on themobile call records of the mini challenge in VAST 2008. By visualizing the callingbehaviors of the actors in the social network, we find the structure of the socialnetwork changes during a period observed. A reduced social network structureis constructed by exploring these communication patterns through JSNVA.
Acknowledgements. This work is supported by the National Natural ScienceFoundation of China under Grant No. 60402011, and the National Science andTechnology Support Program of China under Grant No.2006BAH03B05. It isalso is supported by IBM China Research Laboratory, the Specialized ResearchFund for the Joint laboratory between Beijing University of Posts and Com-munications and IBM China Research Laboratory (Project No.JTP20071002-4,JTP200806014-3).
References
1. Barabasi, A.-L.: Taming complexity. J. Nature Physics. 1, 68–70 (2005)2. Borner, K., Sanyal, S., Vespignani, A.: Network Science. In: Cronin, B. (ed.) An-
nual Review of Information Science & Technology, vol. 41, ch. 12, pp. 537–607.Information Today, Inc., American Society for Information Science and Technol-ogy, Medford (2007)
3. Ye, Q., Wu, B., Wang, B.: JSNVA: a Java Straight-line Drawing Framework forNetwork Visual Analysis. In: 4th International Conference on Advanced Data Min-ing and Application, pp. 667–674 (2008)
4. Thomas, J.J., Cook, K.A.: A Visual Analytics Agenda. IEEE Computer Graphicsand Applications 26(1), 10–13 (2006)

2182 B. Wu et al.
5. Fruchterman, T., Reingold, E.: Graph drawing by force-directed placement. J. Soft-ware Practice and Experience 21, 1129–1164 (1991)
6. Frick, A., Ludwig, A., Mehldau, H.: A fast adaptive layout algorithm for undirectedgraphs. In: International Symposium on Graph Drawing, pp. 388–403. Springer,Heidelberg (1994)
7. Gajer, P., Goodrich, M.T., Kobourov, S.G.: A multi-dimensional approach to force-directed layouts of large graphs. In: Marks, J. (ed.) GD 2000. LNCS, vol. 1984, pp.211–221. Springer, Heidelberg (2001)
8. Gajer, P., Kobourov, S.G.: GRIP: Graph Drawing with Intelligent Placement. J.Graph Algorithms and Applications 6(3), 203–224 (2002)
9. Harel, D., Koren, Y.: A fast multi-scale method for drawing large graphs. In: Marks,J. (ed.) GD 2000. LNCS, vol. 1984, pp. 183–196. Springer, Heidelberg (2001)
10. Kamada, T., Kawai, S.: An algorithm for drawing general undirected graphs. J.Information Processing Letters 31(5), 7–15 (1989)
11. Koren, Y., Carmel, L., Harel, D.: ACE: AFast Multiscale Eigenvector Computationfor Drawing Huge Graphs. J. Multiscale Modeling and Simulation 1(4), 645–673(2003)
12. Hachul, S., Junger, M.: An experimental comparison of fast algorithms for drawinggeneral large graphs. In: Healy, P., Nikolov, N.S. (eds.) GD 2005. LNCS, vol. 3843,pp. 235–250. Springer, Heidelberg (2006)
13. Heer, J., Card, S.K., Landay, J.A.: Prefuse: a toolkit for interactive information vi-sualization. In: ACM SIGCHI conference on Human factors in computing systems,pp. 421–430. ACM Press, New York (2005)
14. Assent, I., Krieger, R., Muler, E., Seidl, T.: VISA: Visual Subspace ClusteringAnalysis. J. ACM SIGKDD Explorations Special Issue on Visual Analytics 9(2),5–12 (2007)
15. Gamma, E., Helm, R., Johnson, R., Vlissides, J.: Design Patterns: Elements ofResuable Object-Oriented Sofrware. Addison-Wesley, Reading (1995)
16. Yee, K.P., Fisher, D., Dhamija, R., Hearst, M.: Animated Exploration of DynamicGraphs with Radial Layout. In: IEEE International Conference on InformationVisualization, pp. 43–50 (2001)
17. Girvan, M., Newman, M.E.J.: Community structure in social and biological net-works. J. PNAS 12, 7821–7826 (2002)
18. Palla, G., Derenyi, I., Farkas, I., Vicsek, T.: Uncovering the overlapping communitystructure of complex networks in nature and society. J. Nature 435, 814–817 (2005)
19. Cline, M.S., et al.: Integration of biological networks and gene expression datausing Cytoscape. Nature Protocols 2, 2366–2382 (2007)
20. Ye, Q., Zhu, T., Hu, D., Wu, B., Du, N., Wang, B.: Cell Phone Mini ChallengeAward: Social Network Accuracy— Exploring Temporal Communication in MobileCall Graphs. In: IEEE International Symposium on Visual Analytics Science andTechnology, pp. 207–208 (2008)
21. Brin, S., Page, L.: The Anatomy of large-scale Hypertextual Web Search Engine.J. Computer Networks and ISDN Systems 30, 107–117 (1998)
22. Newman, M.E.J., Girvan, M.: Finding and evaluating community structure in net-works. Phys. Rev. E 69, 026113 (2004)
23. Newman, M.E.J.: Analysis of weighted networks. Physical Review E, 056131 (July20, 2004), arXiv:cond-mat/0407503 v1
24. Jeffrey Heer, J., Agrawala, M.: Software Design Patterns for Information Visualiza-tion. IEEE Transactions on Visualization and Computer Graphics 12(5), 853–860(2006)

Visual Analysis of Complex Networks and Community Structure 2183
25. Network Workbench, http://nwb.slis.indiana.edu/26. Pajek, http://vlado.fmf.uni-lj.si/27. NetDraw, http://www.analytictech.com28. JUNG, http://jung.sourceforge.net29. netminer, http://www.netminer.com