
VISMASHUP: Streamlining the Creation of Custom ...juliana/pub/mashup-vis2009.pdf · VISMASHUP:...
8
V IS MASHUP: Streamlining the Creation of Custom Visualization Applications Emanuele Santos, Lauro Lins, James P. Ahrens, Juliana Freire, and Cl´ audio T. Silva, Senior Member, IEEE Fig. 1: Creating an Astrophysics VisMashup to explore a binary star system. Abstract—Visualization is essential for understanding the increasing volumes of digital data. However, the process required to create insightful visualizations is involved and time consuming. Although several visualization tools are available, including tools with sophisticated visual interfaces, they are out of reach for users who have little or no knowledge of visualization techniques and/or who do not have programming expertise. In this paper, we propose VISMASHUP, a new framework for streamlining the creation of customized visualization applications. Because these applications can be customized for very specific tasks, they can hide much of the complexity in a visualization specification and make it easier for users to explore visualizations by manipulating a small set of parameters. We describe the framework and how it supports the various tasks a designer needs to carry out to develop an application, from mining and exploring a set of visualization specifications (pipelines), to the creation of simplified views of the pipelines, and the automatic generation of the application and its interface. We also describe the implementation of the system and demonstrate its use in two real application scenarios. Index Terms—Scientific Visualization, Dataflow, Visualization Systems ✦ 1 I NTRODUCTION Data exploration through visualization is an effective means to un- derstand and obtain insights from large collections of data. Not sur- prisingly, visualization has become a mature area with an established research agenda [21], and several systems have been developed that support the creation of complex visualizations [6,12,14,20,22,32,35]. But even using systems that have sophisticated visual programming interfaces, such as AVS, DX, SCIRun, and VisTrails, the path from the raw data to insightful visualizations is laborious and error-prone. And this has hampered a wider adoption of visualization techniques. Visual programming interfaces expose computational components as modules and allow the creation of complex visualization pipelines which combine these modules in a dataflow, where connections be- tween modules express the flow of data through the pipeline [16]. They also provide built-in constraint checking mechanisms (e.g., that disallow a connection between incompatible module ports) that sim- plify the creation of pipelines. Recently, new techniques have been • Emanuele Santos, Lauro Lins, Juliana Freire, and Cl´ audio T. Silva are with the Scientific Computing and Imaging (SCI) Institute at the University of Utah. email: {emanuele, lauro, juliana, csilva}@sci.utah.edu. • James P. Ahrens is with Los Alamos National Lab in Los Alamos, NM. email: [email protected]. Manuscript received 31 March 2009; accepted 27 July 2009; posted online 11 October 2009; mailed on 5 October 2009. For information on obtaining reprints of this article, please send email to: [email protected] . proposed to simplify the creation and refinement of these pipelines, including recommendation systems [15, 27] and a mechanism to refine pipelines by analogy [24]. Notwithstanding, without detailed knowl- edge of the underlying computational components, it is difficult to un- derstand what series of modules and connections ought to be added to obtain a desired result. Consequently, the generation of visualiza- tions is a task that is best carried out by experts who are familiar with visualization techniques and tools. Recognizing this problem, there have been a number of efforts to create simpler visualization applications (e.g., [8, 28, 32]) that are cus- tomized to a particular task (e.g., [5, 13, 18]) and that use concepts that are more meaningful to domain experts than visualization primitives. Some systems [8, 18, 28, 32] provide customized interfaces that allow users to control the parameters of a pipeline. These simplified inter- faces are easier to use than the general systems and can be designed specifically for domain experts that do not have expertise in visual- ization. Nonetheless, they are expensive to create and maintain. The lifecycle for developing custom applications is often long, requiring several iterations until the application does what the end-user needs. Whereas such solutions can be (and have been) successfully applied in big scientific projects, they are out of reach for smaller-scale ef- forts. The costs involved in creating these applications make them unsuitable for one-of-a-kind, exploratory visualizations. Our Approach. In this paper we propose VISMASHUP, a new ap- proach for simplifying the creation, maintenance, and use of cus- tomized visualization applications (or mashups). Because VIS- MASHUP uses dataflows as the underlying model, in principle, it can be combined with visualization systems that use dataflows to
Transcript of VISMASHUP: Streamlining the Creation of Custom ...juliana/pub/mashup-vis2009.pdf · VISMASHUP:...

VISMASHUP: Streamlining the Creation ofCustom Visualization Applications
Emanuele Santos, Lauro Lins, James P. Ahrens, Juliana Freire, and Claudio T. Silva, Senior Member, IEEE
Fig. 1: Creating an Astrophysics VisMashup to explore a binary star system.
Abstract—Visualization is essential for understanding the increasing volumes of digital data. However, the process required tocreate insightful visualizations is involved and time consuming. Although several visualization tools are available, including tools withsophisticated visual interfaces, they are out of reach for users who have little or no knowledge of visualization techniques and/orwho do not have programming expertise. In this paper, we propose VISMASHUP, a new framework for streamlining the creation ofcustomized visualization applications. Because these applications can be customized for very specific tasks, they can hide muchof the complexity in a visualization specification and make it easier for users to explore visualizations by manipulating a small set ofparameters. We describe the framework and how it supports the various tasks a designer needs to carry out to develop an application,from mining and exploring a set of visualization specifications (pipelines), to the creation of simplified views of the pipelines, and theautomatic generation of the application and its interface. We also describe the implementation of the system and demonstrate its usein two real application scenarios.
Index Terms—Scientific Visualization, Dataflow, Visualization Systems
F
1 INTRODUCTION
Data exploration through visualization is an effective means to un-derstand and obtain insights from large collections of data. Not sur-prisingly, visualization has become a mature area with an establishedresearch agenda [21], and several systems have been developed thatsupport the creation of complex visualizations [6,12,14,20,22,32,35].But even using systems that have sophisticated visual programminginterfaces, such as AVS, DX, SCIRun, and VisTrails, the path fromthe raw data to insightful visualizations is laborious and error-prone.And this has hampered a wider adoption of visualization techniques.
Visual programming interfaces expose computational componentsas modules and allow the creation of complex visualization pipelineswhich combine these modules in a dataflow, where connections be-tween modules express the flow of data through the pipeline [16].They also provide built-in constraint checking mechanisms (e.g., thatdisallow a connection between incompatible module ports) that sim-plify the creation of pipelines. Recently, new techniques have been
• Emanuele Santos, Lauro Lins, Juliana Freire, and Claudio T. Silva arewith the Scientific Computing and Imaging (SCI) Institute at the Universityof Utah. email: emanuele, lauro, juliana, [email protected].
• James P. Ahrens is with Los Alamos National Lab in Los Alamos, NM.email: [email protected].
Manuscript received 31 March 2009; accepted 27 July 2009; posted online11 October 2009; mailed on 5 October 2009.For information on obtaining reprints of this article, please sendemail to: [email protected] .
proposed to simplify the creation and refinement of these pipelines,including recommendation systems [15,27] and a mechanism to refinepipelines by analogy [24]. Notwithstanding, without detailed knowl-edge of the underlying computational components, it is difficult to un-derstand what series of modules and connections ought to be addedto obtain a desired result. Consequently, the generation of visualiza-tions is a task that is best carried out by experts who are familiar withvisualization techniques and tools.
Recognizing this problem, there have been a number of efforts tocreate simpler visualization applications (e.g., [8,28,32]) that are cus-tomized to a particular task (e.g., [5,13,18]) and that use concepts thatare more meaningful to domain experts than visualization primitives.Some systems [8, 18, 28, 32] provide customized interfaces that allowusers to control the parameters of a pipeline. These simplified inter-faces are easier to use than the general systems and can be designedspecifically for domain experts that do not have expertise in visual-ization. Nonetheless, they are expensive to create and maintain. Thelifecycle for developing custom applications is often long, requiringseveral iterations until the application does what the end-user needs.Whereas such solutions can be (and have been) successfully appliedin big scientific projects, they are out of reach for smaller-scale ef-forts. The costs involved in creating these applications make themunsuitable for one-of-a-kind, exploratory visualizations.Our Approach. In this paper we propose VISMASHUP, a new ap-proach for simplifying the creation, maintenance, and use of cus-tomized visualization applications (or mashups). Because VIS-MASHUP uses dataflows as the underlying model, in principle, itcan be combined with visualization systems that use dataflows to
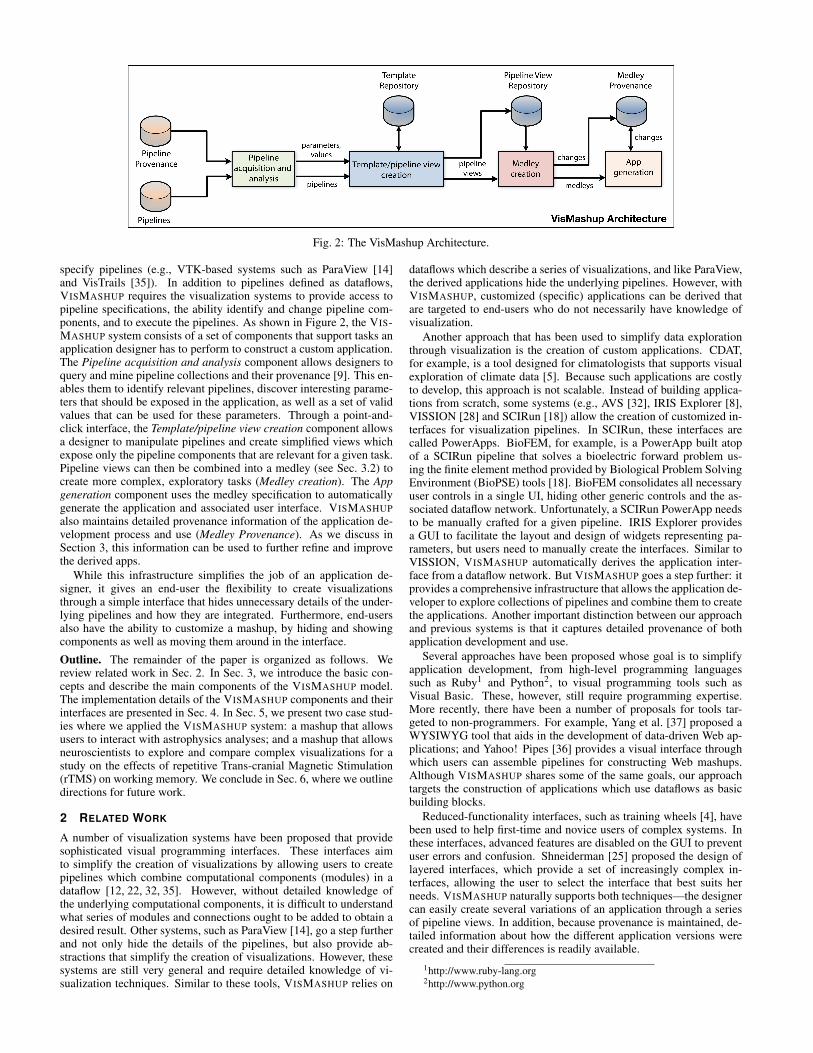
Fig. 2: The VisMashup Architecture.
specify pipelines (e.g., VTK-based systems such as ParaView [14]and VisTrails [35]). In addition to pipelines defined as dataflows,VISMASHUP requires the visualization systems to provide access topipeline specifications, the ability identify and change pipeline com-ponents, and to execute the pipelines. As shown in Figure 2, the VIS-MASHUP system consists of a set of components that support tasks anapplication designer has to perform to construct a custom application.The Pipeline acquisition and analysis component allows designers toquery and mine pipeline collections and their provenance [9]. This en-ables them to identify relevant pipelines, discover interesting parame-ters that should be exposed in the application, as well as a set of validvalues that can be used for these parameters. Through a point-and-click interface, the Template/pipeline view creation component allowsa designer to manipulate pipelines and create simplified views whichexpose only the pipeline components that are relevant for a given task.Pipeline views can then be combined into a medley (see Sec. 3.2) tocreate more complex, exploratory tasks (Medley creation). The Appgeneration component uses the medley specification to automaticallygenerate the application and associated user interface. VISMASHUPalso maintains detailed provenance information of the application de-velopment process and use (Medley Provenance). As we discuss inSection 3, this information can be used to further refine and improvethe derived apps.
While this infrastructure simplifies the job of an application de-signer, it gives an end-user the flexibility to create visualizationsthrough a simple interface that hides unnecessary details of the under-lying pipelines and how they are integrated. Furthermore, end-usersalso have the ability to customize a mashup, by hiding and showingcomponents as well as moving them around in the interface.
Outline. The remainder of the paper is organized as follows. Wereview related work in Sec. 2. In Sec. 3, we introduce the basic con-cepts and describe the main components of the VISMASHUP model.The implementation details of the VISMASHUP components and theirinterfaces are presented in Sec. 4. In Sec. 5, we present two case stud-ies where we applied the VISMASHUP system: a mashup that allowsusers to interact with astrophysics analyses; and a mashup that allowsneuroscientists to explore and compare complex visualizations for astudy on the effects of repetitive Trans-cranial Magnetic Stimulation(rTMS) on working memory. We conclude in Sec. 6, where we outlinedirections for future work.
2 RELATED WORK
A number of visualization systems have been proposed that providesophisticated visual programming interfaces. These interfaces aimto simplify the creation of visualizations by allowing users to createpipelines which combine computational components (modules) in adataflow [12, 22, 32, 35]. However, without detailed knowledge ofthe underlying computational components, it is difficult to understandwhat series of modules and connections ought to be added to obtain adesired result. Other systems, such as ParaView [14], go a step furtherand not only hide the details of the pipelines, but also provide ab-stractions that simplify the creation of visualizations. However, thesesystems are still very general and require detailed knowledge of vi-sualization techniques. Similar to these tools, VISMASHUP relies on
dataflows which describe a series of visualizations, and like ParaView,the derived applications hide the underlying pipelines. However, withVISMASHUP, customized (specific) applications can be derived thatare targeted to end-users who do not necessarily have knowledge ofvisualization.
Another approach that has been used to simplify data explorationthrough visualization is the creation of custom applications. CDAT,for example, is a tool designed for climatologists that supports visualexploration of climate data [5]. Because such applications are costlyto develop, this approach is not scalable. Instead of building applica-tions from scratch, some systems (e.g., AVS [32], IRIS Explorer [8],VISSION [28] and SCIRun [18]) allow the creation of customized in-terfaces for visualization pipelines. In SCIRun, these interfaces arecalled PowerApps. BioFEM, for example, is a PowerApp built atopof a SCIRun pipeline that solves a bioelectric forward problem us-ing the finite element method provided by Biological Problem SolvingEnvironment (BioPSE) tools [18]. BioFEM consolidates all necessaryuser controls in a single UI, hiding other generic controls and the as-sociated dataflow network. Unfortunately, a SCIRun PowerApp needsto be manually crafted for a given pipeline. IRIS Explorer providesa GUI to facilitate the layout and design of widgets representing pa-rameters, but users need to manually create the interfaces. Similar toVISSION, VISMASHUP automatically derives the application inter-face from a dataflow network. But VISMASHUP goes a step further: itprovides a comprehensive infrastructure that allows the application de-veloper to explore collections of pipelines and combine them to createthe applications. Another important distinction between our approachand previous systems is that it captures detailed provenance of bothapplication development and use.
Several approaches have been proposed whose goal is to simplifyapplication development, from high-level programming languagessuch as Ruby1 and Python2, to visual programming tools such asVisual Basic. These, however, still require programming expertise.More recently, there have been a number of proposals for tools tar-geted to non-programmers. For example, Yang et al. [37] proposed aWYSIWYG tool that aids in the development of data-driven Web ap-plications; and Yahoo! Pipes [36] provides a visual interface throughwhich users can assemble pipelines for constructing Web mashups.Although VISMASHUP shares some of the same goals, our approachtargets the construction of applications which use dataflows as basicbuilding blocks.
Reduced-functionality interfaces, such as training wheels [4], havebeen used to help first-time and novice users of complex systems. Inthese interfaces, advanced features are disabled on the GUI to preventuser errors and confusion. Shneiderman [25] proposed the design oflayered interfaces, which provide a set of increasingly complex in-terfaces, allowing the user to select the interface that best suits herneeds. VISMASHUP naturally supports both techniques—the designercan easily create several variations of an application through a seriesof pipeline views. In addition, because provenance is maintained, de-tailed information about how the different application versions werecreated and their differences is readily available.
1http://www.ruby-lang.org2http://www.python.org
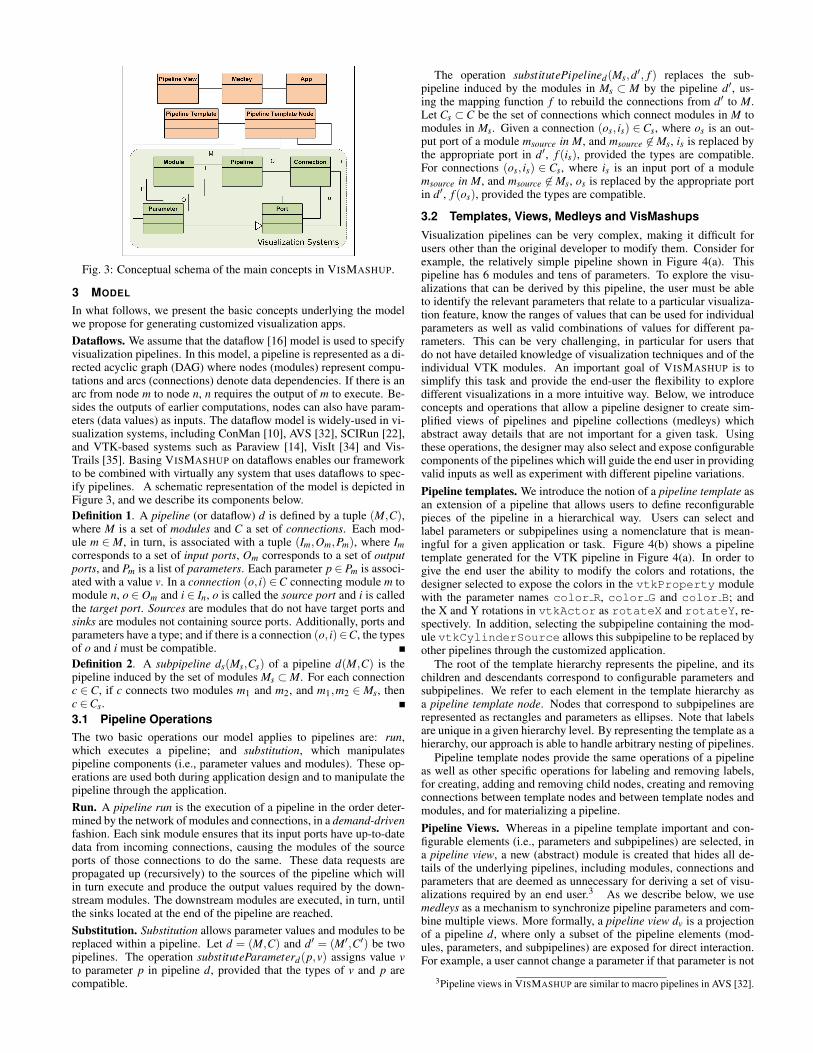
Fig. 3: Conceptual schema of the main concepts in VISMASHUP.
3 MODEL
In what follows, we present the basic concepts underlying the modelwe propose for generating customized visualization apps.Dataflows. We assume that the dataflow [16] model is used to specifyvisualization pipelines. In this model, a pipeline is represented as a di-rected acyclic graph (DAG) where nodes (modules) represent compu-tations and arcs (connections) denote data dependencies. If there is anarc from node m to node n, n requires the output of m to execute. Be-sides the outputs of earlier computations, nodes can also have param-eters (data values) as inputs. The dataflow model is widely-used in vi-sualization systems, including ConMan [10], AVS [32], SCIRun [22],and VTK-based systems such as Paraview [14], VisIt [34] and Vis-Trails [35]. Basing VISMASHUP on dataflows enables our frameworkto be combined with virtually any system that uses dataflows to spec-ify pipelines. A schematic representation of the model is depicted inFigure 3, and we describe its components below.Definition 1. A pipeline (or dataflow) d is defined by a tuple (M,C),where M is a set of modules and C a set of connections. Each mod-ule m ∈ M, in turn, is associated with a tuple (Im,Om,Pm), where Imcorresponds to a set of input ports, Om corresponds to a set of outputports, and Pm is a list of parameters. Each parameter p ∈ Pm is associ-ated with a value v. In a connection (o, i) ∈C connecting module m tomodule n, o ∈ Om and i ∈ In, o is called the source port and i is calledthe target port. Sources are modules that do not have target ports andsinks are modules not containing source ports. Additionally, ports andparameters have a type; and if there is a connection (o, i)∈C, the typesof o and i must be compatible.Definition 2. A subpipeline ds(Ms,Cs) of a pipeline d(M,C) is thepipeline induced by the set of modules Ms ⊂M. For each connectionc ∈ C, if c connects two modules m1 and m2, and m1,m2 ∈ Ms, thenc ∈Cs.3.1 Pipeline OperationsThe two basic operations our model applies to pipelines are: run,which executes a pipeline; and substitution, which manipulatespipeline components (i.e., parameter values and modules). These op-erations are used both during application design and to manipulate thepipeline through the application.Run. A pipeline run is the execution of a pipeline in the order deter-mined by the network of modules and connections, in a demand-drivenfashion. Each sink module ensures that its input ports have up-to-datedata from incoming connections, causing the modules of the sourceports of those connections to do the same. These data requests arepropagated up (recursively) to the sources of the pipeline which willin turn execute and produce the output values required by the down-stream modules. The downstream modules are executed, in turn, untilthe sinks located at the end of the pipeline are reached.Substitution. Substitution allows parameter values and modules to bereplaced within a pipeline. Let d = (M,C) and d′ = (M′,C′) be twopipelines. The operation substituteParameterd(p,v) assigns value vto parameter p in pipeline d, provided that the types of v and p arecompatible.
The operation substitutePipelined(Ms,d′, f ) replaces the sub-pipeline induced by the modules in Ms ⊂ M by the pipeline d′, us-ing the mapping function f to rebuild the connections from d′ to M.Let Cs ⊂C be the set of connections which connect modules in M tomodules in Ms. Given a connection (os, is) ∈ Cs, where os is an out-put port of a module msource in M, and msource 6∈Ms, is is replaced bythe appropriate port in d′, f (is), provided the types are compatible.For connections (os, is) ∈ Cs, where is is an input port of a modulemsource in M, and msource 6∈Ms, os is replaced by the appropriate portin d′, f (os), provided the types are compatible.
3.2 Templates, Views, Medleys and VisMashupsVisualization pipelines can be very complex, making it difficult forusers other than the original developer to modify them. Consider forexample, the relatively simple pipeline shown in Figure 4(a). Thispipeline has 6 modules and tens of parameters. To explore the visu-alizations that can be derived by this pipeline, the user must be ableto identify the relevant parameters that relate to a particular visualiza-tion feature, know the ranges of values that can be used for individualparameters as well as valid combinations of values for different pa-rameters. This can be very challenging, in particular for users thatdo not have detailed knowledge of visualization techniques and of theindividual VTK modules. An important goal of VISMASHUP is tosimplify this task and provide the end-user the flexibility to exploredifferent visualizations in a more intuitive way. Below, we introduceconcepts and operations that allow a pipeline designer to create sim-plified views of pipelines and pipeline collections (medleys) whichabstract away details that are not important for a given task. Usingthese operations, the designer may also select and expose configurablecomponents of the pipelines which will guide the end user in providingvalid inputs as well as experiment with different pipeline variations.Pipeline templates. We introduce the notion of a pipeline template asan extension of a pipeline that allows users to define reconfigurablepieces of the pipeline in a hierarchical way. Users can select andlabel parameters or subpipelines using a nomenclature that is mean-ingful for a given application or task. Figure 4(b) shows a pipelinetemplate generated for the VTK pipeline in Figure 4(a). In order togive the end user the ability to modify the colors and rotations, thedesigner selected to expose the colors in the vtkProperty modulewith the parameter names color R, color G and color B; andthe X and Y rotations in vtkActor as rotateX and rotateY, re-spectively. In addition, selecting the subpipeline containing the mod-ule vtkCylinderSource allows this subpipeline to be replaced byother pipelines through the customized application.
The root of the template hierarchy represents the pipeline, and itschildren and descendants correspond to configurable parameters andsubpipelines. We refer to each element in the template hierarchy asa pipeline template node. Nodes that correspond to subpipelines arerepresented as rectangles and parameters as ellipses. Note that labelsare unique in a given hierarchy level. By representing the template as ahierarchy, our approach is able to handle arbitrary nesting of pipelines.
Pipeline template nodes provide the same operations of a pipelineas well as other specific operations for labeling and removing labels,for creating, adding and removing child nodes, creating and removingconnections between template nodes and between template nodes andmodules, and for materializing a pipeline.Pipeline Views. Whereas in a pipeline template important and con-figurable elements (i.e., parameters and subpipelines) are selected, ina pipeline view, a new (abstract) module is created that hides all de-tails of the underlying pipelines, including modules, connections andparameters that are deemed as unnecessary for deriving a set of visu-alizations required by an end user.3 As we describe below, we usemedleys as a mechanism to synchronize pipeline parameters and com-bine multiple views. More formally, a pipeline view dv is a projectionof a pipeline d, where only a subset of the pipeline elements (mod-ules, parameters, and subpipelines) are exposed for direct interaction.For example, a user cannot change a parameter if that parameter is not
3Pipeline views in VISMASHUP are similar to macro pipelines in AVS [32].

Fig. 4: Example of how pipeline views are created. (a) Original VTK pipeline that draws a simple cylinder. (b) The user marks configurablepieces of the pipeline to create a template. (c) A pipeline view is created based on the pipeline template. The user defines template node Cubeas another suggestion for variable input and Cylinder as the default value.
exposed by the pipeline view. However, a pipeline view still keeps areference to the original pipeline so the operations applied to the viewcan also be applied to the pipeline, including execution. We refer tothe exposed elements as variables.
Notice that a pipeline view can be naturally built on top of a pipelinetemplate. In fact, the view parameters and configurable subpipelinesare also represented as a hierarchy that mirrors the one for the tem-plate hierarchy. Besides setting the visibility of template nodes andparameters, a developer can also specify a list of suggestions for thevalues a variable can take—these suggestions are used to derive ap-plication widgets that enable users to conveniently select a value fromlist and bind it to the variable (see Sec. 4). Figure 4(c) shows a view(DrawShape) derived from the template in Figure 4(b). In addition,the view also contains suggestions for alternative subpipelines that canbe used to bind the input variable, i.e., vtkCylinderSourceand vtkCubeSource. When defining these suggestions for tem-plate nodes, the developer also specifies how these suggestions con-nect in the parent template. It is possible that a given template nodecan be bound in different ways and the presence of some variables ina pipeline view is determined by the bindings used for their parents.In the example shown in Figure 4(c), the developer defined differenttypes of source, each containing their own set of parameters. Thereare two possible bindings suggested for the variable input: the sub-pipelines Cylinder and Cube. In the pipeline view shown, whereCylinder is used, its parameter (i.e., resolution) is added to theview. If Cube were chosen, its parameters would be included instead.
Medleys. For exploratory visualization tasks, a user often needs tocreate and manipulate a set of pipelines. For example, to comparedifferent isosurface extraction algorithms, several pipelines need to becreated, including one pipeline per isosurface algorithm, and a pipelinethat produces a histogram which accumulates the quality informationfor each mesh. Figure 5 illustrates two visualizations and their corre-sponding quality histograms.
In order to support the construction of applications that require thecombination of multiple pipelines, we introduce the notion of a med-ley: a medley M is a collection of (related) pipeline views. VIS-MASHUP supports a set of operations for manipulating the views ina medley. One such operation is synchronization. A variable x in apipeline view dv ∈M can be synchronized with any variable x′ in an-other view d′v ∈ M if x and x′ have the same type. If x and x′ aresynchronized, binding either to a value v sets both variables to v.
The ability to synchronize variables is useful, in particular, for tasks
Fig. 5: Comparing visualizations derived by two different isosurfacealgorithms and their associated quality histograms.
such as comparative visualization, since it helps ensure that all param-eters across different pipelines whose values should be the same areindeed the same. Consider, again, the isosurface example. Given amedley that contains the views for the pipelines that use the differentisosurface algorithms, by synchronizing their input file and contourvalues, in a single step, the user could set these parameters and theywould be automatically propagated to the two pipelines. Furthermore,synchronization enables a user to efficiently try out different config-urations. Instead of setting values for each pipeline individually—which can be both time consuming and error prone, the value for aparameter is set only once and it is automatically propagated to allsynchronized variables in multiple views. Another possible operationthat can be applied to a medley is composition. Composition can beachieved by synchronizing an output port of a view to the input port ofanother. In our example, composition could be used to pass the meshderived by the two isosurface views to the view that derives the qual-ity histograms. Note that because pipeline views reduce the number ofcomponents that are exposed for modification, they make it easier toidentify how pipelines can be integrated and synchronized.
VisMashups. A vismashup (application) is a flexible GUI automat-ically generated from a medley specification. Instead of interactingdirectly with a dataflow network or a very general and complex GUI,users manipulate and execute a set of pipelines in a medley through asmall number of graphical widgets. Figures 8 and 9 show examples of

Fig. 6: Window to control the mining options and filtering conditionsto select pipelines.
vismashups. Application maintenance is simplified, since when theunderlying medley changes, the GUI can be automatically updated.Furthermore, besides setting parameter values and synchronizing pa-rameters, users can customize a mashup: they can hide, show, andmove widgets around. Changes made to the pipeline views throughthe mashup are propagated down to the pipeline level and sent to thevisualization system for execution.
An important component of the mashup generation and executionsub-systems is that they maintain detailed provenance information.VISMASHUP maintains provenance of the mashup design process—itkeeps all versions and variations of a mashup created as the visualiza-tion expert interacts with a user, using a model similar to the change-based provenance proposed in [19]. Besides, log information of theuse of a mashup is also kept (e.g., when the mashup was executed, thevalues provided). The log information can be used to further refine theviews and medleys.
4 THE VISMASHUP SYSTEM
We have built a prototype VISMASHUP system using Python, Qt,PyQt, and VisTrails as the underlying dataflow system. VisTrails sup-ports a flexible set of libraries, including VTK, ITK, matplotlib, SciPyand Web services. As illustrated in Figure 2, the VISMASHUP systemhas four main components: pipeline acquisition and analysis; templateand view creation; medley creation; and application generation. Theimplementation of these components and their user interfaces are de-scribed in detail below.
4.1 Pipeline Acquisition and Analysis
Although the pipelines for a mashup can be built from scratch, of-ten, as visualization experts (designers) interact with domain experts(users), they construct a series of pipelines to explore different as-pects of a data set, or different ways to visualize the data. The ac-tual pipelines and their provenance, including information about thedifferent runs, parameters set and their values, can be useful for de-signing the views that serve as the basis for the custom application.The Pipeline Acquisition and Analysis component allows the designerto explore a pipeline collection to identify relevant pipelines as well asidentify important parameters and associated values.
Based on the metadata and provenance associated with a pipeline,we provide a filtering mechanism for developers to select pipelinessatisfying simple conditions (see Figure 6). These conditions can bebased on time (when the pipeline was created), the user that created thepipeline, execution (whether a pipeline was successfully executed andwhen), tags and notes associated with a pipeline. These rules are com-piled into a simple regular expression matching over the text descrip-tions of the pipelines. Note that it is also possible to integrate moreadvanced interfaces that allow structural queries over the pipelines(e.g., [2, 24]). Besides filtering, this component also provides an algo-rithm to help organize the pipeline collection into groups and extractinformation about parameter changes (see below). If there is prove-nance information about parameters that have been set across differentexecutions of a pipeline and their values, this information can be ex-plored both to suggest which parameters to expose in the pipeline viewas well as to create a range of values that can be used as suggestionsfor the exposed parameters (Sec. 3.2).
Fig. 7: VisMashup Mining Interface: (a) Relevant pipelines organizedin a Hasse Diagram; (b) Examining the parameters returned from themining process using the Template/Pipeline View Editor.
Given a set of pipelines D, the procedure GROUP-AND-MINE-PARAMETERS initially groups together pipelines that have the samestructure (modules and connections), i.e., isomorphic graphs (line 2).For each group, the parameters and values stored in the pipelines andin their provenance (if available) are extracted and attached to thegroup (lines 3-12). Finally a Hasse diagram [3, 31] of the groups isgenerated by calling procedure BUILD-HASSE-GRAPH. The Hassediagram is a tree where each node corresponds to a group of isomor-phic graphs, and edges between a parent and a child node indicate con-tainment. It shows how pipelines are related with respect to structure:the graph of a parent node is contained in the graph of the child node.Figure 7(a) shows an example of a Hasse diagram for a collection of21 pipelines. Each pipeline is identified by a label and a thumbnail ofthe visualization it generates. Although the Hasse diagram resemblesan image graph [17], the latter only captures the relationship betweenvisualization parameter changes and are created for a single pipeline.
GROUP-AND-MINE-PARAMETERS(D)1 hasse-nodes←MAKE-NODES-FROM-PIPELINES(D)2 hasse-nodes←MERGE-WITH-SAME-STRUCTURE(hasse-nodes)3 for n in hasse-nodes4 n .param-list← DICTIONARY()5 for d in n .pipelines6 params← GET-PARAMS-FROM-PROVENANCE(d)7 params← params+d .parameters8 for p in params9 if p .namenot inn .param-list .KEYS()
10 n .param-list[p .name] = [ ]11 n .param-list[p .name]← p .value)12 BUILD-HASSE-GRAPH(hasse-nodes)
To discover the containment relationships, it is necessary to com-pute subgraph isomorphism between all pipeline group pairs. For ourprototype, we implemented the algorithm proposed by Ullman [31].We note that, although computing subgraph isomorphism is compu-tationally hard for general graphs,4 we have observed that, in prac-tice, this computation can be efficient for pipelines represented asdataflows. Just to give an idea, for a collection of over 7,000 pipelines,it took 140 seconds to generate their Hasse diagram. Besides, even if
4This problem is trivially reducible from the MAX-CLIQUE problem, awell-known NP-complete problem [11].

this computation takes long, it can be done in an offline process oncefor a collection, and be re-used multiple times.
The interface for the Hasse diagram is interactive, with zoom andpan functionality. This diagram gives a developer an overview of thecollection and shows which pipelines share the same structure but havedifferent parameter values. By clicking on a node of the diagram, thedeveloper has access to another screen that provides details about allthe pipelines in that group. The pipeline is displayed together withall the parameters that were changed, the number of times they werechanged, and the set of values used to bind them. If the pipelinestores information about its executions, a plot of the execution timesis also shown. This information is then used to help the constructionof pipeline templates and views (Figure 7(b)).4.2 Template and Pipeline View CreationAfter selecting the interesting pipelines and extracting informationabout important parameters and values, the developer can use thePipeline Template Editor to define the configurable pieces of thepipelines, by labeling subpipelines and parameters. To select apipeline to be used as a template, the designer simply clicks on thecorresponding node in the Hasse diagram. This causes the TemplateEditor to be invoked. When the developer labels a parameter or asubpipeline, all the relevant information associated with these com-ponents that had been collected during the mining process is auto-matically added to the template (e.g., all the values associate with theparameter). This is illustrated in Figure 7(b), which shows a set ofparameters extracted from one of the pipelines in Figure 7(a).
Once a template is created, one of the operations supported by theTemplate Editor is view creation. While configuring a view, users canset the visibility of the parameters and configurable subpipelines, aswell as select suggestions from the list stored in the template. Note thatthe information about both values as well as change frequency is veryuseful for configuring a view. Clearly, parameters that have had manydifferent values are good candidates for being exposed. As shown inFigure 7(b), the value for parameter omega framewas modified 178times, while the parameter propagation time changed 98 times.The values for these parameters can be used to create a list of sug-gestions for variables in the view. As we describe below, suggestionsare included in the mashup to guide the user interaction, e.g., besidestyping a value in the interface, the user can also select a value from alist of suggestions. Note that both templates and views are stored in arepository where they can be accessed at a later time.
4.3 Medley Creation and Mashup GenerationTo combine pipeline views in a medley, the designer uses the MedleysEditor. The views stored in the Pipeline View Repository are displayedon a panel and they can be dragged and dropped on a canvas. Once onthe canvas, the medley operations (synchronization and composition)can be applied to the views. A screenshot of the Medleys Editor isshown in Figure 8.
Each variable in a view has an associated handle—the circles on theleft and right of each variable name in the pipeline view in Figure 4(c).By connecting the handles for two variables in distinct views, their val-ues are synchronized. To simplify the task of identifying variables tobe synchronized, when the designer starts a connection all the vari-ables that are compatible with that variable are highlighted.
VISMASHUP uses the change-based provenance model [19] to cap-ture all the changes made to a medley. We designed and implementeda change algebra that captures the actions applied to a medley (e.g.,synchronize variables) as well as to its components (e.g., hide/exposeview variables).
A mashup is generated from a medley using the following algo-rithms:GENERATE-APP(medley)1 widgets = TREE()2 window = CREATE-WINDOW(medley)3 for pipeline-view in medley.pipeline-views4 BUILD-GUI-WIDGETS(pipeline-view .root,window,widgets)5 for sync in medley .syncs6 LINK-WIDGETS-FROM-SYNC(sync)
BUILD-GUI-WIDGETS(template-node, parent,node)1 widget = CREATE-CONTAINER(parent, template-node)2 child = MAKE-TREE-NODE(widget)3 node .ADD-CHILD(child)4 for var in template-node .children5 BUILD-GUI-WIDGETS(var,widget,child)6 for par in var .parameters7 widget-type← GET-FROM-REGISTRY(par . type)8 wp← CREATE-WIDGET(widget-type,widget,par)
GENERATE-APP automatically derives a user interface for a givenmedley. The interface consists of a set of widgets represented as atree whose root corresponds to the mashup window. For each view inthe medley, the algorithm iterates through the view components andderives their widgets by invoking BUILD-GUI-WIDGETS (lines 3-4).After the widgets are created, the widgets that correspond to synchro-nized variables in the medley are linked (lines 5-6) —this ensures thatwhen the value is set for a widget w, the same value is propagated toall widgets linked to w.
BUILD-GUI-WIDGETS generates the widgets for a pipeline view.It first creates a container for the view (line 1), and then recursivelybuilds a widget tree following the view template tree (Sec. 3.2). Thewidget types associated to the types of the variables are stored in aRegistry. A widget is selected for a variable based on the mappingstored in the Registry. In the current implementation, the Registry ispopulated based on the types available in VisTrails, where designerscan define their custom types and widgets. A planned extension toVISMASHUP is to allow the designer to edit the Registry and config-ure the choices independently of the underlying dataflow system. Inaddition to the widgets, canvases are created to display each of theoutputs of a view. Note that the algorithms above are used to gener-ate both client applications as well as Web-based mashups. The maindifferences between the two kinds of apps is that the communicationbetween a Web app and a medley is done via a Web service and itprovides a more limited interaction with the visualizations.
4.4 Mashup InteractionWhen a mashup is created, a default layout is selected for the widgets.By activating the mashup edit mode, the user can move the widgetsaround, hide and show widgets, enable and disable synchronizations.The new custom layout is saved as an attribute of the medley associ-ated with the mashup, and the next time the mashup is invoked, thecustom layout is loaded.
When a container widget changes its value (e.g., changing fromCylinder to Cube in the pipeline view described in Figure 4), themashup window needs to be updated accordingly. As the widgets inthe window follow the hierarchy of the pipeline template, updates canbe applied locally to that node—it is not necessary to update the otherwidgets in the window. The update procedure is shown below.
UPDATE-APP(window, tree−node)1 parent← tree-node .parent2 template-node← tree-node .widget. template-node3 BUILD-GUI-WIDGETS(template-node, parent.widget, parent)4 REMOVE-LINKS-FROM-WIDGETS()5 for sync in window.medley.syncs6 LINK-WIDGETS-FROM-SYNC(sync)
Note that before UPDATE-APP is called, the medley associated withthat window detects the change events and stores the correspondingprovenance information. Since variables can be removed, the syn-chronization information may need to be updated as do the associatedlinks between widgets. Finally, executing a mashup causes all pipelineviews to update their corresponding pipelines using the values on themedley (the same as in the GUI) and trigger their execution.
5 CASE STUDIES5.1 Sharing Astrophysics AnalysesProfessor Joel Tohline’s group at Louisiana State University (LSU)has been developing computational fluid dynamics (CFD) techniques
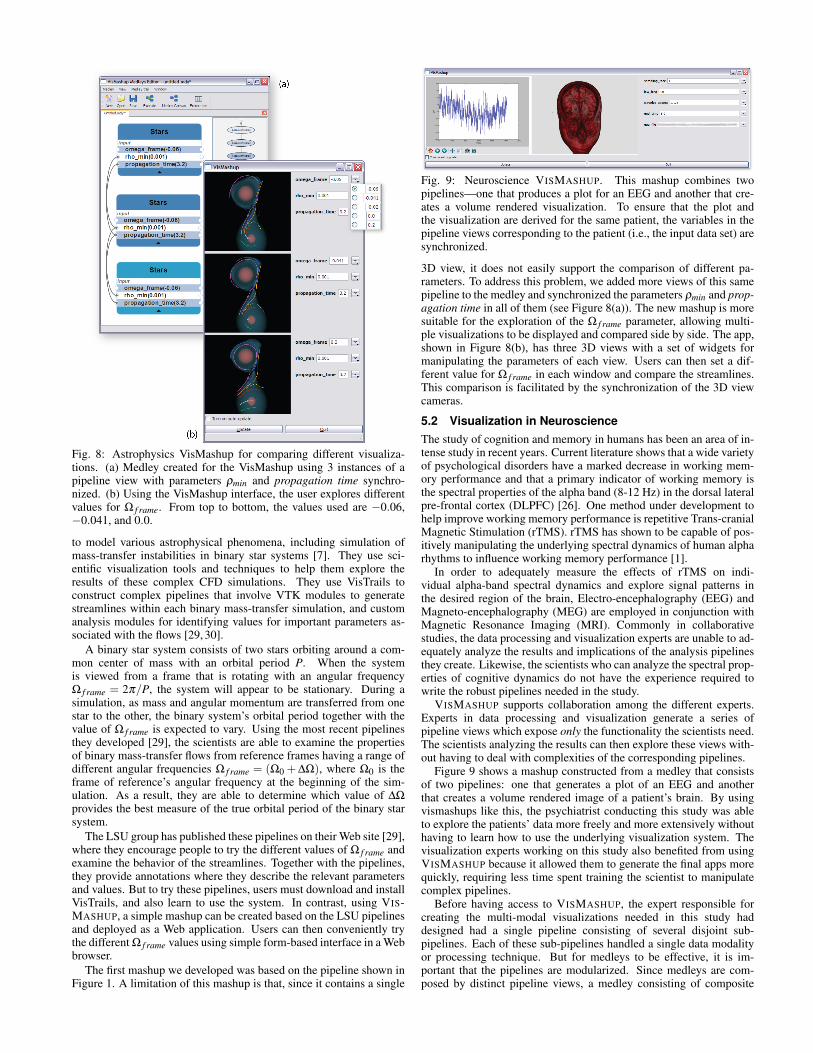
Fig. 8: Astrophysics VisMashup for comparing different visualiza-tions. (a) Medley created for the VisMashup using 3 instances of apipeline view with parameters ρmin and propagation time synchro-nized. (b) Using the VisMashup interface, the user explores differentvalues for Ω f rame. From top to bottom, the values used are −0.06,−0.041, and 0.0.
to model various astrophysical phenomena, including simulation ofmass-transfer instabilities in binary star systems [7]. They use sci-entific visualization tools and techniques to help them explore theresults of these complex CFD simulations. They use VisTrails toconstruct complex pipelines that involve VTK modules to generatestreamlines within each binary mass-transfer simulation, and customanalysis modules for identifying values for important parameters as-sociated with the flows [29, 30].
A binary star system consists of two stars orbiting around a com-mon center of mass with an orbital period P. When the systemis viewed from a frame that is rotating with an angular frequencyΩ f rame = 2π/P, the system will appear to be stationary. During asimulation, as mass and angular momentum are transferred from onestar to the other, the binary system’s orbital period together with thevalue of Ω f rame is expected to vary. Using the most recent pipelinesthey developed [29], the scientists are able to examine the propertiesof binary mass-transfer flows from reference frames having a range ofdifferent angular frequencies Ω f rame = (Ω0 + ∆Ω), where Ω0 is theframe of reference’s angular frequency at the beginning of the sim-ulation. As a result, they are able to determine which value of ∆Ω
provides the best measure of the true orbital period of the binary starsystem.
The LSU group has published these pipelines on their Web site [29],where they encourage people to try the different values of Ω f rame andexamine the behavior of the streamlines. Together with the pipelines,they provide annotations where they describe the relevant parametersand values. But to try these pipelines, users must download and installVisTrails, and also learn to use the system. In contrast, using VIS-MASHUP, a simple mashup can be created based on the LSU pipelinesand deployed as a Web application. Users can then conveniently trythe different Ω f rame values using simple form-based interface in a Webbrowser.
The first mashup we developed was based on the pipeline shown inFigure 1. A limitation of this mashup is that, since it contains a single
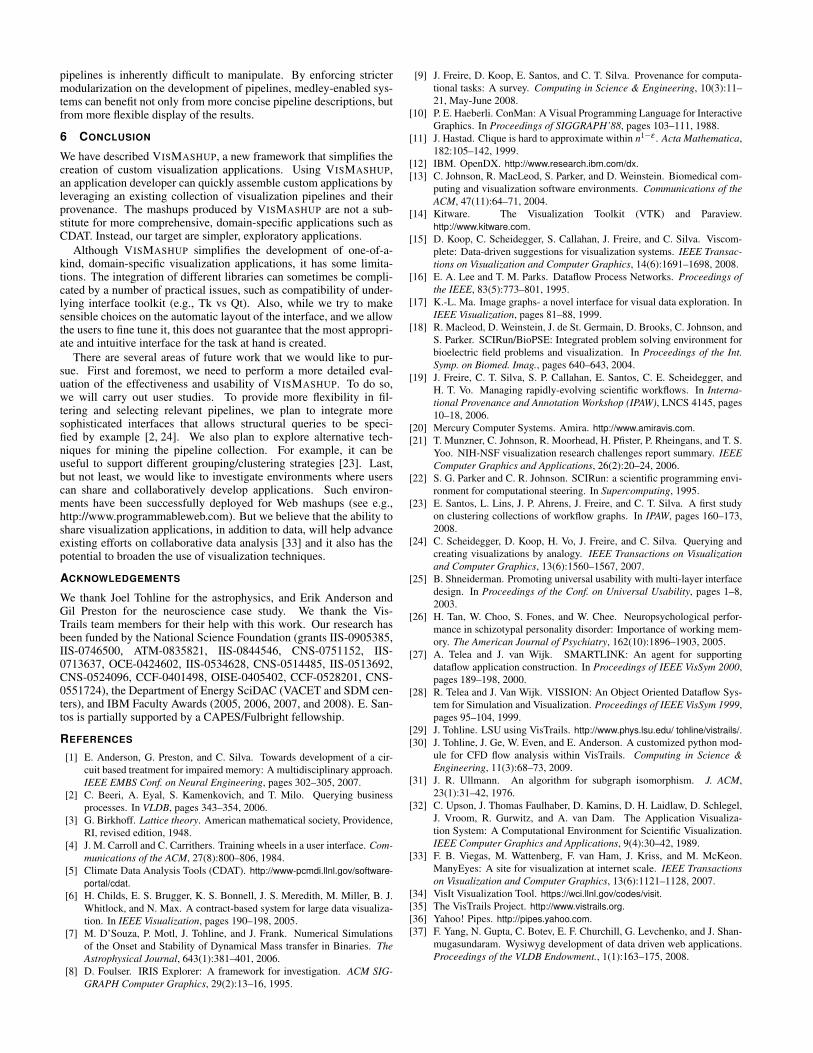
Fig. 9: Neuroscience VISMASHUP. This mashup combines twopipelines—one that produces a plot for an EEG and another that cre-ates a volume rendered visualization. To ensure that the plot andthe visualization are derived for the same patient, the variables in thepipeline views corresponding to the patient (i.e., the input data set) aresynchronized.
3D view, it does not easily support the comparison of different pa-rameters. To address this problem, we added more views of this samepipeline to the medley and synchronized the parameters ρmin and prop-agation time in all of them (see Figure 8(a)). The new mashup is moresuitable for the exploration of the Ω f rame parameter, allowing multi-ple visualizations to be displayed and compared side by side. The app,shown in Figure 8(b), has three 3D views with a set of widgets formanipulating the parameters of each view. Users can then set a dif-ferent value for Ω f rame in each window and compare the streamlines.This comparison is facilitated by the synchronization of the 3D viewcameras.
5.2 Visualization in NeuroscienceThe study of cognition and memory in humans has been an area of in-tense study in recent years. Current literature shows that a wide varietyof psychological disorders have a marked decrease in working mem-ory performance and that a primary indicator of working memory isthe spectral properties of the alpha band (8-12 Hz) in the dorsal lateralpre-frontal cortex (DLPFC) [26]. One method under development tohelp improve working memory performance is repetitive Trans-cranialMagnetic Stimulation (rTMS). rTMS has shown to be capable of pos-itively manipulating the underlying spectral dynamics of human alpharhythms to influence working memory performance [1].
In order to adequately measure the effects of rTMS on indi-vidual alpha-band spectral dynamics and explore signal patterns inthe desired region of the brain, Electro-encephalography (EEG) andMagneto-encephalography (MEG) are employed in conjunction withMagnetic Resonance Imaging (MRI). Commonly in collaborativestudies, the data processing and visualization experts are unable to ad-equately analyze the results and implications of the analysis pipelinesthey create. Likewise, the scientists who can analyze the spectral prop-erties of cognitive dynamics do not have the experience required towrite the robust pipelines needed in the study.
VISMASHUP supports collaboration among the different experts.Experts in data processing and visualization generate a series ofpipeline views which expose only the functionality the scientists need.The scientists analyzing the results can then explore these views with-out having to deal with complexities of the corresponding pipelines.
Figure 9 shows a mashup constructed from a medley that consistsof two pipelines: one that generates a plot of an EEG and anotherthat creates a volume rendered image of a patient’s brain. By usingvismashups like this, the psychiatrist conducting this study was ableto explore the patients’ data more freely and more extensively withouthaving to learn how to use the underlying visualization system. Thevisualization experts working on this study also benefited from usingVISMASHUP because it allowed them to generate the final apps morequickly, requiring less time spent training the scientist to manipulatecomplex pipelines.
Before having access to VISMASHUP, the expert responsible forcreating the multi-modal visualizations needed in this study haddesigned had a single pipeline consisting of several disjoint sub-pipelines. Each of these sub-pipelines handled a single data modalityor processing technique. But for medleys to be effective, it is im-portant that the pipelines are modularized. Since medleys are com-posed by distinct pipeline views, a medley consisting of composite
pipelines is inherently difficult to manipulate. By enforcing strictermodularization on the development of pipelines, medley-enabled sys-tems can benefit not only from more concise pipeline descriptions, butfrom more flexible display of the results.
6 CONCLUSION
We have described VISMASHUP, a new framework that simplifies thecreation of custom visualization applications. Using VISMASHUP,an application developer can quickly assemble custom applications byleveraging an existing collection of visualization pipelines and theirprovenance. The mashups produced by VISMASHUP are not a sub-stitute for more comprehensive, domain-specific applications such asCDAT. Instead, our target are simpler, exploratory applications.
Although VISMASHUP simplifies the development of one-of-a-kind, domain-specific visualization applications, it has some limita-tions. The integration of different libraries can sometimes be compli-cated by a number of practical issues, such as compatibility of under-lying interface toolkit (e.g., Tk vs Qt). Also, while we try to makesensible choices on the automatic layout of the interface, and we allowthe users to fine tune it, this does not guarantee that the most appropri-ate and intuitive interface for the task at hand is created.
There are several areas of future work that we would like to pur-sue. First and foremost, we need to perform a more detailed eval-uation of the effectiveness and usability of VISMASHUP. To do so,we will carry out user studies. To provide more flexibility in fil-tering and selecting relevant pipelines, we plan to integrate moresophisticated interfaces that allows structural queries to be speci-fied by example [2, 24]. We also plan to explore alternative tech-niques for mining the pipeline collection. For example, it can beuseful to support different grouping/clustering strategies [23]. Last,but not least, we would like to investigate environments where userscan share and collaboratively develop applications. Such environ-ments have been successfully deployed for Web mashups (see e.g.,http://www.programmableweb.com). But we believe that the ability toshare visualization applications, in addition to data, will help advanceexisting efforts on collaborative data analysis [33] and it also has thepotential to broaden the use of visualization techniques.
ACKNOWLEDGEMENTS
We thank Joel Tohline for the astrophysics, and Erik Anderson andGil Preston for the neuroscience case study. We thank the Vis-Trails team members for their help with this work. Our research hasbeen funded by the National Science Foundation (grants IIS-0905385,IIS-0746500, ATM-0835821, IIS-0844546, CNS-0751152, IIS-0713637, OCE-0424602, IIS-0534628, CNS-0514485, IIS-0513692,CNS-0524096, CCF-0401498, OISE-0405402, CCF-0528201, CNS-0551724), the Department of Energy SciDAC (VACET and SDM cen-ters), and IBM Faculty Awards (2005, 2006, 2007, and 2008). E. San-tos is partially supported by a CAPES/Fulbright fellowship.
REFERENCES
[1] E. Anderson, G. Preston, and C. Silva. Towards development of a cir-cuit based treatment for impaired memory: A multidisciplinary approach.IEEE EMBS Conf. on Neural Engineering, pages 302–305, 2007.
[2] C. Beeri, A. Eyal, S. Kamenkovich, and T. Milo. Querying businessprocesses. In VLDB, pages 343–354, 2006.
[3] G. Birkhoff. Lattice theory. American mathematical society, Providence,RI, revised edition, 1948.
[4] J. M. Carroll and C. Carrithers. Training wheels in a user interface. Com-munications of the ACM, 27(8):800–806, 1984.
[5] Climate Data Analysis Tools (CDAT). http://www-pcmdi.llnl.gov/software-portal/cdat.
[6] H. Childs, E. S. Brugger, K. S. Bonnell, J. S. Meredith, M. Miller, B. J.Whitlock, and N. Max. A contract-based system for large data visualiza-tion. In IEEE Visualization, pages 190–198, 2005.
[7] M. D’Souza, P. Motl, J. Tohline, and J. Frank. Numerical Simulationsof the Onset and Stability of Dynamical Mass transfer in Binaries. TheAstrophysical Journal, 643(1):381–401, 2006.
[8] D. Foulser. IRIS Explorer: A framework for investigation. ACM SIG-GRAPH Computer Graphics, 29(2):13–16, 1995.
[9] J. Freire, D. Koop, E. Santos, and C. T. Silva. Provenance for computa-tional tasks: A survey. Computing in Science & Engineering, 10(3):11–21, May-June 2008.
[10] P. E. Haeberli. ConMan: A Visual Programming Language for InteractiveGraphics. In Proceedings of SIGGRAPH’88, pages 103–111, 1988.
[11] J. Hastad. Clique is hard to approximate within n1−ε . Acta Mathematica,182:105–142, 1999.
[12] IBM. OpenDX. http://www.research.ibm.com/dx.[13] C. Johnson, R. MacLeod, S. Parker, and D. Weinstein. Biomedical com-
puting and visualization software environments. Communications of theACM, 47(11):64–71, 2004.
[14] Kitware. The Visualization Toolkit (VTK) and Paraview.http://www.kitware.com.
[15] D. Koop, C. Scheidegger, S. Callahan, J. Freire, and C. Silva. Viscom-plete: Data-driven suggestions for visualization systems. IEEE Transac-tions on Visualization and Computer Graphics, 14(6):1691–1698, 2008.
[16] E. A. Lee and T. M. Parks. Dataflow Process Networks. Proceedings ofthe IEEE, 83(5):773–801, 1995.
[17] K.-L. Ma. Image graphs- a novel interface for visual data exploration. InIEEE Visualization, pages 81–88, 1999.
[18] R. Macleod, D. Weinstein, J. de St. Germain, D. Brooks, C. Johnson, andS. Parker. SCIRun/BioPSE: Integrated problem solving environment forbioelectric field problems and visualization. In Proceedings of the Int.Symp. on Biomed. Imag., pages 640–643, 2004.
[19] J. Freire, C. T. Silva, S. P. Callahan, E. Santos, C. E. Scheidegger, andH. T. Vo. Managing rapidly-evolving scientific workflows. In Interna-tional Provenance and Annotation Workshop (IPAW), LNCS 4145, pages10–18, 2006.
[20] Mercury Computer Systems. Amira. http://www.amiravis.com.[21] T. Munzner, C. Johnson, R. Moorhead, H. Pfister, P. Rheingans, and T. S.
Yoo. NIH-NSF visualization research challenges report summary. IEEEComputer Graphics and Applications, 26(2):20–24, 2006.
[22] S. G. Parker and C. R. Johnson. SCIRun: a scientific programming envi-ronment for computational steering. In Supercomputing, 1995.
[23] E. Santos, L. Lins, J. P. Ahrens, J. Freire, and C. T. Silva. A first studyon clustering collections of workflow graphs. In IPAW, pages 160–173,2008.
[24] C. Scheidegger, D. Koop, H. Vo, J. Freire, and C. Silva. Querying andcreating visualizations by analogy. IEEE Transactions on Visualizationand Computer Graphics, 13(6):1560–1567, 2007.
[25] B. Shneiderman. Promoting universal usability with multi-layer interfacedesign. In Proceedings of the Conf. on Universal Usability, pages 1–8,2003.
[26] H. Tan, W. Choo, S. Fones, and W. Chee. Neuropsychological perfor-mance in schizotypal personality disorder: Importance of working mem-ory. The American Journal of Psychiatry, 162(10):1896–1903, 2005.
[27] A. Telea and J. van Wijk. SMARTLINK: An agent for supportingdataflow application construction. In Proceedings of IEEE VisSym 2000,pages 189–198, 2000.
[28] R. Telea and J. Van Wijk. VISSION: An Object Oriented Dataflow Sys-tem for Simulation and Visualization. Proceedings of IEEE VisSym 1999,pages 95–104, 1999.
[29] J. Tohline. LSU using VisTrails. http://www.phys.lsu.edu/ tohline/vistrails/.[30] J. Tohline, J. Ge, W. Even, and E. Anderson. A customized python mod-
ule for CFD flow analysis within VisTrails. Computing in Science &Engineering, 11(3):68–73, 2009.
[31] J. R. Ullmann. An algorithm for subgraph isomorphism. J. ACM,23(1):31–42, 1976.
[32] C. Upson, J. Thomas Faulhaber, D. Kamins, D. H. Laidlaw, D. Schlegel,J. Vroom, R. Gurwitz, and A. van Dam. The Application Visualiza-tion System: A Computational Environment for Scientific Visualization.IEEE Computer Graphics and Applications, 9(4):30–42, 1989.
[33] F. B. Viegas, M. Wattenberg, F. van Ham, J. Kriss, and M. McKeon.ManyEyes: A site for visualization at internet scale. IEEE Transactionson Visualization and Computer Graphics, 13(6):1121–1128, 2007.
[34] VisIt Visualization Tool. https://wci.llnl.gov/codes/visit.[35] The VisTrails Project. http://www.vistrails.org.[36] Yahoo! Pipes. http://pipes.yahoo.com.[37] F. Yang, N. Gupta, C. Botev, E. F. Churchill, G. Levchenko, and J. Shan-
mugasundaram. Wysiwyg development of data driven web applications.Proceedings of the VLDB Endowment., 1(1):163–175, 2008.