Vision Zero
49
1 VISION ZERO Nimra Butt, Allie George, Athanasios Kastritis, Fitore Miftari, Mallika Punwani
-
Upload
athanasios-kastritis -
Category
Documents
-
view
6 -
download
0
Transcript of Vision Zero
1
VISION ZERONimra Butt, Allie George, Athanasios Kastritis, Fitore Miftari, Mallika Punwani
2
Strategic Approach2
Segmentation
Targeting
Recommendation
3
4
5
1 Overview
2
Agenda
3
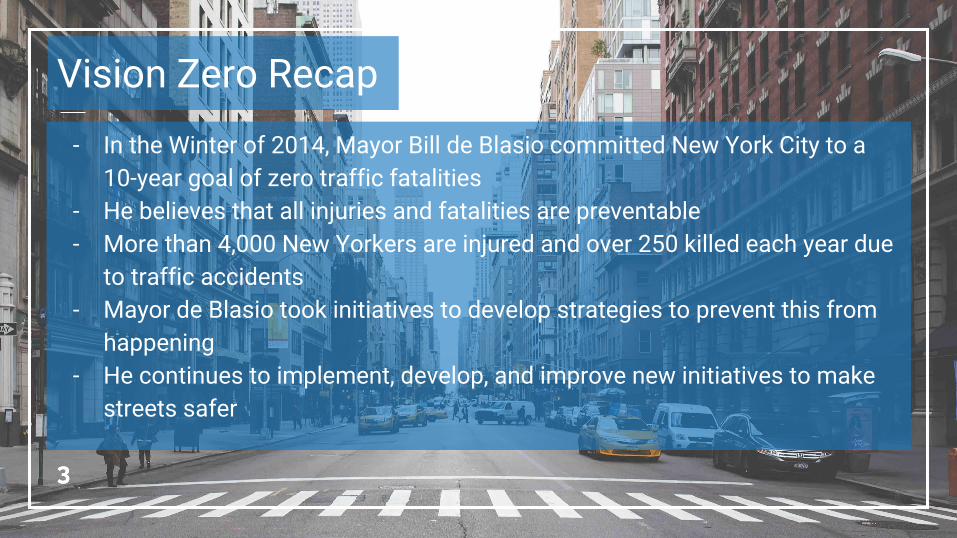
- In the Winter of 2014, Mayor Bill de Blasio committed New York City to a 10-year goal of zero traffic fatalities
- He believes that all injuries and fatalities are preventable- More than 4,000 New Yorkers are injured and over 250 killed each year due
to traffic accidents- Mayor de Blasio took initiatives to develop strategies to prevent this from
happening- He continues to implement, develop, and improve new initiatives to make
streets safer
3
Vision Zero Recap
4
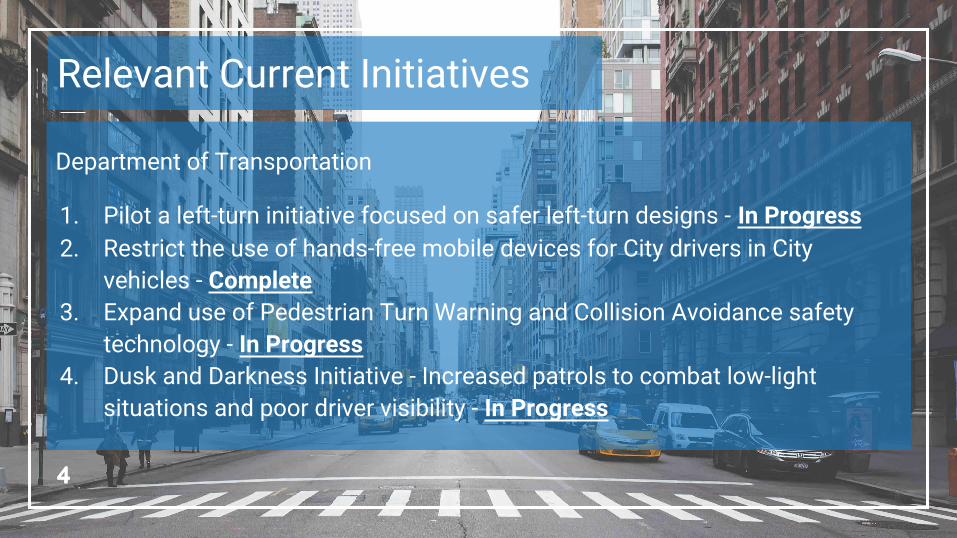
Department of Transportation
1. Pilot a left-turn initiative focused on safer left-turn designs - In Progress2. Restrict the use of hands-free mobile devices for City drivers in City
vehicles - Complete3. Expand use of Pedestrian Turn Warning and Collision Avoidance safety
technology - In Progress4. Dusk and Darkness Initiative - Increased patrols to combat low-light
situations and poor driver visibility - In Progress
4
Relevant Current Initiatives
5
Population Overview
6
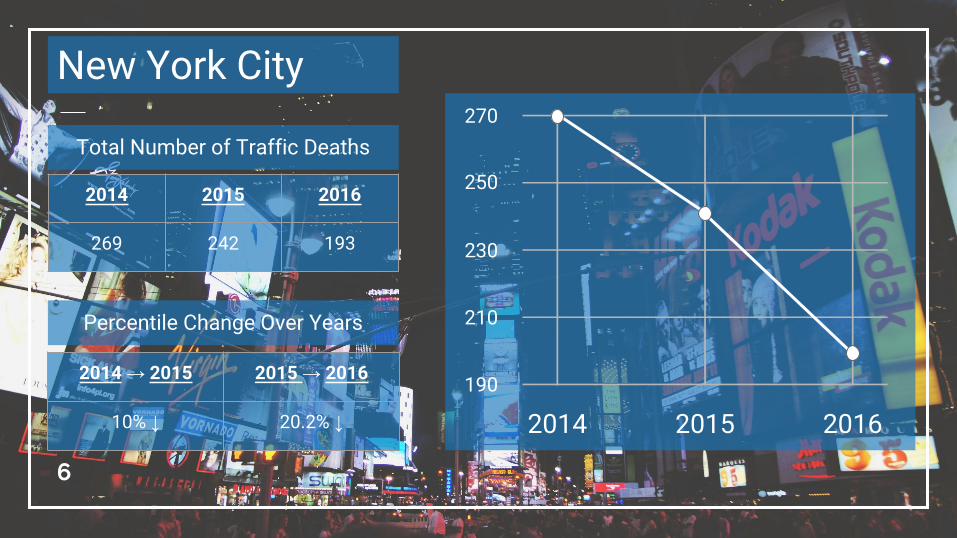
2014 2015 2016
269 242 193
New York City270
250
230
210
190
2014 2015 2016
Total Number of Traffic Deaths
Percentile Change Over Years
2014 → 2015 2015 → 2016
10% ↓ 20.2% ↓

7
Manhattan³ Brooklyn² The Bronx Queens¹ Staten Island
2014 45 83 37 91 11
2015 31 69 42 76 24
Traffic Fatalities By Borough Years 2014 - 2015
25
50
75
100
Num
ber o
f Dea
ths
8
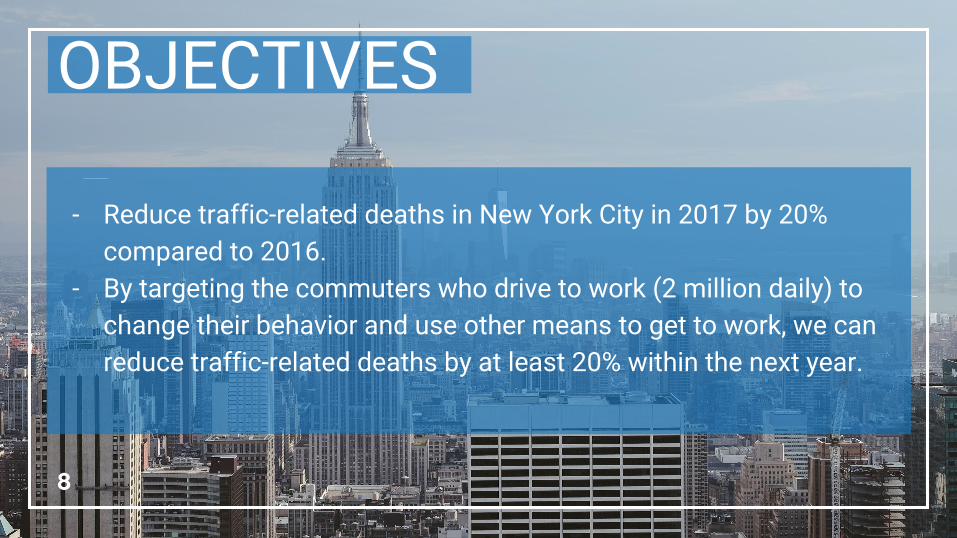
OBJECTIVES
- Reduce traffic-related deaths in New York City in 2017 by 20% compared to 2016.
- By targeting the commuters who drive to work (2 million daily) to change their behavior and use other means to get to work, we can reduce traffic-related deaths by at least 20% within the next year.
9
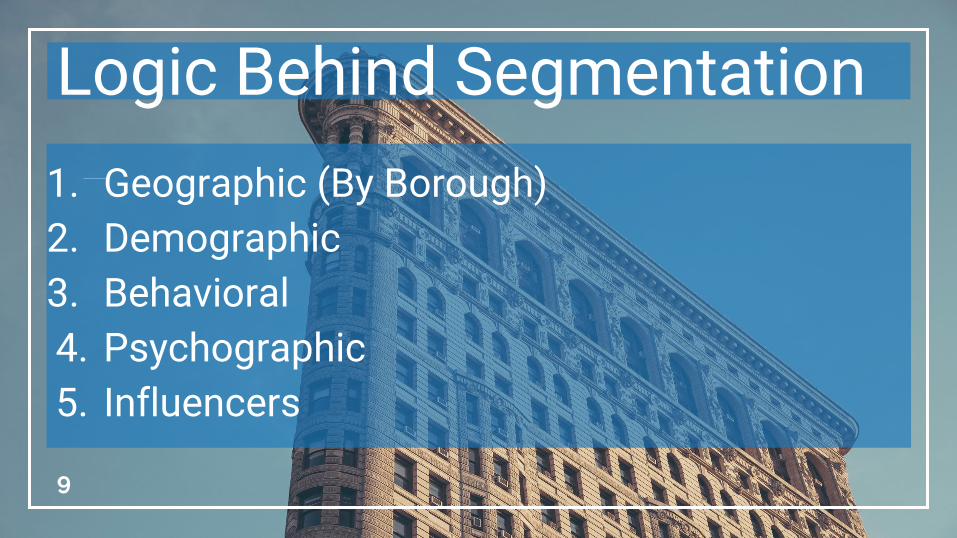
Logic Behind Segmentation1. Geographic (By Borough)2. Demographic 3. Behavioral 4. Psychographic5. Influencers
10
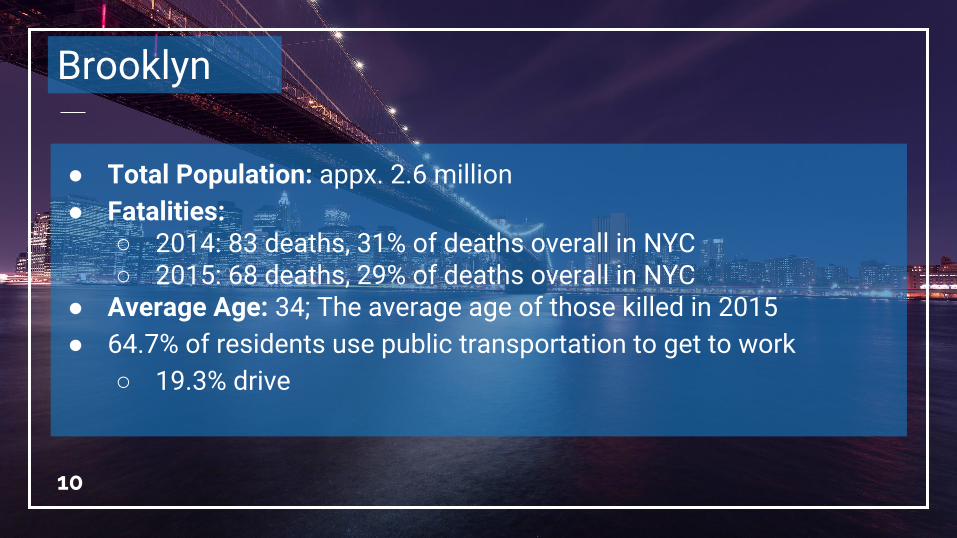
Brooklyn
● Total Population: appx. 2.6 million● Fatalities:
○ 2014: 83 deaths, 31% of deaths overall in NYC○ 2015: 68 deaths, 29% of deaths overall in NYC
● Average Age: 34; The average age of those killed in 2015● 64.7% of residents use public transportation to get to work
○ 19.3% drive
11
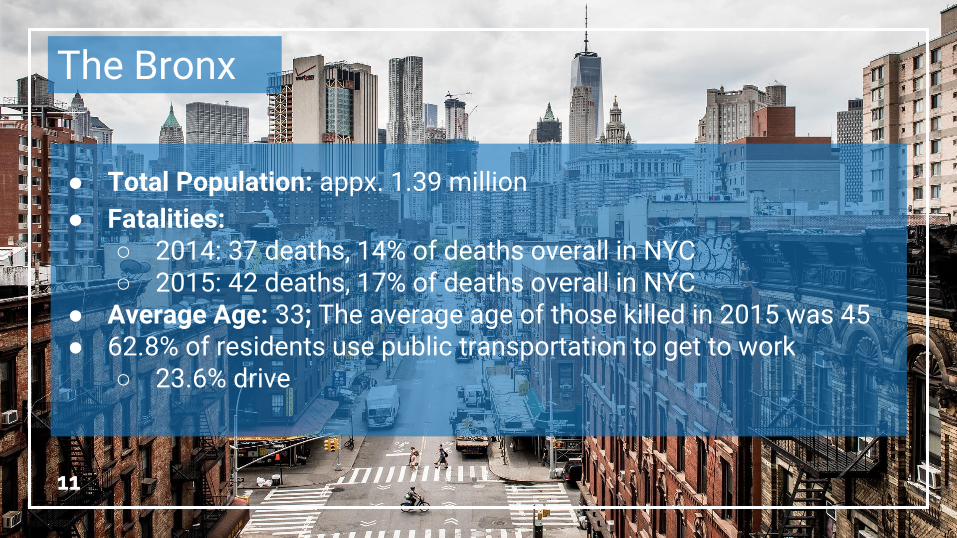
The Bronx
● Total Population: appx. 1.39 million ● Fatalities:
○ 2014: 37 deaths, 14% of deaths overall in NYC○ 2015: 42 deaths, 17% of deaths overall in NYC
● Average Age: 33; The average age of those killed in 2015 was 45● 62.8% of residents use public transportation to get to work
○ 23.6% drive
12
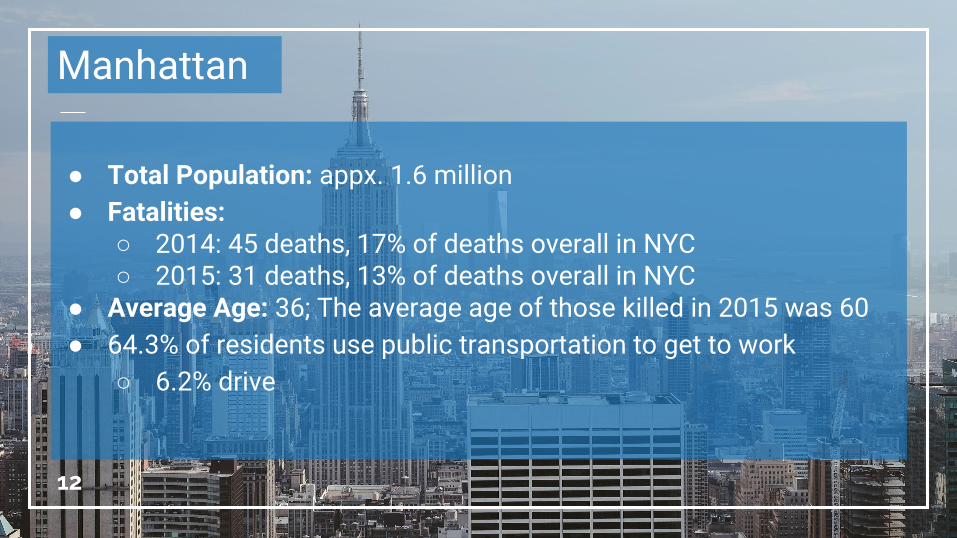
Manhattan
● Total Population: appx. 1.6 million● Fatalities:
○ 2014: 45 deaths, 17% of deaths overall in NYC○ 2015: 31 deaths, 13% of deaths overall in NYC
● Average Age: 36; The average age of those killed in 2015 was 60● 64.3% of residents use public transportation to get to work
○ 6.2% drive
13
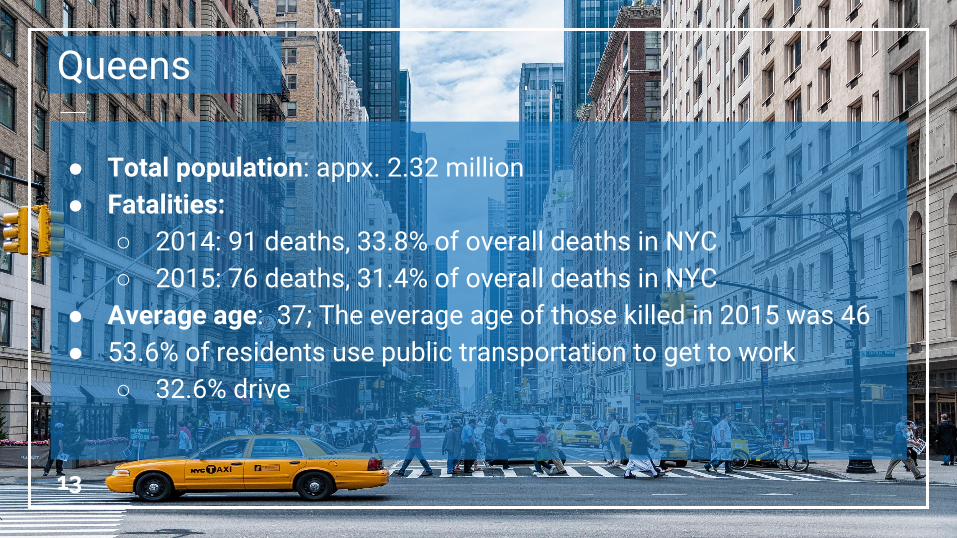
Queens
● Total population: appx. 2.32 million● Fatalities:
○ 2014: 91 deaths, 33.8% of overall deaths in NYC ○ 2015: 76 deaths, 31.4% of overall deaths in NYC
● Average age: 37; The everage age of those killed in 2015 was 46● 53.6% of residents use public transportation to get to work
○ 32.6% drive
14
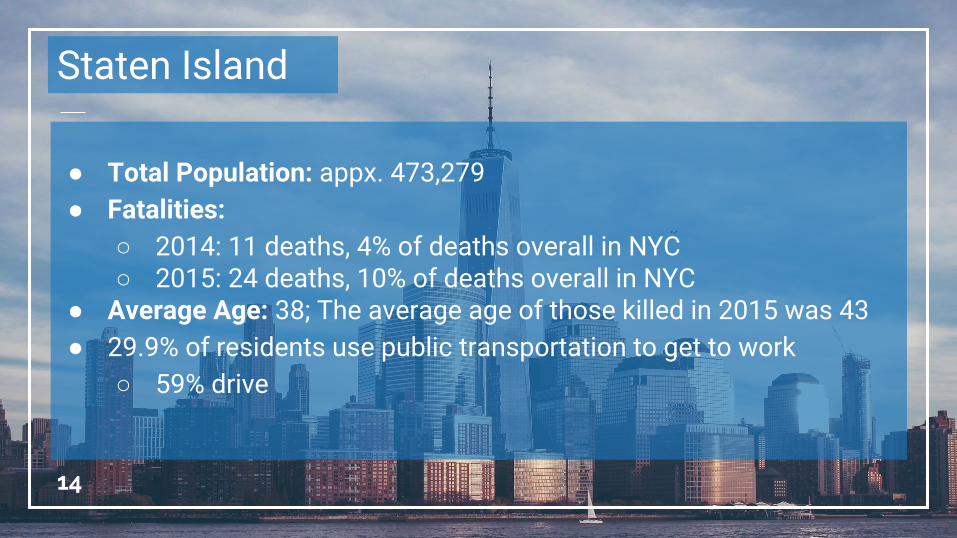
Staten Island
● Total Population: appx. 473,279● Fatalities:
○ 2014: 11 deaths, 4% of deaths overall in NYC○ 2015: 24 deaths, 10% of deaths overall in NYC
● Average Age: 38; The average age of those killed in 2015 was 43● 29.9% of residents use public transportation to get to work
○ 59% drive
15
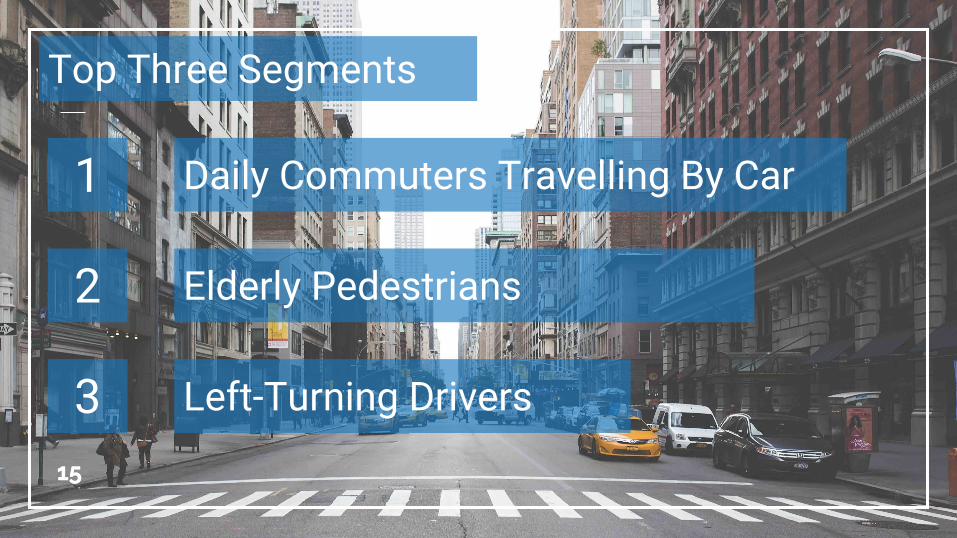
Daily Commuters Travelling By Car
Elderly Pedestrians
Left-Turning Drivers
1
2
315
Top Three Segments
16
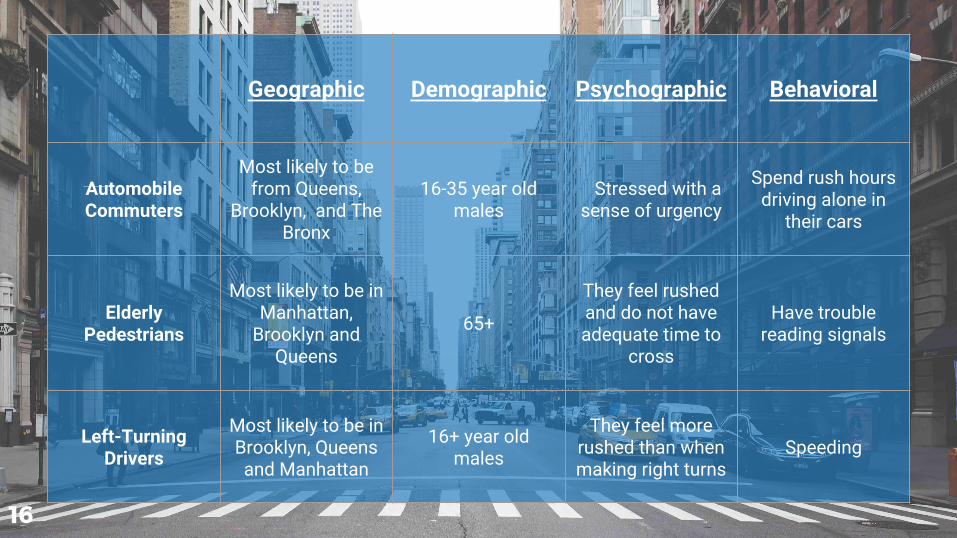
Geographic Demographic Psychographic Behavioral
Automobile Commuters
Most likely to be from Queens,
Brooklyn, and The Bronx
16-35 year old males
Stressed with a sense of urgency
Spend rush hours driving alone in
their cars
Elderly Pedestrians
Most likely to be in Manhattan,
Brooklyn and Queens
65+
They feel rushed and do not have adequate time to
cross
Have trouble reading signals
Left-Turning Drivers
Most likely to be in Brooklyn, Queens and Manhattan
16+ year old males
They feel more rushed than when making right turns
Speeding
17
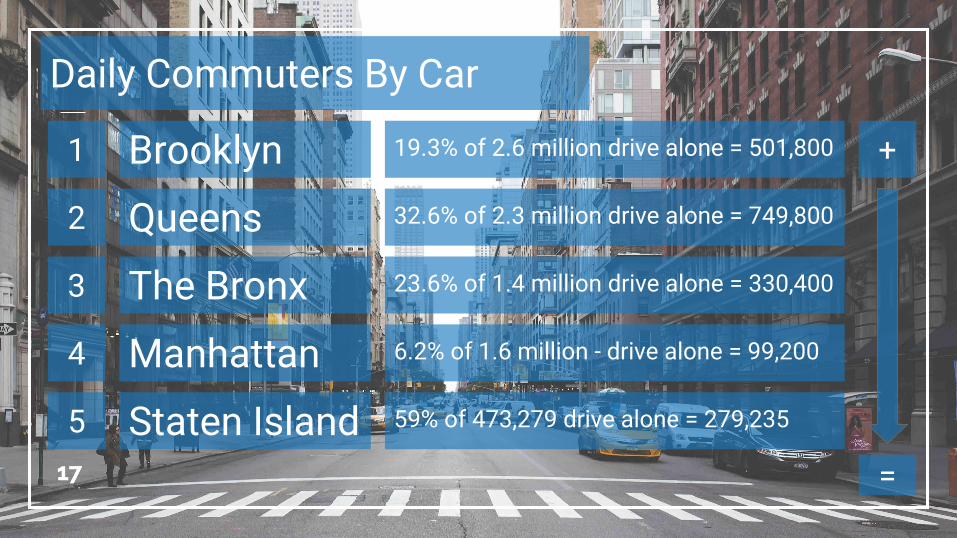
1 Brooklyn
17
Daily Commuters By Car
2
3
4
5
Queens
The Bronx
Manhattan
Staten Island
19.3% of 2.6 million drive alone = 501,800
32.6% of 2.3 million drive alone = 749,800
23.6% of 1.4 million drive alone = 330,400
6.2% of 1.6 million - drive alone = 99,200
59% of 473,279 drive alone = 279,235
+
=
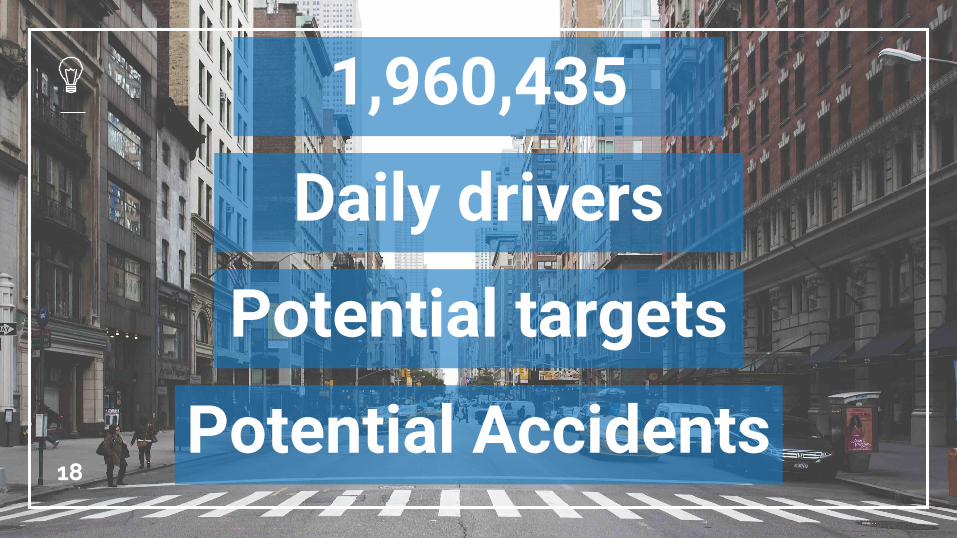
18
1,960,435
Daily drivers
Potential targets
Potential Accidents

19
KEY INSIGHTS
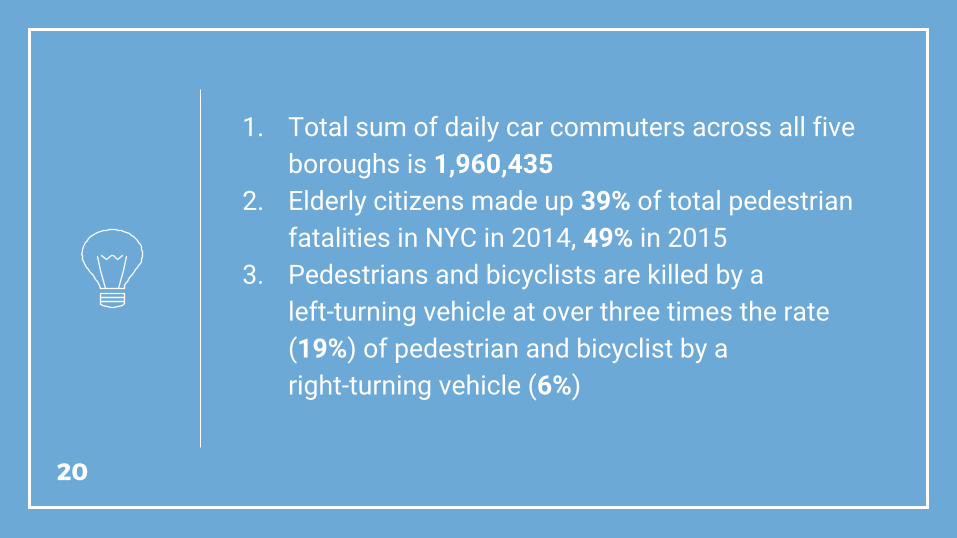
1. Total sum of daily car commuters across all five boroughs is 1,960,435
2. Elderly citizens made up 39% of total pedestrian fatalities in NYC in 2014, 49% in 2015
3. Pedestrians and bicyclists are killed by a left-turning vehicle at over three times the rate (19%) of pedestrian and bicyclist by a right-turning vehicle (6%)
20

21
Stakeholder Map
22
THE NEW YORK CITY COMMUTE

23
● New York City workers spend appx. 50 hours per week either working or commuting, giving them the longest combined workweeks in the nation
● The average New Yorker spends a little over 2 hours more commuting every week as compared to the national average
○ 6 hours and 18 minutes (NYC) vs. 4 hours and 11 minutes (Nat Av.)
● Less well-paid employees typically have the longest commutes
THE NEW YORK CITY COMMUTE
24
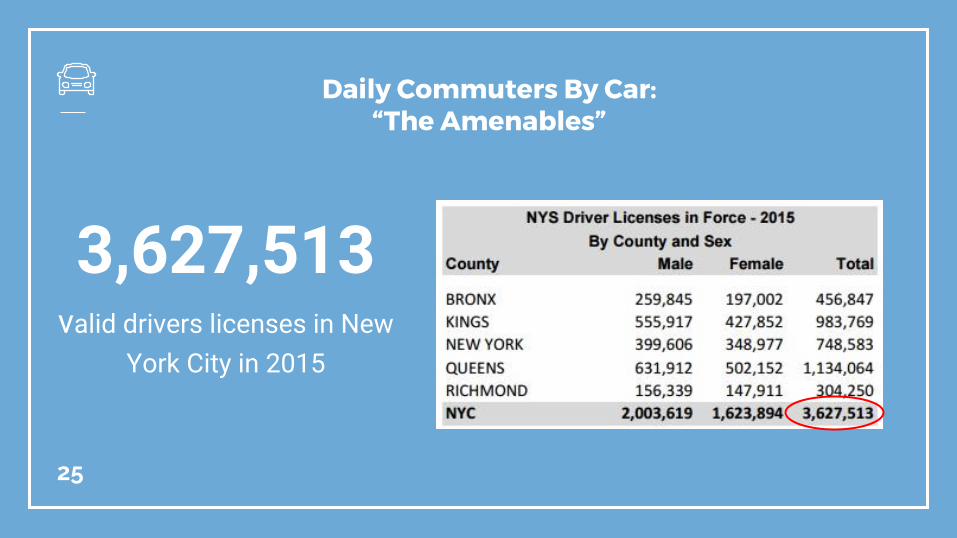
Daily Commuters By Car: “The Amenables”
Daily Commuters By Car: “The Amenables”
3,627,513
valid drivers licenses in New York City in 2015
25
Geographic
26
Traveling within the five boroughs of NYC
from Queens, Brooklyn, or The Bronx
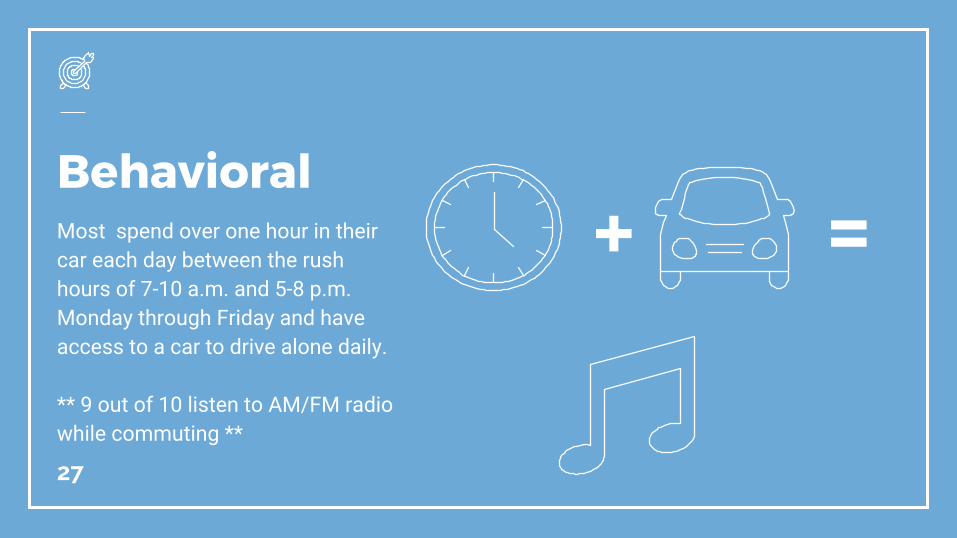
Behavioral
27
Most spend over one hour in their car each day between the rush hours of 7-10 a.m. and 5-8 p.m. Monday through Friday and have access to a car to drive alone daily.
** 9 out of 10 listen to AM/FM radio while commuting **
+ =
Psychographic
28
Commuters have a goal in mind and a sense of urgency; They are either headed to work for a specific time or eager to get home after a long day, most likely fatigued and less alert
- State of minds are extremely susceptible to external factors
Demographic
29
Males between the ages of 16-35
years old
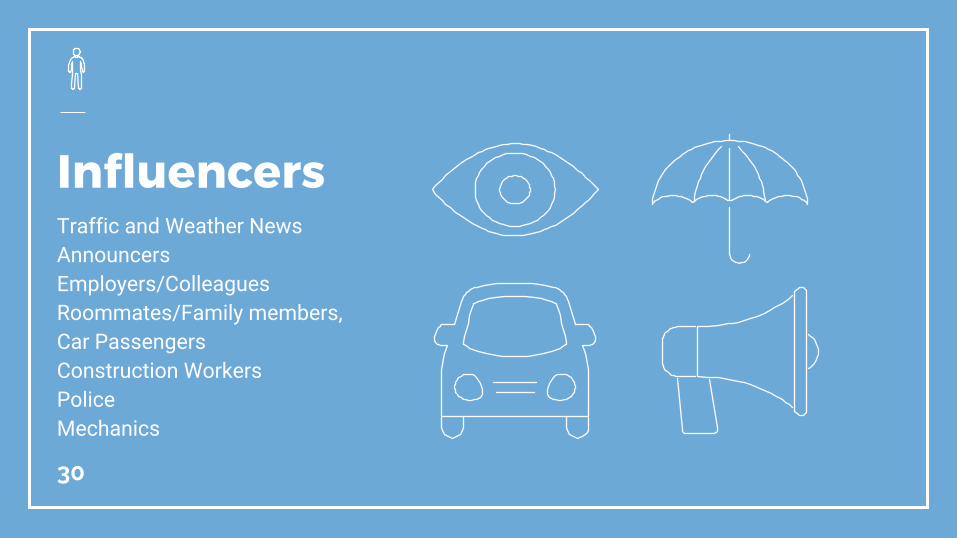
Influencers
30
Traffic and Weather News AnnouncersEmployers/ColleaguesRoommates/Family members, Car PassengersConstruction WorkersPoliceMechanics
31
ISSUES WITH DRIVING
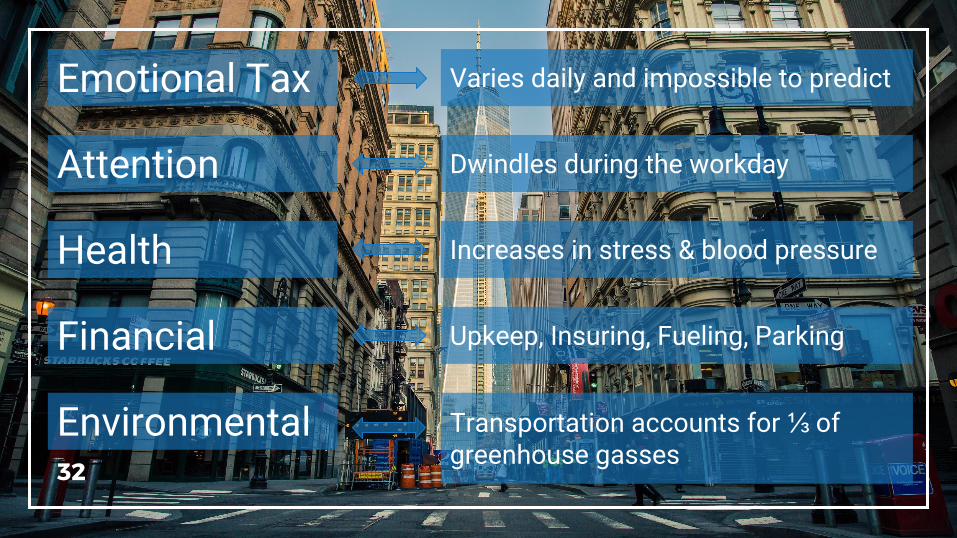
32
Emotional Tax Varies daily and impossible to predict
Attention
Health
Financial
Environmental
Dwindles during the workday
Increases in stress & blood pressure
Upkeep, Insuring, Fueling, Parking
Transportation accounts for ⅓ of greenhouse gasses
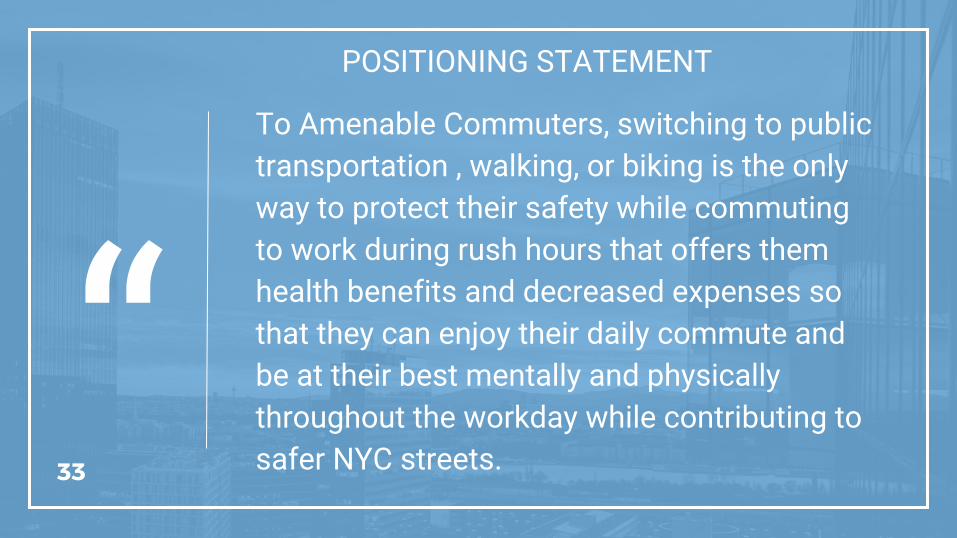
To Amenable Commuters, switching to public transportation , walking, or biking is the only way to protect their safety while commuting to work during rush hours that offers them health benefits and decreased expenses so that they can enjoy their daily commute and be at their best mentally and physically throughout the workday while contributing to safer NYC streets.33
POSITIONING STATEMENT
“
34
LIVE YOUR EMPIRE STATE
OF MIND

35
Communication Strategy and Media Channels
Core Message: Live your dream in the Empire State
Billboards Corporate Eblasts
Targeted Facebook Ads
Radio Advertisements
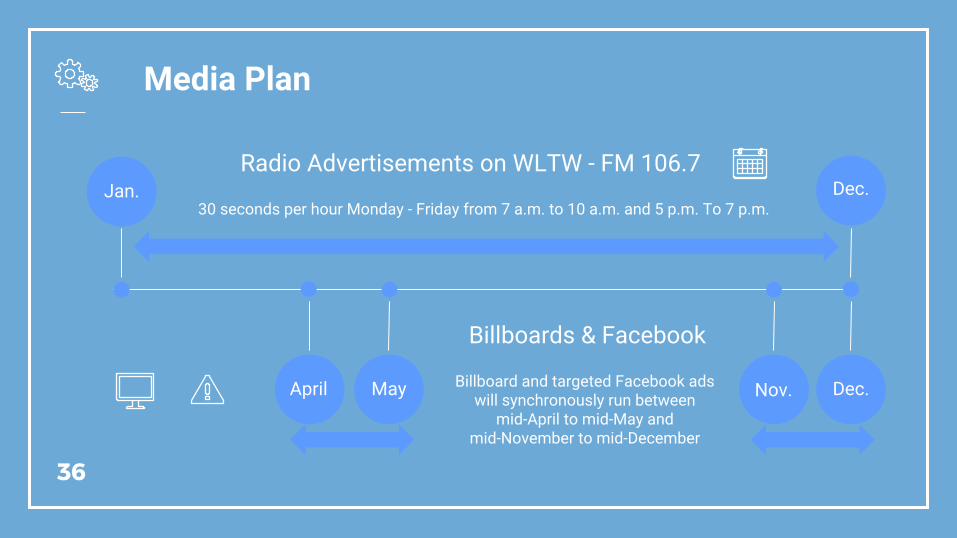
Media Plan
36
Jan.30 seconds per hour Monday - Friday from 7 a.m. to 10 a.m. and 5 p.m. To 7 p.m.
Dec.
April Nov.May Dec.
Billboards & Facebook
Radio Advertisements on WLTW - FM 106.7
Billboard and targeted Facebook ads will synchronously run between
mid-April to mid-May and mid-November to mid-December
37
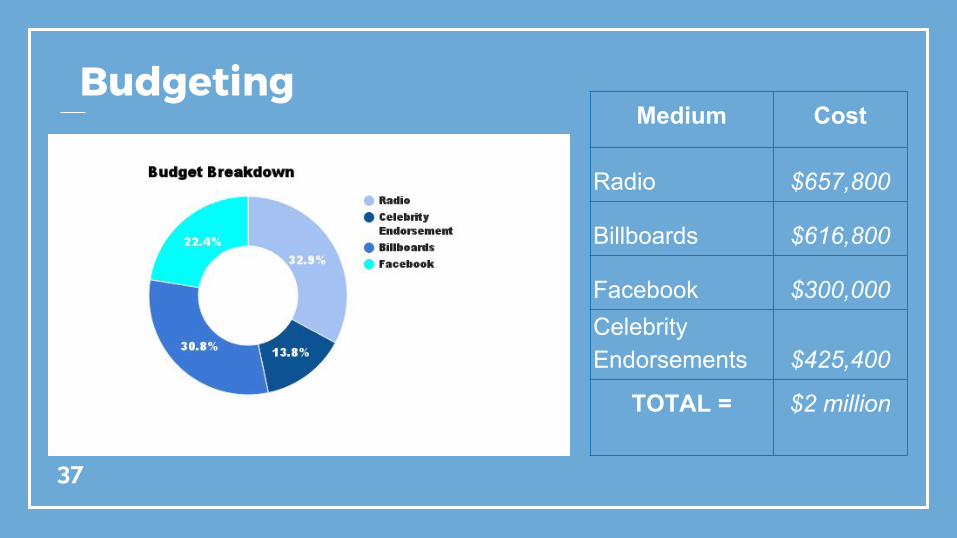
Medium Cost
Radio $657,800
Billboards $616,800
Facebook $300,000Celebrity Endorsements $425,400
TOTAL = $2 million
Budgeting
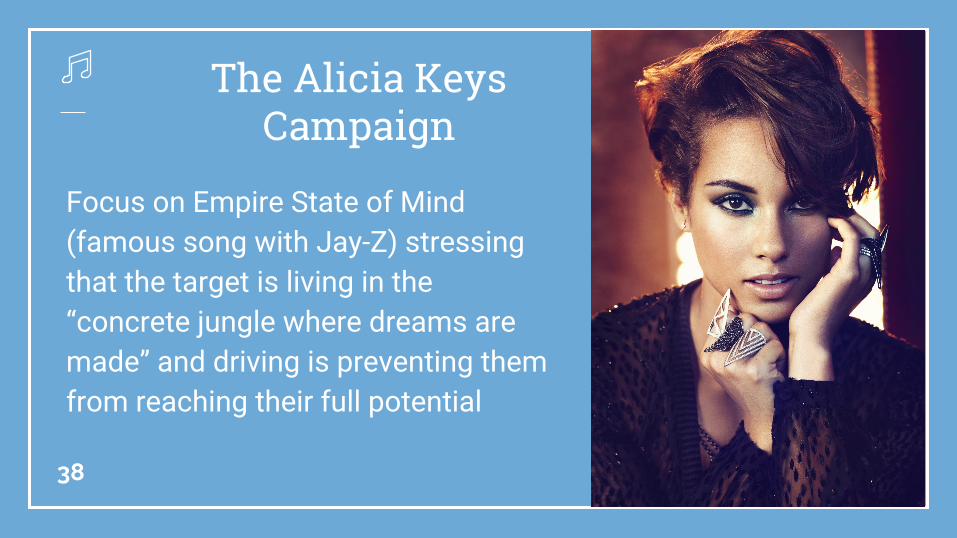
The Alicia Keys Campaign
38
Focus on Empire State of Mind (famous song with Jay-Z) stressing that the target is living in the “concrete jungle where dreams are made” and driving is preventing them from reaching their full potential
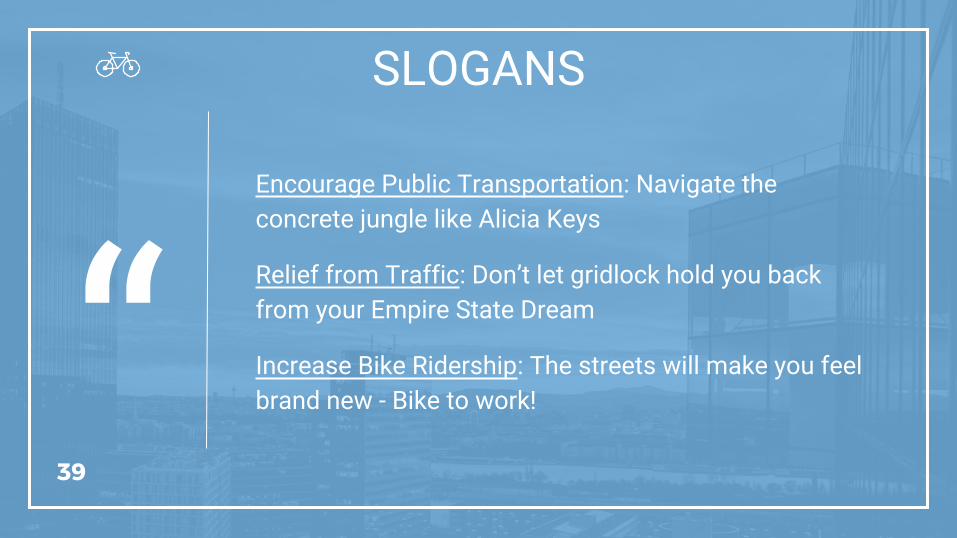
Encourage Public Transportation: Navigate the concrete jungle like Alicia Keys
Relief from Traffic: Don’t let gridlock hold you back from your Empire State Dream
Increase Bike Ridership: The streets will make you feel brand new - Bike to work!
39
SLOGANS
“

40“
Protect your Empire State of Mind - let go of the wheel
41
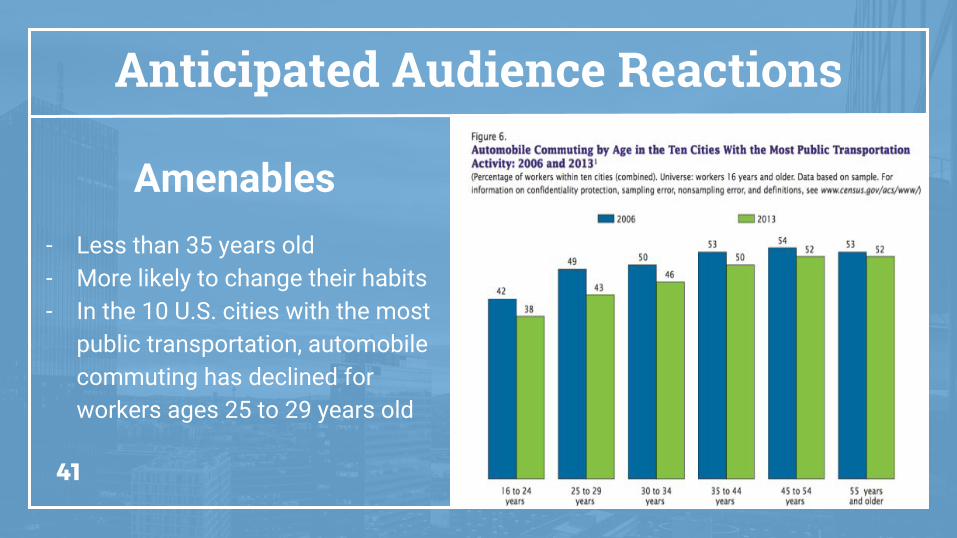
Anticipated Audience Reactions
Amenables- Less than 35 years old- More likely to change their habits- In the 10 U.S. cities with the most
public transportation, automobile commuting has declined for workers ages 25 to 29 years old
42
We strongly believe that if our target segment amends their behavior, traffic fatalities will
decrease by 20% in 2017
43
THANK YOU

44
Contact
Columbia University School of Professional StudiesM.S. Strategic Communication
45
Sourceshttp://www.streetsblog.org/2016/09/15/dots-5-year-plan-faster-buses-smarter-parking-5-boro-citi-bike-lots-more/https://project.wnyc.org/traffic-deaths/http://www.vzv.nyc/ https://suburbanstats.org/population/new-york/how-many-people-live-in-bronx-countyhttp://www.nycedc.com/sites/default/files/filemanager/Resources/Economic_Data/borough_update/July_2016_Bronx_Borough_Update.pdfhttp://www.nycedc.com/sites/default/files/filemanager/Resources/Economic_Data/borough_update/May_2016_Manhattan_Borough_Report.pdfhttps://project.wnyc.org/traffic-deaths-2015/#152-ben-jonehttp://www.nycdotplan.nyc/PDF/Strategic-plan-2016.pdf https://goo.gl/ds368Vhttps://project.wnyc.org/traffic-deaths-2015/http://www.nycedc.com/resource/borough-trends-insightshttps://dmv.ny.gov/statistic/2015licinforce-web.pdf http://comptroller.nyc.gov/wp-content/uploads/documents/Longest_Work_Weeks_March_2015.pdfhttp://www.pewsocialtrends.org/2006/08/01/ii-who-likes-to-drive-who-doesnt-and-why/https://www.census.gov/hhes/commuting/files/2014/acs-32.pdfhttps://nycfuture.org/data/fast-city-slow-commute
46
Sources Cont.http://www.nycedc.com/blog-entry/new-york-commutehttp://www.sciencedirect.com/science/article/pii/S1369847814001107http://www.streetsblog.org/2011/04/06/new-yorks-car-ownership-rate-is-on-the-rise/http://www.edisonresearch.com/hacking-commuter-code-really-happens-commuters-driving/http://www.mediapost.com/publications/article/274139/90-of-car-commuters-are-listening-to-the-radio.htmlhttps://www1.nyc.gov/site/dca/about/commuter-benefits-FAQs.pagehttp://usj.sagepub.com/content/51/3/526)http://www.nytimes.com/2016/03/01/science/age-when-american-women-have-children.htmlhttp://usa.streetsblog.org/2016/04/25/are-millennials-racing-to-buy-cars-again-nope/http://www.scienceofrelationships.com/home/2014/1/2/longer-commutes-linked-to-higher-likelihood-of-divorce.htmlhttp://fitsmallbusiness.com/how-much-does-facebook-advertising-cost/http://www.lamar.com/NYC/InventoryBrowserhttp://time.com/money/3983717/millennial-car-leasing/http://www.slate.com/blogs/moneybox/2015/08/14/census_commuting_report_young_people_in_cities_are_driving_less_and_biking.html

47
Sources Cont.WME, Alicia Keys’ Management Agency Dave Wirtschafter - Contact Information: (310)-285-9000WLTW - FM 106.7 Business and Advertising Representative “Hudson”: 1-844-289-7234

48
Photo Sourceshttps://pixabay.com/en/usa-manhattan-new-york-1777986/https://pixabay.com/en/architecture-buildings-city-1866845/https://pixabay.com/en/world-trade-center-new-york-1210003/https://stocksnap.io/photo/KR3ABECS2Ihttps://www.pexels.com/photo/city-road-street-buildings-1440/https://www.pexels.com/photo/new-york-city-city-street-cars-30360/https://www.pexels.com/photo/sky-sunset-landmark-water-37010/https://static.pexels.com/photos/25193/pexels-photo.jpghttps://static.pexels.com/photos/6573/pexels-photo.jpeghttps://pixabay.com/en/usa-new-york-manhattan-1777994/https://static.pexels.com/photos/27031/pexels-photo-27031.jpghttps://static.pexels.com/photos/4097/city-cars-traffic-lights.jpeghttps://static.pexels.com/photos/165888/pexels-photo-165888.jpeghttps://static.pexels.com/photos/23865/pexels-photo.jpg

49
Photo Sources Cont.https://static.pexels.com/photos/1300/city-marketing-lights-night.jpghttps://static.pexels.com/photos/2773/city-skyline-skyscrapers-top.jpghttps://static.pexels.com/photos/1188/city-landmark-lights-night.jpghttps://static.pexels.com/photos/35170/pexels-photo.jpghttps://static.pexels.com/photos/2752/city-sunny-people-street.jpg