VIRTUS INVESTMENT PARTNERS 2015 ANNUAL REPORT · VIRTUS INVESTMENT PARTNERS | 2015 ANNUAL REPORT....
117
2015 ANNUAL REPORT COMBINED CAPABILITIES VIRTUS INVESTMENT PARTNERS | 2015 ANNUAL REPORT
Transcript of VIRTUS INVESTMENT PARTNERS 2015 ANNUAL REPORT · VIRTUS INVESTMENT PARTNERS | 2015 ANNUAL REPORT....

2015 ANNUAL REPORT
C O M B I N E D C A P A B I L I T I E S
VIR
TU
S IN
VE
ST
ME
NT
PA
RT
NE
RS
| 20
15
AN
NU
AL
RE
PO
RT

Security ListingThe common stock of Virtus Investment Partners, Inc. is traded on the NASDAQ Global Market under the symbol “VRTS.”
Transfer Agent and RegistrarFor information or assistance regarding your account, please contact our transfer agent and registrar:
Virtus Investment Partners c/o Broadridge Corporate Issuer Solutions, Inc. P.O. Box 1342 Brentwood NY 11717
Toll-free (within U.S.): 866-205-7273 Foreign Shareowners: 413-775-6091
Web Site: https://shareholder.broadridge.com/VRTS
E-mail: [email protected]
Annual Meeting of ShareholdersAll shareholders are invited to attend the annual meeting of Virtus Investment Partners on Wednesday, May 25, 2016 at 10:30 a.m. EDT at the company’s offices, 100 Pearl Street, 2nd Floor, Hartford, CT.
For More InformationTo receive additional information about Virtus Investment Partners and access to other shareholder services, visit Investor Relations in the “About Us” section of our Web site at www.virtus.com, or contact us at:
Virtus Investment Partners, Inc. Investor Relations 100 Pearl Street Hartford, CT 06103 Telephone: 800-248-7971 (Option 2) Fax: 413-774-1714 e-mail: [email protected]
2015 2014 Change
Revenue $382.0 $450.6 (15)%
Revenue, as Adjusted1 $295.0 $337.2 (13)%
Operating Expenses $301.6 $319.9 (6)%
Operating Expenses, as Adjusted $186.7 $186.7 –
Operating Income $80.4 $130.7 (39)%
Operating Income, as Adjusted1 $108.3 $150.5 (28)%
Net Income attributable to common stockholders,
as Adjusted1 $67.8 $93.9 (28)%
Net Income attributable to common stockholders $35.1 $97.7 (64)%
Operating Margin 21% 29%
Operating Margin, as Adjusted1 37% 45%
Earnings per Share – Diluted, as Adjusted $7.57 $10.10 (25)%
Weighted Average Shares Outstanding - 8,960 9,292 (4)%
Diluted (in thousands)
Ending Assets Under Management $47,385.3 $56,702.4 (16)%
By product (12/31/2015) Open-End Mutual Funds $28,882.1 61.0% 74.1% Closed-End Mutual Funds 6,222.3 13.1% Exchange Traded Funds 340.8 0.7% Separately Managed Accounts2 6,784.4 14.3% Institutional Products2 5,155.7 10.9% Total $47,385.3
By asset class (12/31/2015) Equity $28,314.9 59.8% Fixed Income 15,115.6 31.9% Alternatives 3 3,468.7 7.3% Other4 486.10 1.0% Total $47,385.3 100%
Summary of Operations (Dollars in millions, except per share data)
Per Share Data
Assets Under Management (in millions)
• Open-End Mutual Funds $28,882.1
• Closed-End Mutual Funds 6,222.3
• Exchange Traded Funds 340.8
• Separately Managed Accounts2 6,784.4
• Institutional Products2 5,155.7
TOTAL $47,385.3
• Equity $28,314.9
• Fixed Income 15,115.6
• Alternatives3 3,468.7
• Other4 486.1
TOTAL $47,385.3
By Product (12/31/2015)
By Asset Class (12/31/2015)
Affiliated Companies
Duff & Phelps Investment Management Co. 200 S. Wacker Drive, Suite 500 Chicago, Illinois 60606
312-263-2610
Euclid Advisors LLC 1540 Broadway New York, NY 10036
646-376-5913
Kayne Anderson Rudnick Investment Management, LLC 1800 Avenue of the Stars, Second Floor Los Angeles, California 90067
800-231-7414
Newfleet Asset Management, LLC 100 Pearl Street Hartford, CT 06103
860-760-5828
Rampart Investment Management Co., LLC One International Place Boston, Massachusetts 02110
617-342-6900
Virtus ETF Solutions 1540 Broadway New York, NY 10036
888-383-0553
Zweig Advisers LLC 1540 Broadway New York, NY 10036
800-272-2700
SHAREHOLDER INFORMATION
For more information on the Virtus Mutual Funds or other products, call your financial representative or visit us at www.virtus.com.
1 Certain supplemental performance measures are provided in addition to, but not as a substitute for, performance measures determined in accordance with GAAP. These supplemental measures may not be comparable to non-GAAP performance measures of other companies. “Operating Income, as Adjusted,” “Operating Margin, as Adjusted,” and “Net Income attributable to common stockholders, as Adjusted,” are supplemental non-GAAP measures that net the distribution and administration expenses against the related revenue and remove certain non-cash and other identified amounts. For our definition of these terms, as well as a reconciliation to GAAP measures, see “Reconciliation of Revenues, Operating Expenses and Operating Income on a GAAP Basis to Revenues, Operating Expenses and Operating Income, as Adjusted” in the Supplemental Financial Information, included as an attachment to this annual report after the Form 10-K.
2 Includes assets under management related to options strategies 3 Consists of long/short equity, real estate, master-limited partnerships, and other 4 Consists of option strategies This report may contain forward-looking statements within the meaning of the Private Securities Litigation Reform Act of 1995 which, by their nature, are subject to significant risks and uncertainties. Virtus Investment Partners, Inc. intends for these forward-looking statements to be covered by the safe harbor provisions of the federal securities laws relating to forward-looking statements. For a further discussion, see “Forward-Looking Statements” on page 16 of the attached Form 10-K.

To Our Fellow Shareholders,
The volatility in the financial markets in 2015 and the uneven performance of market indices reflected concerns about global growth and interest rate trends. These difficult conditions influenced investors’ confidence and behavior and created challenges for the asset management industry. The broader market environment and changing investor preferences impacted our sales and we had elevated redemptions in funds previously managed by a former subadviser, which affected assets under management and impacted financial results.
We responded to these challenges with a heightened focus on our strategic priorities and reliance on the strengths of our business model.
Investment CapabilitiesIdentifying, evaluating, and incorporating new investment capabilities and product structures into our multi-manager, multi-strategy investment model is a key component of our long-term strategy. We added strategies from current managers and new subadvisers and expanded our product offerings with the addition of exchange-traded funds.
New relationships with three well-respected asset managers allowed us to expand our offerings of strategies intended to be responsive to changing investor preferences and markets.
u Aviva Investors uses its distinctive multi-strategy and outcome-oriented investment expertise in managing the Virtus Multi-Strategy Target Return Fund. The fund’s benchmark-agnostic strategy is intended to provide the long-term average return of global equities with less risk than many traditional asset allocation techniques.
u Dorsey, Wright & Associates provides its Relative Strength price momentum technical analysis for our Trend Funds, which employ rules-based strategies that can invest in cash equivalents, as market conditions dictate, to seek to avoid large losses during major declines.
u Dimensional Fund Advisors’ innovative approach to investing for retirement was implemented in 10 Virtus DFA Target Date Retirement Income Funds that are intended to help individuals as they prepare for retirement by managing the risks that may affect their income streams later in life.
The investment capabilities of our affiliated managers were leveraged for three new strategies introduced in open-end mutual funds:
u The Virtus Credit Opportunities Fund, managed by Newfleet Asset Management, is a portfolio of high-conviction, event-driven holdings in distressed and stressed debt, performing bonds and loans, and special situations debt.
u The Virtus Select MLP and Energy Fund is managed by Duff & Phelps Investment Management with a strategy that seeks to participate in the growth of the U.S. oil and gas infrastructure by investing in energy-related master limited partnerships (MLPs) and general partnerships.
Mark C. Treanor ChairmanBoard of Directors
MESSAGE TO SHAREHOLDERS
| 1 |
George R. Aylward President & Chief Executive Officer

u The Virtus Essential Resources Fund, managed by Kleinwort Benson Investors International, targets investments in companies that seek to address global needs for vital natural resources such as water, food, and energy.
We expanded our product capabilities by introducing exchange-traded funds through the acquisition of a majority interest in Virtus ETF Solutions, formerly ETF Issuer Solutions. The company is a platform for listing, operating and distributing exchange-traded funds with a business model comparable to our approach of offering compelling investment strategies from boutique managers, including our affiliates. ETF assets grew from $78 million at closing to $341 million at year-end, supported by the introduction of the Newfleet Multi-Sector Unconstrained Bond ETF.
Investment PerformanceAn important determinant in long-term market acceptance of our investment strategies is the continued strong relative performance of our product offerings, particularly open-end mutual funds.
Thirty of our 39 rated mutual funds – representing 90 percent of rated open- end mutual fund assets – were in 5-, 4- and 3-star Morningstar-rated funds (on a load-waived basis), with 19 of the funds – representing 79 percent of rated fund AUM – having 5 or 4 stars at December 31, 2015.
This strong relative performance encompasses strategies across all asset classes and styles, including our 5-star funds: Low Duration Income, Multi-Sector Short Term Bond and Tax-Exempt Bond managed by Newfleet Asset Management; quality-oriented Mid-Cap Core and Small-Cap Sustainable Growth from Kayne Anderson Rudnick Investment Management; Emerging Markets Opportunities, managed by the team at Vontobel Asset Management; and Global Real Estate Securities, managed by Duff & Phelps Investment Management, which also was honored with a Lipper Fund Award for its consistent relative performance in its asset category over a three-year period.1
Thirty of our 39 rated
mutual funds – representing
90 percent of rated
open-end mutual fund
assets – were in 5-, 4-
and 3-star Morningstar-
rated funds
-60%
540%
1140%
1740%
2340%
1/2/09
6/2/09
11/2/
09
4/2/10
9/2/10
2/2/11
7/2/11
12/2/
11
5/2/12
10/2/
12
3/2/13
8/2/13
1/2/14
6/2/14
11/2/
14
4/2/15
9/2/
15
12/3
/15
VRTS S&P Peer Group Composite
STOCK COMPARATIVE Virtus - S&P 500 - Peer Companies Change From 1/2/09 Open to 12/31/15 Close
Peer Group: Affiliated Managers Group, AllianceBernstein Holding, Artisan Partners, BlackRock, Calamos, Cohen & Steers, Diamond Hill, Eaton Vance, Federated Investors, Franklin Resources, GAMCO Investors, Invesco, Janus, Legg Mason, Manning & Napier, Pzena, T. Rowe Price, U.S. Global Investors, Waddell & Reed, Westwood Holdings
MESSAGE TO SHAREHOLDERS
VIRTUS – S&P 500® – PEER COMPOSITE2
Change from January 2, 2009 open to December 31, 2015 close
1 Additional information about fund ratings is included as an attachment to this annual report after the Form 10-K.
2 The list of peer asset management companies is included as an attachment to this annual report after the Form 10-K.
| 2 |

| STRATEGIC PRIORITIES |
u Maintain a highly differentiated set of quality investment strategies in a variety of product structures from boutique managers and solution providers
u Increase market share in existing channels and develop opportunities in new channels
u Provide shared business support services that maximize the effectiveness and leveragability of the business
u Attract and retain the right talent to support and grow the business
u Optimize the business model and capital structure to best position the firm for growth and the creation of long-term shareholder value
DistributionA core principle of our multi-manager model is our ability to provide distribution partners a single-point-of-access to a broad array of distinctive investment strategies.
The volatile market environment and shifting investor preferences were among the factors that pressured sales, increased redemptions and contributed to lower assets.
u Total sales were $12.7 billion with net flows of $(6.3) billion, compared with $15.2 billion and $(1.2) billion, respectively, in 2014.
u Open-end mutual fund sales were $10.0 billion which, despite being lower than 2014, represented an annual sales rate of 27 percent. Net flows were $(7.0) billion, of which $(6.6) billion were related to funds managed by an unaffiliated subadviser that was terminated during the year.
u Institutional product sales increased by 55 percent to $1.0 billion, primarily related to growth in subadvised strategies.
u Separately managed accounts, principally Kayne Anderson Rudnick’s quality- oriented equity strategies, had sales of $1.3 billion for the year.
u Assets under management were $47.4 billion at December 31, 2015 compared with $56.7 billion at December 31, 2014, reflecting net outflows and $2.2 billion of negative market performance. Mutual fund assets were $28.9 billion compared with $37.5 billion for the respective periods.
Financial ResultsThe decline in assets affected revenues and profitability. Total revenues were $382.0 million compared with $450.6 million in 2014. Operating income, as adjusted – the non-GAAP performance measure that we believe best illustrates the ongoing operating earnings of the company – was $108.3 million with a related margin of 37 percent, compared with $150.5 million and a related margin of 45 percent in 2014. Operating income, the comparable GAAP metric, was $80.4 million, compared with $130.7 million in 2014, impacted by a $16.5 million charge related to the resolution of a regulatory matter stemming from our relationship with the terminated unaffiliated subadviser.
Net income attributable to common shareholders, as adjusted, was $67.8 million or $7.57 per share compared with $93.9 million or $10.10 per share in 2014.3
Capital and Balance SheetOur capital management strategy has three fundamental goals: provide operating flexibility to manage the company, particularly in difficult market conditions; invest in growth opportunities; and return a meaningful level of capital to shareholders. We successfully executed on each of these elements in 2015.
u Cash and investments were $421.5 million, or $50 on a per-share basis, with working capital of $71.8 million at December 31, 2015. We maintained a debt-free balance sheet and had $75 million of unused capacity on our credit facility.
MESSAGE TO SHAREHOLDERS
| 3 |
3 The reconciliation of non-GAAP measures to GAAP measures is included as an attachment to this annual report after the Form 10-K.
u Investments in growth opportunities included the introduction of mutual funds and the seeding of investment strategies. Our seed capital investments were $273.7 million at year-end, reflecting $49.2 million of net seed activity.
u We significantly increased the level of capital returned to shareholders through share repurchases, cash dividends, and net settlements of share grants. The $101.1 million returned in 2015 was a 64 percent increase over 2014 levels. As a result of repurchases and net settlements, outstanding shares declined by 6.4 percent. We also increased our share repurchase authorization by 1.5 million shares.
Positioning for the FutureWe believe our diversified and strong-performing product offerings will continue to be attractive to investors, particularly as the investment landscape changes and investors’ needs evolve.
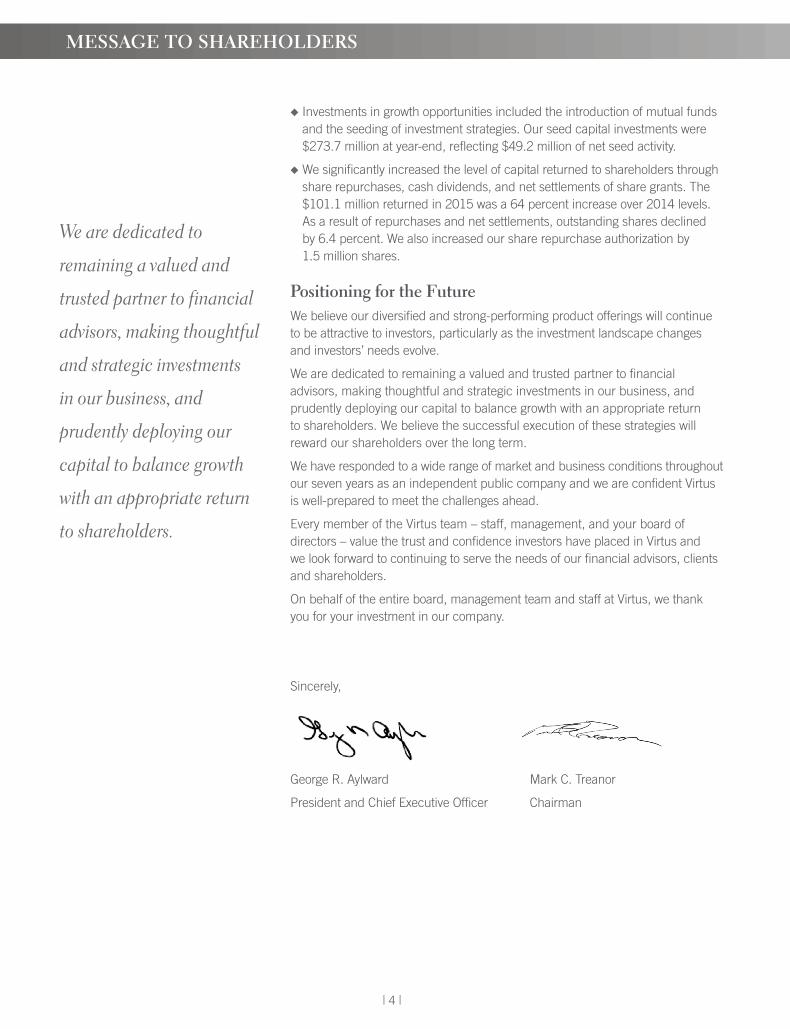
We are dedicated to remaining a valued and trusted partner to financial advisors, making thoughtful and strategic investments in our business, and prudently deploying our capital to balance growth with an appropriate return to shareholders. We believe the successful execution of these strategies will reward our shareholders over the long term.
We have responded to a wide range of market and business conditions throughout our seven years as an independent public company and we are confident Virtus is well-prepared to meet the challenges ahead.
Every member of the Virtus team – staff, management, and your board of directors – value the trust and confidence investors have placed in Virtus and we look forward to continuing to serve the needs of our financial advisors, clients and shareholders.
On behalf of the entire board, management team and staff at Virtus, we thank you for your investment in our company.
Sincerely,
George R. Aylward Mark C. Treanor
President and Chief Executive Officer Chairman
MESSAGE TO SHAREHOLDERS
We are dedicated to
remaining a valued and
trusted partner to financial
advisors, making thoughtful
and strategic investments
in our business, and
prudently deploying our
capital to balance growth
with an appropriate return
to shareholders.
| 4 |

MESSAGE TO SHAREHOLDERS
George R. AylwardPresident and Chief Executive OfficerVirtus Investment Partners
James R. Baio (1, 2)
Chief Financial Officer, Treasurer and Executive Vice President (Retired)Franklin Templeton Investments
Diane M. Coffey (2, 3)
Managing Director and PartnerPeter J. Solomon Company, Ltd.
Susan S. Fleming, Ph.D. (3, 4)
Consultant, Executive Educator andSenior Lecturer, Cornell University
Timothy A. Holt (3, 4)
Senior Vice President and Chief Investment Officer (Retired)Aetna, Inc.
Melody L. Jones (1, 2)
Chief Administrative OfficerCEB
Russel C. Robertson Executive Vice President and Head, Anti-Money LaunderingBMO Financial Group
BOARD OF DIRECTORS
Edward M. Swan, Jr. (1, 4)
President (Retired)FIS Group
Mark C. Treanor (2, 3)
Non-Executive Chairman of the Board of DirectorsSenior Partner (Retired)Treanor, Pope & Hughes
Stephen T. Zarrilli (1, 4)
President and Chief Executive OfficerSafeguard Scientifics, Inc.
Board Committees1 Audit2 Compensation3 Governance 4 Risk and Finance
Note: Ms. Coffey and Mr. Swan will retire as directors as of the 2016 Annual Meeting
From left: Stephen T. Zarrilli, Russel C. Robertson, Diane M. Coffey, George R. Aylward, Mark C. Treanor, James R. Baio, Susan S. Fleming, Timothy A. Holt, Melody L. Jones, Edward M. Swan, Jr.
| 5 |

George R. AylwardPresident, Chief Executive Officer and Director
Michael A. AngerthalExecutive Vice PresidentChief Financial Officer and Treasurer
W. Patrick BradleyExecutive Vice PresidentFund Services
Mark S. FlynnExecutive Vice PresidentGeneral Counsel and Corporate Secretary
Barry M. MandinachExecutive Vice PresidentHead of Distribution
Mardelle W. PeñaExecutive Vice PresidentHuman Resources
Francis G. WaltmanExecutive Vice PresidentProduct Management
PRINCIPAL CORPORATE OFFICERS
| 6 |
From left: W. Patrick Bradley, Mark S. Flynn, Michael A. Angerthal, George R. Aylward, Mardelle W. Peña, Francis G. Waltman, Barry M. Mandinach

Security ListingThe common stock of Virtus Investment Partners, Inc. is traded on the NASDAQ Global Market under the symbol “VRTS.”
Transfer Agent and RegistrarFor information or assistance regarding your account, please contact our transfer agent and registrar:
Virtus Investment Partners c/o Broadridge Corporate Issuer Solutions, Inc. P.O. Box 1342 Brentwood NY 11717
Toll-free (within U.S.): 866-205-7273 Foreign Shareowners: 413-775-6091
Web Site: https://shareholder.broadridge.com/VRTS
E-mail: [email protected]
Annual Meeting of ShareholdersAll shareholders are invited to attend the annual meeting of Virtus Investment Partners on Wednesday, May 25, 2016 at 10:30 a.m. EDT at the company’s offices, 100 Pearl Street, 2nd Floor, Hartford, CT.
For More InformationTo receive additional information about Virtus Investment Partners and access to other shareholder services, visit Investor Relations in the “About Us” section of our Web site at www.virtus.com, or contact us at:
Virtus Investment Partners, Inc. Investor Relations 100 Pearl Street Hartford, CT 06103 Telephone: 800-248-7971 (Option 2) Fax: 413-774-1714 e-mail: [email protected]
2015 2014 Change
Revenue $382.0 $450.6 (15)%
Revenue, as Adjusted1 $295.0 $337.2 (13)%
Operating Expenses $301.6 $319.9 (6)%
Operating Expenses, as Adjusted $186.7 $186.7 –
Operating Income $80.4 $130.7 (39)%
Operating Income, as Adjusted1 $108.3 $150.5 (28)%
Net Income attributable to common stockholders,
as Adjusted1 $67.8 $93.9 (28)%
Net Income attributable to common stockholders $35.1 $97.7 (64)%
Operating Margin 21% 29%
Operating Margin, as Adjusted1 37% 45%
Earnings per Share – Diluted, as Adjusted $7.57 $10.10 (25)%
Weighted Average Shares Outstanding - 8,960 9,292 (4)%
Diluted (in thousands)
Ending Assets Under Management $47,385.3 $56,702.4 (16)%
By product (12/31/2015) Open-End Mutual Funds $28,882.1 61.0% 74.1% Closed-End Mutual Funds 6,222.3 13.1% Exchange Traded Funds 340.8 0.7% Separately Managed Accounts2 6,784.4 14.3% Institutional Products2 5,155.7 10.9% Total $47,385.3
By asset class (12/31/2015) Equity $28,314.9 59.8% Fixed Income 15,115.6 31.9% Alternatives 3 3,468.7 7.3% Other4 486.10 1.0% Total $47,385.3 100%
By product (12/31/2015) Open-End Mutual Funds $28,882.1 61.0% 74.1% Closed-End Mutual Funds 6,222.3 13.1% Exchange Traded Funds 340.8 0.7% Separately Managed Accounts2 6,784.4 14.3% Institutional Products2 5,155.7 10.9% Total $47,385.3
By asset class (12/31/2015) Equity $28,314.9 59.8% Fixed Income 15,115.6 31.9% Alternatives 3 3,468.7 7.3% Other4 486.10 1.0% Total $47,385.3 100%
Summary of Operations (Dollars in millions, except per share data)
Per Share Data
Assets Under Management (in millions)
• Open-End Mutual Funds $28,882.1
• Closed-End Mutual Funds 6,222.3
• Exchange Traded Funds 340.8
• Separately Managed Accounts2 6,784.4
• Institutional Products2 5,155.7
TOTAL $47,385.3
• Equity $28,314.9
• Fixed Income 15,115.6
• Alternatives3 3,468.7
• Other4 486.1
TOTAL $47,385.3
By Product (12/31/2015)
By Asset Class (12/31/2015)
Affiliated Companies
Duff & Phelps Investment Management Co. 200 S. Wacker Drive, Suite 500 Chicago, Illinois 60606
312-263-2610
Euclid Advisors LLC 1540 Broadway New York, NY 10036
646-376-5913
Kayne Anderson Rudnick Investment Management, LLC 1800 Avenue of the Stars, Second Floor Los Angeles, California 90067
800-231-7414
Newfleet Asset Management, LLC 100 Pearl Street Hartford, CT 06103
860-760-5828
Rampart Investment Management Co., LLC One International Place Boston, Massachusetts 02110
617-342-6900
Virtus ETF Solutions 1540 Broadway New York, NY 10036
888-383-0553
Zweig Advisers LLC 1540 Broadway New York, NY 10036
800-272-2700
SHAREHOLDER INFORMATION
For more information on the Virtus Mutual Funds or other products, call your financial representative or visit us at www.virtus.com.
1 Certain supplemental performance measures are provided in addition to, but not as a substitute for, performance measures determined in accordance with GAAP. These supplemental measures may not be comparable to non-GAAP performance measures of other companies. “Operating Income, as Adjusted,” “Operating Margin, as Adjusted,” and “Net Income attributable to common stockholders, as Adjusted,” are supplemental non-GAAP measures that net the distribution and administration expenses against the related revenue and remove certain non-cash and other identified amounts. For our definition of these terms, as well as a reconciliation to GAAP measures, see “Reconciliation of Revenues, Operating Expenses and Operating Income on a GAAP Basis to Revenues, Operating Expenses and Operating Income, as Adjusted” in the Supplemental Financial Information, included as an attachment to this annual report after the Form 10-K.
2 Includes assets under management related to options strategies 3 Consists of long/short equity, real estate, master-limited partnerships, and other 4 Consists of option strategies This report may contain forward-looking statements within the meaning of the Private Securities Litigation Reform Act of 1995 which, by their nature, are subject to significant risks and uncertainties. Virtus Investment Partners, Inc. intends for these forward-looking statements to be covered by the safe harbor provisions of the federal securities laws relating to forward-looking statements. For a further discussion, see “Forward-Looking Statements” on page 16 of the attached Form 10-K.

201 FORM 10-K

UNITED STATESSECURITIES AND EXCHANGE COMMISSION
Washington, D.C. 20549
FORM 10-KÈ ANNUAL REPORT PURSUANT TO SECTION 13 OR 15(d) OF THE SECURITIES EXCHANGE ACT OF 1934
For the fiscal year ended December 31, 2015
or‘ TRANSITION REPORT PURSUANT TO SECTION 13 OR 15(d) OF THE SECURITIES EXCHANGE ACT OF 1934
For the transition period from to
Commission file number 1-10994
VIRTUS INVESTMENT PARTNERS, INC.(Exact name of registrant as specified in its charter)
Delaware 95-4191764(State or other jurisdiction of
incorporation or organization)(I.R.S. Employer
Identification No.)
100 Pearl St., Hartford, CT 06103(Address of principal executive offices)
Registrant’s telephone number, including area code(800) 248-7971
Securities registered pursuant to Section 12(b) of the Act:Title of each class Name of each exchange on which registered
Common Stock, $.01 par value The NASDAQ Stock Market LLC(including attached Preferred Share Purchase Rights)
Securities registered pursuant to Section 12(g) of the Act:None
(Title of class)
Indicate by check mark if the registrant is a well-known seasoned issuer, as defined in Rule 405 of the Securities Act. ‘ Yes È No
Indicate by check mark if the registrant is not required to file reports pursuant to Section 13 or Section 15(d) of the Exchange Act. ‘ Yes È No
Indicate by check mark whether the registrant (1) has filed all reports required to be filed by Section 13 or 15(d) of the Securities Exchange Act of 1934during the preceding 12 months (or for such shorter period that the registrant was required to file such reports), and (2) has been subject to such filingrequirements for the past 90 days. È Yes ‘ No
Indicate by check mark whether the registrant has submitted electronically and posted on its corporate Web site, if any, every Interactive Data Filerequired to be submitted and posted pursuant to Rule 405 of Regulation S-T (§232.405 of this chapter) during the preceding 12 months (or for such shorterperiod that the registrant was required to submit and post such files). È Yes ‘ No
Indicate by check mark if disclosure of delinquent filers pursuant to Item 405 of Regulation S-K (§229.405 of this chapter) is not contained herein, andwill not be contained, to the best of registrant’s knowledge, in definitive proxy or information statements incorporated by reference in Part III of thisForm 10-K or any amendment to this Form 10-K. È
Indicate by check mark whether the registrant is a large accelerated filer, an accelerated filer, a non-accelerated filer, or a smaller reporting company. Seedefinitions of “large accelerated filer,” “accelerated filer” and “smaller reporting company” in Rule 12b-2 of the Exchange Act.
Large accelerated filer È Accelerated filer ‘
Non-accelerated filer ‘ (Do not check if a smaller reporting company) Smaller reporting company ‘
Indicate by check mark whether the registrant is a shell company (as defined in Rule 12b-2 of the Act). ‘ Yes È No
The aggregate market value of the registrant’s voting and non-voting common equity held by non-affiliates computed by reference to the price at whichthe common equity was last sold (based on the closing share price as quoted on the NASDAQ Global Market) as of the last business day of the registrant’smost recently completed second fiscal quarter was $915,291,836. For purposes of this calculation, shares of common stock held or controlled by executiveofficers and directors of the registrant have been treated as shares held by affiliates.
There were 8,408,228 shares of the registrant’s common stock outstanding on February 5, 2016.
DOCUMENTS INCORPORATED BY REFERENCEPortions of the registrant’s Proxy Statement which will be filed with the SEC in connection with the 2016 Annual Meeting of Shareholders are
incorporated by reference into Part III of this Form 10-K.

Virtus Investment Partners, Inc.
Annual Report on Form 10-K for the Fiscal Year Ended December 31, 2015
Page
PART I
Item 1. Business . . . . . . . . . . . . . . . . . . . . . . . . . . . . . . . . . . . . . . . . . . . . . . . . . . . . . . . . . . . . . . . . . . . . 1Item 1A. Risk Factors . . . . . . . . . . . . . . . . . . . . . . . . . . . . . . . . . . . . . . . . . . . . . . . . . . . . . . . . . . . . . . . . . 10Item 1B. Unresolved Staff Comments . . . . . . . . . . . . . . . . . . . . . . . . . . . . . . . . . . . . . . . . . . . . . . . . . . . . 19Item 2. Properties . . . . . . . . . . . . . . . . . . . . . . . . . . . . . . . . . . . . . . . . . . . . . . . . . . . . . . . . . . . . . . . . . . . 19Item 3. Legal Proceedings . . . . . . . . . . . . . . . . . . . . . . . . . . . . . . . . . . . . . . . . . . . . . . . . . . . . . . . . . . . . 19Item 4. Mine Safety Disclosures . . . . . . . . . . . . . . . . . . . . . . . . . . . . . . . . . . . . . . . . . . . . . . . . . . . . . . . 21
PART II
Item 5. Market for the Registrant’s Common Equity, Related Stockholder Matters and IssuerPurchases of Equity Securities . . . . . . . . . . . . . . . . . . . . . . . . . . . . . . . . . . . . . . . . . . . . . . . . . . . 22
Item 6. Selected Financial Data . . . . . . . . . . . . . . . . . . . . . . . . . . . . . . . . . . . . . . . . . . . . . . . . . . . . . . . . 24Item 7. Management’s Discussion and Analysis of Financial Condition and Results of Operations . . . 25Item 7A. Quantitative and Qualitative Disclosures About Market Risk . . . . . . . . . . . . . . . . . . . . . . . . . . . 45Item 8. Financial Statements and Supplementary Data . . . . . . . . . . . . . . . . . . . . . . . . . . . . . . . . . . . . . . 45Item 9. Changes in and Disagreements with Accountants on Accounting and Financial Disclosure . . . 45Item 9A. Controls and Procedures . . . . . . . . . . . . . . . . . . . . . . . . . . . . . . . . . . . . . . . . . . . . . . . . . . . . . . . 45Item 9B. Other Information . . . . . . . . . . . . . . . . . . . . . . . . . . . . . . . . . . . . . . . . . . . . . . . . . . . . . . . . . . . . . 46
PART III
Item 10. Directors, Executive Officers and Corporate Governance . . . . . . . . . . . . . . . . . . . . . . . . . . . . . . 47Item 11. Executive Compensation . . . . . . . . . . . . . . . . . . . . . . . . . . . . . . . . . . . . . . . . . . . . . . . . . . . . . . . 47Item 12. Security Ownership of Certain Beneficial Owners and Management and Related Stockholder
Matters . . . . . . . . . . . . . . . . . . . . . . . . . . . . . . . . . . . . . . . . . . . . . . . . . . . . . . . . . . . . . . . . . . . . . 47Item 13. Certain Relationships and Related Transactions, and Director Independence . . . . . . . . . . . . . . 48Item 14. Principal Accounting Fees and Services . . . . . . . . . . . . . . . . . . . . . . . . . . . . . . . . . . . . . . . . . . . 48
PART IV
Item 15. Exhibits and Financial Statement Schedules . . . . . . . . . . . . . . . . . . . . . . . . . . . . . . . . . . . . . . . . 49
“We,” “us,” “our,” the “Company” and “Virtus,” as used in this Annual Report on Form 10-K (“AnnualReport”), refer to Virtus Investment Partners, Inc., a Delaware corporation, and its subsidiaries.

PART I
Item 1. Business.
Organization
Virtus Investment Partners, Inc. (the “Company”) commenced operations on November 1, 1995 through areverse merger with Duff & Phelps Corporation. The Company was a majority-owned subsidiary of The PhoenixCompanies, Inc. (“PNX”) from 1995 to 2001 and a wholly-owned subsidiary of PNX from 2001 until 2008. OnDecember 31, 2008, PNX distributed 100% of Virtus common stock to PNX stockholders in a spin-offtransaction.
Our Business
We are a provider of investment management and related services to individuals and institutions. We use amulti-manager, multi-style approach, offering investment strategies from affiliated managers and selectunaffiliated subadvisors, each having its own distinct investment style, autonomous investment process andindividual brand. By offering a broad array of products, we believe we can appeal to a greater number ofinvestors which allows us to have opportunities across market cycles and through changes in investorpreferences.
We provide our products in a number of forms and through multiple distribution channels. Our retailproducts include open-end mutual funds, closed-end funds, exchange traded funds, variable insurance funds,Undertakings for Collective Investments in Transferable Securities (“UCITS”) and separately managed accounts.Our open-end mutual funds and exchange traded funds are distributed through financial intermediaries. Ourclosed-end funds trade on the New York Stock Exchange, and our exchange traded funds are traded on either theNew York Stock Exchange or NASDAQ. Our variable insurance funds are available as investment options invariable annuities and life insurance products distributed by life insurance companies. Separately managedaccounts are comprised of intermediary programs, sponsored and distributed by unaffiliated brokerage firms andprivate client accounts which are offered to the high net-worth clients of one of our affiliated managers. We alsomanage institutional accounts for corporations, multi-employer retirement funds, public employee retirementsystems, foundations, endowments and as a subadviser to unaffiliated mutual funds. Our earnings are primarilydriven by asset-based fees charged for services relating to these products including investment management, fundadministration, distribution and shareholder services. These fees are based on a percentage of assets undermanagement (“AUM”) and are calculated using daily or weekly average assets, quarter-end assets or averagemonth-end assets.
Our Investment Managers
Our investment management services are provided by investment managers who are registered investmentadvisers under the Investment Advisers Act of 1940, as amended (the “Investment Advisers Act”). Theinvestment managers are responsible for portfolio management activities for our retail and institutional productsoperating under advisory or subadvisory agreements. We provide our affiliated managers with distribution,operational and administrative support, thereby allowing each affiliated manager to focus primarily oninvestment management. We also engage select unaffiliated subadvisers for certain of our open-end mutual fundsand exchange traded funds. At December 31, 2015, $12.7 billion or 26.8% of our assets under management weremanaged by unaffiliated subadvisers. We monitor the quality of our managers’ services by assessing theirperformance, style, consistency and the discipline with which they apply their investment process.
1

Our affiliated investment managers and their respective assets under management, styles and strategies are as follows:
Affiliated Managers
Duff & PhelpsInvestment
Management
NewfleetAsset
Management
KayneAndersonRudnick
InvestmentManagement
Zweig/EuclidAdvisors
RampartInvestment
ManagementCliffwater
Investments
Assets UnderManagement atDecember 31, 2015($ in billions) $9.2 $10.9 $9.5 $4.3 $0.6 $0.2
Location Chicago, IL Hartford, CT Los Angeles, CA New York, NY Boston, MA Hartford, CT
Investment Style Quality-oriented,equity income;
high quality fixedincome
Multi-sector,value-drivenfixed income
Quality at areasonable
price
Growth at areasonable price,
high qualityfixed income
Systematic,disciplined
options solutions
Multi-manageralternativeportfolios
Investment TypesEquities • Utilities • Large, Mid &
Small CapCore/ Growth/Value
• Large CapCore
• Large CapCore
• Tactical AssetAllocation
• LowVolatility
• International &EmergingMarkets Small-Cap
• International
Fixed Income • TaxAdvantaged
• High GradeCore
• Municipals
• Multi-sector• Core• Core Plus• Bank Loans• High Yield• Municipals• Emerging
Markets• Structured
Products
• CaliforniaMunicipals
• U.S. GovernmentGrade Agencies
• IntermediateTotal Return &Government
• InvestmentGrade Corporates
• Sovereign
Alternative/Other • Real Estate• Infrastructure• Master
LimitedPartnerships
• OptionsStrategies
• Multi-Strategy
Products
Open-End MutualFunds ✓ ✓ ✓ ✓ ✓ ✓
Closed-End Funds ✓ ✓ ✓ ✓
Exchange tradedfunds ✓
VariableInsurance Funds ✓ ✓ ✓ ✓
UCITs ✓ ✓
SeparatelyManagedAccounts ✓ ✓ ✓
Institutional ✓ ✓ ✓ ✓ ✓
2

Our Investment Products
Our assets under management are comprised of open-end funds, closed-end funds, exchange traded funds,variable insurance funds, separately managed accounts (intermediary sponsored and private client) andinstitutional accounts (traditional institutional mandates and structured products).
Assets Under Management by Product as of December 31, 2015($ in billions)
Retail ProductsMutual fund assets
Open-end funds . . . . . . . . . . . . . . . . . . . . . . . . . . . . . . . . . . . . . . . . . . . . . . . . . . . . . . $28.9Closed-end funds . . . . . . . . . . . . . . . . . . . . . . . . . . . . . . . . . . . . . . . . . . . . . . . . . . . . . 6.2Exchange traded funds . . . . . . . . . . . . . . . . . . . . . . . . . . . . . . . . . . . . . . . . . . . . . . . . . 0.3
Total fund assets 35.4Separately managed accounts . . . . . . . . . . . . . . . . . . . . . . . . . . . . . . . . . . . . . . . . . . . . . . . 6.8
Total retail assets . . . . . . . . . . . . . . . . . . . . . . . . . . . . . . . . . . . . . . . . . . . . . . . . . . . . . . . . 42.2Total institutional assets . . . . . . . . . . . . . . . . . . . . . . . . . . . . . . . . . . . . . . . . . . . . . . . . . . 5.2
Total Assets Under Management . . . . . . . . . . . . . . . . . . . . . . . . . . . . . . . . . . . . . . . . . . . $47.4
3
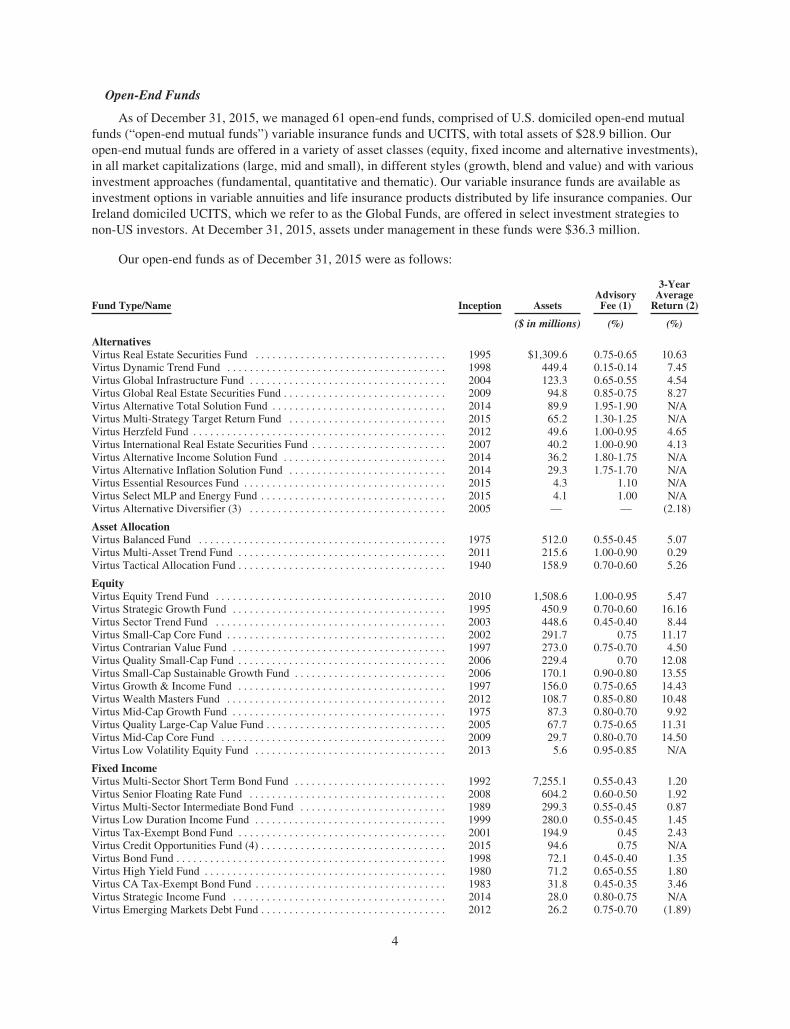
Open-End Funds
As of December 31, 2015, we managed 61 open-end funds, comprised of U.S. domiciled open-end mutualfunds (“open-end mutual funds”) variable insurance funds and UCITS, with total assets of $28.9 billion. Ouropen-end mutual funds are offered in a variety of asset classes (equity, fixed income and alternative investments),in all market capitalizations (large, mid and small), in different styles (growth, blend and value) and with variousinvestment approaches (fundamental, quantitative and thematic). Our variable insurance funds are available asinvestment options in variable annuities and life insurance products distributed by life insurance companies. OurIreland domiciled UCITS, which we refer to as the Global Funds, are offered in select investment strategies tonon-US investors. At December 31, 2015, assets under management in these funds were $36.3 million.
Our open-end funds as of December 31, 2015 were as follows:
Fund Type/Name Inception AssetsAdvisoryFee (1)
3-YearAverage
Return (2)
($ in millions) (%) (%)
AlternativesVirtus Real Estate Securities Fund . . . . . . . . . . . . . . . . . . . . . . . . . . . . . . . . . . 1995 $1,309.6 0.75-0.65 10.63Virtus Dynamic Trend Fund . . . . . . . . . . . . . . . . . . . . . . . . . . . . . . . . . . . . . . . 1998 449.4 0.15-0.14 7.45Virtus Global Infrastructure Fund . . . . . . . . . . . . . . . . . . . . . . . . . . . . . . . . . . . 2004 123.3 0.65-0.55 4.54Virtus Global Real Estate Securities Fund . . . . . . . . . . . . . . . . . . . . . . . . . . . . . 2009 94.8 0.85-0.75 8.27Virtus Alternative Total Solution Fund . . . . . . . . . . . . . . . . . . . . . . . . . . . . . . . 2014 89.9 1.95-1.90 N/AVirtus Multi-Strategy Target Return Fund . . . . . . . . . . . . . . . . . . . . . . . . . . . . 2015 65.2 1.30-1.25 N/AVirtus Herzfeld Fund . . . . . . . . . . . . . . . . . . . . . . . . . . . . . . . . . . . . . . . . . . . . . 2012 49.6 1.00-0.95 4.65Virtus International Real Estate Securities Fund . . . . . . . . . . . . . . . . . . . . . . . . 2007 40.2 1.00-0.90 4.13Virtus Alternative Income Solution Fund . . . . . . . . . . . . . . . . . . . . . . . . . . . . . 2014 36.2 1.80-1.75 N/AVirtus Alternative Inflation Solution Fund . . . . . . . . . . . . . . . . . . . . . . . . . . . . 2014 29.3 1.75-1.70 N/AVirtus Essential Resources Fund . . . . . . . . . . . . . . . . . . . . . . . . . . . . . . . . . . . . 2015 4.3 1.10 N/AVirtus Select MLP and Energy Fund . . . . . . . . . . . . . . . . . . . . . . . . . . . . . . . . . 2015 4.1 1.00 N/AVirtus Alternative Diversifier (3) . . . . . . . . . . . . . . . . . . . . . . . . . . . . . . . . . . . 2005 — — (2.18)
Asset AllocationVirtus Balanced Fund . . . . . . . . . . . . . . . . . . . . . . . . . . . . . . . . . . . . . . . . . . . . 1975 512.0 0.55-0.45 5.07Virtus Multi-Asset Trend Fund . . . . . . . . . . . . . . . . . . . . . . . . . . . . . . . . . . . . . 2011 215.6 1.00-0.90 0.29Virtus Tactical Allocation Fund . . . . . . . . . . . . . . . . . . . . . . . . . . . . . . . . . . . . . 1940 158.9 0.70-0.60 5.26
EquityVirtus Equity Trend Fund . . . . . . . . . . . . . . . . . . . . . . . . . . . . . . . . . . . . . . . . . 2010 1,508.6 1.00-0.95 5.47Virtus Strategic Growth Fund . . . . . . . . . . . . . . . . . . . . . . . . . . . . . . . . . . . . . . 1995 450.9 0.70-0.60 16.16Virtus Sector Trend Fund . . . . . . . . . . . . . . . . . . . . . . . . . . . . . . . . . . . . . . . . . 2003 448.6 0.45-0.40 8.44Virtus Small-Cap Core Fund . . . . . . . . . . . . . . . . . . . . . . . . . . . . . . . . . . . . . . . 2002 291.7 0.75 11.17Virtus Contrarian Value Fund . . . . . . . . . . . . . . . . . . . . . . . . . . . . . . . . . . . . . . 1997 273.0 0.75-0.70 4.50Virtus Quality Small-Cap Fund . . . . . . . . . . . . . . . . . . . . . . . . . . . . . . . . . . . . . 2006 229.4 0.70 12.08Virtus Small-Cap Sustainable Growth Fund . . . . . . . . . . . . . . . . . . . . . . . . . . . 2006 170.1 0.90-0.80 13.55Virtus Growth & Income Fund . . . . . . . . . . . . . . . . . . . . . . . . . . . . . . . . . . . . . 1997 156.0 0.75-0.65 14.43Virtus Wealth Masters Fund . . . . . . . . . . . . . . . . . . . . . . . . . . . . . . . . . . . . . . . 2012 108.7 0.85-0.80 10.48Virtus Mid-Cap Growth Fund . . . . . . . . . . . . . . . . . . . . . . . . . . . . . . . . . . . . . . 1975 87.3 0.80-0.70 9.92Virtus Quality Large-Cap Value Fund . . . . . . . . . . . . . . . . . . . . . . . . . . . . . . . . 2005 67.7 0.75-0.65 11.31Virtus Mid-Cap Core Fund . . . . . . . . . . . . . . . . . . . . . . . . . . . . . . . . . . . . . . . . 2009 29.7 0.80-0.70 14.50Virtus Low Volatility Equity Fund . . . . . . . . . . . . . . . . . . . . . . . . . . . . . . . . . . 2013 5.6 0.95-0.85 N/A
Fixed IncomeVirtus Multi-Sector Short Term Bond Fund . . . . . . . . . . . . . . . . . . . . . . . . . . . 1992 7,255.1 0.55-0.43 1.20Virtus Senior Floating Rate Fund . . . . . . . . . . . . . . . . . . . . . . . . . . . . . . . . . . . 2008 604.2 0.60-0.50 1.92Virtus Multi-Sector Intermediate Bond Fund . . . . . . . . . . . . . . . . . . . . . . . . . . 1989 299.3 0.55-0.45 0.87Virtus Low Duration Income Fund . . . . . . . . . . . . . . . . . . . . . . . . . . . . . . . . . . 1999 280.0 0.55-0.45 1.45Virtus Tax-Exempt Bond Fund . . . . . . . . . . . . . . . . . . . . . . . . . . . . . . . . . . . . . 2001 194.9 0.45 2.43Virtus Credit Opportunities Fund (4) . . . . . . . . . . . . . . . . . . . . . . . . . . . . . . . . . 2015 94.6 0.75 N/AVirtus Bond Fund . . . . . . . . . . . . . . . . . . . . . . . . . . . . . . . . . . . . . . . . . . . . . . . . 1998 72.1 0.45-0.40 1.35Virtus High Yield Fund . . . . . . . . . . . . . . . . . . . . . . . . . . . . . . . . . . . . . . . . . . . 1980 71.2 0.65-0.55 1.80Virtus CA Tax-Exempt Bond Fund . . . . . . . . . . . . . . . . . . . . . . . . . . . . . . . . . . 1983 31.8 0.45-0.35 3.46Virtus Strategic Income Fund . . . . . . . . . . . . . . . . . . . . . . . . . . . . . . . . . . . . . . 2014 28.0 0.80-0.75 N/AVirtus Emerging Markets Debt Fund . . . . . . . . . . . . . . . . . . . . . . . . . . . . . . . . . 2012 26.2 0.75-0.70 (1.89)
4

Fund Type/Name Inception AssetsAdvisoryFee (1)
3-YearAverage
Return (2)
($ in millions) (%) (%)
International/GlobalVirtus Emerging Markets Opportunities Fund . . . . . . . . . . . . . . . . . . . . . . . . . 1997 9,729.7 1.00-0.95 (3.30)Virtus Foreign Opportunities Fund . . . . . . . . . . . . . . . . . . . . . . . . . . . . . . . . . . 1990 1,803.5 0.85-0.75 3.89Virtus Global Opportunities Fund . . . . . . . . . . . . . . . . . . . . . . . . . . . . . . . . . . . 1960 161.8 0.85-0.75 8.83Virtus Global Equity Trend Fund . . . . . . . . . . . . . . . . . . . . . . . . . . . . . . . . . . . 2011 46.9 1.00-0.90 0.93Virtus International Small-Cap Fund . . . . . . . . . . . . . . . . . . . . . . . . . . . . . . . . . 2012 43.0 1.00-0.95 7.67Virtus Emerging Markets Equity Income Fund . . . . . . . . . . . . . . . . . . . . . . . . . 2012 34.5 1.05-1.00 (8.66)Virtus Greater European Opportunities Fund . . . . . . . . . . . . . . . . . . . . . . . . . . 2009 26.6 0.85-0.80 4.62Virtus International Equity Fund . . . . . . . . . . . . . . . . . . . . . . . . . . . . . . . . . . . . 2010 7.2 0.85-0.75 3.07Virtus International Wealth Masters Fund . . . . . . . . . . . . . . . . . . . . . . . . . . . . . 2014 5.0 0.90-0.85 N/AVirtus Emerging Markets Small Cap Fund . . . . . . . . . . . . . . . . . . . . . . . . . . . . 2013 4.1 1.20-1.15 N/A
Variable Insurance FundsVirtus Capital Growth Series . . . . . . . . . . . . . . . . . . . . . . . . . . . . . . . . . . . . . . . 1982 210.1 0.70-0.60 16.47Virtus International Series . . . . . . . . . . . . . . . . . . . . . . . . . . . . . . . . . . . . . . . . . 1990 209.9 0.75-0.65 (2.49)Virtus Multi-Sector Fixed Income Series . . . . . . . . . . . . . . . . . . . . . . . . . . . . . 1982 131.8 0.50-0.40 0.95Virtus Growth and Income Series . . . . . . . . . . . . . . . . . . . . . . . . . . . . . . . . . . . 1998 109.8 0.70-0.60 9.60Virtus Strategic Allocation Series . . . . . . . . . . . . . . . . . . . . . . . . . . . . . . . . . . . 1984 106.5 0.60-0.50 6.27Virtus Small-Cap Value Series . . . . . . . . . . . . . . . . . . . . . . . . . . . . . . . . . . . . . 2000 92.9 0.90-0.80 12.24Virtus Real Estate Securities Series . . . . . . . . . . . . . . . . . . . . . . . . . . . . . . . . . . 1995 88.2 0.75-0.65 10.78Virtus Small-Cap Growth Series . . . . . . . . . . . . . . . . . . . . . . . . . . . . . . . . . . . . 2002 56.1 0.85-0.80 14.21Virtus Equity Trend Series . . . . . . . . . . . . . . . . . . . . . . . . . . . . . . . . . . . . . . . . 2011 11.1 1.00 6.06
Global FundsVirtus GF Multi-Sector Short Duration Bond Fund . . . . . . . . . . . . . . . . . . . . . 2013 32.2 1.75-0.55 N/AVirtus GF US Small Cap Focus Fund . . . . . . . . . . . . . . . . . . . . . . . . . . . . . . . . 2014 4.1 1.65-0.75 N/A
$28,882.1
(1) Percentage of average daily net assets of each fund. The percentages listed represent the range ofmanagement advisory fees paid by the funds, from the highest to the lowest. A range indicates that the fundhas breakpoints at which management advisory fees decrease as assets in the funds increase. We paysubadvisory fees on funds managed by unaffiliated subadvisers, which are not reflected in the percentageslisted.
(2) Represents average annual total return performance of the largest share class as measured by net assets forwhich performance data is available.
(3) This fund contains investments in other Virtus open-end mutual funds. The related assets invested in otherVirtus open-end mutual funds are reflected only in the balances of the respective funds.
(4) Other Virtus open-end mutual funds invest in this fund, the assets invested in by other Virtus open-endfunds are reflected solely in this fund.
Past performance does not guarantee future results. Investment return and principal value will fluctuate sothat shares, when redeemed, may be worth more or less than their original cost.
5

Closed-End Funds
We managed nine closed-end funds as of December 31, 2015, each of which is traded on the New YorkStock Exchange, with aggregate assets of $6.2 billion. Closed-end funds do not continually offer to sell andredeem their shares; rather, daily liquidity is provided by the ability to trade the shares of these funds at pricesthat may be above or below the shares’ net asset value.
Our closed-end funds as of December 31, 2015 are as follows:
Fund Type/Name AssetsAdvisory
Fee
($ in billions) %
BalancedDNP Select Income Fund Inc. . . . . . . . . . . . . . . . . $3.3 0.60-0.50(1)Zweig Total Return Fund Inc. . . . . . . . . . . . . . . . . 0.4 0.70(2)Virtus Total Return Fund . . . . . . . . . . . . . . . . . . . . 0.2 0.85(2)
EquityDuff & Phelps Global Utility Income Fund Inc. . . 0.9 1.00(1)(3)Zweig Fund Inc. . . . . . . . . . . . . . . . . . . . . . . . . . . . 0.3 0.85(2)
AlternativesDuff & Phelps Select Energy MLP Fund . . . . . . . . 0.2 1.00(2)
Fixed IncomeDuff & Phelps Utility and Corporate Bond Trust
Inc. . . . . . . . . . . . . . . . . . . . . . . . . . . . . . . . . . . . 0.4 0.50(1)Virtus Global Multi-Sector Income Fund . . . . . . . 0.3 0.95(2)DTF Tax-Free Income Inc. . . . . . . . . . . . . . . . . . . 0.2 0.50(1)
Total Closed-End Funds . . . . . . . . . . . . . . . . . . . $6.2
(1) Percentage of average weekly net assets. The percentage listed represents the range of management advisoryfees paid by the funds, from the highest to the lowest. A range indicates that the fund has breakpoints atwhich management advisory fees decrease as assets in the fund increase.
(2) Percentage of average daily net assets of each fund.(3) The adviser has contractually agreed to waive a portion of its fee for a period of time, which is not reflected
in the percentage listed.
Exchange Traded Funds
In April 2015, we made an investment for a majority ownership position in Virtus ETF Solutions (“VES”),formerly known as ETF Issuer Solutions, that operates a platform for listing, operating, and distributing exchangetraded funds. We manage seven U.S.-domiciled exchange traded funds with total assets under management of$0.3 billion at December 31, 2015.
Separately Managed Accounts
Separately managed accounts are individually owned portfolios that include intermediary sponsoredprograms, whereby an intermediary assists individuals in hiring investment managers that have been approved bythe broker-dealer to fulfill those objectives and private client accounts that are accounts of high net-worthindividuals who are direct clients of an affiliated manager. Separately managed account assets totaled $6.8 billionat December 31, 2015.
6
Institutional Accounts
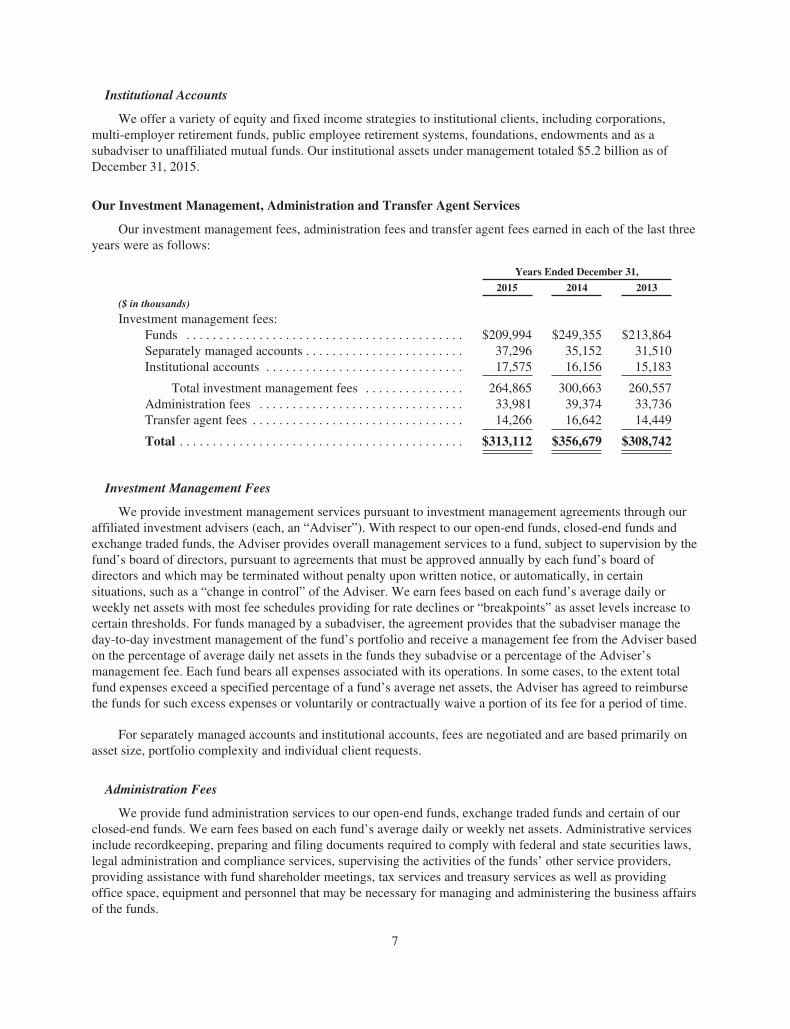
We offer a variety of equity and fixed income strategies to institutional clients, including corporations,multi-employer retirement funds, public employee retirement systems, foundations, endowments and as asubadviser to unaffiliated mutual funds. Our institutional assets under management totaled $5.2 billion as ofDecember 31, 2015.
Our Investment Management, Administration and Transfer Agent Services
Our investment management fees, administration fees and transfer agent fees earned in each of the last threeyears were as follows:
Years Ended December 31,
2015 2014 2013
($ in thousands)
Investment management fees:Funds . . . . . . . . . . . . . . . . . . . . . . . . . . . . . . . . . . . . . . . . . . $209,994 $249,355 $213,864Separately managed accounts . . . . . . . . . . . . . . . . . . . . . . . . 37,296 35,152 31,510Institutional accounts . . . . . . . . . . . . . . . . . . . . . . . . . . . . . . 17,575 16,156 15,183
Total investment management fees . . . . . . . . . . . . . . . 264,865 300,663 260,557Administration fees . . . . . . . . . . . . . . . . . . . . . . . . . . . . . . . 33,981 39,374 33,736Transfer agent fees . . . . . . . . . . . . . . . . . . . . . . . . . . . . . . . . 14,266 16,642 14,449
Total . . . . . . . . . . . . . . . . . . . . . . . . . . . . . . . . . . . . . . . . . . . $313,112 $356,679 $308,742
Investment Management Fees
We provide investment management services pursuant to investment management agreements through ouraffiliated investment advisers (each, an “Adviser”). With respect to our open-end funds, closed-end funds andexchange traded funds, the Adviser provides overall management services to a fund, subject to supervision by thefund’s board of directors, pursuant to agreements that must be approved annually by each fund’s board ofdirectors and which may be terminated without penalty upon written notice, or automatically, in certainsituations, such as a “change in control” of the Adviser. We earn fees based on each fund’s average daily orweekly net assets with most fee schedules providing for rate declines or “breakpoints” as asset levels increase tocertain thresholds. For funds managed by a subadviser, the agreement provides that the subadviser manage theday-to-day investment management of the fund’s portfolio and receive a management fee from the Adviser basedon the percentage of average daily net assets in the funds they subadvise or a percentage of the Adviser’smanagement fee. Each fund bears all expenses associated with its operations. In some cases, to the extent totalfund expenses exceed a specified percentage of a fund’s average net assets, the Adviser has agreed to reimbursethe funds for such excess expenses or voluntarily or contractually waive a portion of its fee for a period of time.
For separately managed accounts and institutional accounts, fees are negotiated and are based primarily onasset size, portfolio complexity and individual client requests.
Administration Fees
We provide fund administration services to our open-end funds, exchange traded funds and certain of ourclosed-end funds. We earn fees based on each fund’s average daily or weekly net assets. Administrative servicesinclude recordkeeping, preparing and filing documents required to comply with federal and state securities laws,legal administration and compliance services, supervising the activities of the funds’ other service providers,providing assistance with fund shareholder meetings, tax services and treasury services as well as providingoffice space, equipment and personnel that may be necessary for managing and administering the business affairsof the funds.
7

Transfer Agent Fees
We provide shareholder services to our open-end mutual funds. We earn fees based on each fund’s averagedaily net assets. Shareholder services include maintaining shareholder accounts, processing shareholdertransactions, preparing filings and performing necessary reporting, among other things. We engage third-partyservice providers to perform certain aspects of the shareholder services.
Our Distribution Services
We distribute our open-end funds and exchange traded funds through financial intermediaries. We havebroad access in the retail market, with distribution partners that include national and regional broker-dealers andindependent financial advisory firms. Our sales efforts are supported by regional sales professionals, a nationalaccount relationship group and separate teams for the retirement and insurance products.
Our separately managed accounts are distributed through financial intermediaries and directly by teams atour affiliated managers. Our institutional distribution strategy is an affiliate-centric model. Through relationshipswith consultants, they target key market segments, including foundations and endowments, corporate, public andprivate pension plans and subadvisory accounts.
Our Broker-Dealer Services
We have two subsidiaries that are broker-dealers registered under the Securities Exchange Act of 1934, asamended (the “Exchange Act”), and are members of the Financial Industry Regulatory Authority (“FINRA”).They serve as principal underwriters and distributors of our open-end mutual funds, exchange traded funds andour separately managed accounts. Our broker-dealers are subject to the SEC’s net capital rule designed to enforceminimum standards regarding the general financial condition and liquidity of broker-dealers.
Open-end mutual fund shares, UCITS and exchange traded fund shares are distributed by VP Distributors,LLC (“VPD”) and ETF Distributors, LLC (“ETFD”) both under sales agreements with unaffiliated financialintermediaries. VPD also markets advisory services to sponsors of separately managed account programs. ETFDserves as the principal underwriter and distributor of our exchange traded funds.
Our Competition
We face significant competition from a wide variety of financial institutions, including other investmentmanagement companies, as well as from proprietary products offered by our distribution partners such as banks,broker-dealers and financial planning firms. Competition in our businesses is based on several factors includinginvestment performance, access to distribution channels, service to financial advisers and their clients and feescharged. Our competitors, many of which are larger than we are, often offer similar products and use similardistribution sources and may also offer less expensive products, have greater access to key distribution channelsand have greater resources than we do.
Our Regulatory Matters
We are subject to regulation by the Securities and Exchange Commission (“SEC”), FINRA and otherfederal and state agencies and self-regulatory organizations. Each affiliated manager and unaffiliated subadviseris registered with the SEC under the Investment Advisers Act. Each open-end mutual fund, closed-end fund,exchange traded fund and each series of our variable insurance funds is registered with the SEC under theInvestment Company Act of 1940. Our Global Funds are subject to regulation by the Central Bank of Ireland(“CBI”) and the funds and each investment manager and sub-investment manager to the Global Funds areregistered with the CBI. See Item 3. Legal Proceedings for more information.
8

The financial services industry is highly regulated and failure to comply with related laws and regulationscan result in the revocation of registrations, the imposition of censures or fines and the suspension or expulsionof a firm and/or its employees from the industry. All of our U.S.-domiciled open-end mutual funds are currentlyavailable-for-sale and are qualified in all 50 states, Washington, D.C., Puerto Rico, Guam and the U.S. VirginIslands. Our Global Funds are sold through financial intermediaries to investors who are not citizens of orresidents of the United States. Most aspects of our investment management business, including the business ofthe unaffiliated subadvisers, are subject to various U.S. federal and state laws and regulations.
Our officers, directors and employees may, from time to time, own securities that are also held by one ormore of our funds. Our internal policies with respect to personal investments are established pursuant to theprovisions of the Investment Company Act and/or the Investment Advisers Act. Employees, officers anddirectors who, in the function of their responsibilities to us, meet the requirements of the Investment CompanyAct, Investment Advisers Act and/or of FINRA regulations, must disclose personal securities holdings andtrading activity. Those employees, officers and directors with investment discretion or access to investmentdecisions are subject to additional restrictions with respect to the pre-clearance of the purchase or sale ofsecurities over which they have investment discretion or beneficial interest. Other restrictions are imposed uponsupervised persons with respect to personal transactions in securities that are held, recently sold or contemplatedfor purchase by our mutual funds. All supervised persons are required to report holdings and transactions on anannual and quarterly basis pursuant to the provisions of the Investment Company Act and Investment AdvisersAct. In addition, certain transactions are restricted so as to avoid the possibility of improper use of informationrelating to the management of client accounts.
Our Employees
As of December 31, 2015, we had 426 full time equivalent employees. None of our employees arerepresented by a union.
Available Information
Our annual reports on Form 10-K, quarterly reports on Form 10-Q, current reports on Form 8-K, and allamendments to these reports filed or furnished pursuant to Section 13(a) or 15(d) of the Exchange Act, as well asproxy statements, are available free of charge on our website located at www.virtus.com as soon as reasonablypracticable after they are filed with or furnished to the SEC. You may also read and copy any document we file atthe SEC’s Public Reference Room at 100 F Street N.E., Washington, D.C. 20549. Please call 1-800-SEC-0330for further information on the operation of the Public Reference Room. Reports, proxy statements and otherinformation regarding issuers that file electronically with the SEC, including our filings, are also available to thepublic on the SEC’s website at http://www.sec.gov.
A copy of our Corporate Governance Principles, our Code of Conduct and the charters of our AuditCommittee, Compensation Committee, Governance Committee and Risk and Finance Committee are posted onour website, www.virtus.com, under “About Us,” “Investor Relations,” “Corporate Governance” and areavailable in print to any person who requests copies by contacting Investor Relations by email to:[email protected] or by mail to Virtus Investment Partners, Inc., c/o Investor Relations, 100 PearlStreet, Hartford, CT 06103. Information contained on the website is not incorporated by reference or otherwiseconsidered part of this document.
9

Item 1A. Risk Factors.
This section describes some of the potential risks relating to our business, such as market, liquidity,operational, reputation and regulatory. The risks described below are some of the more important factors thatcould affect our business. You should carefully consider the risks described below, together with all of the otherinformation included in this Annual Report on Form 10-K, in evaluating the Company and our common stock. Ifany of the risks described below actually occur, our business, revenues, profitability, results of operations,financial condition, cash flows, reputation and stock price could be materially adversely affected.
We earn substantially all of our revenues based on assets under management, and therefore a reduction inassets under management would reduce our revenues and profitability. Assets under management fluctuatebased on many factors including market conditions, investment performance and client withdrawals.
The majority of our revenues are generated from asset-based fees from investment management productsand services to individuals and institutions. Therefore, if the assets under management decline, our fee revenuesdecline reducing profitability as some of our expenses are fixed. There are several reasons that assets undermanagement could decline as discussed below:
• The value of assets under management can decline due to price declines in specific securities,market segments or geographic areas where those assets are invested. Funds and portfolios that wemanage related to certain geographic markets and industry sectors are particularly vulnerable topolitical, social and economic events in those markets and sectors. If these industries or marketsdecline or experience volatility, this could have a negative impact on our assets under management andour revenues. For example, certain non-U.S. markets, particularly emerging markets, are not asdeveloped or as efficient as the U.S. financial markets and, as a result, may be less liquid, lessregulated and significantly more volatile than the U.S. financial markets. Liquidity in such marketsmay be adversely impacted by political or economic events, government policies, expropriation,volume trading limits by foreign investors and social or civil unrest. These factors may negativelyimpact the market value of an investment or our ability to dispose it. In addition, an increase in thevalue of the U.S. dollar relative to non-U.S. currencies could result in a decrease in the U.S. dollarvalue of assets under management that are denominated in non-U.S. currencies.
• The performance of our investment strategies is critical to the maintenance and growth of assetsunder management. Net flows related to our investment strategies can be affected by investmentperformance relative to other competing investment strategies or to established benchmarks. Ourinvestment management strategies are rated, ranked or assessed by independent third-parties,distribution partners, and industry periodicals and services. These assessments often influence theinvestment decisions of our clients. If the performance or assessment of our investment strategies isseen as underperforming relative to peers, it could result in an increase in the withdrawal of assets byexisting clients and the inability to attract additional investments from existing and new clients. Inaddition, certain of our investment strategies have capacity constraints, as there is a limit to the numberof securities available for the strategy to operate effectively. In those instances, we may choose to limitaccess to new or existing investors. In addition, certain mutual funds employ the use of leverage as partof their investment strategies, which will increase or decrease the Company’s assets undermanagement, and the risk associated with the investment, as the proceeds from the use of leverage areinvested in accordance with the funds’ investment strategies.
• General domestic and global economic and political conditions can influence assets undermanagement. Changes in interest rates, the availability and cost of credit, inflation rates, economicuncertainty, changes in laws, trade barriers, commodity prices, currency exchange rates and controlsand national and international political circumstances (including wars, terrorist acts and securityoperations) and other conditions may impact the equity and credit markets which may influence ourassets under management. In recent years, capital and credit markets have experienced substantialvolatility. While there has been some recovery in the capital markets employment rates, continued
10

economic weakness and budgetary challenges in the Eurozone, escalating regional turmoil in theMiddle East, concern over growth prospects in China and emerging markets, growing debt loads forcertain countries and uncertainty about the consequences of governments eventually withdrawingmonetary stimulus all indicate that economic and political conditions remain unpredictable. If thesecurity markets decline or experience volatility, our assets under management and our revenues couldbe negatively impacted. In addition, diminishing investor confidence in the markets and/or adversemarket conditions could result in a decrease in investor risk tolerance. Such a decrease could promptinvestors to reduce their rate of investment or to fully withdraw from markets, which could lower ouroverall assets under management and have an adverse effect on our revenues, earnings and growthprospects.
The volatility in the markets in the recent past has highlighted the interconnection of the global marketsand demonstrated how the deteriorating financial condition of one institution may materially adverselyimpact the performance of other institutions. Our assets under management have exposure to manydifferent industries and counterparties and may be exposed to credit, operational or other risk due to thedefault by a counterparty or client or in the event of a market failure or disruption or otherwise. In theevent of extreme circumstances, including economic, political or business crises, such as a widespreadsystemic failure in the global financial system or failures of firms that have significant obligations ascounterparties, we may suffer significant declines in assets under management and severe liquidity orvaluation issues.
Moreover, a significant amount of our assets under management are in investments represented bystrategies that primarily invest in securities in non-U.S. companies. Many non-U.S. financial marketsare not as developed or as efficient as the U.S. financial markets and, as a result, have limited liquidityand greater price volatility and may lack established regulations. Liquidity in such markets also may beadversely impacted by political or economic events, government policies, expropriation, volumetrading limits by foreign investors and social and civil unrest. An investment’s market value or theability to dispose of an investment may be adversely impacted by any of these factors. Governments offoreign jurisdictions may assert their abilities to tax local gains and/or income of foreign investors,including our clients, which could adversely impact the economics associated with investing in foreignjurisdictions or non-U.S. based companies. These risks also could impact the performance of ourstrategies that invest in such markets and, in particular, strategies that concentrate investments inemerging market companies and countries.
• Changes in interest rates can have adverse effects on our assets under management. Increases ininterest rates from their historically low present levels may adversely affect the net asset values of ourassets under management. Furthermore, increases in interest rates may result in reduced prices inequity markets. Conversely, decreases in interest rates could lead to outflows in fixed income assetsthat we manage as investors seek higher yields. Any of these effects could lower our assets undermanagement and revenues and, if our revenues decline without a commensurate reduction in ourexpenses, would lead to a reduction in our net income.
Any of these factors could cause our assets under management to decline and have an adverse impact on ourresults of operations and financial condition.
Our investment advisory agreements are subject to withdrawal, renegotiation or termination on short notice.
Our clients include the boards of directors for our sponsored mutual funds, managed account programsponsors, private clients and institutional clients. Our investment management agreements with these clients maybe terminated upon short notice without penalty. As a result, there would be little impediment to these sponsorsor clients terminating our agreements. Our clients may terminate or renegotiate their investment contracts with usor reduce the aggregate amount of assets under management with us due to a number of reasons includinginvestment performance, reputational, regulatory or compliance issues, loss of key investment management or
11

other personnel or a change in management or control of clients, third-party distributors, subadvisers or otherswith whom we have relationships. The directors of our sponsored funds may deem it to be in the best interests ofa fund’s shareholders to make decisions adverse to us, such as reducing the compensation paid to us, requestingthat we subsidize fund expenses over certain thresholds, or imposing restrictions on our management of the fund.Under the Investment Company Act, investment advisory agreements automatically terminate in the event of anassignment, which may occur if, among other events, the Company undergoes a change in control, such as anyperson acquiring 25% voting rights of our common stock. If an assignment were to occur, we cannot be certainthat the fund’s board of directors and its stockholders would approve a new investment advisory agreement. Inaddition, investment advisory agreements for the separate accounts we manage may not be assigned without theconsent of the client. If an assignment occurs, we cannot be certain that the Company will be able to obtain thenecessary fund approvals or the necessary consents from our clients. The withdrawal, renegotiation ortermination of any investment management contract relating to a material portion of assets under managementwould have an adverse impact on our results of operations and financial condition.
Any damage to our reputation could harm our business and lead to a reduction in our revenues andprofitability.
Maintaining a strong reputation with the investment community is critical to our success. Our reputation isvulnerable to many threats that can be difficult or impossible to control, and costly or impossible to remediateeven if they are without merit or satisfactorily addressed. Our reputation may be impacted by many factors,including but not limited to: poor performance; litigation; conflicts of interests; regulatory inquiries,investigations or findings; operational failures (including cyber breaches); intentional or unintentionalmisrepresentation of our products or services; or employee misconduct or rumors. Any damage to our reputationcould impede our ability to attract and retain clients and key personnel, adversely impact relationships with third-party distributors and other business partners and lead to a reduction in the amount of our assets undermanagement, any of which could adversely affect our results of operations and financial condition.
We manage client assets under agreements that have established investment guidelines or other contractualrequirements, and any failure to comply could result in claims, losses or regulatory sanctions, which couldnegatively impact our revenues and profitability.
The agreements under which we manage client assets often have established investment guidelines or othercontractual requirements that we are required to comply with in providing our investment management services.Although we maintain various compliance procedures and other controls to prevent, detect, and correct sucherrors, any failure or allegation of a failure to comply with these guidelines or other requirement could result inclient claims, reputational damage, withdrawal of assets and potential regulatory sanctions, any of which couldhave an adverse impact on our results of operations and financial condition.
Our business relies on the ability to attract and retain key employees, and the loss of such employees couldnegatively affect financial performance.
The success of our business is dependent to a large extent on our ability to attract and retain key employeessuch as senior executives, portfolio managers, securities analysts and sales personnel. Competition in the jobmarket for these professionals is generally intense and compensation levels in the industry are highlycompetitive. The market for investment managers is also characterized by the movement of investment managersamong different firms.
If we are unable to continue to attract and retain key employees, or if compensation costs required to attract andretain key employees increase, our performance, including our competitive position, could be materially adverselyaffected. Additionally, we utilize Company equity awards as part of our compensation plans and as a means forrecruiting and retaining key employees. Declines in our stock price could result in deterioration in the value of equityawards granted, thus lessening the effectiveness of retaining key employees through stock-based awards.
12

In certain circumstances, the departure of key employees could cause higher redemption rates for certainassets under management, or the loss of certain client accounts. Any inability to retain our key employees, attractqualified employees, or replace key employee positions in a timely manner, could lead to a reduction in theamount of our assets under management, which could have a material adverse effect on our revenues andprofitability. In addition, there could be additional costs to replace, retain or attract new talent which would resultin a decrease in our profitability and have an adverse impact on our results of operations and financial condition.
The highly competitive nature of the asset management industry may force us to reduce the fees we chargeto clients, increase amounts paid to financial intermediaries or provide more support to thoseintermediaries, all of which could result in a reduction of our revenues and profitability.
We face significant competition from a wide variety of financial institutions, including other investmentmanagement companies, as well as from proprietary products offered by our distribution partners such as banks,broker-dealers and financial planning firms. Competition in our businesses is based on several factors includinginvestment performance, access to distribution channels, service to financial advisers and their clients and feescharged. Our competitors, many of which are larger than we are, often offer similar products, use similardistribution sources, offer less expensive products, have greater access to key distribution channels and havegreater resources, geographic footprints and name recognition than we do. Additionally, certain products andasset classes, such as passive or index-based products, are becoming increasingly popular with investors.Existing clients may withdraw their assets in order to invest in these products, and we may be unable to attractadditional investments from existing and new clients, which would lead to a decline in our assets undermanagement and market share.
In addition, our profits are highly dependent on the fee levels for our products and services. In recent years,there has been a trend in certain segments of our markets toward lower fees and lower fee products, such aspassive products. Competition could cause us to reduce the fees that we charge for products and services. Inorder to maintain appropriate fee levels in a competitive environment, we must be able to continue to provideclients with investment products and services that are viewed as appropriate in relation to the fees charged. If ourclients, including our fund boards, were to view our fees as being high relative to the market or the returnsprovided by our investment products, we may choose to reduce our fee levels or we may experience significantredemptions in our assets under management which could have an adverse impact on our results of operationsand financial condition.
We are subject to an extensive and complex regulatory environment, and changes in regulations or failureto comply with regulation could adversely affect our revenues and profitability.
The investment management industry in which we operate is subject to extensive and frequently changingregulation. We are regulated by the SEC under the Exchange Act, the Investment Company Act and theInvestment Advisers Act, and we are subject to regulation by the Commodities Futures Trading Commissionunder the Commodities Exchange Act. Our Global Funds are subject to regulation by the CBI. We are alsoregulated by FINRA, the Department of Labor under the Employee Retirement Income Security Act of 1974, asamended (“ERISA”), as well as other federal and state laws and regulations.
The regulatory environment that we operate in changes often and has seen increased regulatory focus inrecent years. For example, in fiscal 2015, the SEC proposed new rules addressing liquidity risk management byregistered open-end funds and the use of derivatives by registered open-end and closed-end funds. If theseregulations are adopted substantially as proposed, they could materially impact the provision of investmentservices or limit opportunities for certain funds we manage and increase our management and administrationcosts, with potential adverse effects on our revenues, expenses and results of operations.
Although we spend extensive time and resources on compliance efforts designed to ensure compliance withall applicable laws and regulations, if we or our affiliates fail to timely and properly modify and update our
13

compliance procedures in this changing and highly complex regulatory environment, we may be subject tovarious legal proceedings, including civil litigation, governmental investigations and enforcement actions andresult in fines, penalties or suspensions of individual employees or limitations on particular business activitieswhich could have an adverse impact on our results of operations and financial condition.
Changes in tax laws and unanticipated tax liabilities could have an adverse impact on our financialcondition, results of operations and cash flow.
We are subject to federal and state income taxes in the United States. Tax authorities may disagree withcertain positions we have taken or implement changes in tax policy, which may result in the assessment ofadditional taxes. We regularly assess the appropriateness of our tax positions and reporting. We cannot provideassurance, however, that we will accurately predict the outcomes of audits, and the actual outcomes of theseaudits could be unfavorable. In addition, our ability to use net operating loss carryforwards and other taxattributes available to us will be dependent on our ability to generate taxable income.
We utilize unaffiliated firms in providing investment management services and any matters that have anadverse impact to their business, or any change in our relationships with these unaffiliated firms could leadto a reduction in assets under management, which will adversely affect our revenues and profitability.
We utilize unaffiliated subadvisers as investment managers for certain of our retail products and we havelicensing arrangements with unaffiliated data providers. Because we typically have no ownership interests inthese unaffiliated firms, we do not control the business activities of such firms. Problems stemming from thebusiness activities of these unaffiliated firms may negatively impact or disrupt such firms’ operations or exposethem to disciplinary action or reputational harm. Furthermore, any such matters at these unaffiliated firms mayhave an adverse impact on our business or reputation or expose us to regulatory scrutiny, including with respectto our oversight of such firms. For example, in December 2014 an unaffiliated former subadviser, F-Squared,settled charges with the SEC that it had violated federal securities laws and during fiscal 2015 were ultimatelyterminated as a subadviser of our funds. We also subsequently entered into an agreement with the SEC to settleallegations stemming from our relationship with F-Squared. See “Item 3. Legal Proceedings” for a description ofthis settlement agreement and the regulatory proceedings against F-Squared.
We periodically negotiate provisions and renewals of these relationships, and we cannot provide assurancethat such terms will remain acceptable to us or the unaffiliated firms. These relationships can also be terminatedupon short notice without penalty. In addition, similar to our business, the departure of key employees at ourunaffiliated subadvisers could cause higher redemption rates for certain assets under management, or the loss ofcertain client accounts. An interruption or termination of our unaffiliated firm relationships could affect ourability to market our products and result in a reduction in assets under management which could have an adverseimpact on our results of operations and financial condition.
We distribute through intermediaries, and changes in key distribution relationships could reduce ourrevenues, increase our costs and adversely affect our profitability.
Our primary source of distribution for our retail products is through intermediaries that include third-partyfinancial intermediaries, such as: major wire houses; national, regional and independent broker-dealers andfinancial advisors; banks and financial planners and registered investment advisors. Our success is highlydependent on access to these various distribution systems. These distributors are generally not contractuallyrequired to distribute our products and typically offer their clients various investment products and services,including proprietary products and services, in addition to and in competition with our products and services.While we compensate these intermediaries for selling our products and services pursuant to contractualagreements, we may not be able to retain access to these channels at all or at similar pricing. Increasingcompetition for these distribution channels could cause our distribution costs to rise, which could have a material
14
adverse effect on our business, revenues and profitability. To the extent that existing or future intermediariesprefer to do business with our competitors, the sales of our products as well as our market share, revenues andprofitability could decline.
We and our third-party service providers, which includes securities pricing and transaction processingservices, rely on numerous technology systems, and a temporary business interruption or security breachcould negatively impact our business and profitability. Our business will suffer if our technology systemsfail or are interrupted or if security breaches or other disruptions compromise our information.
Our technology systems and those of our third-party service providers are critical to our operations. Theability to consistently and reliably obtain accurate securities pricing information, process client portfolio andfund shareholder transactions and provide reports and other customer service to fund shareholders and clients inother accounts managed by us is an essential part of our business. Any delays or inaccuracies in obtaining pricinginformation, processing such transactions or such reports, other breaches and errors, and any inadequacies inother customer service, could result in reimbursement obligations or other liabilities, or alienate customers andpotentially give rise to claims against us. Our customer service capability, as well as our ability to obtain promptand accurate securities pricing information and to process transactions and reports, is highly dependent on ourthird-party service providers’ information systems. Any failure or interruption of those systems, whetherresulting from technology or infrastructure breakdowns, defects or external causes such as fire, natural disaster,viruses, acts of terrorism or power disruptions, could result in financial loss, negatively impact our reputation,and negatively affect our ability to do business. Although we, and our third-party service providers, have disasterrecovery plans in place, we may experience temporary interruptions if a natural disaster or prolonged poweroutages were to occur which could have an adverse impact on our results of operations and financial condition.
In addition, like other companies in the financial services industry, our computer systems are regularlysubject to and are expected to continue to be the target of computer viruses or other malicious codes,unauthorized access, cyber-attacks or other computer-related penetrations. While we have experienced threats toour data and systems, to date, we are not aware that we have experienced a material breach of cyber security.Over time, however, the sophistication of cyber threats continues to increase, and any controls we put in placeand preventative actions we take to reduce the risk of cyber incidents and protect our information may beinsufficient to detect or prevent unauthorized access, cyber-attacks or other security breaches to our computersystems or those of third parties with whom we do business. Breach of our technology systems or those of thirdparties with whom we do business through cyber-attacks, or failure to manage and secure our technologyenvironment, could result in interruptions or malfunctions in the operations of our business, loss of valuableinformation, liability for stolen assets or information, remediation costs to repair damage caused by a breach,additional costs to mitigate against future incidents and litigation costs resulting from an incident.
We and certain of our third-party vendors receive and store personal information as well as non-publicbusiness information. Although we and our third-party vendors take precautions, we may still be vulnerable tohacking or other unauthorized use. A breach of the systems or hardware could result in an unauthorized access toour proprietary business or client data or release of this type of data, which could subject us to legal liability orregulatory action under data protection and privacy laws which may result in fines or penalties, the termination ofexisting client contracts, costly mitigation activities and harm to our reputation, which could have an adverseimpact on our results of operations and financial condition.
Ownership of a relatively large percentage of our common stock is concentrated with a small number ofshareholders, which could increase the volatility in our stock trading and dramatically affect our shareprice.
A large percentage of our common stock is held by a limited number of shareholders. If our largershareholders decide to liquidate their positions, it could cause significant fluctuation in the share price of our
15

common stock. Public companies with a relatively concentrated level of institutional shareholders, such as wehave, often have difficulty generating trading volume in their stock which may increase the volatility in the priceof our common stock.
Civil litigation and government investigations or proceedings could adversely affect our business.
Many aspects of our business involve substantial risks of liability, and there have been substantialincidences of litigation and regulatory investigations in the financial services industry in recent years, includingcustomer claims as well as class action suits seeking substantial damages. From time to time, we and/or our fundsmay be named as defendants or co-defendants in lawsuits or be involved in disputes that involve the threat oflawsuits seeking substantial damages. We and/or our funds are also involved from time to time in governmentaland self-regulatory organization investigations and proceedings. For example, in fiscal 2015, two putative classaction complaints were filed against us and certain of our officers and affiliates, alleging violation of certainprovisions of federal securities laws. We also recently entered into an agreement with the SEC to settleallegations stemming from our relationship with our former subadvisor, F-Squared. See “Item 3. LegalProceedings” for additional information related to these matters.
Any of these lawsuits, investigations or proceedings could result in reputational damage, loss of clients andassets, settlements, awards, injunctions, fines, penalties, increased costs and expenses in resolving a claim,diversion of employee resources and resulting financial losses. Predicting the outcome of such matters isinherently difficult, particularly where claims are brought on behalf of various classes of claimants or by a largenumber of claimants, when claimants seek substantial or unspecified damages or when investigations or legalproceedings are at an early stage. A substantial judgment, settlement, fine or penalty could be material to ouroperating results or cash flows for a particular period, depending on our results for that period, or could cause ussignificant reputational harm, which could harm our business prospects.
We depend to a large extent on our business relationships and our reputation to attract and retain clients. Asa result, allegations of improper conduct by private litigants, including investors in our funds, or regulators,whether the ultimate outcome is favorable or unfavorable to us, as well as negative publicity and pressspeculation about us, our investment activities or the asset management industry in general, whether or not valid,may harm our reputation, which may be more damaging to our business than to other types of businesses. Wemay incur substantial legal expenses in defending against proceedings commenced by a client, regulatoryauthority or other private litigant. Substantial legal liability levied on us could cause significant reputational harmand have an adverse impact on our results of operations and financial condition.
We have a significant portion of our assets invested in marketable securities that are primarily comprised ofour seed capital program, which exposes us to earnings volatility with regard to these investments and a riskof capital loss.
We use capital to seed new investment strategies and make new investments to introduce new products orenhance distribution access. At December 31, 2015, the Company had $273.7 million of seed capital investmentsin a variety of asset classes including alternative, fixed income and equity strategies. We also had $40.0 millioninvested in our consolidated investment product (“CIP”). Many of these investments employ a long-terminvestment strategy and entail an optimal investment period spanning several years. Accordingly, during thisinvestment period, the Company’s capital utilized in these investments may not be available for other corporatepurposes at all or without significantly diminishing our investment return. We cannot provide assurance thatthese investments will perform as expected. Moreover, increases or decreases in the value of these investmentswill increase the volatility of our earnings, and a decline in the value of these investments would result in the lossof capital and have an adverse impact on our results of operations and financial condition.
16

Our investment in our consolidated investment product exposes us to substantial risks, including but notlimited to the possibility that we may not receive any return on such investment.
As of December 31, 2015, the Company had invested $40.0 million into a special purpose entity (“SPE”)that was created specifically to accumulate bank loan assets for securitization as a potential collateralized loanobligation (a “CLO”) that will be managed by our Newfleet affiliate. The SPE is a variable interest entity (a“VIE”), and the Company consolidates the SPE’s assets and liabilities within our financial statements as it is theprimary beneficiary of the VIE. We refer to the Company’s investment in this SPE as our consolidatedinvestment product.
Our consolidated investment product entered into a warehouse financing agreement with a financialinstitution in August 2015, pursuant to which the warehouse provider will finance the purchase of loans that willbe ultimately included in a CLO. The SPE selects the investments in the warehouse subject to the approval of thewarehouse provider. Although we would anticipate completing the issuance of this particular CLO, we may notbe able to complete such issuance on terms that are acceptable to us. If the relevant CLO transaction is not issuedor consummated, as applicable, the warehouse investments may be liquidated, and we may lose some or all ofour equity investment, or first loss investment in the warehouse facility if the value of the loans we purchased init decreases. In addition, regardless of whether the CLO is issued or consummated, if any of the warehousedinvestments are sold before such issuance or consummation, we will bear any resulting loss on the sale.
We cannot assure you that our intended quarterly distributions will be paid each quarter or at all.
The declaration, payment and determination of the amount of our quarterly dividend, may change at anytime. In making decisions regarding our quarterly dividend, we consider general economic and businessconditions, our strategic plans and prospects, our businesses and investment opportunities, our financial conditionand operating results, working capital requirements and anticipated cash needs, contractual restrictions andobligations, legal, tax, regulatory and other restrictions that may have implications on the payment ofdistributions by us to our common shareholders or by our subsidiaries to us, and such other factors as we maydeem relevant. We cannot assure you that any distributions, whether quarterly or otherwise, will be paid.
We may need to raise additional capital in the future, and resources may not be available to us in sufficientamounts or on acceptable terms, which could have an adverse impact on our business.
Our ability to meet the future cash needs of the Company is dependent upon our ability to generate cash.Although the Company has been successful in generating sufficient cash in the past, it may not be in the future.As of December 31, 2015, we maintained a strong cash and working capital position and had no debt outstandingother than the debt of our consolidated investment product for which recourse to the Company is limited to its$40.0 million investment. See Footnote 18 of our consolidated financial statements for additional information onthe debt of the consolidated investment product. We may need to raise capital to fund new business initiatives inthe future, however, and financing may not be available to us in sufficient amounts, on acceptable terms, or at all.Our ability to access capital markets efficiently depends on a number of factors, including the state of credit andequity markets, interest rates and credit spreads. If we are unable to access sufficient capital on acceptable termsour business could be adversely impacted.
We have corporate governance provisions that may make an acquisition of us more difficult.
Certain provisions of our certificate of incorporation and bylaws could discourage, delay, or prevent amerger, acquisition, or other change in control that stockholders may consider favorable, including transactionsin which stockholders might otherwise receive a premium for their shares. These provisions also could limit theprice that investors might be willing to pay in the future for shares of our common stock, thereby depressing themarket price of our common stock. Stockholders who wish to participate in these transactions may not have theopportunity to do so. In addition, the provisions of Section 203 of the Delaware General Corporation Law alsorestrict certain business combinations with interested stockholders.
17
Our insurance policies may not cover all liabilities and losses to which we may be exposed.
We carry insurance in amounts and under terms that we believe are appropriate. Our insurance may notcover all liabilities and losses to which we may be exposed. Certain insurance coverage may not be available ormay be prohibitively expensive in future periods. As our insurance policies come up for renewal, we may need toassume higher deductibles or pay higher premiums, which could have an adverse impact on our results ofoperations and financial condition.
We may engage in strategic transactions that could create risks.
We regularly review, and from time to time have discussions with and engage in, potential strategictransactions, including potential acquisitions, consolidations, joint ventures or similar transactions, some ofwhich may be material. We cannot provide assurance that we will find suitable candidates for strategictransactions at acceptable prices, have sufficient capital resources to pursue such transactions, be successful innegotiating the required agreements or successfully close transactions after signing such agreements.
Any strategic transactions may also involve a number of other risks, including additional demands on ourstaff, unanticipated problems regarding integration of operating facilities, technologies and new employees andthe existence of liabilities or contingencies not disclosed to, or otherwise unknown by, us prior to closing atransaction. In addition, any business we acquire may underperform relative to expectations or may losecustomers or employees. As a result, the Company may not be able to realize all of the expected benefits fromsuch transactions or may be required to spend additional time or money on integration.
18
SPECIAL NOTE ABOUT FORWARD-LOOKING STATEMENTS
This Annual Report on Form 10-K contains statements that are, or may be considered to be, forward-looking statements within the meaning of The Private Securities Litigation Reform Act of 1995, as amended,Section 27A of the Securities Act of 1933, as amended, and Section 21E of the Securities Exchange Act of 1934,as amended. All statements that are not historical facts, including statements about our beliefs or expectations,are forward-looking statements. These statements may be identified by such forward-looking terminology as“expect,” “estimate,” “intent,” “plan,” “intend,” “believe,” “anticipate,” “may,” “will,” “should,” “could,”“continue,” “project,” “opportunity,” “predict,” “would,” “potential,” “future,” “forecast,” “guarantee,”“assume,” “likely,” “target” or similar statements or variations of such terms.
Our forward-looking statements are based on a series of expectations, assumptions and projections about ourCompany and the markets in which we operate, are not guarantees of future results or performance and involvesubstantial risks and uncertainty, including assumptions and projections concerning our assets undermanagement, net cash inflows and outflows, operating cash flows, business plans and credit facilities, for allfuture periods. All of our forward-looking statements contained in this Annual Report on Form 10-K are as of thedate of this Annual Report on Form 10-K only.
We can give no assurance that such expectations or forward-looking statements will prove to be correct.Actual results may differ materially. We do not undertake or plan to update or revise any such forward-lookingstatements to reflect actual results, changes in plans, assumptions, estimates or projections, or othercircumstances occurring after the date of this Annual Report on Form 10-K, even if such results, changes orcircumstances make it clear that any forward-looking information will not be realized. If there are any futurepublic statements or disclosures by us which modify or impact any of the forward-looking statements containedin or accompanying this Annual Report on Form 10-K, such statements or disclosures will be deemed to modifyor supersede such statements in this Annual Report on Form 10-K.
Our business and our forward-looking statements involve substantial known and unknown risks anduncertainties, including those discussed under “Risk Factors,” and “Management’s Discussion and Analysis ofFinancial Condition and Results of Operations” in this Annual Report on Form 10-K. Any occurrence of, or anymaterial adverse change in, one or more risk factors or risks and uncertainties referred to in this Annual Reporton Form 10-K or our other periodic reports filed with the SEC could materially and adversely affect ouroperations, financial results, cash flows, prospects and liquidity. You are urged to carefully consider all suchfactors.
Item 1B. Unresolved Staff Comments.
None.
Item 2. Properties.
We lease our principal offices, which are located at 100 Pearl St., Hartford, CT 06103. In addition, we leaseoffice space in Illinois, California, Massachusetts and New York.
Item 3. Legal Proceedings.
The Company is regularly involved in litigation and arbitration as well as examinations, inquiries andinvestigations by various regulatory bodies, including the SEC, involving its compliance with, among otherthings, securities laws, client investment guidelines, laws governing the activities of broker-dealers and otherlaws and regulations affecting its products and other activities. Legal and regulatory matters of this natureinvolve or may involve but are not limited to the Company’s activities as an employer, issuer of securities,investor, investment adviser, broker-dealer or taxpayer. In addition, in the normal course of business, the
19

Company discusses matters with its regulators raised during regulatory examinations or is otherwise subject totheir inquiry. These matters could result in censures, fines, penalties or other sanctions.
The Company accrues for a liability when it is both probable that a liability has been incurred and theamount of the liability can be reasonably estimated. Significant judgment is required in both the determination ofprobability and the determination as to whether a loss is reasonably estimable. In addition, in the event theCompany determines that a loss is not probable, but is reasonably possible, and it becomes possible to developwhat the Company believes to be a reasonable range of possible loss, then the Company will include disclosuresrelated to such matter as appropriate and in compliance with ASC 450, Loss Contingencies. The disclosures,accruals or estimates, if any, resulting from the foregoing analysis are reviewed at least quarterly and adjusted toreflect the impact of negotiations, settlements, rulings, advice of legal counsel and other information and eventspertaining to a particular matter. Based on information currently available, available insurance coverage andestablished reserves, the Company believes that the outcomes of its legal and regulatory proceedings are notlikely, either individually or in the aggregate, to have a material adverse effect on the Company’s results ofoperations, cash flows or its consolidated financial condition. However, in the event of unexpected subsequentdevelopments and given the inherent unpredictability of these legal and regulatory matters, the Company canprovide no assurance that its assessment of any claim, dispute, regulatory examination or investigation or otherlegal matter will reflect the ultimate outcome and an adverse outcome in certain matters could, from time to time,have a material adverse effect on the Company’s results of operations or cash flows in particular quarterly orannual periods.
Regulatory Matter
As previously disclosed, in December 2014 the SEC announced a settlement with F-Squared Investments(“F-Squared”), an unaffiliated former subadviser, which settled charges that F-Squared had violated the federalsecurities laws as described in Investment Advisers Act Release No. 3988. The settlement related to F-Squared’sinaccurate performance information for the period of April 2001 through September 2008, including indices thatcertain Virtus mutual funds tracked beginning in September 2009 and January 2011. As part of the SEC’s non-public, confidential investigation of this matter, the SEC staff informed the Company that it was inquiring intowhether the Company had violated securities laws or regulations with respect to F-Squared’s historicalperformance information. In November 2015, without admitting or denying the SEC’s findings, the Companyconsented to the entry of the order which found that the Company violated certain Sections of the InvestmentAdvisers Act and the Investment Company Act of 1940. The Company agreed to pay a total of $16.5 millionwhich it paid in the fourth quarter of 2015.
In re Virtus Investment Partners, Inc. Securities Litigation; formerly styled as Tom Cummins v. Virtus InvestmentPartners Inc. et al
On February 20, 2015, a putative class action complaint alleging violation of the federal securities laws wasfiled by an individual shareholder against the Company and certain of the Company’s current officers (the“defendants”) in the United States District Court for the Southern District of New York. On April 21, 2015, threeplaintiffs, including the original plaintiff, filed motions to be appointed lead plaintiff. On June 9, 2015, the courtentered an order appointing Arkansas Teachers Retirement System lead plaintiff. On August 21, 2015, plaintifffiled a Consolidated Class Action Complaint (the “Consolidated Complaint”) amending the originally filedcomplaint. The Consolidated Complaint was purportedly filed on behalf of all purchasers of the Company’scommon stock between January 25, 2013 and May 11, 2015 (the “Class Period”). The Consolidated Complaintalleges that during the Class Period, the defendants disseminated materially false and misleading statements andconcealed material adverse facts relating to certain funds subadvised by F-Squared. The Consolidated Complaintalleges claims under Sections 10(b) and 20(a) of the Securities Exchange Act of 1934, as amended, andRule 10b-5. The plaintiff seeks to recover unspecified damages. The Company believes that the suit is withoutmerit and intends to defend it vigorously. A motion to dismiss the Consolidated Complaint was filed on behalf ofthe Company and the other defendants on October 21, 2015. Briefing of the motion was completed on
20

December 4, 2015, and oral argument was held on December 17, 2015. The motion is pending. The Companybelieves that there is not a material loss that is probable and reasonably estimable related to this claim.
Mark Youngers v. Virtus Investment Partners, Inc. et al
On May 8, 2015, a putative class action complaint alleging violations of certain provisions of the federalsecurities laws was filed in the United States District Court for the Central District of California by an individualwho alleges he is a former shareholder of one of the Virtus mutual funds formerly subadvised by F-Squared andformerly known as the AlphaSector Funds. The complaint purports to allege claims against the Company, certainof the Company’s officers and affiliates, and certain other parties (the “defendants”). The complaint waspurportedly filed on behalf of purchasers of the AlphaSector Funds between May 8, 2010 and December 22,2014, inclusive (the “Class Period”). The complaint alleges that during the Class Period the defendantsdisseminated materially false and misleading statements and concealed or omitted material facts necessary tomake the statements made not misleading. On June 7, 2015, a group of three individuals, including the originalplaintiff, filed a motion to be appointed lead plaintiff. No other motions to be appointed lead plaintiff were filed.On July 27, 2015, the court granted the motion, appointing movants as lead plaintiff. On July 27, 2015, the courtissued an order to show cause requiring lead plaintiff to explain no later than July 31, 2015, why his claimsshould not be transferred and consolidated with the In re Virtus Investment Partners, Inc. Securities Litigationaction discussed above. On October 1, 2015, plaintiff filed a First Amended Class Action Complaint whichamong other things, added a derivative claim for breach of fiduciary duty on behalf of Virtus OpportunitiesTrust. On October 19, 2015, the United States District Court for the Central District of California entered anorder transferring the action to the Southern District of New York. On January 4, 2016, Plaintiffs filed a SecondAmended Complaint. Defendants’ filed a motion to dismiss on February 1, 2016. The Company believes theplaintiffs claims asserted in the complaint are frivolous and intends to defend it vigorously. The Companybelieves that there is not a material loss that is probable and reasonably estimable related to this claim.
Item 4. Mine Safety Disclosures.
Not applicable.
21
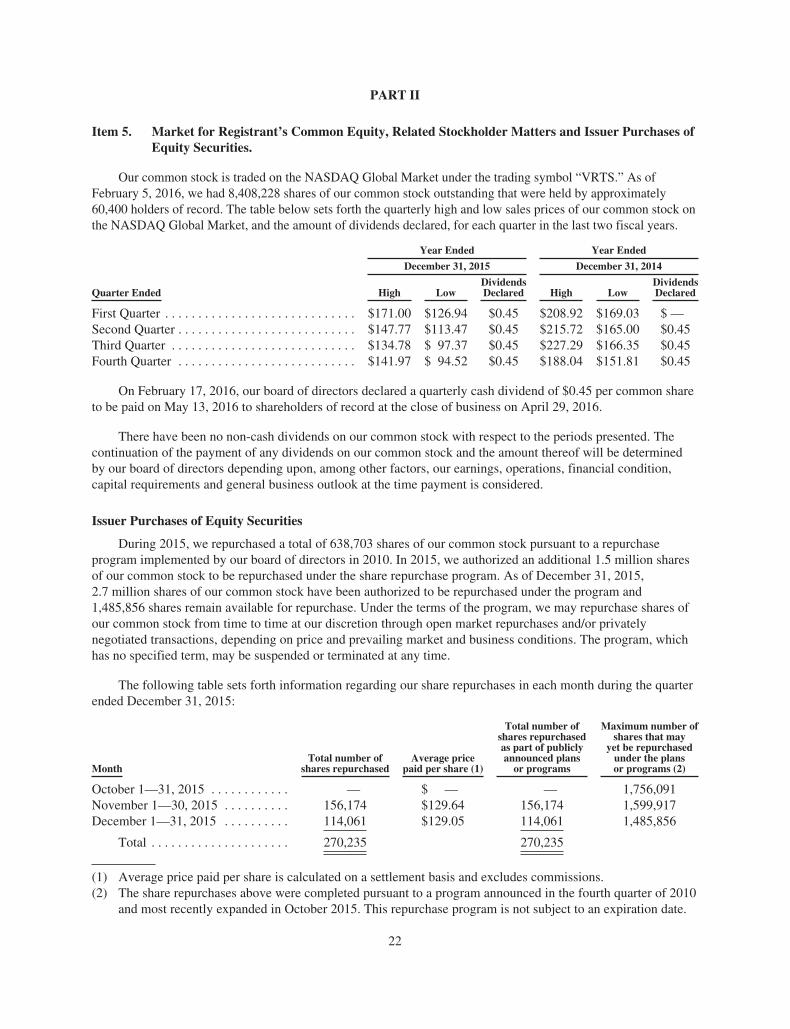
PART II
Item 5. Market for Registrant’s Common Equity, Related Stockholder Matters and Issuer Purchases ofEquity Securities.
Our common stock is traded on the NASDAQ Global Market under the trading symbol “VRTS.” As ofFebruary 5, 2016, we had 8,408,228 shares of our common stock outstanding that were held by approximately60,400 holders of record. The table below sets forth the quarterly high and low sales prices of our common stock onthe NASDAQ Global Market, and the amount of dividends declared, for each quarter in the last two fiscal years.
Year Ended Year Ended
December 31, 2015 December 31, 2014
Quarter Ended High LowDividendsDeclared High Low
DividendsDeclared
First Quarter . . . . . . . . . . . . . . . . . . . . . . . . . . . . . $171.00 $126.94 $0.45 $208.92 $169.03 $ —Second Quarter . . . . . . . . . . . . . . . . . . . . . . . . . . . $147.77 $113.47 $0.45 $215.72 $165.00 $0.45Third Quarter . . . . . . . . . . . . . . . . . . . . . . . . . . . . $134.78 $ 97.37 $0.45 $227.29 $166.35 $0.45Fourth Quarter . . . . . . . . . . . . . . . . . . . . . . . . . . . $141.97 $ 94.52 $0.45 $188.04 $151.81 $0.45
On February 17, 2016, our board of directors declared a quarterly cash dividend of $0.45 per common shareto be paid on May 13, 2016 to shareholders of record at the close of business on April 29, 2016.
There have been no non-cash dividends on our common stock with respect to the periods presented. Thecontinuation of the payment of any dividends on our common stock and the amount thereof will be determinedby our board of directors depending upon, among other factors, our earnings, operations, financial condition,capital requirements and general business outlook at the time payment is considered.
Issuer Purchases of Equity Securities
During 2015, we repurchased a total of 638,703 shares of our common stock pursuant to a repurchaseprogram implemented by our board of directors in 2010. In 2015, we authorized an additional 1.5 million sharesof our common stock to be repurchased under the share repurchase program. As of December 31, 2015,2.7 million shares of our common stock have been authorized to be repurchased under the program and1,485,856 shares remain available for repurchase. Under the terms of the program, we may repurchase shares ofour common stock from time to time at our discretion through open market repurchases and/or privatelynegotiated transactions, depending on price and prevailing market and business conditions. The program, whichhas no specified term, may be suspended or terminated at any time.
The following table sets forth information regarding our share repurchases in each month during the quarterended December 31, 2015:
MonthTotal number of
shares repurchasedAverage price
paid per share (1)
Total number ofshares repurchasedas part of publiclyannounced plans
or programs
Maximum number ofshares that may
yet be repurchasedunder the plansor programs (2)
October 1—31, 2015 . . . . . . . . . . . . — $ — — 1,756,091November 1—30, 2015 . . . . . . . . . . 156,174 $129.64 156,174 1,599,917December 1—31, 2015 . . . . . . . . . . 114,061 $129.05 114,061 1,485,856
Total . . . . . . . . . . . . . . . . . . . . . 270,235 270,235
(1) Average price paid per share is calculated on a settlement basis and excludes commissions.(2) The share repurchases above were completed pursuant to a program announced in the fourth quarter of 2010
and most recently expanded in October 2015. This repurchase program is not subject to an expiration date.
22

There were no unregistered sales of equity securities during the period covered by this Annual Report.Shares of our common stock purchased by participants in our Employee Stock Purchase Plan were delivered toparticipant accounts via open market purchases at fair value by the third-party administrator under the plan. Wedo not reserve shares for this plan or discount the purchase price of the shares.
23

Item 6. Selected Financial Data.
The following table sets forth our selected consolidated financial and other data at the dates and for theperiods indicated. The selected financial data should be read in conjunction with “Management’s Discussion andAnalysis of Financial Condition and Results of Operations” and our consolidated financial statements and thenotes thereto appearing elsewhere in this Annual Report on Form 10-K.
($ in thousands, except per share data) Years Ended December 31,
2015 (1) 2014 (1) 2013 (1) 2012 (2) 2011 (2)
Results of OperationsRevenues . . . . . . . . . . . . . . . . . . . . . . . . . . . . . . . . . . . $381,977 $450,598 $389,215 $280,086 $ 204,652Operating expenses . . . . . . . . . . . . . . . . . . . . . . . . . . . 301,599 319,878 275,711 219,641 190,749Operating income . . . . . . . . . . . . . . . . . . . . . . . . . . . . 80,378 130,720 113,504 60,445 13,903Income tax expense (benefit) (3) . . . . . . . . . . . . . . . . 36,972 39,349 44,778 27,030 (132,428)Net income (3) . . . . . . . . . . . . . . . . . . . . . . . . . . . . . . 30,671 96,965 77,130 37,773 145,420Net income attributable to common
stockholders (3) . . . . . . . . . . . . . . . . . . . . . . . . . . . . 35,106 97,700 75,190 37,608 111,678Earnings per share—basic (3) . . . . . . . . . . . . . . . . . . . 3.99 10.75 9.18 4.87 17.98Earnings per share—diluted (3) . . . . . . . . . . . . . . . . . 3.92 10.51 8.92 4.66 16.34Cash dividends declared per share . . . . . . . . . . . . . . . 1.80 1.35 — — —
As of December 31,
2015 (1) 2014 (1) 2013 (2) 2012 (2) 2011 (2)
Balance Sheet DataCash and cash equivalents . . . . . . . . . . . . . . . . . . . . . $ 87,574 $202,847 $271,014 $ 63,432 $ 45,267Investments . . . . . . . . . . . . . . . . . . . . . . . . . . . . . . . . . 56,738 63,448 37,258 18,433 18,357Investments of consolidated sponsored investment
products . . . . . . . . . . . . . . . . . . . . . . . . . . . . . . . . . . 323,335 236,652 139,054 43,227 —Investments of consolidated investment product . . . . 199,485 — — — —Goodwill and other intangible assets, net . . . . . . . . . . 47,588 47,043 49,893 53,971 56,891Total assets . . . . . . . . . . . . . . . . . . . . . . . . . . . . . . . . . 859,729 698,773 644,954 332,749 286,379Accrued compensation and benefits . . . . . . . . . . . . . . 49,617 54,815 53,140 41,252 31,171Debt . . . . . . . . . . . . . . . . . . . . . . . . . . . . . . . . . . . . . . . — — — 15,000 15,000Debt of consolidated investment product . . . . . . . . . . 152,597 — — — —Total liabilities . . . . . . . . . . . . . . . . . . . . . . . . . . . . . . 276,408 112,350 109,900 85,115 68,007Redeemable noncontrolling interests . . . . . . . . . . . . . 73,864 23,071 42,186 3,163 —Total equity . . . . . . . . . . . . . . . . . . . . . . . . . . . . . . . . . 509,457 563,352 492,868 244,471 183,155
As of December 31,
2015 2014 2013 2012 2011
($ in millions)
Assets Under ManagementTotal assets under management . . . . . . . . . . . . . . . . . $ 47,385 $ 56,702 $ 57,740 $ 45,537 $ 34,588
(1) Derived from audited consolidated financial statements included elsewhere in this Annual Report onForm 10-K.
(2) Derived from audited consolidated financial statements not included in this Annual Report on Form 10-K.(3) The amount shown for the 2014 fiscal year includes a net tax benefit of approximately $15.5 million due to
the resolution of uncertain tax positions. The amount shown for the 2011 fiscal year includes a tax benefit of$132.4 million, primarily related to the release of a valuation allowance on certain deferred tax assets.
24

Item 7. Management’s Discussion and Analysis of Financial Condition and Results of Operations.
Overview
Our Business
We are a provider of investment management and related services to individuals and institutions. We use amulti-manager, multi-style approach, offering investment strategies from affiliated managers and unaffiliatedsubadvisers, each having its own distinct investment style, autonomous investment process and individual brand.By offering a broad array of products, we believe we can appeal to a greater number of investors, which allowsus to have offerings across market cycles through changes in investor preferences. Our earnings are primarilydriven by asset-based fees charged for services relating to these various products including investmentmanagement, fund administration, distribution and shareholder services.
We offer investment strategies for individual and institutional investors in different product structures andthrough multiple distribution channels. Our investment strategies are available in a diverse range of styles anddisciplines, managed by a collection of boutique investment managers, both affiliated and unaffiliated. We haveofferings in various asset classes (domestic and international equity, fixed income and alternative), in all marketcapitalizations (large, mid and small), in different styles (growth, blend and value) and with various investmentapproaches (fundamental, quantitative and thematic). Our retail products include open-end mutual funds, closed-end funds, exchange traded funds (“ETFs”), variable insurance funds, UCITs, and separately managed accounts.We also offer certain of our investment strategies to institutional clients.
We distribute our open-end funds and exchange traded funds principally through financial intermediaries.We have broad access in the retail market, with distribution partners that include national and regional broker-dealers, independent broker-dealers and registered investment advisors, banks and insurance companies. In manyof these firms, we have a number of products that are on firms’ preferred “recommended” lists and on fee-basedadvisory programs. Our sales efforts are supported by regional sales professionals, a national account relationshipgroup and separate teams for exchange traded funds, our retirement and insurance products.
Our separately managed accounts are distributed through financial intermediaries and directly by teams atone of our affiliated managers. Our institutional distribution strategy is an affiliate-centric and coordinatedmodel. Through relationships with consultants, our affiliates target key market segments, including foundationsand endowments, corporate, public and private pension plans and unaffiliated mutual funds.
Market Developments
In 2015, the global equity markets were down as evidenced by the MSCI World Index ending the year at1,663 as compared to 1,710 at the start of the year, a decrease of 2.7%. The major U.S. equity indexes were alsodown for 2015, with the Dow Jones Industrial Average ending the year at 17,425, from 17,823 at the beginningof the year, a decrease of 2.2%, and the Standard & Poor’s 500 Index decreased by 0.7% ending the year at2,044, from 2,059 at the beginning of the year. The major U.S. bond index, the Barclays U.S. Aggregate BondIndex, increased 0.5% in 2015 ending the year at 1,925, compared to 1,915 at the beginning of the year.
The financial markets have had and are likely to continue to have a significant impact on asset flows and thevalue of our assets under management. The capital and financial markets could experience fluctuation, volatilityand declines, as they have in the past, which could impact relative investment returns and asset flows amonginvestment products as well as investor choices and preferences among investment products, including equity,fixed income and alternative products.
Financial Highlights
• Net income per diluted share was $3.92 in 2015 compared to $10.51 in 2014.
25

• Total sales (inflows) were $12.7 billion in 2015 compared to $15.2 billion in 2014. Net outflows were$6.3 billion in 2015 compared to $1.2 billion in 2014.
• Assets under management were $47.4 billion at December 31, 2015 compared to $56.7 billion atDecember 31, 2014.
Assets Under Management
At December 31, 2015, we managed $47.4 billion in total assets, representing a decrease of $9.3 billion, or16.4%, from the $56.7 billion managed at December 31, 2014. The decrease in assets under management wasprimarily due to net outflows of $6.3 billion and market depreciation of $2.2 billion. The $6.3 billion in netoutflows during 2015 was primarily attributable to $6.6 billion in net outflows in five Virtus open-end funds,previously known as the AlphaSector funds. During 2015, the Company terminated the services of theunaffiliated subadviser to the former AlphaSector funds and at December 31, 2015, assets under management inthese products represented $2.7 billion, or 5.7% of total assets under management. Excluding the formerAlphaSector funds, net inflows were $0.3 billion during 2015.
Assets under management for our open-end funds were $28.9 billion at December 31, 2015, a decrease of$8.6 billion, or 23.0%, from $37.5 billion at December 31, 2014. Average assets under management for allproducts, which generally correspond to our fee-earning asset levels, decreased by $6.8 billion, or 11.5%, to$52.3 billion for the year ended December 31, 2015, from $59.1 billion for the year ended December 31, 2014for the same reasons discussed above regarding total assets under management.
Certain mutual funds employ the use of leverage as part of their investment strategies. The addition orreduction of leverage will increase or decrease our assets under management, as the proceeds from the use ofleverage are invested in accordance with the funds’ investment strategies. For the periods ended December, 31,2015, 2014 and 2013, we had assets under management from the use of leverage of $1.6 billion, $1.8 billion and$2.2 billion, respectively, which represents 3.5%, 3.3% and 3.8% of our total assets under management,respectively.
The changes in our assets under management may also be affected by the factors discussed in Item 1A ofthis Annual Report on Form 10-K “Risk Factors”.
Operating Results
In 2015, total revenues decreased 15.2% to $382.0 million from $450.6 million in 2014. Revenuesdecreased in 2015 compared to 2014, primarily as a result of a decrease in average assets under management.Operating income decreased by 38.5% from $130.7 million in 2014 to $80.4 million in 2015, primarily due todecreased revenues driven by lower levels of average assets under management offset by lower operatingexpenses associated with the decreased revenues discussed above.
26

Assets Under Management by Product
The following table summarizes our assets under management by product:
As of December 31, Change
2015 2014 20132015 vs.
2014 %2014 vs.
2013 %
($ in millions)
Fund assetsOpen-end funds (1) . . . . . . . . $28,882.1 $37,514.2 $37,679.5 $(8,632.1) (23.0)% $ (165.3) (0.4)%Closed-end funds . . . . . . . . . . 6,222.3 7,581.4 6,499.6 (1,359.1) (17.9)% 1,081.8 16.6%Exchange traded funds . . . . . 340.8 — — 340.8 100.0% — — %Money market funds (2) . . . . — — 1,556.6 — — % (1,556.6) (100.0)%
Total fund assets . . . . . . . . . . . . . . 35,445.2 45,095.6 45,735.7 (9,650.4) (21.4)% (640.1) (1.4)%Separately managed
accounts (3) . . . . . . . . . . . . . . . . 6,784.4 6,884.8 7,433.1 (100.4) (1.5)% (548.3) (7.4)%
Total retail assets . . . . . . . . . . . . . . 42,229.6 51,980.4 53,168.8 (9,750.8) (18.8)% (1,188.4) (2.2)%Total institutional accounts (3) . . . 5,155.7 4,722.0 4,570.8 433.7 9.2% 151.2 3.3%
Total Assets UnderManagement . . . . . . . . . . . . . . $47,385.3 $56,702.4 $57,739.6 $(9,317.1) (16.4)% $(1,037.2) (1.8)%
Average Assets UnderManagement . . . . . . . . . . . . . . $52,310.5 $59,122.1 $52,975.8 $(6,811.6) (11.5)% $ 6,146.3 11.6%
(1) Includes assets under management of open-end mutual funds, UCITS and variable insurance funds.(2) On October 20, 2014, our money market funds were liquidated.(3) Includes assets under management related to option strategies.
27

Asset Flows by Product
The following table summarizes our asset flows by product for the periods indicated:
($ in millions) December 31,
2015 2014 2013
Open-End Funds (1)Beginning balance . . . . . . . . . . . . . . . . . . . . . . . . . . . . . . . . . . . . . . . . . . . . . . . . . . . . . . . . . . . . . $ 37,514.2 $ 37,679.5 $ 27,122.8Inflows . . . . . . . . . . . . . . . . . . . . . . . . . . . . . . . . . . . . . . . . . . . . . . . . . . . . . . . . . . . . . . . . . . . . . . 10,046.8 12,733.7 19,146.3Outflows . . . . . . . . . . . . . . . . . . . . . . . . . . . . . . . . . . . . . . . . . . . . . . . . . . . . . . . . . . . . . . . . . . . . . (17,010.5) (13,428.1) (11,237.1)
Net flows . . . . . . . . . . . . . . . . . . . . . . . . . . . . . . . . . . . . . . . . . . . . . . . . . . . . . . . . . . . . . . . . . . . . (6,963.7) (694.4) 7,909.2Market performance . . . . . . . . . . . . . . . . . . . . . . . . . . . . . . . . . . . . . . . . . . . . . . . . . . . . . . . . . . . . (1,511.5) 1,297.2 2,337.9Other (2) . . . . . . . . . . . . . . . . . . . . . . . . . . . . . . . . . . . . . . . . . . . . . . . . . . . . . . . . . . . . . . . . . . . . . (156.9) (768.1) 309.6
Ending balance . . . . . . . . . . . . . . . . . . . . . . . . . . . . . . . . . . . . . . . . . . . . . . . . . . . . . . . . . . . . . . . $ 28,882.1 $ 37,514.2 $ 37,679.5
Closed-End FundsBeginning balance . . . . . . . . . . . . . . . . . . . . . . . . . . . . . . . . . . . . . . . . . . . . . . . . . . . . . . . . . . . . . $ 7,581.4 $ 6,499.6 $ 6,231.6Inflows . . . . . . . . . . . . . . . . . . . . . . . . . . . . . . . . . . . . . . . . . . . . . . . . . . . . . . . . . . . . . . . . . . . . . . — 493.8 —Outflows . . . . . . . . . . . . . . . . . . . . . . . . . . . . . . . . . . . . . . . . . . . . . . . . . . . . . . . . . . . . . . . . . . . . . — — —
Net flows . . . . . . . . . . . . . . . . . . . . . . . . . . . . . . . . . . . . . . . . . . . . . . . . . . . . . . . . . . . . . . . . . . . . — 493.8 —Market performance . . . . . . . . . . . . . . . . . . . . . . . . . . . . . . . . . . . . . . . . . . . . . . . . . . . . . . . . . . . . (811.9) 799.3 728.2Other (2) . . . . . . . . . . . . . . . . . . . . . . . . . . . . . . . . . . . . . . . . . . . . . . . . . . . . . . . . . . . . . . . . . . . . . (547.2) (211.3) (460.2)
Ending balance . . . . . . . . . . . . . . . . . . . . . . . . . . . . . . . . . . . . . . . . . . . . . . . . . . . . . . . . . . . . . . . $ 6,222.3 $ 7,581.4 $ 6,499.6
Exchange Traded FundsBeginning balance . . . . . . . . . . . . . . . . . . . . . . . . . . . . . . . . . . . . . . . . . . . . . . . . . . . . . . . . . . . . . $ — $ — $ —Inflows . . . . . . . . . . . . . . . . . . . . . . . . . . . . . . . . . . . . . . . . . . . . . . . . . . . . . . . . . . . . . . . . . . . . . . 342.8 — —Outflows . . . . . . . . . . . . . . . . . . . . . . . . . . . . . . . . . . . . . . . . . . . . . . . . . . . . . . . . . . . . . . . . . . . . . (49.0) — —
Net flows . . . . . . . . . . . . . . . . . . . . . . . . . . . . . . . . . . . . . . . . . . . . . . . . . . . . . . . . . . . . . . . . . . . . 293.8 — —Market performance . . . . . . . . . . . . . . . . . . . . . . . . . . . . . . . . . . . . . . . . . . . . . . . . . . . . . . . . . . . . (27.9) — —Other (2) . . . . . . . . . . . . . . . . . . . . . . . . . . . . . . . . . . . . . . . . . . . . . . . . . . . . . . . . . . . . . . . . . . . . . 74.9 — —
Ending balance . . . . . . . . . . . . . . . . . . . . . . . . . . . . . . . . . . . . . . . . . . . . . . . . . . . . . . . . . . . . . . . $ 340.8 $ — $ —
Money Market FundsBeginning balance . . . . . . . . . . . . . . . . . . . . . . . . . . . . . . . . . . . . . . . . . . . . . . . . . . . . . . . . . . . . . $ — $ 1,556.6 $ 1,994.1Other (2) . . . . . . . . . . . . . . . . . . . . . . . . . . . . . . . . . . . . . . . . . . . . . . . . . . . . . . . . . . . . . . . . . . . . . — (1,556.6) (437.5)
Ending balance . . . . . . . . . . . . . . . . . . . . . . . . . . . . . . . . . . . . . . . . . . . . . . . . . . . . . . . . . . . . . . . $ — $ — $ 1,556.6
Separately Managed Accounts (3)Beginning balance . . . . . . . . . . . . . . . . . . . . . . . . . . . . . . . . . . . . . . . . . . . . . . . . . . . . . . . . . . . . . $ 6,884.8 $ 7,433.1 $ 5,829.0Inflows . . . . . . . . . . . . . . . . . . . . . . . . . . . . . . . . . . . . . . . . . . . . . . . . . . . . . . . . . . . . . . . . . . . . . . 1,291.9 1,333.6 1,384.0Outflows . . . . . . . . . . . . . . . . . . . . . . . . . . . . . . . . . . . . . . . . . . . . . . . . . . . . . . . . . . . . . . . . . . . . . (1,428.6) (2,244.8) (1,225.9)
Net flows . . . . . . . . . . . . . . . . . . . . . . . . . . . . . . . . . . . . . . . . . . . . . . . . . . . . . . . . . . . . . . . . . . . . (136.7) (911.2) 158.1Market performance . . . . . . . . . . . . . . . . . . . . . . . . . . . . . . . . . . . . . . . . . . . . . . . . . . . . . . . . . . . . 70.7 355.5 1,481.4Other (2) . . . . . . . . . . . . . . . . . . . . . . . . . . . . . . . . . . . . . . . . . . . . . . . . . . . . . . . . . . . . . . . . . . . . . (34.4) 7.4 (35.4)
Ending balance . . . . . . . . . . . . . . . . . . . . . . . . . . . . . . . . . . . . . . . . . . . . . . . . . . . . . . . . . . . . . . . $ 6,784.4 $ 6,884.8 $ 7,433.1
Institutional Accounts (3)Beginning balance . . . . . . . . . . . . . . . . . . . . . . . . . . . . . . . . . . . . . . . . . . . . . . . . . . . . . . . . . . . . . $ 4,722.0 $ 4,570.8 $ 4,359.5Inflows . . . . . . . . . . . . . . . . . . . . . . . . . . . . . . . . . . . . . . . . . . . . . . . . . . . . . . . . . . . . . . . . . . . . . . 1,008.3 650.5 796.3Outflows . . . . . . . . . . . . . . . . . . . . . . . . . . . . . . . . . . . . . . . . . . . . . . . . . . . . . . . . . . . . . . . . . . . . . (526.1) (743.0) (782.1)
Net flows . . . . . . . . . . . . . . . . . . . . . . . . . . . . . . . . . . . . . . . . . . . . . . . . . . . . . . . . . . . . . . . . . . . . 482.2 (92.5) 14.2Market performance . . . . . . . . . . . . . . . . . . . . . . . . . . . . . . . . . . . . . . . . . . . . . . . . . . . . . . . . . . . . 46.2 389.2 314.7Other (2) . . . . . . . . . . . . . . . . . . . . . . . . . . . . . . . . . . . . . . . . . . . . . . . . . . . . . . . . . . . . . . . . . . . . . (94.7) (145.5) (117.6)
Ending balance . . . . . . . . . . . . . . . . . . . . . . . . . . . . . . . . . . . . . . . . . . . . . . . . . . . . . . . . . . . . . . . $ 5,155.7 $ 4,722.0 $ 4,570.8
TotalBeginning balance . . . . . . . . . . . . . . . . . . . . . . . . . . . . . . . . . . . . . . . . . . . . . . . . . . . . . . . . . . . . . $ 56,702.4 $ 57,739.6 $ 45,537.0Inflows . . . . . . . . . . . . . . . . . . . . . . . . . . . . . . . . . . . . . . . . . . . . . . . . . . . . . . . . . . . . . . . . . . . . . . 12,689.8 15,211.6 21,326.6Outflows . . . . . . . . . . . . . . . . . . . . . . . . . . . . . . . . . . . . . . . . . . . . . . . . . . . . . . . . . . . . . . . . . . . . . (19,014.2) (16,415.9) (13,245.1)
Net flows . . . . . . . . . . . . . . . . . . . . . . . . . . . . . . . . . . . . . . . . . . . . . . . . . . . . . . . . . . . . . . . . . . . . (6,324.4) (1,204.3) 8,081.5Market performance . . . . . . . . . . . . . . . . . . . . . . . . . . . . . . . . . . . . . . . . . . . . . . . . . . . . . . . . . . . . (2,234.4) 2,841.2 4,862.2Other (2) . . . . . . . . . . . . . . . . . . . . . . . . . . . . . . . . . . . . . . . . . . . . . . . . . . . . . . . . . . . . . . . . . . . . . (758.3) (2,674.1) (741.1)
Ending balance . . . . . . . . . . . . . . . . . . . . . . . . . . . . . . . . . . . . . . . . . . . . . . . . . . . . . . . . . . . . . . . $ 47,385.3 $ 56,702.4 $ 57,739.6
28

(1) Includes assets under management of open-end mutual funds, UCITS and variable insurance funds.(2) Represents dividends distributed, net of reinvestments, net flows of cash management strategies, net flows
and market performance on structured products, which are a component of institutional accounts, and netflows from non-sales related activities such as asset acquisitions/(dispositions), marketable securitiesinvestments/(withdrawals) and the impact on assets from the use of leverage.
(3) Includes assets under management related to option strategies
The following table summarizes our assets under management by asset class:
December 31, Change
2015 2014 20132015 vs.
2014 %2014 vs.
2013 %
($ in millions)
Asset ClassEquity . . . . . . . . . . . . . . . . . . . $28,314.9 $34,180.7 $33,610.7 $(5,865.8) (17.2)% $ 570.0 1.7%Fixed income . . . . . . . . . . . . . 15,115.6 16,681.6 15,829.4 (1,566.0) (9.4)% 852.2 5.4%Alternatives (1) . . . . . . . . . . . 3,468.7 5,372.4 5,308.3 (1,903.7) (35.4)% 64.1 1.2%Other (2) . . . . . . . . . . . . . . . . . 486.1 467.7 2,991.2 18.4 3.9% (2,523.5) (84.4)%
Total . . . . . . . . . . . . . . . . . . . $47,385.3 $56,702.4 $57,739.6 $(9,317.1) (16.4)% $(1,037.2) (1.8)%
(1) Consists of long/short equity, real estate securities, master-limited partnerships and other.(2) Consists of option strategies and cash management; at December 31, 2013, cash management strategies,
which were liquidated in 2014, were $1,587.6 million.
Average Assets Under Management and Average Basis Points
The following table summarizes average assets under management and the average management fee earned:
December 31,
Average Fee Earned(expressed in basis points)
Average Assets Under Management($ in millions)
2015 2014 2013 2015 2014 2013
ProductsOpen-End Funds (1) . . . . . . . . . . . . . . . . . . . . . . . . . . 48.2 51.3 51.1 $33,290.1 $39,620.3 $33,821.0Closed-End Funds . . . . . . . . . . . . . . . . . . . . . . . . . . . 66.7 65.6 61.6 6,946.3 7,112.9 6,476.0Exchange Traded Funds . . . . . . . . . . . . . . . . . . . . . . . 23.6 — — 179.3 — —Money Market Funds . . . . . . . . . . . . . . . . . . . . . . . . . — — 1.6 — 1,060.1 1,700.7Separately Managed Accounts (2) . . . . . . . . . . . . . . . 54.1 51.9 48.7 6,863.8 6,774.2 6,471.4Institutional Accounts (2) . . . . . . . . . . . . . . . . . . . . . 34.9 35.5 33.7 5,031.0 4,554.6 4,506.7
All Products . . . . . . . . . . . . . . . . . . . . . . . . . . . 50.1 50.9 49.2 $52,310.5 $59,122.1 $52,975.8
(1) Includes assets under management of open-end mutual funds, UCITS and variable insurance funds.(2) Includes assets under management related to options strategies.
Average fees earned represent investment management fees net of fees paid to third-party service providersfor investment management related services and less the impact of investment management fees earned fromconsolidated sponsored investment products divided by average net assets. Mutual funds and exchange tradedfund fees are calculated based on average daily or weekly net assets. Separately managed account fees arecalculated based on the end of the preceding or current quarter’s asset values or on an average of month-endbalances. Institutional account fees are calculated based on an average of month-end balances or current quarter’sasset values. Average fees earned will vary based on several factors, including the asset mix and reimbursementsto funds.
29

Year ended December 31, 2015 compared to year ended December 31, 2014. The average fee rate earnedfor 2015 decreased 0.8 basis points as compared to the prior year primarily related to a 3.1 basis point decrease inthe open-end mutual fund fee rate partially offset by an increase in the average fee rate on separately managedaccounts which was driven by increased average high net worth assets under management. The 3.1 basis pointdecline in the open-end fund fee rate was primarily attributable to a negative $13.3 million variable incentive feefrom one mutual fund during 2015. Excluding the variable incentive fee, the open-end fund fee rate would havebeen 52.2 basis points in 2015 compared to 50.9 in 2014.
Year ended December 31, 2014 compared to year ended December 31, 2013. The average fee rate earnedfor 2014 increased 1.7 basis points as compared to the prior year primarily related to the liquidation of our moneymarket funds in October 2014 and an increase in the closed-end fund fee rate related to a closed-end fund launchduring the year. The average fee rate earned on institutional and separately managed accounts increased in 2014as compared to 2013 primarily due to the redemption of low fee earning accounts.
Results of Operations
Summary Financial Data
Years Ended December 31, Change
2015 2014 2013 2015 vs. 2014 % 2014 vs. 2013 %
($ in thousands)
Investment management fees . . . . . $264,865 $300,663 $260,557 $(35,798) (11.9)% $40,106 15.4%Other revenue . . . . . . . . . . . . . . . . . 117,112 149,935 128,658 (32,823) (21.9)% 21,277 16.5%
Total revenues . . . . . . . . . . . . . . . . 381,977 450,598 389,215 (68,621) (15.2)% 61,383 15.8%
Total operating expenses . . . . . . . 301,599 319,878 275,711 (18,279) (5.7)% 44,167 16.0%
Operating income . . . . . . . . . . . . . 80,378 130,720 113,504 (50,342) (38.5)% 17,216 15.2%Other (expense) income, net . . . . . . (26,650) (2,843) 5,939 (23,807) 837.4% (8,782) (147.9)%Interest income, net . . . . . . . . . . . . . 13,915 8,437 2,465 5,478 64.9% 5,972 242.3%
Income before income taxes . . . . . 67,643 136,314 121,908 (68,671) (50.4)% 14,406 11.8%Income tax expense . . . . . . . . . . . . . 36,972 39,349 44,778 (2,377) (6.0)% (5,429) (12.1)%
Net income . . . . . . . . . . . . . . . . . . . 30,671 96,965 77,130 (66,294) (68.4)% 19,835 25.7%Noncontrolling interests . . . . . . . . . 4,435 735 (1,940) 3,700 503.4% 2,675 (137.9)%Net income attributable to
common stockholders . . . . . . . . $ 35,106 $ 97,700 $ 75,190 $(62,594) (64.1)% $22,510 29.9%
Earnings per share—diluted . . . . $ 3.92 $ 10.51 $ 8.92 $ (6.59) (62.7)% $ 1.59 17.8%
30

Revenues
Total revenues were $382.0 million in 2015 compared to $450.6 million in 2014 representing a decrease of$68.6 million or 15.2%. The decrease was primarily due to lower average assets under management and lowerfee rates in 2015 compared to 2014.
Revenues by source were as follows:
Years Ended December 31, Change
($ in thousands) 2015 2014 2013 2015 vs 2014 % 2014 vs 2013 %
Investment management feesFunds . . . . . . . . . . . . . . . . . . . . . . . . . . . . . . . . $209,994 $249,348 $213,863 $(39,354) (15.8)% $35,485 16.6%Separately managed accounts . . . . . . . . . . . . . 37,296 35,153 31,510 2,143 6.1% 3,643 11.6%Institutional accounts . . . . . . . . . . . . . . . . . . . 17,575 16,162 15,184 1,413 8.7% 978 6.4%
Total investment management fees . . . . . . . 264,865 300,663 260,557 (35,798) (11.9)% 40,106 15.4%Distribution and service fees . . . . . . . . . . . . 67,066 91,950 78,965 (24,884) (27.1)% 12,985 16.4%Administration and transfer agent fees . . . . 48,247 56,016 48,185 (7,769) (13.9)% 7,831 16.3%Other income and fees . . . . . . . . . . . . . . . . . 1,799 1,969 1,508 (170) (8.6)% 461 30.6%
Total revenues . . . . . . . . . . . . . . . . . . . . . . . . $381,977 $450,598 $389,215 $(68,621) (15.2)% $61,383 15.8%
Investment Management Fees
Year ended December 31, 2015 compared to year ended December 31, 2014. Investment management feesare earned based on a percentage of assets under management and are paid pursuant to the terms of the respectiveinvestment management contracts, which generally require monthly or quarterly payments. Investmentmanagement fees decreased by $35.8 million or 11.9% for the year ended December 31, 2015 due to a 11.5%decrease in average assets under management. The decrease in average assets under management for the yearended December 31, 2015 was due primarily to net outflows and market depreciation related to our open-endfunds.
Year ended December 31, 2014 compared to year ended December 31, 2013. Investment management feesincreased by $40.1 million or 15.4% for the year ended December 31, 2014 due to an 11.6% increase in averageassets under management and an increase of approximately two basis points in average fee rate earned. Theincrease in average assets under management for the year ended December 31, 2014 was due primarily to the2013 growth in assets under management that resulted from net inflows and market appreciation. Revenuesincreased at a higher rate than assets under management due to the increase in the average fee rate earned and thetiming of flows during the year.
Distribution and Service Fees
Year ended December 31, 2015 compared to year ended December 31, 2014. Distribution and service fees,which are asset-based fees earned from open-end funds for distribution services, decreased by $24.9 million or27.1% for the year ended December 31, 2015 as compared to the prior year due to lower average open-end assetsunder management and a lower percentage of assets under management in share classes that pay distribution andservice fees. The decrease in fees also resulted in a corresponding decrease in distribution and administrativeexpenses, primarily driven by decreased payments to third-party distribution partners for providing services toinvestors in our sponsored funds, including marketing support services.
31

Year ended December 31, 2014 compared to year ended December 31, 2013. Distribution and service feesincreased by $13.0 million or 16.4% for the year ended December 31, 2014 as compared to the prior year due tohigher average open-end assets under management. The increase in fees also resulted in a corresponding increasein distribution and administrative expenses, primarily driven by increased payments to third-party distributionpartners for providing services to investors in our sponsored funds, including marketing support services.
Administration and Transfer Agent Fees
Year ended December 31, 2015 compared to year ended December 31, 2014. Administration and transferagent fees represent fees earned for fund administration and shareholder services primarily from our open-endmutual funds and certain of our closed-end funds. Fund administration and transfer agent fees decreased $7.8million or 13.9% for the year ended December 31, 2015 as compared to the prior year due to lower averageassets under management.
Year ended December 31, 2014 compared to year ended December 31, 2013. Fund administration andtransfer agent fees increased $7.8 million or 16.3% for the year ended December 31, 2014 as compared to theprior year due to higher average open-end mutual fund assets under management.
Other Income and Fees
Year ended December 31, 2015 compared to year ended December 31, 2014. Other income and feesprimarily represent contingent sales charges earned from investor redemptions of certain shares sold without afront-end sales charge. Other income and fees decreased $0.2 million or 8.6%, primarily due to lower ancillaryfees related to the high net worth business.
Year ended December 31, 2014 compared to year ended December 31, 2013. Other income and feesincreased $0.5 million or 30.6%, primarily due to an increase in contingent sales charges earned fromredemptions.
Operating Expenses
Total operating expenses were $301.6 million in 2015 compared with $319.9 million in 2014 representing adecrease of $18.3 million or 5.7%. The decrease was primarily related to a decrease in distribution and otherasset-based expenses offset by an increase in other operating expenses.
Operating expenses by category were as follows:
Years Ended December 31, Change
2015 2014 20132015 vs
2014 %2014 vs
2013 %
($ in thousands)Operating expenses
Employment expenses . . . . . . . . . $137,095 $139,809 $131,768 $ (2,714) (1.9)% $ 8,041 6.1%Distribution and other asset-based
expenses . . . . . . . . . . . . . . . . . . 89,731 123,665 97,786 (33,934) (27.4)% 25,879 26.5%Other operating expenses . . . . . . . 68,035 49,569 39,119 18,466 37.3% 10,450 26.7%Restructuring and severance . . . . — 294 203 (294) (100.0)% 91 44.8%Depreciation and amortization
expense . . . . . . . . . . . . . . . . . . 6,738 6,541 6,835 197 3.0% (294) (4.3)%
Total operating expenses . . . . . . . . . . $301,599 $319,878 $275,711 $(18,279) (5.7)% $44,167 16.0%
32
Employment Expenses
Year ended December 31, 2015 compared to year ended December 31, 2014. Employment expensesprimarily consist of fixed and variable compensation and related employee benefit costs. Employment expensesof $137.1 million decreased $2.7 million or 1.9% as compared to the year ended December 31, 2014. Thedecrease was primarily due to a reduction in profit and sales based variable compensation resulting from lowerprofits and sales offset by an increase in fixed employment expenses related to higher staffing levels at ouraffiliates and due to the acquisition of Virtus ETF Solutions.
Year ended December 31, 2014 compared to year ended December 31, 2013. Employment expenses of$139.8 million increased $8.0 million or 6.1% as compared to the year ended December 31, 2013. The increasewas primarily due to personnel additions related to the growth of the business, increases in profit-based variableincentive compensation, payroll taxes and other benefits, resulting from higher profits.
Distribution and Other Asset-Based Expenses
Year ended December 31, 2015 compared to year ended December 31, 2014. Distribution and other asset-based expenses consist primarily of payments to third-party distribution partners for providing services toinvestors in our sponsored funds and payments to third-party service providers for investment managementrelated services. These payments are primarily based on percentages of assets under management or revenues.These expenses also include the amortization of deferred sales commissions related to up-front commissions onshares sold without a front-end sales charge to shareholders. The deferred sales commissions are amortized on astraight line basis over the periods in which commissions are generally recovered from distribution fee revenuesand contingent sales charges received from shareholders of the funds upon redemption of their shares.Distribution and administrative expenses decreased $33.9 million or 27.4% in the year ended December 31, 2015as compared to the prior year. The decrease was primarily attributable to lower average open-end assets undermanagement, a lower percentage of assets under management in share classes where we pay distributionexpenses and closed-end fund structuring costs of $9.6 million incurred in 2014 in connection with the launch ofa closed-end fund in 2014, as no such costs were incurred in 2015. The reduction in expense was partially offsetby an increase in payments to third-party service providers for investment management related services.
Year ended December 31, 2014 compared to year ended December 31, 2013. Distribution andadministrative expenses increased $25.9 million or 26.5% in the year ended December 31, 2014 as compared tothe prior year. The increase was primarily attributable to closed-end fund structuring costs of $9.6 millionincurred in connection with the launch of a closed-end fund in 2014 as well as higher average open-end assetsunder management.
Other Operating Expenses
Year ended December 31, 2015 compared to year ended December 31, 2014. Other operating expensesprimarily consist of investment research and technology costs, professional fees, travel and distribution relatedcosts, rent and occupancy expenses, operating expenses of our consolidated sponsored investment products andother miscellaneous costs. Other operating expenses increased $18.5 million or 37.3% to $68.0 million for theyear ended December 31, 2015 as compared to $49.6 million in the prior year. The increase over the prior yearwas primarily due to the previously disclosed $16.5 million regulatory settlement.
Year ended December 31, 2014 compared to year ended December 31, 2013. Other operating expensesincreased $10.5 million or 26.7% to $49.6 million for the year ended December 31, 2014 as compared to $39.1million in the prior year. The increase over the prior year reflected additional costs primarily attributable toincreased sales and marketing activities, professional fees and costs related to the ongoing transition of middle-and-back office systems to a third-party service provider. Other operating expenses of consolidated sponsoredinvestment products increased by $2.2 million over the prior year, reflecting the consolidation of an additionalfour funds during the year.
33
Restructuring and Severance
We incurred $0.3 million and $0.2 million of restructuring and severance costs in 2014 and 2013,respectively, resulting from staff reductions.
Depreciation and Amortization Expense
Year ended December 31, 2015 compared to year ended December 31, 2014. Depreciation and amortizationexpense consists primarily of the straight-line depreciation of furniture, equipment and leasehold improvementsas well as the amortization of acquired investment advisory contracts, recorded as definite-lived intangible assets,both over their estimated useful lives. Depreciation and amortization expense increased $0.2 million or 3.0% to$6.7 million for the year ended December 31, 2015 primarily due to higher depreciation as a result of theincrease in our furniture, equipment and leasehold improvements, partially offset by lower amortization ofintangible assets.
Year ended December 31, 2014 compared to year ended December 31, 2013. Depreciation and amortizationexpense decreased $0.3 million or 4.3% to $6.5 million for the year ended December 31, 2014 as compared to$6.8 million in the prior year primarily as a result of the increase in our furniture, equipment and leaseholdimprovements as a result of the growth in the business offset by lower amortization of intangible assets.
Other Income (Expense), net
Year ended December 31, 2015 compared to year ended December 31, 2014. Other income (expense), netconsists primarily of realized and unrealized gains and losses recorded on investments, investments ofconsolidated sponsored investment products and our consolidated investment product as well as other incomeincluding earnings from equity method investments. Other (expense) income, net decreased from the prior yearby $23.8 million or 837.4%. Realized and unrealized losses on investments of consolidated sponsored investmentproducts and the consolidated investment product were $26.7 million in 2015, compared to $4.6 million duringthe prior year. Excluding investments of consolidated sponsored investment products and the consolidatedinvestment product, other (expense) income, net decreased $1.8 million primarily due to a decrease in realizedand unrealized gains on investments partially offset by an increase in earnings on equity method investments.
Year ended December 31, 2014 compared to year ended December 31, 2013. Other (expense) income, net,decreased from the prior year by $8.8 million or 147.9%. Excluding investments of consolidated sponsoredinvestment products, Other (expense) income, net decreased $0.6 million primarily due to a decrease in realizedand unrealized gains on investments partially offset by an increase in earnings on equity method investments.Investments of consolidated sponsored investment products recognized $4.6 million of unrealized losses during2014 versus $3.5 million of unrealized gains during the prior year.
Interest Income (Expense), net
Year ended December 31, 2015 compared to year ended December 31, 2014. Interest income, net consistsof interest and dividend income earned on cash equivalents, investments, the investments of our consolidatedsponsored investment products and our consolidated investment product. Interest income, net increased $5.5million or 64.9% in 2015 compared to the prior year. The increase in interest income, net, was primarily due tohigher interest and dividend income earned on our investments and the investments of our consolidatedsponsored investment products. Investments of consolidated sponsored investment products have grown $86.7million, or 36.6%, during 2015 from $236.7 million at December 31, 2014 to $323.3 million at December 31,2015. Additionally our consolidated investment product has investments of $199.5 million at December 31, 2015compared to $0 at December 31, 2014.
34

Year ended December 31, 2014 compared to year ended December 31, 2013. Interest income, net increased$6.0 million or 242.3% in 2014 compared to the prior year. The increase in interest income, net was primarilydue to higher interest and dividend income earned on our investments and the investments of our consolidatedsponsored investment products. Investments of consolidated sponsored investment products have grown $97.6million, or 70.2% during 2014 from $139.1 million at December 31, 2013 to $236.7 million at December 31,2014.
Income Tax Expense
Year ended December 31, 2015 compared to year ended December 31, 2014. The provision for incometaxes reflected U.S. federal, state and local taxes at an estimated effective tax rate of 54.6% and 28.9% for 2015and 2014, respectively. The increase in the 2015 effective tax rate as compared to 2014 was primarily due to anincrease in the valuation allowances related to the unrealized loss position on our marketable securities in 2015as well as a non recurring tax benefit recognized in 2014 related to the settlement of an audit of our 2011 federalcorporate income tax return.
Year ended December 31, 2014 compared to year ended December 31, 2013. The provision for incometaxes reflected U.S. federal, state and local taxes at an estimated effective tax rate of 28.9% and 36.7% for 2014and 2013, respectively. Our effective tax rate for the year ended December 31, 2014 was impacted by a net taxbenefit of approximately $15.5 million due to the settlement of an Internal Revenue Service (“IRS”) examinationof our 2011 federal consolidated corporate income tax return. The net benefit arose from the settlement of theCompany’s 2011 IRS exam and was comprised of the recognition of tax benefits from previously uncertain taxpositions of approximately $31.0 million and a reduction in the available loss deduction of approximately $15.5million of which both relate to the past dissolution of a subsidiary. This benefit was partially offset by a $2.2million valuation allowance primarily related to unrealized mark-to-market loss positions on our seed capitalportfolio.
Effects of Inflation
Inflationary pressures can result in increases to our cost structure, especially to the extent that large expensecomponents such as compensation are impacted. To the degree that these expense increases are not recoverableor cannot be counterbalanced through pricing increases due to the competitive environment, our profitabilitycould be negatively impacted. In addition, the value of the assets that we manage may be negatively impactedwhen inflationary expectations result in a rising interest rate environment. Declines in the values of these assetsunder management could lead to reduced revenues as management fees are generally earned as a percent ofassets under management.
Liquidity and Capital Resources
Certain Financial Data
The following tables summarize certain key financial data relating to our liquidity and capital resources:
December 31, Change
($ in thousands) 2015 2014 20132015 vs.
2014 %2014 vs.
2013 %
Balance Sheet DataCash and cash equivalents . . . . . . . . $ 87,574 $202,847 $271,014 $(115,273) (56.8)% $(68,167) (25.2)%Investments . . . . . . . . . . . . . . . . . . . 56,738 63,448 37,258 (6,710) (10.6)% 26,190 70.3%Deferred taxes, net . . . . . . . . . . . . . . 54,143 60,162 64,500 (6,019) (10.0)% (4,338) (6.7)%Dividends payable . . . . . . . . . . . . . . 4,233 4,270 — (37) (0.9)% 4,270 100.0%Total equity . . . . . . . . . . . . . . . . . . . 509,457 563,352 492,868 (53,895) (9.6)% 70,484 14.3%
35

Years Ended December 31,
2015 2014 2013
Cash Flow DataProvided by (used in)Operating activities . . . . . . . . . . . . . . . . . . . . . . . . . . . . . . . . . . . . . . . . . . . . . . $(209,430) $(58,871) $ 28,837Investing activities . . . . . . . . . . . . . . . . . . . . . . . . . . . . . . . . . . . . . . . . . . . . . . . (6,438) (8,181) (6,231)Financing activities . . . . . . . . . . . . . . . . . . . . . . . . . . . . . . . . . . . . . . . . . . . . . . 109,948 (1,189) 185,493
Overview
We maintained significant liquidity and capital resources during the year ended December 31, 2015. AtDecember 31, 2015, we had $87.6 million of cash and cash equivalents and $41.5 million of investments inmarketable securities compared to $202.8 million of cash and cash equivalents and $50.3 million of investmentsin marketable securities at December 31, 2014. We have additional liquidity available through an amended,senior secured revolving credit facility (“Credit Facility”) that allows us to borrow up to $75.0 million, whichexpires in September 2017. Under the terms of the underlying credit agreement, we can increase this facility to$125.0 million upon satisfaction of certain approval requirements by the lending group. At December 31, 2015,we had no outstanding borrowings under the Credit Facility.
Short-Term Capital Requirements
Our short-term capital requirements, which we consider to be those capital requirements due within oneyear, include payment of annual incentive compensation, income tax payments and other operating expenses,primarily consisting of investment research and technology costs, professional fees, distribution and occupancycosts. Incentive compensation which is one of the largest annual operating cash expenditures is paid in the firstquarter of the year. In the first quarter of 2015 and 2014, we paid approximately $45.9 million and $45.0 million,respectively, in incentive compensation earned during the years ended December 31, 2014 and 2013,respectively. Short-term capital requirements may also be affected by employee tax withholding paymentsrelated to the net share settlement of equity awards. Our liquidity could also be impacted by certain commitmentsand contingencies as described in Note 10 of our consolidated financial statements.
Other Uses of Capital
We expect that our main uses of cash will be to (i) invest in our organic growth, including our distributionefforts and closed-end fund launches; (ii) seed new investment strategies and make new investments to introducenew products or to enhance distribution access; (iii) return capital to stockholders through acquisition of shares ofour common stock, payment of cash dividends on our common stock or other means; (iv) fund ongoing andpotential investments in our infrastructure; and (v) invest in inorganic growth opportunities as they arise.
During 2015, our Board of Directors authorized an additional 1.5 million shares of our common stock to berepurchased under our share repurchase program that was implemented in 2010. As of December 31, 2015, 2.7million shares of our common stock have been authorized to be repurchased under the program and 1,485,856shares remain available for repurchase. Under the terms of the program, the Company may repurchase shares ofits common stock from time to time at its discretion through open market repurchases and/or privately negotiatedtransactions, depending on price and prevailing market and business conditions. The program, which has nospecified term, may be suspended or terminated at any time. During 2015, we paid approximately $80.0 millionto repurchase a total of 638,703 common shares under the board authorized share repurchase program. During2014, we paid approximately $40.3 million to repurchase 225,441 common shares under the same program.
In each quarter of 2015, we paid cash dividends on our common stock in the amount of $0.45 per share,respectively, totaling $16.0 million for the year. On February 11, 2016, we paid a cash dividend on our commonstock in the amount of $0.45 per share totaling $3.8 million. On February 17, 2016, our Board of Directors
36

declared a quarterly cash dividend of $0.45 per common share to be paid on May 13, 2016 to shareholders ofrecord at the close of business on April 29, 2016. During 2014, we paid cash dividends on our common stocktotaling $8.2 million.
During 2015, we made seed investments of $60.5 million into nine new mutual funds and invested $40.0million in a special purpose entity (“SPE”), that we refer to as a consolidated investment product, that wascreated specifically to accumulate bank loan assets for securitization as a potential CLO that will be managed byour Newfleet affiliate. At December 31, 2015, we had total seed and CLO investments of $273.7 million and$38.2 million, respectively.
Capital and Reserve Requirements
The Company has two broker-dealer subsidiares registered with the SEC and are subject to certain rulesregarding minimum net capital, as defined by those rules. The broker-dealers are required to maintain a ratio of“aggregate indebtedness” to “net capital,” as defined, which may not exceed 15 to 1 and must also maintain aminimum amount of net capital. Failure to meet these requirements could result in adverse consequences to usincluding additional reporting requirements, a lower required ratio of aggregate indebtedness to net capital orinterruption of our business. At December 31, 2015 and 2014, the ratio of aggregate indebtedness to net capital ofour broker-dealers was below the maximum allowed, and net capital was significantly greater than the requiredminimum.
Balance Sheet
Cash and cash equivalents consist of cash in banks and money market fund investments. Investments consistprimarily of investments in our affiliated mutual funds. Consolidated sponsored investment products primarilyrepresent investment products we sponsor and where we own a majority of the voting interest in the entity. As ofDecember 31, 2015, we consolidated a total of twelve sponsored investment products. Our consolidatedinvestment product represents the Company’s investment in a SPE created in 2015 specifically with the objectiveto issue a collateralized loan obligation. At both December 31, 2015 and 2014, we had no debt outstanding thatwas a general obligation of the Company.
Operating Cash Flow
Net cash used in operating activities of $209.4 million for 2015 increased by $150.5 million from net cashused in operating activities of $58.9 million in 2014. The increase in net cash used in operating activities wasprimarily due to (1) lower net income and (2) increases in net purchases of investments by the consolidatedinvestment product. The increases were partially offset by decreases in (1) purchases of investments byconsolidated sponsored investment products and (2) decreased excess tax benefits from stock-basedcompensation. Net cash from operating activities includes the operating activities of our consolidated sponsoredinvestment products and the consolidated investment product. These cash flows from the portion of the productswe do not own do not directly impact the cash flow related to our shareholders.
Net cash used in operating activities of $58.9 million for 2014 decreased by $87.7 million from net cashprovided by operating activities of $28.8 million in 2013 due primarily to increases in net purchases ofinvestments by consolidated sponsored investment products of $95.2 million. Excluding the net purchases ofinvestments by consolidated sponsored investment products, net cash provided by operating activities increased$7.5 million. This increase is primarily attributable to increases in cash pledged or on deposit of consolidatedsponsored investment products, increases in the recognition of excess tax benefits from stock-basedcompensation and decreased deferred income taxes and accrued compensation, accounts payable and accruedliabilities, partially offset by cash generated from increased operating profitability and increases in sales oftrading securities, net.
37

Investing Cash Flow
Net cash used in investing activities consists primarily of capital expenditures and other investing activitiesrelated to our business operations. Net cash used in investing activities of $6.4 million for 2015 decreased by$1.8 million from net cash used in investing activities of $8.2 million in 2014 due to the decrease of $3.4 millionin the amount paid for asset acquisitions of equity method and other investments partially offset by increasedcapital expenditures of $2.3 million in the current year as compared to the prior year.
Net cash used in investing activities of $8.2 million for 2014 increased by $2.0 million from net cash used ininvesting activities of $6.2 million in the prior year due to an increase in the amount paid for asset acquisitions ofequity method and other investments in 2014 as compared to 2013.
Financing Cash Flow
Cash flows from financing activities consist primarily of repurchases of our common stock, payments tosettle minimum tax withholding obligations for the net share settlement of employee share transactions,payments of cash dividends on our common stock and contributions to noncontrolling interests related to ourconsolidated sponsored investment products. Net cash provided by financing activities increased $111.1 millionto $109.9 million in 2015 compared to net cash used in financing activities of $1.2 million in the prior year. Theprimary reasons for the increase was due to increased borrowings of debt of the consolidated investment productof $152.6 million, increased third-party contributions of $27.0 million to the non-controlling interests related toour consolidated sponsored investment products and lower taxes paid related to net share settlement of RSU’s of$4.4 million. These increases were partially offset by higher repurchases of our common stock of $39.7 million,lower excess tax benefits from stock-based compensation of $23.2 million and increased dividend payments of$7.9 million.
For the year ended December 31, 2014, net cash used in financing activities decreased $186.7 million to$1.2 million in 2014 compared to net cash provided by financing activities of $185.5 million in the prior year.The primary reason for the decrease was due to proceeds of $191.8 million from the issuance of 1.3 millionshares of our common stock in 2013 with no such issuance in 2014. Also contributing to the change in 2014 wasincreased repurchases of our common stock of $20.6 million and dividends paid of $8.2 million, partially offsetby the repayment of the entire $15.0 million of debt outstanding in the prior year that did not recur in2014. During the 2014, we received $24.8 million in excess tax benefits from stock-based compensationcompared to $0.5 million received in the prior year.
Debt
Our Credit Facility, as amended and restated, has a five-year term expiring in September 2017 and providesborrowing capacity of up to $75.0 million with a $7.5 million sub-limit for the issuance of standby letters ofcredit. In addition, the Credit Facility provides for a $50.0 million increase in borrowing capacity conditioned onapproval by the lending group. The Credit Facility is secured by substantially all of our assets. At December 31,2015 and 2014, no amount was outstanding under the Credit Facility. As of December 31, 2015 and 2014, wehad the capacity to draw on the entire $75.0 million available under the Credit Facility.
Amounts outstanding under the Credit Facility bear interest at an annual rate equal to, at our option, eitherLIBOR for interest periods of 1, 2, 3 or 6 months or an alternate base rate (as defined in the Credit Facilityagreement), plus, in each case, an applicable margin that ranges from 0.75% to 2.50%. Under the terms of theCredit Facility, we are also required to pay certain fees, including an annual commitment fee that ranges from0.35% to 0.50% on undrawn amounts and a letter of credit participation fee at an annual rate equal to theapplicable margin as well as any applicable fronting fees, each of which is payable quarterly in arrears.
The Credit Facility contains customary covenants, including covenants that restrict (subject in certaininstances to minimum thresholds or exceptions) our and certain of our subsidiaries’ ability to incur additional
38

indebtedness, create liens, merge or make acquisitions, dispose of assets, enter into leases, sale/leasebacks oracquisitions of capital stock, and make loans, guarantees and investments, among other things. In addition, theCredit Facility contains certain financial covenants, the most restrictive of which include: (i) a minimum interestcoverage ratio (generally, adjusted EBITDA to interest expense as defined in and for the period specified in theCredit Facility agreement) of at least 4.00:1, and (ii) a leverage ratio (generally, total debt as of any date toadjusted EBITDA as defined in and for the period specified in the Credit Facility agreement) of no greater than2.75:1. For purposes of the Credit Facility, adjusted EBITDA generally means, for any period, our net incomebefore interest expense, income taxes, depreciation and amortization expense, and excluding non-cash stock-based compensation, unrealized mark-to-market gains and losses, certain severance, and certain non-cash non-recurring gains and losses as described in and specified under the Credit Facility. At December 31, 2015, wewere in compliance with all financial covenants under the Credit Facility.
The Credit Facility agreement also contains customary provisions regarding events of default, which couldresult in an acceleration of amounts due under the facility. Such events of default include our failure to payprincipal or interest when due, our failure to satisfy or comply with covenants, a change of control, theimposition of certain judgments, the invalidation of liens we have granted and a cross-default to other debtobligations.
On August 17, 2015, the SPE that we consolidate entered into a three-year term, $160.0 million financingtransaction with a bank lending counterparty (the “Financing Facility”). The proceeds of the Financing Facilityare intended to be used to purchase and warehouse commercial bank loan assets pending the securitization ofsuch assets as a CLO. The size of the Financing Facility may be increased subject to the occurrence of certainevents and the mutual consent of the parties. The Financing Facility is secured by all the assets of the SPE andinitially bears interest at a rate of three-month LIBOR plus 1.25% per annum (with such interest rate, uponcompletion of the initial nine-month ramp-up period, increasing to three-month LIBOR plus 2.0% perannum). The Financing Facility contains standard covenants and event of default provisions (including loan-to-value ratio triggers) and foreclosure remedies upon such default in favor of the lender thereunder. Our $40.0million contribution to the SPE serves as first loss protection for the bank lending counterparty under theFinancing Facility. In the event of default, the recourse to the Company is limited to its investment. AtDecember 31, 2015, $152.6 million was outstanding under the Financing Facility.
Contractual Obligations
The following table summarizes our contractual obligations as of December 31, 2015:
Payments Due
($ in millions) TotalLess Than
1 Year 1-3 Years 3-5 YearsMore Than
5 Years
Lease obligations . . . . . . . . . . . . . . . . . . . . . . . . . . . . . . . . . . . . $ 22.8 $ 4.8 $ 12.4 $ 4.3 $ 1.3Credit Facility, including commitment fee (1) . . . . . . . . . . . . . . 0.5 0.3 0.2 — —Financing Facility of consolidated investment product,
including interest (2) . . . . . . . . . . . . . . . . . . . . . . . . . . . . . . . 162.7 3.6 159.1 — —Minimum payments on service contracts (3) . . . . . . . . . . . . . . . 11.9 5.8 6.1 — —
Total . . . . . . . . . . . . . . . . . . . . . . . . . . . . . . . . . . . . . . . . . . . . . . $197.9 $14.5 $177.8 $ 4.3 $ 1.3
(1) At December 31, 2015, we had no amount outstanding under our Credit Facility which has a variableinterest rate. Amounts outstanding under the Credit Facility bear interest at an annual rate equal to, at ouroption, either LIBOR for interest periods of one, two, three or six months or an alternate base rate, plus, ineach case, an applicable margin, that ranges from 0.75% to 2.50%. We are also required to pay an annualcommitment fee that ranges from 0.35% to 0.50% on undrawn amounts. Payments due are estimated basedon the commitment fee rate of 0.35% in effect on December 31, 2015.
39
(2) At December 31, 2015, $152.6 was outstanding under the Financing Facility of the consolidated investmentproduct. The Financing Facility is secured by all the assets of the SPE and initially bears interest at a rate ofthree-month LIBOR plus 1.25% per annum (with such interest rate, upon completion of the initial nine-month ramp-up period, increasing to three-month LIBOR plus 2.0% per annum).
(3) Service contracts include contractual amounts that will be due to purchase goods and services to be used inour operations and may be canceled at earlier times than those indicated under certain conditions that mayinclude termination fees.
Impact of New Accounting Standards
For a discussion of accounting standards, see Note 2 to our consolidated financial statements.
Off-Balance Sheet Arrangements
We do not invest in any off-balance sheet vehicles that provide liquidity, capital resources, market or creditrisk support or engage in any leasing activities that expose us to any liability that is not reflected in ourconsolidated financial statements.
Critical Accounting Policies and Estimates
Our consolidated financial statements and the accompanying notes are prepared in accordance withGenerally Accepted Accounting Principles which requires the use of estimates. Actual results may vary fromthese estimates. Management believes the following critical accounting policies are important to understandingour results of operations and financial position.
Consolidation
The consolidated financial statements include our accounts, our subsidiaries and sponsored investmentproducts and the consolidated investment product in which we have a controlling financial interest. We aregenerally considered to have a controlling financial interest when we owns a majority of the voting interest in anentity or otherwise have the power to govern the financial and operating policies of the subsidiary. See Notes 17,18 and 19 to our consolidated financial statements for additional information related to the consolidation ofsponsored investment products and the consolidated investment product.
We also evaluate any variable interest entities (“VIEs”) in which we have a variable interest forconsolidation. A VIE is an entity in which either (a) the equity investment at risk is not sufficient to permit theentity to finance its own activities without additional financial support or (b) where as a group, the holders of theequity investment at risk do not possess: (i) the power to direct the activities that most significantly impact theentity’s performance; (ii) the obligation to absorb expected losses or the right to receive expected residual returnsof the entity; or (iii) proportionate voting and economic interests and where substantially all of the entity’sactivities either involve or are conducted on behalf of the equity holders. If any entity has any of thesecharacteristics, it is considered a VIE and required to be consolidated by its primary beneficiary. The primarybeneficiary is the entity that has both the power to direct the activities that most significantly impact the VIE’seconomic performance and has the obligation to absorb losses of, or the right to receive benefits from, the VIEthat could potentially be significant to the VIE.
Fair Value Measurements and Fair Value of Financial Instruments
The Financial Accounting Standards Board (“FASB”) defines fair value as the price that would be receivedto sell an asset, or paid to transfer a liability, in an orderly transaction between market participants at themeasurement date. Accounting Standards Codification (“ASC”) 820, Fair Value Measurements and Disclosures,establishes a framework for measuring fair value and a valuation hierarchy based upon the transparency of inputs
40

used in the valuation of an asset or liability. Classification within the hierarchy is based upon the lowest level ofinput that is significant to the fair value measurement. The valuation hierarchy contains three levels as follows:
Level 1 – Quoted prices for identical instruments in active markets. Level 1 assets and liabilities mayinclude debt securities and equity securities that are traded in an active exchange market.
Level 2 – Quoted prices for similar instruments in active markets; quoted prices for identical or similarinstruments in markets that are not active; and model-derived valuations in which all significant inputs andsignificant value drivers are observable in active markets. Level 2 inputs may include observable marketdata such as closing market prices provided by independent pricing services after considering factors suchas the yields or prices of comparable investments of comparable quality, coupon, maturity, call rights andother potential prepayments, terms and type, reported transactions, indications as to values from dealers andgeneral market conditions. In addition, pricing services may determine the fair value of equity securitiestraded principally in foreign markets when it has been determined that there has been a significant trend inthe U.S. equity markets or in index futures trading. Level 2 assets and liabilities may include debt and equitysecurities, purchased loans and over-the-counter derivative contracts whose fair value is determined using apricing model without significant unobservable market data inputs.
Level 3 – Valuations derived from valuation techniques in which one or more significant inputs orsignificant value drivers are unobservable in active exchange markets.
The following is a discussion of the valuation methodologies used for the Company’s assets measured at fairvalue.
Sponsored funds represent investments in open-end mutual funds, variable insurance funds and closed-endfunds for which we act as the investment manager. The fair value of open-end mutual funds and variableinsurance funds is determined based on their published net asset values and are categorized as Level 1. The fairvalue of closed-end funds is determined based on the official closing price of the exchange they are traded on andare categorized as Level 1.
Equity securities include securities traded on active markets and are valued at the official closing price(typically last sale or bid) on the exchange on which the securities are primarily traded and are categorized asLevel 1.
Nonqualified retirement plan assets represent mutual funds within a nonqualified retirement plan whose fairvalue is determined based on their published net asset value and are categorized as Level 1.
Investments of consolidated sponsored investment products represent the underlying debt and equitysecurities held in sponsored products which we consolidate. Equity securities are valued at the official closingprice on the exchange on which the securities are traded and are categorized within Level 1. Level 2 investmentsinclude certain equity securities for which closing prices are not readily available or are deemed to not reflectreadily available market prices and are valued using an independent pricing service as well as most debtsecurities which are valued based on quotations received from independent pricing services or from dealers whomake markets in such securities. Pricing services do not provide pricing for all securities, and therefore indicativebids from dealers are utilized, which are based on pricing models used by market makers in the security and arealso included within Level 2. Level 3 investments include debt securities that are not widely traded, are illiquidand are priced by dealers based on pricing models used by market makers in the security.
Investments of consolidated investment product represent the underlying debt securities, primary bank loans,held in the SPE that we consolidate. Debt securities are valued based on quotations received from an independentpricing service. Pricing services do not provide pricing for all securities, and therefore indicative bids fromdealers are utilized, which are based on pricing models used by market makers in the security and are alsoincluded within Level 2.
41

Cash and cash equivalents, accounts receivable, accounts payable and accrued liabilities equal orapproximate fair value based on the short-term nature of these instruments. Marketable securities are reflected inthe consolidated financial statements at fair value based upon publicly quoted market prices.
Goodwill and Other Intangible Assets
As of December 31, 2015, the carrying values of goodwill, indefinite-lived and definite-lived intangibleassets was $6.7 million, $34.8 million and $6.1 million, respectively. Goodwill represents the excess of thepurchase price of acquisitions over the fair value of identified net assets and liabilities acquired. Indefinite-livedintangible assets are comprised of acquired, closed-end and exchange traded fund investment advisory contracts.
For goodwill and indefinite-lived intangible assets, impairment tests are performed annually, or morefrequently, should circumstances change, which could reduce the fair value below its carrying value. We havedetermined that we have only one reporting unit for purposes of assessing the carrying value of goodwill.Goodwill impairment testing is performed whenever events or changes in circumstances indicated that thecarrying amount may not be recoverable. If we determine that the carrying value of the reporting unit is less thanthe fair value, the second step of the goodwill impairment test will be performed to measure the amount ofimpairment loss, if any. For definite-lived intangible assets, impairment testing is performed whenever events orchanges in circumstances indicate that the carrying amount may not be recoverable. If we determine the carryingvalue of the definite-lived intangible assets is less than the sum of the undiscounted cash flows expected to resultfrom the asset we will quantify the impairment using a discounted cash flow model.
Definite-lived intangible assets are comprised of acquired investment advisory contracts. We monitor theuseful lives of definite-lived intangible assets and revise the useful lives, if necessary, based on thecircumstances. Significant judgment is required in estimating the period that these assets will contribute to ourcash flows and the pattern over which these assets will be consumed. A change in the remaining useful life of anyof these assets could have a significant impact on our amortization expense. All amortization expense iscalculated on a straight-line basis.
We apply the rules issued in Accounting Standards Update (“ASU”) No. 2011-08, Testing Goodwill forImpairment (the revised standard), which amends the rules for testing goodwill for impairment by allowing anentity the option to first assess qualitative factors to determine whether the existence of events or circumstancesleads to a determination that it is more likely than not that the fair value of a reporting unit is less than itscarrying amount. If, after assessing the totality of events or circumstances, an entity determines it is more likelythan not that the fair value of a reporting unit is greater than its carrying amount, then performing the two-stepimpairment test is unnecessary.
We apply the rules issued in ASU No. 2012-02, Testing Indefinite-Lived Intangible Assets for Impairment,which provides entities with an option to perform a qualitative assessment of indefinite-lived intangible assetsother than goodwill for impairment to determine if additional impairment testing is necessary.
In assessing the qualitative factors to determine whether it is more likely than not that the fair value of areporting unit for goodwill and each unit of accounting for indefinite-lived intangible assets is less than itscarrying amount, we assess relevant events and circumstances that may impact the fair value and the carryingamount for each. The identification of relevant events and circumstances and how these may impact the fairvalue or carrying amount involve significant judgments and assumptions.
The judgment and assumptions include the identification of macroeconomic conditions, industry and marketconsiderations, cost factors, historical trends in operating margins, trending of each unit’s assets undermanagement levels, overall financial performance, specific events such as secondary offerings and share pricetrends and making the assessment on whether each relevant factor will impact the impairment test positively ornegatively and the magnitude of any such impact.
42
Based upon our fiscal 2015 qualitative impairment analysis for goodwill and indefinite-lived intangibleassets, prepared in accordance with ASU No. 2011-08 and ASU No. 2012-02, we concluded that there was norequirement to do a quantitative annual goodwill and indefinite-lived intangible asset impairment test. The keyqualitative factors that led to our conclusion were: (i) that our last quantitative goodwill impairment analysisindicated that the fair value of our reporting unit significantly exceeded the carrying amount; (ii) that our lastquantitative indefinite-lived intangible asset impairment analysis indicated that the fair value of our units ofaccounting significantly exceeded the carrying amount; (iii) the increase in our share price and marketcapitalization since our last quantitative annual goodwill impairment analysis; (iv) the increase in our assetsunder management and related cash flows since our last quantitative indefinite-lived intangible asset impairmentanalysis; (v) that we continue to show positive financial performance overall; and (vi) positive operating marginsof the underlying funds that represent the indefinite-lived intangible assets recorded. During the year endedDecember 31, 2015, no events or circumstances occurred that indicated the carrying value of definite-livedintangible assets might be impaired and therefore no quantitative impairment tests were performed during thisperiod.
No impairments have been identified or recorded by the Company for the year ended December 31, 2015.
Significant deterioration in markets or declines in revenues or in the value of the Company could result infuture impairment charges.
Revenue Recognition
Investment management fees, distribution and service fees and administration and transfer agent fees arerecorded as revenues during the period in which services are performed. Investment management fees are earnedbased upon a percentage of assets under management and are paid pursuant to the terms of the respectiveinvestment management contracts, which generally require monthly or quarterly payment. We account forinvestment management fees in accordance with ASC 605, Revenue Recognition, and have recorded ourmanagement fees net of fees paid to unaffiliated subadvisers. We consider the nature of our contractualarrangements in determining whether to recognize revenue based on the gross amount billed or net amountretained. We have evaluated the factors in ASC 605-45 in determining whether to record revenue on a gross ornet basis with significant weight placed on: (i) if we are the primary obligor in the arrangement; and (ii) if wehave latitude in establishing price. Amounts paid to unaffiliated subadvisers for the years ended December 31,2015, 2014 and 2013 were $76.4 million, $124.4 million and $96.1 million, respectively.
Investment management fees are calculated based on our assets under management. We rely on dataprovided to us by service providers to our mutual funds in the pricing of assets under management which are notreflected within our consolidated financial statements. Our mutual funds and the service providers to the fundswe manage have formal pricing policies and procedures over pricing of investments. As of December 31, 2015,our total assets under management by fair value hierarchy level as defined by ASC 820, Fair ValueMeasurements and Disclosures, was approximately 57.5% Level 1, 42.4% Level 2 and 0.1% Level 3.
Distribution and service fees are earned based on a percentage of assets under management and are paidmonthly pursuant to the terms of the respective distribution and service fee contracts.
Administration and transfer agent fees consist of fund administration fees, transfer agent fees and fiduciaryfees. Fund administration fees are earned based on the average daily assets in the funds. Transfer agent fees areearned based on the average daily assets in the funds. Fiduciary fees are recorded monthly based on the numberof 401(k) accounts. We utilize outside service providers to perform some of the functions related to fundadministration and shareholder services.
43

Other income and fees consist primarily of redemption income on the early redemption of certain shareclasses of mutual funds and brokerage commissions and fees earned for the distribution of nonaffiliated products.Commissions earned (and related expenses) are recorded on a trade date basis and are computed based uponcontractual agreements.
Accounting for Income Taxes
We account for income taxes in accordance with ASC 740, Income Taxes, which requires recognition of theamount of taxes payable or refundable for the current year, as well as deferred tax liabilities and assets for thefuture tax consequences of events that have been included in our financial statements or tax returns. Deferred taxliabilities and assets result from differences between the book value and tax basis of our assets, liabilities andcarry-forwards, such as net operating losses or tax credits. We recognize the tax benefit from an uncertain taxposition only if it is more likely than not that the tax position will be sustained, based on the technical merits ofthe position. The tax benefits recognized in the financial statements from such a position are measured based onthe largest benefit that has a greater than 50% likelihood of being realized upon ultimate settlement. Our policy isto record interest and penalties related to income taxes as a component of income tax expense.
Significant judgment is required in determining the provision for income taxes and, in particular, anyvaluation allowance that is recorded against our deferred tax assets. Our methodology for determining therealizability of deferred tax assets includes consideration of taxable income in prior carryback year(s) ifcarryback is permitted under the tax law, as well as consideration of the reversal of deferred tax liabilities that arein the same period and jurisdiction and are of the same character as the temporary differences that gave rise to thedeferred tax assets. Our methodology also includes estimates of future taxable income from our operations, aswell as the expiration dates and amounts of carryforwards related to net operating losses and capital losses. Theseestimates are projected through the life of the related deferred tax assets based on assumptions that we believe tobe reasonable and consistent with demonstrated operating results. Changes in future operating results notcurrently forecasted may have a significant impact on the realization of deferred tax assets. Valuation allowancesare provided when it is determined that it is more likely than not that the benefit of deferred tax assets will not berealized.
Loss Contingencies
The likelihood that a loss contingency exists is evaluated using the criteria of ASC 450, Loss Contingencies,and an accrued liability is recorded if the likelihood of a loss is considered both probable and reasonablyestimable at the date of the consolidated financial statements.
We believe that we have considered relevant circumstances that we may be currently subject to, and theconsolidated financial statements accurately reflect our reasonable estimate of the results of our operations,financial condition and cash flows for the years presented.
44

Item 7A. Quantitative and Qualitative Disclosures About Market Risk.
Market Risk
Substantially all of our revenues are derived from investment management, distribution and service, andadministration and transfer agent fees, which are based on the market value of assets under management.Accordingly, a decline in the financial markets and prices of securities would cause our revenues and income todecline due to a decrease in the value of the assets under management. In addition, a decline in security pricescould cause our clients to withdraw their investments in favor of other investments offering higher returns orlower risk, which would cause our revenues and income to decline.
We are also subject to market risk due to a decline in the market value of our investments, consistingprimarily of marketable securities. At December 31, 2015, the fair value of marketable securities was $295.7million. Assuming a 10.0% increase or decrease in the fair value of marketable securities at December 31, 2015,our net income attributable to common stockholders would change by $17.9 million, and our total comprehensiveincome would change by $18.0 million, in each case for the year ended December 31, 2015.
Interest Rate Risk
Interest rate risk is the risk that the fair value of future cash flows of a financial instrument will fluctuatebecause of changes in market interest rates. At December 31, 2015, we were exposed to interest rate risk as aresult of holding investments in fixed-income sponsored funds of $457.6 million. Assuming a 1.0% increase ordecrease in interest rates, the fair value of our fixed income investments would change by $4.4 million for theyear ended December 31, 2015.
At December 31, 2015, we had no amounts outstanding under our Credit Facility. Amounts outstandingunder the Credit Facility bear interest at an annual rate equal to, at our option, either LIBOR for interest periodsof one, two, three or six months or an alternate base rate (as defined in the Credit Facility agreement), plus, ineach case, an applicable margin, that ranges from 0.75% to 2.50%.
At December 31, 2015, the SPE that we consolidate had $152.6 million outstanding under a loan andsecurity agreement. Amounts outstanding under the loan and security agreement bear interest at an annual rateequal to LIBOR for interest periods of three months plus, in each case, an applicable margin, that ranges from1.25% to 2.00%.
Item 8. Financial Statements and Supplementary Data.
The audited Consolidated Financial Statements, including the Report of Independent Registered PublicAccounting Firm and the required supplementary quarterly information, required by this item are presented underItem 15 beginning on page F-1.
Item 9. Changes in and Disagreements With Accountants on Accounting and Financial Disclosure.
None.
Item 9A. Controls and Procedures.
Evaluation of Disclosure Controls and Procedures
We maintain disclosure controls and procedures designed to ensure that information required to be disclosedin reports filed or submitted under the Exchange Act, is recorded, processed, summarized and reported within thetime periods specified in the Commission’s rules and forms and that such information is accumulated andcommunicated to management, including our Chief Executive Officer and Chief Financial Officer, as
45

appropriate, to allow timely decisions regarding required disclosure. Any controls and procedures, no matter howwell designed and operated, can provide only reasonable assurance of achieving the desired control objectives.
Our management, with the participation of our Chief Executive Officer and our Chief Financial Officer,evaluated the effectiveness of our disclosure controls and procedures (as defined in Rules 13a-15(e) and15d-15(e) of the Exchange Act) as of the end of the period covered by this Annual Report on Form 10-K. Basedon their evaluation, our Chief Executive Officer and Chief Financial Officer concluded that the Company’sdisclosure controls and procedures were effective at the reasonable assurance level as of December 31, 2015, theend of the period covered by this Annual Report on Form 10-K.
Changes in Internal Control over Financial Reporting
There have been no changes in our internal control over financial reporting (as defined in Rule 13a-15(f) or15d-15(f) under the Exchange Act) that occurred during the period covered by this Annual Report that havematerially affected, or are reasonably likely to materially affect, our internal control over financial reporting.
Management’s Report on Internal Control over Financial Reporting
Our management, with the participation of our Chief Executive Officer and Chief Financial Officer, isresponsible for establishing and maintaining adequate internal control over financial reporting, as defined inRules 13a-15(f) and 15d-15(f) of the Exchange Act. Because of its inherent limitations, internal control overfinancial reporting may not prevent or detect misstatements. Projections of any evaluation of effectiveness tofuture periods are subject to the risk that controls may become inadequate because of changes in conditions, orthat the degree of compliance with the policy or procedures may deteriorate. Under the supervision and with theparticipation of our management, including our Chief Executive Officer and Chief Financial Officer, we haveconducted an evaluation of the effectiveness of our internal control over financial reporting as of December 31,2015 based upon the Internal Control-Integrated Framework (2013 framework) issued by the Committee ofSponsoring Organizations of the Treadway Commission. Based on this evaluation management, including ourChief Executive Officer and Chief Financial Officer, has concluded that our internal control over financialreporting was effective as of December 31, 2015.
The effectiveness of our internal control over financial reporting as of December 31, 2015 has been auditedby PricewaterhouseCoopers LLP, our independent registered public accounting firm, as stated in their report,which is included in Item 15 of this Annual Report on Form 10-K.
Item 9B. Other Information.
None.
46

PART III
Item 10. Directors, Executive Officers and Corporate Governance.
The information concerning the Company’s directors and nominees under the caption “Item 1—Election ofDirectors,” information concerning the Audit Committee and the “audit committee financial expert” under thecaption “Corporate Governance—Audit Committee,” information concerning the Company’s executive officersunder the caption “Executive Officers,” and the information under the caption “Section 16(a) BeneficialOwnership Reporting Compliance” in the Company’s Proxy Statement for the Company’s 2016 Annual Meetingof Shareholders, are incorporated herein by reference.
The Company has adopted a Code of Conduct that applies to the Company’s Chief Executive Officer, seniorfinancial officers and all other Company employees, officers and Board members. The Code of Conduct isavailable on the Company’s website, www.virtus.com, under “Investor Relations,” and is available in print to anyperson who requests it. Any substantive amendment to the Code of Conduct and any waiver in favor of a Boardmember or an executive officer may only be granted by the Board of Directors and will be publicly disclosed onthe Company’s website, www.virtus.com, under “About Us,” “Investor Relations.”
The information concerning procedures by which shareholders may recommend director nominees set forthunder the caption “Corporate Governance—Governance Committee—Director Nomination Process” in theCompany’s Proxy Statement for the Company’s 2016 Annual Meeting of Shareholders is incorporated hereinby reference.
Item 11. Executive Compensation.
The information relating to executive compensation and the Company’s policies and practices as they relateto the Company’s risk management is set forth under the captions “Executive Compensation,” “DirectorCompensation,” “Corporate Governance—Compensation Committee—Risks Related to Compensation Policiesand Practices” and “Corporate Governance—Compensation Committee Interlocks and Insider Participation” inthe Company’s Proxy Statement for the Company’s 2016 Annual Meeting of Shareholders and is incorporatedherein by reference. The information included under the caption “Executive Compensation—Report of theCompensation Committee” in the Company’s Proxy Statement for the Company’s 2016 Annual Meeting ofShareholders is incorporated herein by reference but shall be deemed “furnished” (and not “filed”) with thisreport.
Item 12. Security Ownership of Certain Beneficial Owners and Management and Related StockholderMatters.
The information set forth under the caption “Security Ownership by Certain Beneficial Owners andManagement” in the Company’s Proxy Statement for the Company’s 2016 Annual Meeting of Shareholders isincorporated herein by reference.
47

The following table sets forth information as of December 31, 2015 with respect to compensation plansunder which shares of our common stock may be issued:
EQUITY COMPENSATION PLAN INFORMATION
Plan Category
Number ofsecurities to be
issuedupon exercise of
outstandingoptions, warrants
and rights (a)
Weighted-averageexercise price of
outstandingoptions, warrantsand rights (b) (1)
Number ofsecurities remainingavailable for future
issuanceunder equity
compensation plans(excluding
securities reflectedin column (a)(c)
Equity compensation plans approved by securityholders (2) . . . . . . . . . . . . . . . . . . . . . . . . . . . . . . . . . . . 348,253 $18.78 322,986
Equity compensation plans not approved by securityholders . . . . . . . . . . . . . . . . . . . . . . . . . . . . . . . . . . . . . . — — —
Total . . . . . . . . . . . . . . . . . . . . . . . . . . . . . . . . . . . . . . . . . 348,253 $18.78 322,986
(1) The weighted-average exercise price set forth in this column is calculated excluding outstanding restrictedstock unit awards (“RSUs”) since recipients of such awards are not required to pay an exercise price toreceive the shares subject to these awards. The weighted-average exercise price of outstanding options,warrants and rights, including RSUs, was $8.45.
(2) Represents 156,636 shares of common stock issuable upon the exercise of stock options and 191,617 sharesof our common stock issuable upon the vesting of RSUs outstanding under the Company’s OmnibusIncentive and Equity Plan (the “Omnibus Plan”). Of the 1,800,000 maximum number of shares of ourcommon stock authorized for issuance under the Omnibus Plan, 80,639 shares of common stock have beenissued on a cumulative basis in the form of direct grants to directors.
Item 13. Certain Relationships and Related Transactions, and Director Independence.
The information set forth under the captions “Corporate Governance—Transactions with Related Persons”and “Corporate Governance—Director Independence” in the Company’s Proxy Statement for the Company’s2016 Annual Meeting of Shareholders is incorporated herein by reference.
Item 14. Principal Accounting Fees and Services.
The information regarding auditors fees and services and the Company’s pre-approval policies andprocedures for audit and non-audit services to be provided by the Company’s independent registered publicaccounting firm set forth under the caption “Item 3—Ratification of the Appointment of the IndependentRegistered Public Accounting Firm” in the Company’s Proxy Statement for the 2016 Annual Meeting ofShareholders is incorporated herein by reference.
48

PART IV
Item 15. Exhibits, Financial Statement Schedules.
(a)(1) Financial Statements: The following Report of Independent Registered Public Accounting Firm andConsolidated Financial Statements of Virtus are included in this Annual Report:
Report of Independent Registered Public Accounting Firm
Consolidated Balance Sheets as of December 31, 2015 and 2014
Consolidated Statements of Operations for the Years Ended December 31, 2015, 2014 and 2013
Consolidated Statements of Comprehensive Income for the Years Ended December 31, 2015, 2014and 2013
Consolidated Statements of Changes in Stockholders’ Equity for the Years Ended December 31,2015, 2014 and 2013
Consolidated Statements of Cash Flows for the Years Ended December 31, 2015, 2014 and 2013
Notes to Consolidated Financial Statements
(a)(2) Financial Statement Schedules:
All financial statement schedules have been omitted because the required information is eitherpresented in the consolidated financial statements or the notes thereto or is not applicable or required.
49

(a)(3) Exhibits:
The following exhibits are filed herewith or incorporated herein by reference:
ExhibitNumber Exhibit Description
(2) Plan of Acquisition, Reorganization, Arrangement, Liquidation or Succession
2.1 Separation Agreement, Plan of Reorganization and Distribution by and between The PhoenixCompanies, Inc. and the Registrant, dated as of December 18, 2008 (incorporated by reference toExhibit 2.1 of the Registrant’s Amendment No. 4 to Form 10, filed December 19, 2008).
(3) Articles of Incorporation and Bylaws
3.1 Amended and Restated Certificate of Incorporation of the Registrant, dated December 18, 2008(incorporated by reference to Exhibit 3.1 of the Registrant’s Amendment No. 4 to Form 10, filedDecember 19, 2008).
3.2 Amended and Restated Bylaws of the Registrant, as adopted on January 28, 2010 (incorporated byreference to Exhibit 3.1 of the Registrant’s Current Report on Form 8-K, filed February 2, 2010).
3.3 Certificate of Designations of Series A Non-Voting Convertible Preferred Stock and Series B VotingConvertible Preferred Stock of the Registrant, dated October 31, 2008 (incorporated by reference toExhibit 4.2 of the Registrant’s Amendment No. 2 to Form 10, filed November 14, 2008).
3.4 Certificate of Amendment of the Certificate of Designations of Series A Non-Voting ConvertiblePreferred Stock and Series B Voting Convertible Preferred Stock of the Registrant (incorporated byreference to Exhibit 3.1 of the Registrant’s Quarterly Report on Form 10-Q, filed August 13, 2009).
3.5 Certificate of Designations of Series C Junior Participating Preferred Stock of the Registrant, datedDecember 29, 2008 (incorporated by reference to Exhibit 3.1 of the Registrant’s Current Report onForm 8-K, filed January 2, 2009).
(4) Instruments Defining the Rights of Security Holders, Including Indentures
4.1 Note in favor of The Bank of New York Mellon as Lender, dated September 1, 2009 (incorporatedby reference to Exhibit 4.1 of the Registrant’s Current Report on Form 8-K, filed September 4,2009).
4.2 Note in favor of PNC Bank, National Association as Lender, dated September 1, 2009 (incorporatedby reference to Exhibit 4.2 of the Registrant’s Current Report on Form 8-K, filed September 4,2009).
(10) Material Contracts
10.1 Transition Services Agreement by and between The Phoenix Companies, Inc. and the Registrant,dated as of December 18, 2008 (incorporated by reference to Exhibit 10.1 of the Registrant’sAmendment No. 4 to Form 10, filed December 19, 2008).
10.2 Tax Separation Agreement by and between The Phoenix Companies, Inc. and the Registrant, datedDecember 18, 2008 (incorporated by reference to Exhibit 10.2 of the Registrant’s Amendment No. 4to Form 10, filed December 19, 2008).
10.3 Amendment to Tax Separation Agreement, dated April 8, 2009, by and between The PhoenixCompanies, Inc. and the Registrant, dated as of December 18, 2008 (incorporated by reference toExhibit 10.15 of the Registrant’s Annual Report on Form 10-K, filed April 10, 2009).
10.4 Employee Matters Agreement by and between The Phoenix Companies, Inc. and the Registrant,dated December 18, 2008 (incorporated by reference to Exhibit 10.3 of the Registrant’s AmendmentNo. 4 to Form 10, filed December 19, 2008).
50

ExhibitNumber Exhibit Description
*10.5 Change in Control Agreement between George R. Aylward and the Registrant, effective as ofDecember 31, 2008 (incorporated by reference to Exhibit 10.4 of the Registrant’s Amendment No. 4to Form 10, filed December 19, 2008).
*10.6 Amended and Restated Virtus Investment Partners, Inc. Omnibus Incentive and Equity Plan,effective as of January 1, 2014 (incorporated by reference to Exhibit 10.1 of the Registrant’sForm 8-K, filed May 16, 2014).
*10.7 Virtus Investment Partners, Inc. Non-Qualified Excess Investment Plan, effective as of November 1,2008 (incorporated by reference to Exhibit 10.6 of the Registrant’s Amendment No. 2 to Form 10,filed November 14, 2008).
*10.8 First Amendment to the Virtus Investment Partners, Inc. Non-Qualified Excess Investment Plan,effective as of February 1, 2010 (incorporated by reference to Exhibit 10.1 of the Registrant’sQuarterly Report on Form 10-Q, filed May 4, 2010).
*10.9 Virtus Investment Partners, Inc. Amended and Restated Executive Severance Allowance Plan,effective as of February 2, 2009 (incorporated by reference to Exhibit 10.1 of the Registrant’sCurrent Report on Form 8-K, filed February 4, 2009).
10.10 Investment and Contribution Agreement by and among Phoenix Investment Management Company,the Registrant, Harris Bankcorp, Inc. and The Phoenix Companies, Inc., dated as of October 30, 2008(incorporated by reference to Exhibit 10.8 of the Registrant’s Amendment No. 2 to Form 10, filedNovember 14, 2008).
10.11 Annex A to the Investment and Contribution Agreement by and among Phoenix InvestmentManagement Company, the Registrant, Harris Bankcorp, Inc. and The Phoenix Companies, Inc.,dated October 30, 2008 (incorporated by reference to Exhibit 10.10 of the Registrant’s AnnualReport on Form 10-K, filed March 1, 2011).
10.12 Transaction Agreement by and among Harris Investment Management, Inc., Phoenix InvestmentCounsel, Inc., Harris Financial Corp. and Phoenix Investment Partners, LTD., dated as of March 28,2006 (incorporated by reference Exhibit 6.01 of the Schedule 13D, filed January 12, 2009 by Bank ofMontreal, Harris Financial Corp. and Harris Bankcorp, Inc.).
10.13 Strategic Partnership Agreement by and between Harris Investment Management, Inc. and PhoenixInvestment Counsel, Inc., dated as of March 28, 2006 (incorporated by reference to Exhibit 6.02 ofthe Schedule 13D, filed January 12, 2009 by Bank of Montreal, Harris Financial Corp. and HarrisBankcorp, Inc.).
*10.14 Form of Non-Qualified Stock Option Agreement under the Virtus Investment Partners, Inc. OmnibusIncentive and Equity Plan (incorporated by reference to Exhibit 10.4 of the Registrant’s QuarterlyReport on Form 10-Q, filed May 13, 2009).
*10.15 Form of Restricted Stock Units Agreement under the Virtus Investment Partners, Inc. OmnibusIncentive and Equity Plan (incorporated by reference to Exhibit 10.5 of the Registrant’s QuarterlyReport on Form 10-Q, filed May 13, 2009).
*10.16 Form of Performance Share Units Agreement under the Virtus Investment Partners, Inc. OmnibusIncentive and Equity Plan (incorporated by reference to Exhibit 10.30 of the Registrant’s QuarterlyReport on Form 10-Q, filed August 5, 2011).
10.17 Amended and Restated Credit Agreement, dated as of September 10, 2012 among the Registrant, asBorrower, the lenders party thereto, PNC Bank, National Association, as Syndication Agent, and TheBank of New York Mellon, as Administrative Agent, as Swingline Lender and as Issuing Bank (the“Credit Agreement”) (incorporated by reference to Exhibit 10.1 of the Registrant’s Quarterly Reporton Form 10-Q, filed November 7, 2012).
51

ExhibitNumber Exhibit Description
10.18 Amendment No. 1, dated as of July 2, 2013, to the Credit Agreement, dated as of September 10,2012, among the Registrant, as Borrower, the lenders party thereto, PNC Bank, National Association,as Syndication Agent, and The Bank of New York Mellon, as Administrative Agent, as SwinglineLender and as Issuing Bank (incorporated by reference to Exhibit 10.1 of the Registrant’s QuarterlyReport on Form 10-Q, filed August 2, 2013).
10.19 Amendment No. 2, dated as of September 18, 2013, to the Credit Agreement, dated as ofSeptember 10, 2012, among the Registrant, as Borrower, the lenders party thereto, PNC Bank,National Association, as Syndication Agent, and The Bank of New York Mellon, as AdministrativeAgent, as Swingline Lender and as Issuing Bank (incorporated by reference to Exhibit 10.1 of theRegistrant’s Quarterly Report on Form 10-Q, filed November 4, 2013).
10.20 Guarantee Agreement among the Registrant, each of the subsidiary guarantors party thereto and TheBank of New York Mellon, as Administrative Agent, dated as of September 1, 2009 (incorporated byreference to Exhibit 10.24 of the Registrant’s Annual Report on Form 10-K, filed March 1, 2011).
10.21 Reaffirmation of Guarantee among the Registrant as Borrower, each of the subsidiary guarantorsparty thereto and the Bank of New York Mellon, as Administrative Agent, as Swingline Lender andas Issuing Bank under the Credit Agreement (incorporated by reference to Exhibit 10.2 of theRegistrant’s Quarterly Report on Form 10-Q, filed November 7, 2012).
10.22 Security Agreement among the Registrant, each of the other grantors party thereto and The Bank ofNew York Mellon, as Administrative Agent, dated as of September 1, 2009 (incorporated byreference to Exhibit 10.25 of the Registrant’s Annual Report on Form 10-K, filed March 1, 2011).
10.23 Amendment No. 1, dated as of September 10, 2012, to the Security Agreement, dated as ofSeptember 1, 2009, among the Registrant, as Borrower, each of the subsidiary guarantors partythereto, and the Bank of New York Mellon, as Administrative Agent under the Credit Agreement(incorporated by reference to Exhibit 10.3 of the Registrant’s Quarterly Report on Form 10-Q, filedNovember 7, 2012).
*10.24 Form of Indemnity Agreement (incorporated by reference to Exhibit 10.4 to the Registrant’sQuarterly Report on Form 10-Q, filed November 4, 2009).
*10.25 Offer Letter from the Registrant to Jeffrey T. Cerutti dated May 18, 2010 (incorporated by referenceto Exhibit 10.27 of the Registrant’s Annual Report on Form 10-K, filed March 1, 2011).
10.26 Conversion and Voting Agreement, dated as of October 27, 2011, between BMO, Inc. (f/k/a HarrisBankcorp, Inc.) and the Registrant (incorporated by reference to Exhibit 10.1 of the Registrant’sCurrent Report on Form 8-K, filed November 2, 2011).
*10.27 Offer Letter from the Registrant to Mark S. Flynn dated December 9, 2010 (incorporated byreference to Exhibit 10.31 of the Registrant’s Annual Report on Form 10-K, filed March 1, 2012).
10.28 Amendment No. 3 dated as of December 4, 2013 to the Credit Agreement, dated as of September 10,2012, among the Registrant, as Borrower, the lenders party thereto, PNC Bank, National Association,as Syndication Agent, and The Bank of New York Mellon, as Administrative Agent, as SwinglineLender and as Issuing Bank (incorporated by reference to Exhibit 10.29 of the Registrant’s AnnualReport on Form 10-K, filed February 24, 2014).
10.29 Amendment No. 2, dated as of December 4, 2013, to the Security Agreement, dated as ofSeptember 1, 2009, among the Registrant, as Borrower, each of the subsidiary guarantors partythereto, and the Bank of New York Mellon, as Administrative Agent under the Credit Agreement(incorporated by reference to Exhibit 10.30 of the Registrant’s Annual Report on Form 10-K, filedFebruary 24, 2014).
52

ExhibitNumber Exhibit Description
10.30 Amendment No. 4, dated as of August 12, 2015, to the Credit Agreement, dated as of September 10,2012, among the Registrant, as Borrower, the lenders party thereto, PNC Bank National Association,as syndication agent, and the Bank of New York Mellon, as Administrative Agent, the SwinglineLender, and as Issuing Bank (incorporated by reference to Exhibit 10.1 of the Registrant’s QuarterlyReport on Form 10-Q, filed October 30, 2015).
(21) Subsidiaries of the Registrant
21.1 Virtus Investment Partners, Inc., Subsidiaries List.
(23) Consents of Experts and Counsel
23.1 Consent of Independent Registered Public Accounting Firm.
31.1 Certifications of Registrant’s Chief Executive Officer pursuant to Section 302 of the Sarbanes-OxleyAct of 2002.
31.2 Certifications of Registrant’s Chief Financial Officer pursuant to Section 302 of the Sarbanes-OxleyAct of 2002.
32.1 Certifications of Registrant’s Chief Executive Officer and Chief Financial Officer pursuant toSection 906 of the Sarbanes-Oxley Act of 2002.
101 The following information formatted in XBRL (Extensible Business Reporting Language):(i) Consolidated Balance Sheets as of December 31, 2015 and December 31, 2014, (ii) ConsolidatedStatements of Operations for the years ended December 31, 2015, 2014 and 2013, (iii) ConsolidatedStatements of Comprehensive Income for the years ended December 31, 2015, 2014 and 2013,(iv) Consolidated Statements of Cash Flows for the years ended December 31, 2015, 2014 and 2013,(v) Consolidated Statements of Changes in Stockholders’ Equity for the years ended December 31,2015, 2014 and 2013 and (iv) Notes to Consolidated Financial Statements.
* Management contract, compensatory plan or arrangement.
The agreements and other documents filed as exhibits to this report are not intended to provide factualinformation or other disclosure other than the terms of the agreements or other documents themselves, and youshould not rely on them for that purpose. In particular, any representations and warranties made by the Companyin these agreements or other documents were made solely within the specific context of the relevant agreement ordocument and may not describe the actual state of affairs at the date they were made or at any other time.
53

SIGNATURES
Pursuant to the requirements of Section 13 or 15(d) of the Securities Exchange Act of 1934, the registranthas duly caused this report to be signed on its behalf by the undersigned, thereunto duly authorized.
Dated: February 24, 2016
Virtus Investment Partners, Inc.
By: /S/ MICHAEL A. ANGERTHAL
Michael A. AngerthalExecutive Vice PresidentChief Financial Officer
(Principal Financial Officer and Principal Accounting Officer)
Pursuant to the requirements of the Securities Exchange Act of 1934, this report has been signed below bythe following persons on behalf of the registrant and in the capacities indicated as of February 24, 2016.
/S/ MARK C. TREANOR
Mark C. TreanorDirector and Non-Executive Chairman
/S/ GEORGE R. AYLWARD
George R. AylwardPresident, Chief Executive Officer and Director
(Principal Executive Officer)
/S/ JAMES R. BAIO
James R. BaioDirector
/S/ DIANE M. COFFEY
Diane M. CoffeyDirector
/S/ SUSAN S. FLEMING
Susan S. FlemingDirector
/S/ TIMOTHY A. HOLT
Timothy A. HoltDirector
/S/ MELODY L. JONES
Melody L. JonesDirector
/S/ RUSSEL C. ROBERTSON
Russel C. RobertsonDirector
/S/ EDWARD M. SWAN, JR.Edward M. Swan, Jr.
Director
/S/ STEPHEN T. ZARRILLI
Stephen T. ZarrilliDirector
/S/ MICHAEL A. ANGERTHAL
Michael A. AngerthalChief Financial Officer
(Principal Financial Officer and Principal Accounting Officer)
54

INDEX TO CONSOLIDATED FINANCIAL STATEMENTS
Page
Report of Independent Registered Public Accounting Firm . . . . . . . . . . . . . . . . . . . . . . . . . . . . . . . . . . . . . . F-2
Audited Consolidated Financial StatementsConsolidated Balance Sheets as of December 31, 2015 and 2014 . . . . . . . . . . . . . . . . . . . . . . . . . . . . . . . . . . F-3Consolidated Statements of Operations for the Years Ended December 31, 2015, 2014, and 2013 . . . . . . . . F-4Consolidated Statements of Comprehensive Income for the Years Ended December 31, 2015, 2014 and
2013 . . . . . . . . . . . . . . . . . . . . . . . . . . . . . . . . . . . . . . . . . . . . . . . . . . . . . . . . . . . . . . . . . . . . . . . . . . . . . . . F-5Consolidated Statements of Changes in Stockholders’ Equity for the Years Ended December 31, 2015,
2014 and 2013 . . . . . . . . . . . . . . . . . . . . . . . . . . . . . . . . . . . . . . . . . . . . . . . . . . . . . . . . . . . . . . . . . . . . . . . . F-6
Consolidated Statements of Cash Flows for the Years Ended December 31, 2015, 2014 and 2013 . . . . . . . . F-7Notes to Consolidated Financial Statements . . . . . . . . . . . . . . . . . . . . . . . . . . . . . . . . . . . . . . . . . . . . . . . . . . F-8
F-1

Report of Independent Registered Public Accounting Firm
To the Board of Directors and Stockholders of Virtus Investment Partners, Inc.
In our opinion, the accompanying consolidated balance sheets and the related consolidated statements ofoperations, comprehensive income, changes in stockholders’ equity and cash flows present fairly, in all materialrespects, the financial position of Virtus Investment Partners, Inc. and its subsidiaries at December 31, 2015 and2014, and the results of their operations and their cash flows for each of the three years in the period endedDecember 31, 2015 in conformity with accounting principles generally accepted in the United States ofAmerica. Also in our opinion, the Company maintained, in all material respects, effective internal control overfinancial reporting as of December 31, 2015, based on criteria established in the Internal Control—IntegratedFramework (2013) issued by the Committee of Sponsoring Organizations of the Treadway Commission (COSO).The Company’s management is responsible for these financial statements, for maintaining effective internalcontrol over financial reporting and for its assessment of the effectiveness of internal control over financialreporting, included in Management’s Report on Internal Control over Financial Reporting appearing under Item9A. Our responsibility is to express opinions on these financial statements and on the Company’s internal controlover financial reporting based on our integrated audits. We conducted our audits in accordance with the standardsof the Public Company Accounting Oversight Board (United States). Those standards require that we plan andperform the audits to obtain reasonable assurance about whether the financial statements are free of materialmisstatement and whether effective internal control over financial reporting was maintained in all materialrespects. Our audits of the financial statements included examining, on a test basis, evidence supporting theamounts and disclosures in the financial statements, assessing the accounting principles used and significantestimates made by management, and evaluating the overall financial statement presentation. Our audit of internalcontrol over financial reporting included obtaining an understanding of internal control over financial reporting,assessing the risk that a material weakness exists, and testing and evaluating the design and operatingeffectiveness of internal control based on the assessed risk. Our audits also included performing such otherprocedures as we considered necessary in the circumstances. We believe that our audits provide a reasonablebasis for our opinions.
A company’s internal control over financial reporting is a process designed to provide reasonable assuranceregarding the reliability of financial reporting and the preparation of financial statements for external purposes inaccordance with generally accepted accounting principles. A company’s internal control over financial reportingincludes those policies and procedures that (i) pertain to the maintenance of records that, in reasonable detail,accurately and fairly reflect the transactions and dispositions of the assets of the company; (ii) provide reasonableassurance that transactions are recorded as necessary to permit preparation of financial statements in accordancewith generally accepted accounting principles, and that receipts and expenditures of the company are being madeonly in accordance with authorizations of management and directors of the company; and (iii) provide reasonableassurance regarding prevention or timely detection of unauthorized acquisition, use, or disposition of thecompany’s assets that could have a material effect on the financial statements.
Because of its inherent limitations, internal control over financial reporting may not prevent or detectmisstatements. Also, projections of any evaluation of effectiveness to future periods are subject to the risk thatcontrols may become inadequate because of changes in conditions, or that the degree of compliance with thepolicies or procedures may deteriorate.
/s/ PricewaterhouseCoopers LLP
Hartford, ConnecticutFebruary 24, 2016
F-2

Virtus Investment Partners, Inc.
Consolidated Balance Sheets
December 31,2015
December 31,2014
Assets:Cash and cash equivalents . . . . . . . . . . . . . . . . . . . . . . . . . . . . . . . . . . . . . . . . . . . . . . . $ 87,574 $ 202,847Investments . . . . . . . . . . . . . . . . . . . . . . . . . . . . . . . . . . . . . . . . . . . . . . . . . . . . . . . . . . 56,738 63,448Accounts receivable, net . . . . . . . . . . . . . . . . . . . . . . . . . . . . . . . . . . . . . . . . . . . . . . . . 38,757 49,721Assets of consolidated sponsored investment products
Cash of consolidated sponsored investment products . . . . . . . . . . . . . . . . . . . . . . 1,513 457Cash pledged or on deposit of consolidated sponsored investment products . . . . 10,353 8,230Investments of consolidated sponsored investment products . . . . . . . . . . . . . . . . 323,335 236,652Other assets of consolidated sponsored investment products . . . . . . . . . . . . . . . . 8,549 6,960
Assets of consolidated investment productCash equivalents of consolidated investment product . . . . . . . . . . . . . . . . . . . . . . 8,297 —Investments of consolidated investment product . . . . . . . . . . . . . . . . . . . . . . . . . . 199,485 —Other assets of consolidated investment product . . . . . . . . . . . . . . . . . . . . . . . . . . 1,467 —
Furniture, equipment, and leasehold improvements, net . . . . . . . . . . . . . . . . . . . . . . . . 9,116 7,193Intangible assets, net . . . . . . . . . . . . . . . . . . . . . . . . . . . . . . . . . . . . . . . . . . . . . . . . . . . 40,887 41,783Goodwill . . . . . . . . . . . . . . . . . . . . . . . . . . . . . . . . . . . . . . . . . . . . . . . . . . . . . . . . . . . . 6,701 5,260Deferred taxes, net . . . . . . . . . . . . . . . . . . . . . . . . . . . . . . . . . . . . . . . . . . . . . . . . . . . . . 54,143 60,162Other assets . . . . . . . . . . . . . . . . . . . . . . . . . . . . . . . . . . . . . . . . . . . . . . . . . . . . . . . . . . 12,814 16,060
Total assets . . . . . . . . . . . . . . . . . . . . . . . . . . . . . . . . . . . . . . . . . . . . . . . . . . . $ 859,729 $ 698,773
Liabilities and EquityLiabilities:Accrued compensation and benefits . . . . . . . . . . . . . . . . . . . . . . . . . . . . . . . . . . . . . . . $ 49,617 $ 54,815Accounts payable and accrued liabilities . . . . . . . . . . . . . . . . . . . . . . . . . . . . . . . . . . . . 23,036 31,627Dividends payable . . . . . . . . . . . . . . . . . . . . . . . . . . . . . . . . . . . . . . . . . . . . . . . . . . . . . 4,233 4,270Other liabilities . . . . . . . . . . . . . . . . . . . . . . . . . . . . . . . . . . . . . . . . . . . . . . . . . . . . . . . . 13,051 9,082Liabilities of consolidated sponsored investment products . . . . . . . . . . . . . . . . . . . . . . 15,387 12,556Liabilities of consolidated investment product
Debt of consolidated investment product . . . . . . . . . . . . . . . . . . . . . . . . . . . . . . . 152,597 —Securities purchased payable and other liabilities of consolidated investment
product . . . . . . . . . . . . . . . . . . . . . . . . . . . . . . . . . . . . . . . . . . . . . . . . . . . . . . . . 18,487 —
Total liabilities . . . . . . . . . . . . . . . . . . . . . . . . . . . . . . . . . . . . . . . . . . . . . . . . 276,408 112,350
Commitments and Contingencies (Note 10)Redeemable noncontrolling interests . . . . . . . . . . . . . . . . . . . . . . . . . . . . . . . . . . . . . . . 73,864 23,071Equity:Equity attributable to stockholders:Common stock, $0.01 par value, 1,000,000,000 shares authorized; 9,613,088 shares
issued and 8,398,944 shares outstanding at December 31, 2015 and 9,551,274shares issued and 8,975,833 shares outstanding at December 31, 2014 . . . . . . . . . . 96 96
Additional paid-in capital . . . . . . . . . . . . . . . . . . . . . . . . . . . . . . . . . . . . . . . . . . . . . . . 1,140,875 1,148,908Accumulated deficit . . . . . . . . . . . . . . . . . . . . . . . . . . . . . . . . . . . . . . . . . . . . . . . . . . . . (472,614) (507,521)Accumulated other comprehensive loss . . . . . . . . . . . . . . . . . . . . . . . . . . . . . . . . . . . . (1,034) (242)Treasury stock, at cost, 1,214,144 and 575,441 shares at December 31, 2015 and
December 31, 2014, respectively . . . . . . . . . . . . . . . . . . . . . . . . . . . . . . . . . . . . . . . . (157,699) (77,699)
Total equity attributable to stockholders . . . . . . . . . . . . . . . . . . . . . . . . . . . . 509,624 563,542Noncontrolling interests . . . . . . . . . . . . . . . . . . . . . . . . . . . . . . . . . . . . . . . . . . . . . . . . . (167) (190)
Total equity . . . . . . . . . . . . . . . . . . . . . . . . . . . . . . . . . . . . . . . . . . . . . . . . . . 509,457 563,352
Total liabilities and equity . . . . . . . . . . . . . . . . . . . . . . . . . . . . . . . . . . . $ 859,729 $ 698,773
The accompanying notes are an integral part of these consolidated financial statements.
F-3

Virtus Investment Partners, Inc.
Consolidated Statements of Operations
Years Ended December 31,
2015 2014 2013
($ in thousands, except per share data)RevenuesInvestment management fees . . . . . . . . . . . . . . . . . . . . . . . . . . . . . . . . . . . . . . . $264,865 $300,663 $260,557Distribution and service fees . . . . . . . . . . . . . . . . . . . . . . . . . . . . . . . . . . . . . . . 67,066 91,950 78,965Administration and transfer agent fees . . . . . . . . . . . . . . . . . . . . . . . . . . . . . . . 48,247 56,016 48,185Other income and fees . . . . . . . . . . . . . . . . . . . . . . . . . . . . . . . . . . . . . . . . . . . . 1,799 1,969 1,508
Total revenues . . . . . . . . . . . . . . . . . . . . . . . . . . . . . . . . . . . . . . . . . . . . . . 381,977 450,598 389,215
Operating ExpensesEmployment expenses . . . . . . . . . . . . . . . . . . . . . . . . . . . . . . . . . . . . . . . . . . . . 137,095 139,809 131,768Distribution and other asset-based expenses . . . . . . . . . . . . . . . . . . . . . . . . . . . 89,731 123,665 97,786Other operating expenses . . . . . . . . . . . . . . . . . . . . . . . . . . . . . . . . . . . . . . . . . . 63,901 46,531 38,321Other operating expenses of consolidated sponsored investment products . . . . 4,134 3,038 798Restructuring and severance . . . . . . . . . . . . . . . . . . . . . . . . . . . . . . . . . . . . . . . . — 294 203Depreciation and other amortization . . . . . . . . . . . . . . . . . . . . . . . . . . . . . . . . . 3,443 2,763 2,422Amortization expense . . . . . . . . . . . . . . . . . . . . . . . . . . . . . . . . . . . . . . . . . . . . . 3,295 3,778 4,413
Total operating expenses . . . . . . . . . . . . . . . . . . . . . . . . . . . . . . . . . . . . . . 301,599 319,878 275,711
Operating Income . . . . . . . . . . . . . . . . . . . . . . . . . . . . . . . . . . . . . . . . . . . . . . . 80,378 130,720 113,504
Other Income (Expense)Realized and unrealized (loss) gain on investments, net . . . . . . . . . . . . . . . . . . (862) 914 2,350Realized and unrealized (loss) gain on investments of consolidated sponsored
investment products, net . . . . . . . . . . . . . . . . . . . . . . . . . . . . . . . . . . . . . . . . . (23,181) (4,648) 3,515Realized and unrealized loss on investments of consolidated investment
product, net . . . . . . . . . . . . . . . . . . . . . . . . . . . . . . . . . . . . . . . . . . . . . . . . . . . (3,505) — —Other income, net . . . . . . . . . . . . . . . . . . . . . . . . . . . . . . . . . . . . . . . . . . . . . . . . 898 891 74
Total other (expense) income, net . . . . . . . . . . . . . . . . . . . . . . . . . . . (26,650) (2,843) 5,939
Interest Income (Expense)Interest expense . . . . . . . . . . . . . . . . . . . . . . . . . . . . . . . . . . . . . . . . . . . . . . . . . (523) (537) (782)Interest and dividend income . . . . . . . . . . . . . . . . . . . . . . . . . . . . . . . . . . . . . . . 1,261 1,706 664Interest and dividend income of investments of consolidated sponsored
investment products . . . . . . . . . . . . . . . . . . . . . . . . . . . . . . . . . . . . . . . . . . . . 11,504 7,268 2,583Interest income of investments of consolidated investment product, net . . . . . 1,673 — —
Total interest income, net . . . . . . . . . . . . . . . . . . . . . . . . . . . . . . . . . . 13,915 8,437 2,465
Income Before Income Taxes . . . . . . . . . . . . . . . . . . . . . . . . . . . . . . . . . . . . . 67,643 136,314 121,908Income tax expense . . . . . . . . . . . . . . . . . . . . . . . . . . . . . . . . . . . . . . . . . . . . . . 36,972 39,349 44,778
Net Income . . . . . . . . . . . . . . . . . . . . . . . . . . . . . . . . . . . . . . . . . . . . . . . . . . . . 30,671 96,965 77,130Noncontrolling interests . . . . . . . . . . . . . . . . . . . . . . . . . . . . . . . . . . . . . . . . . . . 4,435 735 (1,940)
Net Income Attributable to Common Stockholders . . . . . . . . . . . . . . . . . . . $ 35,106 $ 97,700 $ 75,190
Earnings per Share—Basic . . . . . . . . . . . . . . . . . . . . . . . . . . . . . . . . . . . . . . . $ 3.99 $ 10.75 $ 9.18
Earnings per Share—Diluted . . . . . . . . . . . . . . . . . . . . . . . . . . . . . . . . . . . . . $ 3.92 $ 10.51 $ 8.92
Cash Dividends Declared per Share . . . . . . . . . . . . . . . . . . . . . . . . . . . . . . . . $ 1.80 $ 1.35 $ —
Weighted Average Shares Outstanding—Basic (in thousands) . . . . . . . . . . 8,797 9,091 8,188
Weighted Average Shares Outstanding—Diluted (in thousands) . . . . . . . . 8,960 9,292 8,433
The accompanying notes are an integral part of these consolidated financial statements.
F-4

Virtus Investment Partners, Inc.
Consolidated Statements of Comprehensive Income
Years Ended December 31,
2015 2014 2013
($ in thousands)
Net Income . . . . . . . . . . . . . . . . . . . . . . . . . . . . . . . . . . . . . . . . . . . . . . . . . . . . . . . . $30,671 $96,965 $77,130Other comprehensive income (loss), net of tax:
Foreign currency translation adjustment, net of tax of $266, $132 and ($50)for the years ended December 31, 2015, 2014 and 2013, respectively . . . . (434) (216) 81
Unrealized (loss) gain on available-for-sale securities, net of tax of $71,($76), and $223 for the years ended December 31, 2015, 2014 and 2013,respectively . . . . . . . . . . . . . . . . . . . . . . . . . . . . . . . . . . . . . . . . . . . . . . . . . . (358) 124 56
Other comprehensive (loss) income . . . . . . . . . . . . . . . . . . . . . . . . . . . . . (792) (92) 137Comprehensive income . . . . . . . . . . . . . . . . . . . . . . . . . . . . . . . . . . . . . . . . . . . . . . 29,879 96,873 77,267Comprehensive income (loss) attributable to noncontrolling interests . . . . . . . . . . 4,435 735 (1,940)
Comprehensive income attributable to common stockholders . . . . . . . . . . . . . . . . $34,314 $97,608 $75,327
The accompanying notes are an integral part of these consolidated financial statements.
F-5

Vir
tus
Inve
stm
ent
Par
tner
s,In
c.
Con
solid
ated
Stat
emen
tsof
Cha
nges
inSt
ockh
olde
rs’
Equ
ity
Com
mon
Stoc
kA
ddit
iona
lP
aid-
inC
apit
alA
ccum
ulat
edD
efic
it
Acc
umul
ated
Oth
erC
ompr
ehen
sive
(Los
s)In
com
e
Tre
asur
ySt
ock
Tot
alA
ttri
bute
dT
oSh
areh
olde
rs
Non
-co
ntro
lling
Inte
rest
Tot
alE
quit
y
Red
eem
able
Non
-co
ntro
lling
Inte
rest
Shar
esP
arV
alue
Shar
esA
mou
nt
($in
thou
sand
s)B
alan
ces
atD
ecem
ber
31,2
012
....
....
....
....
....
..7,
826,
674
$81
$94
2,82
5$(
680,
411)
$(2
87)
245,
000
$(1
7,73
4)$2
44,4
74$
(3)
$244
,471
$3,
163
Net
inco
me
(los
s)..
....
....
....
....
....
....
....
——
—75
,190
——
—75
,190
(59)
75,1
311,
999
Net
unre
aliz
edga
inon
secu
ritie
sav
aila
ble-
for-
sale
....
——
——
56—
—56
—56
—Fo
reig
ncu
rren
cytr
ansl
atio
nad
just
men
t...
....
....
..—
——
—81
——
81—
81—
Act
ivity
ofno
ncon
trol
ling
inte
rest
s,ne
t..
....
....
...
——
——
——
——
——
37,0
24Is
suan
ceof
com
mon
stoc
k,ne
t..
....
....
....
....
..1,
298,
386
1319
1,56
5—
——
—19
1,57
8—
191,
578
—R
epur
chas
eof
com
mon
shar
es..
....
....
....
....
..(1
05,0
00)
——
——
105,
000
(19,
704)
(19,
704)
—(1
9,70
4)—
Issu
ance
ofco
mm
onst
ock
rela
ted
toem
ploy
eest
ock
tran
sact
ions
....
....
....
....
....
....
....
....
.85
,461
163
2—
——
—63
3—
633
—T
axes
paid
onst
ock-
base
dco
mpe
nsat
ion
....
....
....
——
(7,5
13)
——
——
(7,5
13)
—(7
,513
)—
Exc
ess
tax
bene
fits
from
stoc
k-ba
sed
com
pens
atio
n..
.—
—47
8—
——
—47
8—
478
—St
ock-
base
dco
mpe
nsat
ion
....
....
....
....
....
...
——
7,65
7—
——
—7,
657
—7,
657
—
Bal
ance
sat
Dec
embe
r31
,201
3..
....
....
....
....
....
9,10
5,52
195
1,13
5,64
4(6
05,2
21)
(150
)35
0,00
0(3
7,43
8)49
2,93
0(6
2)49
2,86
842
,186
Net
inco
me
(los
s)..
....
....
....
....
....
....
....
——
—97
,700
——
—97
,700
(128
)97
,572
(607
)N
etun
real
ized
gain
onse
curi
ties
avai
labl
e-fo
r-sa
le..
..—
——
—12
4—
—12
4—
124
—Fo
reig
ncu
rren
cytr
ansl
atio
nad
just
men
t...
....
....
..—
——
—(2
16)
——
(216
)—
(216
)—
Act
ivity
ofno
ncon
trol
ling
inte
rest
s,ne
t..
....
....
...
——
——
——
——
——
(18,
508)
Cas
hdi
vide
nds
decl
ared
($1.
35pe
rco
mm
onsh
are)
...
——
(12,
451)
——
——
(12,
451)
—(1
2,45
1)—
Rep
urch
ase
ofco
mm
onsh
ares
....
....
....
....
....
(225
,441
)—
——
—22
5,44
1(4
0,26
1)(4
0,26
1)—
(40,
261)
—Is
suan
ceof
com
mon
stoc
kre
late
dto
empl
oyee
stoc
ktr
ansa
ctio
ns..
....
....
....
....
....
....
....
...
95,7
531
1,41
6—
——
—1,
417
—1,
417
—T
axes
paid
onst
ock-
base
dco
mpe
nsat
ion
....
....
....
——
(9,5
12)
——
——
(9,5
12)
—(9
,512
)—
Stoc
k-ba
sed
com
pens
atio
n..
....
....
....
....
....
.—
—9,
006
——
——
9,00
6—
9,00
6—
Exc
ess
tax
bene
fits
from
stoc
k-ba
sed
com
pens
atio
n..
.—
—24
,805
——
——
24,8
05—
24,8
05—
Bal
ance
sat
Dec
embe
r31
,201
4..
....
....
....
....
....
8,97
5,83
396
1,14
8,90
8(5
07,5
21)
(242
)57
5,44
1(7
7,69
9)56
3,54
2(1
90)
563,
352
23,0
71
Net
inco
me
(los
s)..
....
....
....
....
....
....
....
——
—35
,106
——
—35
,106
(176
)34
,930
(4,2
59)
Net
unre
aliz
edlo
sson
secu
ritie
sav
aila
ble-
for-
sale
....
——
——
(358
)—
—(3
58)
—(3
58)
Fore
ign
curr
ency
tran
slat
ion
adju
stm
ent.
....
....
....
——
——
(434
)—
—(4
34)
—(4
34)
—A
ctiv
ityof
nonc
ontr
ollin
gin
tere
sts,
net
....
....
....
.—
——
(199
)—
——
(199
)19
9—
55,0
52C
ash
divi
dend
sde
clar
ed($
1.80
per
com
mon
shar
e)..
.—
—(1
6,00
9)—
——
—(1
6,00
9)—
(16,
009)
—R
epur
chas
eof
com
mon
shar
es..
....
....
....
....
..(6
38,7
03)
——
——
638,
703
(80,
000)
(80,
000)
—(8
0,00
0)—
Issu
ance
ofco
mm
onsh
ares
rela
ted
toem
ploy
eest
ock
tran
sact
ions
....
....
....
....
....
....
....
....
.61
,814
—84
2—
——
—84
2—
842
—T
axes
paid
onst
ock-
base
dco
mpe
nsat
ion
....
....
....
——
(5,0
80)
——
——
(5,0
80)
—(5
,080
)—
Stoc
k-ba
sed
com
pens
atio
n..
....
....
....
....
....
.—
—11
,116
——
——
11,1
16—
11,1
16—
Exc
ess
tax
bene
fits
from
stoc
k-ba
sed
com
pens
atio
n..
.—
—1,
098
——
——
1,09
8—
1,09
8—
Bal
ance
sat
Dec
embe
r31
,201
5..
....
....
....
....
....
8,39
8,94
4$
96$1
,140
,875
$(47
2,61
4)$(
1,03
4)1,
214,
144
$(15
7,69
9)$5
09,6
24$(
167)
$509
,457
$73
,864
The
acco
mpa
nyin
gno
tes
are
anin
tegr
alpa
rtof
thes
eco
nsol
idat
edfi
nanc
ials
tate
men
ts.
F-6

Virtus Investment Partners, Inc.
Consolidated Statements of Cash Flow
Years Ended December 31,
2015 2014 2013
($ in thousands)Cash Flows from Operating Activities:
Net income . . . . . . . . . . . . . . . . . . . . . . . . . . . . . . . . . . . . . . . . . . . . . . . . . . . . . . . . . . . . . . . . . . . . $ 30,671 $ 96,965 $ 77,130Adjustments to reconcile net income to net cash (used in) provided by operating activities:
Depreciation expense, intangible asset and other amortization . . . . . . . . . . . . . . . . . . . . . . . . 6,967 6,759 7,046Stock-based compensation . . . . . . . . . . . . . . . . . . . . . . . . . . . . . . . . . . . . . . . . . . . . . . . . . . . . 11,863 9,778 7,960Excess tax benefit from stock-based compensation . . . . . . . . . . . . . . . . . . . . . . . . . . . . . . . . . (1,586) (24,805) (478)Amortization of deferred commissions . . . . . . . . . . . . . . . . . . . . . . . . . . . . . . . . . . . . . . . . . . . 7,924 17,907 14,453Payments of deferred commissions . . . . . . . . . . . . . . . . . . . . . . . . . . . . . . . . . . . . . . . . . . . . . . (3,322) (13,796) (18,912)Equity in earnings of equity method investments . . . . . . . . . . . . . . . . . . . . . . . . . . . . . . . . . . . (879) (488) (161)Realized and unrealized losses (gains) on trading securities, net . . . . . . . . . . . . . . . . . . . . . . . 1,158 (914) (2,350)Realized and unrealized losses (gains) on investments of consolidated sponsored investment
products, net . . . . . . . . . . . . . . . . . . . . . . . . . . . . . . . . . . . . . . . . . . . . . . . . . . . . . . . . . . . . . 26,532 4,671 (3,515)Realized and unrealized losses on investments of consolidated investment product, net . . . . . 3,505 — —Sales (purchases) of trading securities, net . . . . . . . . . . . . . . . . . . . . . . . . . . . . . . . . . . . . . . . . 8,962 26,742 (2,701)Purchases of investments by consolidated sponsored investment products, net . . . . . . . . . . . . (113,190) (195,850) (100,526)(Purchases) sales of securities sold short by consolidated sponsored investment products,
net . . . . . . . . . . . . . . . . . . . . . . . . . . . . . . . . . . . . . . . . . . . . . . . . . . . . . . . . . . . . . . . . . . . . . (1,747) 8,071 —Purchases of investments by consolidated investment product, net . . . . . . . . . . . . . . . . . . . . . (186,028) — —Deferred taxes, net . . . . . . . . . . . . . . . . . . . . . . . . . . . . . . . . . . . . . . . . . . . . . . . . . . . . . . . . . . 6,356 4,394 32,596
Changes in operating assets and liabilities:Cash pledged or on deposit of consolidated sponsored investment products . . . . . . . . . . (2,604) (10,785) —Accounts receivable, net and other assets . . . . . . . . . . . . . . . . . . . . . . . . . . . . . . . . . . . . . 10,620 (4,157) (13,416)Other assets of consolidated sponsored investment products . . . . . . . . . . . . . . . . . . . . . . (2,002) (1,468) 508Other assets of consolidated investment product . . . . . . . . . . . . . . . . . . . . . . . . . . . . . . . (426) — —Accrued compensation and benefits, accounts payable, accrued liabilities and other
liabilities . . . . . . . . . . . . . . . . . . . . . . . . . . . . . . . . . . . . . . . . . . . . . . . . . . . . . . . . . . . . (14,795) 17,754 31,051Liabilities of consolidated sponsored investment products . . . . . . . . . . . . . . . . . . . . . . . 2,107 351 152Liabilities of consolidated investment product, net . . . . . . . . . . . . . . . . . . . . . . . . . . . . . 484 — —
Net cash (used in) provided by operating activities . . . . . . . . . . . . . . . . . . . . . . . . . (209,430) (58,871) 28,837
Cash Flows from Investing Activities:Capital expenditures . . . . . . . . . . . . . . . . . . . . . . . . . . . . . . . . . . . . . . . . . . . . . . . . . . . . . . . . . (4,683) (2,432) (2,009)Change in cash and cash equivalents of consolidated sponsored investment products due to
deconsolidation . . . . . . . . . . . . . . . . . . . . . . . . . . . . . . . . . . . . . . . . . . . . . . . . . . . . . . . . . . . — (436) (662)Asset acquisitions and purchases of other investments . . . . . . . . . . . . . . . . . . . . . . . . . . . . . . . (1,617) (5,000) (3,364)Cash acquired in business combination . . . . . . . . . . . . . . . . . . . . . . . . . . . . . . . . . . . . . . . . . . 89 — —Purchases of available-for-sale securities . . . . . . . . . . . . . . . . . . . . . . . . . . . . . . . . . . . . . . . . . (227) (313) (196)
Net cash used in investing activities . . . . . . . . . . . . . . . . . . . . . . . . . . . . . . . . . . . . . (6,438) (8,181) (6,231)
Cash Flows from Financing Activities:Contingent consideration paid for acquired investment management contracts . . . . . . . . . . . . — — (630)Borrowings of proceeds from short sales by consolidated sponsored investment products . . . 1,473 2,555 —Payments on borrowings by consolidated sponsored investment products . . . . . . . . . . . . . . . (350) — —Borrowings of debt of consolidated investment product . . . . . . . . . . . . . . . . . . . . . . . . . . . . . 152,597 — —Repurchase of common shares . . . . . . . . . . . . . . . . . . . . . . . . . . . . . . . . . . . . . . . . . . . . . . . . . (80,000) (40,261) (19,704)Dividends paid . . . . . . . . . . . . . . . . . . . . . . . . . . . . . . . . . . . . . . . . . . . . . . . . . . . . . . . . . . . . . (16,047) (8,182) —Proceeds from exercise of stock options . . . . . . . . . . . . . . . . . . . . . . . . . . . . . . . . . . . . . . . . . . 116 753 570Taxes paid related to net share settlement of restricted stock units . . . . . . . . . . . . . . . . . . . . . (5,080) (9,512) (7,513)Proceeds from issuance of common stock, net of issuance costs . . . . . . . . . . . . . . . . . . . . . . . — — 191,771Excess tax benefits from stock-based compensation . . . . . . . . . . . . . . . . . . . . . . . . . . . . . . . . 1,586 24,805 478Payment of debt and deferred financing costs . . . . . . . . . . . . . . . . . . . . . . . . . . . . . . . . . . . . . (47) — (15,026)Contributions of noncontrolling interests, net . . . . . . . . . . . . . . . . . . . . . . . . . . . . . . . . . . . . . . 55,700 28,653 35,547
Net cash provided by (used in) financing activities . . . . . . . . . . . . . . . . . . . . . . . . . 109,948 (1,189) 185,493
Net (decrease) increase in cash and cash equivalents . . . . . . . . . . . . . . . . . . . . . . . . . . . . . . . . . . . . . . . . (105,920) (68,241) 208,099Cash and cash equivalents, beginning of year . . . . . . . . . . . . . . . . . . . . . . . . . . . . . . . . . . . . . . . . . . . . . 203,304 271,545 63,446
Cash and Cash Equivalents, end of year . . . . . . . . . . . . . . . . . . . . . . . . . . . . . . . . . . . . . . . . . . . . . . . $ 97,384 $ 203,304 $ 271,545
Supplemental Disclosure of Cash Flow InformationInterest paid . . . . . . . . . . . . . . . . . . . . . . . . . . . . . . . . . . . . . . . . . . . . . . . . . . . . . . . . . . . . . . . . $ 266 $ 266 $ 393Income taxes paid, net . . . . . . . . . . . . . . . . . . . . . . . . . . . . . . . . . . . . . . . . . . . . . . . . . . . . . . . . $ 31,850 $ 23,274 $ 1,697
Supplemental Disclosure of Non-Cash ActivitiesActivity related to rabbi trust . . . . . . . . . . . . . . . . . . . . . . . . . . . . . . . . . . . . . . . . . . . . . . . . . . $ (247) $ (843) $ (1,250)Capital expenditures . . . . . . . . . . . . . . . . . . . . . . . . . . . . . . . . . . . . . . . . . . . . . . . . . . . . . . . . . $ (692) $ (311) $ 52Dividends payable . . . . . . . . . . . . . . . . . . . . . . . . . . . . . . . . . . . . . . . . . . . . . . . . . . . . . . . . . . . $ 4,233 $ 4,270 $ —(Decrease) increase to noncontrolling interest due to (deconsolidation) consolidation of
sponsored investment products, net . . . . . . . . . . . . . . . . . . . . . . . . . . . . . . . . . . . . . . . . . . . $ (648) $ (47,165) $ 1,477
The accompanying notes are an integral part of these consolidated financial statements.
F-7

Virtus Investment Partners, Inc.
Notes to Consolidated Financial Statements
1. Organization and Business
Virtus Investment Partners, Inc. (the “Company,” “we,” “us,” “our” or “Virtus”), a Delaware corporation,operates in the investment management industry through its subsidiaries.
The Company provides investment management and related services to individuals and institutionsthroughout the United States of America. The Company’s retail investment management services are provided toindividuals through products consisting of open-end mutual funds, closed-end funds, variable insurance funds,exchange traded funds (“ETFs”) and separately managed accounts. Institutional investment management servicesare provided primarily to corporations, multi-employer retirement funds, employee retirement systems,foundations, endowments and subadvisory accounts.
2. Summary of Significant Accounting Policies
The Company’s significant accounting policies, which have been consistently applied, are as follows:
Principles of Consolidation and Basis of Presentation
The Company’s consolidated financial statements have been prepared in conformity with accountingprinciples generally accepted in the United States of America (“GAAP”). The consolidated financial statementsinclude the accounts of the Company, its subsidiaries and sponsored investment products in which it has acontrolling financial interest, referred to as consolidated sponsored investment products or consolidatedinvestment product. The Company is considered to have a controlling financial interest when it owns a majorityof the voting interest in an entity or otherwise has the power to govern the financial and operating policies of thesubsidiary. See Notes 17, 18 and 19 for additional information related to the consolidation of sponsoredinvestment products and the consolidated investment product. Intercompany accounts and transactions have beeneliminated.
The Company also evaluates any variable interest entities (“VIEs”) in which the Company has a variableinterest for consolidation. A VIE is an entity in which either (a) the equity investment at risk is not sufficient topermit the entity to finance its own activities without additional financial support or (b) where as a group, theholders of the equity investment at risk do not possess: (i) the power through voting or similar rights to direct theactivities that most significantly impact the entity’s economic performance; (ii) the obligation to absorb expectedlosses or the right to receive expected residual returns of the entity; or (iii) proportionate voting and economicinterests and where substantially all of the entity’s activities either involve or are conducted on behalf of aninvestor with disproportionately fewer voting rights. If any entity has any of these characteristics, it is considereda VIE and is required to be consolidated by its primary beneficiary. The primary beneficiary is the entity that hasboth the power to direct the activities that most significantly impact the VIE’s economic performance and has theobligation to absorb losses of, or the right to receive benefits from, the VIE that could potentially be significantto the VIE.
The Company reclassified certain amounts in prior-period financial statements to conform to the currentperiod’s presentation.
Collateralized Debt Obligations
During 2015, the Company contributed $40.0 million to a special purpose entity (“SPE”) that was createdspecifically to accumulate bank loan assets for securitization as a potential collateralized loan obligation (“CLO”)that will be managed by its Newfleet affiliate. The special purpose entity is a VIE, and the Company consolidates
F-8

Virtus Investment Partners, Inc.
Notes to Consolidated Financial Statements—(Continued)
the SPE’s assets and liabilities as a consolidated investment product within its financial statements as it is theprimary beneficiary of the VIE. The Company determined that it is the primary beneficiary of the VIE as theCompany has the power to direct the activities that most significantly impact the economic performance of theentity and has the obligation to absorb losses, or the rights to receive benefits from, the VIE that could potentiallybe significant to the VIE. The Company’s $40.0 million contribution to the SPE serves as first loss protection forthe bank lending counterparty under the Financing Facility. In the event of default, the recourse to the Companyis limited to its investments.
Additionally, certain of the Company’s affiliates serve as the collateral manager for other collateralized loanand collateralized bond obligations (collectively, “CDOs”). These CDOs’ assets and liabilities reside inbankruptcy remote, special purpose entities in which the Company has no ownership in, nor holds any notesissued by, the CDOs and provides neither recourse nor guarantees. Accordingly, the Company’s financialexposure to these CDOs is limited only to the collateral investment management fees it earns, which totaled $0.9million, $1.6 million and $1.7 million for the years ended December 31, 2015, 2014 and 2013, respectively.
These CDOs are also considered VIEs, and as a result, the Company is required to consider the nature of itsinvolvement in these VIEs in determining if it should consolidate the entity. In assessing consolidation of theseCDOs, the Company assessed whether the collateral management fees represented a variable interest and theCompany was the primary beneficiary of the VIE. The primary beneficiary assessment includes an analysis of therights of the Company in its capacity as collateral manager and an analysis of whether the Company couldreceive significant benefits or absorb significant losses from these CDOs.
The Company determined that its investment management fees received as collateral manager for theseCDOs did not represent a variable interest due to the anticipated fees being fixed in nature, senior to interest andprincipal payments, and any subordinated fee elements were insignificant relative to the total fee and totalanticipated economic performance of these CDOs.
Noncontrolling Interest
Noncontrolling interests represent the profit or loss attributed to third-party investors in consolidatedsponsored investment products and other affiliates. Movements in amounts attributable to noncontrollinginterests in consolidated entities on the Company’s Consolidated Statements of Operations offset the operatingresults, gains and losses and interest expense of the third-party investors. Noncontrolling interests related tocertain consolidated sponsored investment products are classified as redeemable noncontrolling interests becauseinvestors in these funds may request withdrawals at any time.
Use of Estimates
The preparation of the consolidated financial statements requires management to make certain estimates andassumptions that affect the reported amounts of assets and liabilities and the disclosures of contingent assets andliabilities at the dates of the consolidated financial statements and the reported amounts of revenues and expensesduring the reporting periods. Management believes the estimates used in preparing the consolidated financialstatements are reasonable and prudent. Actual results could differ from those estimates.
Segment Information
Accounting Standards Codification (“ASC”) 280, Segment Reporting, establishes disclosure requirementsrelating to operating segments in annual and interim financial statements. Business or operating segments are
F-9

Virtus Investment Partners, Inc.
Notes to Consolidated Financial Statements—(Continued)
defined as components of an enterprise about which separate financial information is available that is regularlyevaluated by the chief operating decision maker in deciding how to allocate resources and assess performance.The Company operates in one business segment, namely as an asset manager providing investment managementand distribution services for individual and institutional clients. The Company’s Chief Executive Officer is theCompany’s chief operating decision maker. Although the Company provides disclosures regarding assets undermanagement and other asset flows by product, the Company’s determination that it operates in one businesssegment is based on the fact that the same investment and operational resources support multiple products, suchproducts have the same or similar regulatory framework and the Company’s chief operating decision makerreviews the Company’s financial performance at a consolidated level. Investment organizations within theCompany are generally not aligned with specific product lines. Furthermore, investment professionals manageboth retail and institutional products.
Cash and Cash Equivalents
Cash and cash equivalents consist of cash in banks and money market fund investments.
Investments
Marketable Securities
Marketable securities include sponsored mutual funds, sponsored variable insurance funds and other equitysecurities classified as trading securities and sponsored closed-end funds classified as available-for-sale securitieswhich are carried at fair value in accordance with ASC 320, Investments—Debt and Equity Securities (“ASC 320”).Marketable securities are marked to market based on the respective publicly quoted net asset values of the funds ormarket prices of the equity securities or bonds. Marketable securities transactions are recorded on a trade date basis.Any unrealized appreciation or depreciation on available-for-sale securities, net of income taxes, is reported as acomponent of accumulated other comprehensive income in equity attributable to stockholders.
On a quarterly basis, the Company conducts a review to assess whether other-than-temporary impairmentsexist on its available-for-sale marketable securities. Other-than-temporary declines in value may exist if the fairvalue of a marketable security has been below the carrying value for an extended period of time. If an other-than-temporary decline in value is determined to exist, the unrealized investment loss, net of tax, is recognized in theConsolidated Statements of Operations in the period in which the other-than-temporary decline in value occurs,as well as an accompanying permanent adjustment to accumulated other comprehensive income.
Equity Method Investments
The Company’s investment in noncontrolled entities, where the Company does not hold a controllingfinancial interest but has the ability to significantly influence operating and financial matters, is accounted forunder the equity method of accounting in accordance with ASC 323, Investments-Equity Method and JointVentures. Under the equity method of accounting, the Company’s share of the noncontrolled entities net incomeor loss is recorded in other income (expense), net in the accompanying Consolidated Statements of Operations.Distributions received reduce the Company’s investment balance. The investment is evaluated for impairment asevents or changes indicate that the carrying amount exceeds its fair value. If the carrying amount of aninvestment does exceed its fair value and the decline in fair value is deemed to be other-than-temporary, animpairment charge will be recorded.
F-10

Virtus Investment Partners, Inc.
Notes to Consolidated Financial Statements—(Continued)
Non-qualified Retirement Plan Assets and Liabilities
The Company has a non-qualified retirement plan (the “Excess Incentive Plan”) that allows certainemployees to voluntarily defer compensation. Under the Excess Incentive Plan, participants elect to defer aportion of their compensation, which the Company then contributes into a trust. Each participant is responsiblefor designating investment options for assets they contribute, and the ultimate distribution paid to eachparticipant reflects any gains or losses on the assets realized while in the trust. The Company holds the ExcessIncentive Plan assets in a rabbi trust, which is subject to the claims of the Company’s creditors in the event of theCompany’s bankruptcy or insolvency. Assets held in trust, which are considered trading securities, are includedin investments and are carried at fair value in accordance with ASC 820 Fair Value Measurement; the associatedobligations to participants are included in other liabilities in the Company’s Consolidated Balance Sheets andapproximate the fair value of the associated assets. Assets held in trust consist of mutual funds and are recordedat fair value, utilizing Level 1 valuation techniques.
Deferred Commissions
Deferred commissions, which are included in other assets in the Company’s Consolidated Balance Sheets,are commissions paid to broker-dealers on sales of mutual fund shares. Deferred commissions are recovered bythe receipt of monthly asset-based distributor fees from the mutual funds or contingent deferred sales chargesreceived upon redemption of shares within one to five years, depending on the fund share class. The deferredcosts resulting from the sale of shares are amortized on a straight-line basis over a one to five-year period,depending on the fund share class, or until the underlying shares are redeemed. Deferred commissions areperiodically assessed for impairment and additional amortization expense is recorded, as appropriate.
Furniture, Equipment and Leasehold Improvements, Net
Furniture, equipment and leasehold improvements are recorded at cost. Depreciation is computed using thestraight-line method over the estimated useful lives of three to seven years for furniture and office equipment,and three to five years for computer equipment and software. Leasehold improvements are depreciated over theshorter of the remaining estimated lives of the related leases or useful lives of the improvements. Major renewalsor betterments are capitalized, and recurring repairs and maintenance are expensed as incurred. Leaseholdimprovements that are funded upfront by a landlord and are constructed for the benefit of the Company arerecorded at cost and depreciated on a straight-line basis over the original minimum term of the lease and acorresponding lease incentive liability in the same amount is also recorded and initially amortized over the sameperiod.
Leases
The Company currently leases office space and equipment under various leasing arrangements. Leases areclassified as either capital leases or operating leases, as appropriate. Most lease agreements are classified asoperating leases and contain renewal options, rent escalation clauses or other inducements provided by the lessor.Rent expense under non-cancelable operating leases with scheduled rent increases or rent holidays is accountedfor on a straight-line basis over the lease term, beginning on the date of initial possession or the effective date ofthe lease agreement. The amount of the excess of straight-line rent expense over scheduled payments is recordedas a deferred liability. Build-out allowances and other such lease incentives are recorded as deferred credits, andare amortized on a straight-line basis as a reduction of rent expense beginning in the period they are deemed to beearned, which generally coincides with the effective date of the lease.
F-11

Virtus Investment Partners, Inc.
Notes to Consolidated Financial Statements—(Continued)
Intangible Assets and Goodwill
Definite-lived intangible assets are comprised of acquired investment advisory contracts. These assets areamortized on a straight-line basis over the estimated useful lives of such assets, which range from one to sixteenyears. Definite-lived intangible assets are evaluated for impairment on an ongoing basis under GAAP wheneverevents or circumstances indicate that the carrying value of the definite-lived intangible asset may not be fullyrecoverable. The Company determines if impairment has occurred by comparing estimates of futureundiscounted cash flows to the carrying value of assets. Assets are considered impaired, and impairment isrecorded, if the carrying value exceeds the expected future undiscounted cash flows.
Goodwill represents the excess of the purchase price of acquisitions and mergers over the identified netassets and liabilities acquired. In accordance with ASC 350, Goodwill and Other Intangible Assets, goodwill isnot being amortized. A single reporting unit has been identified for the purpose of assessing potential futureimpairments of goodwill. An impairment analysis of goodwill is performed annually or more frequently, ifwarranted by events or changes in circumstances affecting the Company’s business. The Company follows theFinancial Accounting Standards Board (“FASB”) Accounting Standards Update (“ASU”) 2011-08, TestingGoodwill for Impairment, which states that an entity has the option to first assess qualitative factors to determinewhether the existence of events or circumstances leads to a determination that it is more likely than not that thefair value of a reporting unit is less than its carrying amount. If, after assessing the totality of events orcircumstances, an entity determines it is not more likely than not that the fair value of a reporting unit is less thanits carrying amount, then performing the two-step impairment test is unnecessary. The Company’s 2015 and2014 annual goodwill impairment analysis did not result in any impairment charges.
Indefinite-lived intangible assets are comprised of closed-end and exchange traded fund investment advisorycontracts. These assets are tested for impairment annually and when events or changes in circumstances indicatethe assets might be impaired. The Company follows ASU No. 2012-02, Testing Indefinite-Lived IntangibleAssets for Impairment, which provides entities with an option to perform a qualitative assessment of indefinite-lived intangible assets other than goodwill for impairment to determine if additional impairment testing isnecessary. The Company’s 2015 and 2014 annual indefinite-lived intangible assets impairment analyses did notresult in any impairment charges.
Treasury Stock
Treasury stock is accounted for under the cost method and is included as a deduction from equity in theStockholders’ Equity section of the Consolidated Balance Sheets. Upon any subsequent resale, the treasury stockaccount is reduced by the cost of such stock.
Revenue Recognition
Investment management fees, distribution and service fees and administration and transfer agent fees arerecorded as revenues during the period in which services are performed. Investment management fees are earnedbased upon a percentage of assets under management and are paid pursuant to the terms of the respectiveinvestment management contracts, which generally require monthly or quarterly payment.
The Company accounts for investment management fees in accordance with ASC 605, RevenueRecognition, and has recorded its management fees net of fees paid to unaffiliated subadvisers. The Companyconsiders the nature of its contractual arrangements in determining whether to recognize revenue based on thegross amount billed or net amount retained. The Company has evaluated the factors in ASC 605-45 indetermining whether to record revenue on a gross or net basis with significant weight placed on: (i) whether the
F-12

Virtus Investment Partners, Inc.
Notes to Consolidated Financial Statements—(Continued)
Company is the primary obligor in the arrangement; and (ii) whether the Company has latitude in establishingprice. Amounts paid to unaffiliated subadvisers for the years ended December 31, 2015, 2014 and 2013 were$76.4 million, $124.4 million and $96.1 million, respectively.
Distribution and service fees are earned based on a percentage of assets under management and are paidmonthly pursuant to the terms of the respective distribution and service fee contracts. Underwriter fees are sales-based charges on sales of certain class A-share mutual funds.
Administration and transfer agent fees consist of fund administration fees, transfer agent fees and fiduciaryfees. Fund administration and transfer agent fees are earned based on the average daily assets in the funds.
Other income and fees consist primarily of redemption income on the early redemption of certain shareclasses of mutual funds.
Advertising and Promotion
Advertising and promotional costs include print advertising and promotional items and are expensed asincurred. These costs are classified in other operating expenses in the Consolidated Statements of Operations.
Stock-based Compensation
The Company accounts for stock-based compensation expense in accordance with ASC 718,Compensation—Stock Compensation (“ASC 718”), which requires the measurement and recognition ofcompensation expense for share-based awards based on the estimated fair value on the date of grant.
Restricted stock units (“RSUs”) are stock awards that entitle the holder to receive shares of the Company’scommon stock as the award vests over time or when certain performance targets are achieved. The fair value ofeach RSU award is estimated using the intrinsic value method, which is based on the fair market value price onthe date of grant unless it contains a performance metric that is considered a market condition. RSUs that containa market condition are valued using a simulation valuation model. Compensation expense for RSU awards isrecognized ratably over the vesting period on a straight-line basis.
Income Taxes
The Company accounts for income taxes in accordance with ASC 740, Income Taxes, which requiresrecognition of the amount of taxes payable or refundable for the current year, as well as deferred tax liabilitiesand assets for the future tax consequences of events that have been included in the Company’s financialstatements or tax returns. Deferred tax liabilities and assets result from temporary differences between the bookvalue and tax basis of the Company’s assets, liabilities and carry-forwards, such as net operating losses or taxcredits.
The Company’s methodology for determining the realizability of deferred tax assets includes considerationof taxable income in prior carryback year(s) if carryback is permitted under the tax law, as well as considerationof the reversal of deferred tax liabilities that are in the same period and jurisdiction and are of the same characteras the temporary differences that gave rise to the deferred tax assets. The Company’s methodology also includesestimates of future taxable income from its operations, as well as the expiration dates and amounts of carry-forwards related to net operating losses and capital losses. These estimates are projected through the life of therelated deferred tax assets based on assumptions that the Company believes to be reasonable and consistent with
F-13

Virtus Investment Partners, Inc.
Notes to Consolidated Financial Statements—(Continued)
demonstrated operating results. Changes in future operating results not currently forecasted may have asignificant impact on the realization of deferred tax assets. Valuation allowances are provided when it isdetermined that it is more likely than not that the benefit of deferred tax assets will not be realized.
Comprehensive Income
The Company reports all changes in comprehensive income in the Consolidated Statements of Changes inStockholders’ Equity and the Consolidated Statements of Comprehensive Income. Comprehensive incomeincludes net income (loss), foreign currency translation adjustments (net of tax) and unrealized gains and losseson investments classified as available-for-sale (net of tax).
Earnings per Share
Earnings per share (“EPS”) is calculated in accordance with ASC 260, Earnings per Share. Basic EPSexcludes dilution for potential common stock issuances and is computed by dividing basic net income availableto common stockholders by the weighted-average number of common shares outstanding for the period. DilutedEPS reflects the potential dilution that could occur if securities or other contracts to issue common stock wereexercised or converted into common stock. For the calculation of diluted EPS, the basic weighted averagenumber of shares is increased by the dilutive effect of RSUs and stock options using the treasury stock method.
Fair Value Measurements and Fair Value of Financial Instruments
The FASB defines fair value as the price that would be received to sell an asset, or paid to transfer aliability, in an orderly transaction between market participants at the measurement date. ASC 820 establishes aframework for measuring fair value and a valuation hierarchy based upon the transparency of inputs used in thevaluation of an asset or liability. Classification within the hierarchy is based upon the lowest level of input that issignificant to the fair value measurement. The valuation hierarchy contains three levels as follows:
Level 1—Unadjusted quoted prices for identical instruments in active markets. Level 1 assets and liabilitiesmay include debt securities and equity securities that are traded in an active exchange market.
Level 2—Quoted prices for similar instruments in active markets; quoted prices for identical or similarinstruments in markets that are not active; and model-derived valuations in which all significant inputs andsignificant value drivers are observable in active markets. Level 2 inputs may include observable marketdata such as closing market prices provided by independent pricing services after considering factors suchas the yields or prices of comparable investments of comparable quality, coupon, maturity, call rights andother potential prepayments, terms and type, reported transactions, indications as to values from dealers andgeneral market conditions. In addition, pricing services may determine the fair value of equity securitiestraded principally in foreign markets when it has been determined that there has been a significant trend inthe U.S. equity markets or in index futures trading. Level 2 assets and liabilities may include debt and equitysecurities, purchased loans and over-the-counter derivative contracts whose fair value is determined using apricing model without significant unobservable market data inputs.
Level 3—Valuations derived from valuation techniques in which one or more significant inputs orsignificant value drivers are unobservable in active exchange markets.
Recent Accounting Pronouncements
In January 2016, the FASB issued ASU 2016-01, Recognition and Measurement of Financial Assets andFinancial Liabilities (“ASU 2016-1”), which requires all equity investments (other than those accounted for
F-14

Virtus Investment Partners, Inc.
Notes to Consolidated Financial Statements—(Continued)
under the equity method) to be measured at fair value with changes in the fair value recognized through netincome. ASU 2016-01 is effective for fiscal years beginning after December 15, 2017 and interim periodstherein. Early adoption is not permitted. The Company is currently evaluating the potential impact of thisstandard on its consolidated financial statements.
In September 2015, the FASB issued ASU 2015-16, “Business Combinations (Topic 805): Simplifying theAccounting for Measurement-Period Adjustments” (“ASU 2015-16) which requires that an acquirer recognizeadjustments to provisional amounts that are identified during the measurement period in the reporting period inwhich the adjustment amounts are determined. ASU 2015-16 requires that the acquirer record, in the financialstatements of the period in which adjustments to provisional amounts are determined, the effect on earnings ofchanges in depreciation, amortization, or other income effects, if any, as a result of the change to the provisionalamounts, calculated as if the accounting had been completed at the acquisition date. ASU 2015-16 is effectiveprospectively for fiscal years beginning after December 15, 2015, including interim periods within those fiscalyears, with early adoption permitted. The Company believes the adoption of this standard will not have amaterial impact on the Company’s consolidated financial statements.
In April 2015, the FASB issued ASU 2015-03, Simplifying the Presentation of Debt Issuance Costs(“ASU 2015-3”), which changes the presentation of debt issuance costs in the balance sheet. The new guidancerequires that debt issuance costs be presented as a deduction from the carrying amount of the related debt ratherthan being presented as an asset. Amortization of debt issuance costs will continue to be reported as interestexpense. In August 2015, the FASB issued ASU 2015-15 to amend ASU 2015-03 to address line-of-creditagreements. ASU 2015-15 allows entities to present debt issuance costs related to line-of-credit agreements as anasset and amortize deferred debt issuance costs ratably over the term of the line-of-credit arrangement, regardlessof whether there are any outstanding borrowings. The new guidance is effective for fiscal years and interimperiods within those years beginning after December 15, 2015 and requires retrospective application for eachprior period presented. Early adoption is permitted for financial statements that have not been previously issued.The Company believes the adoption of this standard will not have a material impact on the Company’sconsolidated financial statements.
In February 2015, the FASB issued ASU No. 2015-02, Consolidation (Topic 810): Amendments to theConsolidation Analysis (“ASU 2015-02”). This standard modifies existing consolidation guidance for reportingorganizations that are required to evaluate whether they should consolidate certain legal entities. ASU 2015-02 iseffective for fiscal years and interim periods within those years beginning after December 15, 2015 and requireseither a retrospective or a modified retrospective approach to adoption. Early adoption is permitted. TheCompany believes the adoption of this standard will not have a material impact on the Company’s consolidatedfinancial statements.
In August 2014, the FASB issued ASU No. 2014-13, Measuring the Financial Assets and FinancialLiabilities of a Consolidated Collateralized Financing Entity (“CFE”) (“ASU 2014-13”). This new guidancerequires reporting entities to use the more observable of the fair value of the financial assets or the financialliabilities to measure the financial assets and the financial liabilities of a CFE when a CFE is initiallyconsolidated. It permits entities to make an accounting policy election to apply this same measurement approachafter initial consolidation or to apply other GAAP to account for the consolidated CFE’s financial assets andfinancial liabilities. It also prohibits all entities from electing to use the fair value option in ASC 825, FinancialInstruments, to measure either the financial assets or financial liabilities of a consolidated CFE that is within thescope of this issue. This guidance is effective for fiscal years beginning after December 15, 2015 and interimperiods therein. Early adoption is permitted using a modified retrospective transition approach as described in thepronouncement. The Company believes the adoption of this standard will not have a material impact on theCompany’s consolidated financial statements.
F-15

Virtus Investment Partners, Inc.
Notes to Consolidated Financial Statements—(Continued)
In May 2014, the FASB issued ASU No. 2014-09, Revenue from Contracts with Customers (“ASU 2014-09”).ASU 2014-09 provides a comprehensive new revenue recognition model requiring a company to recognize revenueto depict the transfer of goods or services to a customer at an amount reflecting the consideration it expects toreceive in exchange for those goods or services. Companies may use either a full retrospective or a modifiedretrospective approach. In July 2015, the FASB confirmed a deferral of the effective date by one year, with earlyadoption on the original effective date permitted. As deferred, ASU 2014-09 is effective for the first interim periodwithin annual reporting periods beginning after December 15, 2017 with early adoption permitted. The Companyhas not yet adopted ASU 2014-09 and is currently evaluating the impact ASU 2014-09 is expected to have on itsconsolidated financial statements.
3. Goodwill and Other Intangible Assets
Intangible assets, net are summarized as follows:
December 31,
2015 2014
($ in thousands)
Definite-lived intangible assets, net:Investment contracts . . . . . . . . . . . . . . . . . . . . . . . . . . . . . . . . . . . . $ 158,747 $ 158,747Accumulated amortization . . . . . . . . . . . . . . . . . . . . . . . . . . . . . . . (152,676) (149,380)
Definite-lived intangible assets, net . . . . . . . . . . . . . . . . . . . . . . . . 6,071 9,367Indefinite-lived intangible assets . . . . . . . . . . . . . . . . . . . . . . . . . 34,816 32,416
Total intangible assets, net . . . . . . . . . . . . . . . . . . . . . . . . . . . . . . . $ 40,887 $ 41,783
Activity in goodwill and intangible assets, net is as follows:
Years Ended December 31,
2015 2014 2013
($ in thousands)
Intangible assets, netBalance, beginning of period . . . . . . . . . . . . . . . . . . . . . . . $41,783 $44,633 $48,711Acquisition . . . . . . . . . . . . . . . . . . . . . . . . . . . . . . . . . . . . . 2,400 1,075 356Amortization expense . . . . . . . . . . . . . . . . . . . . . . . . . . . . . (3,296) (3,925) (4,434)
Balance, end of period . . . . . . . . . . . . . . . . . . . . . . . . . . . $40,887 $41,783 $44,633
GoodwillBalance, beginning of period . . . . . . . . . . . . . . . . . . . . . . . $ 5,260 $ 5,260 $ 5,260Acquisition . . . . . . . . . . . . . . . . . . . . . . . . . . . . . . . . . . . . . 1,441 — —
Balance, end of period . . . . . . . . . . . . . . . . . . . . . . . . . . . $ 6,701 $ 5,260 $ 5,260
Definite-lived intangible asset amortization for the next five years is estimated as follows: 2016—$2.5 million,2017—$0.8 million, 2018—$0.6 million, 2019—$0.5 million, 2020—$0.4 million, and thereafter—$1.3 million. AtDecember 31, 2015, the weighted average estimated remaining amortization period for definite-lived intangibleassets is 5.6 years.
4. Business Combination
On April 10, 2015, the Company made an investment of approximately $4.8 million for a majorityownership position in Virtus ETF Solutions (“VES”), formerly known as ETF Issuer Solutions. VES is a
F-16

Virtus Investment Partners, Inc.
Notes to Consolidated Financial Statements—(Continued)
New York City-based company that operates a platform for listing, operating, and distributing exchange tradedfunds. The transaction was accounted for under ASC 805 Business Combinations. Goodwill of $1.4 million andother intangible assets of $2.4 million were recorded as a result of this transaction. The impact of this transactionwas not material to the Company’s consolidated financial statements.
5. Investments
Investments consist primarily of investments in our sponsored mutual funds. The Company’s investments,excluding the assets of consolidated sponsored investment products discussed in Note 17 and the assets of theconsolidated investment product discussed in Note 18, at December 31, 2015 and 2014 were as follows:
December 31,
2015 2014
($ in thousands)
Marketable securities . . . . . . . . . . . . . . . . . . . . . . . . . . . . . . . . . . . . . . $41,496 $50,251Equity method investments . . . . . . . . . . . . . . . . . . . . . . . . . . . . . . . . . . 9,007 7,209Nonqualified retirement plan assets . . . . . . . . . . . . . . . . . . . . . . . . . . . 5,310 5,063Other investments . . . . . . . . . . . . . . . . . . . . . . . . . . . . . . . . . . . . . . . . . 925 925
Total investments . . . . . . . . . . . . . . . . . . . . . . . . . . . . . . . . . . . . . . . . . $56,738 $63,448
Marketable Securities
The Company’s marketable securities consist of both trading (including securities held by a broker-dealeraffiliate) and available-for-sale securities. The composition of the Company’s marketable securities issummarized as follows:
December 31, 2015
CostUnrealized
LossUnrealized
GainFair
Value
($ in thousands)
Trading:Sponsored funds . . . . . . . . . . . . . . . . . . . . . . . . . . . . . . . . . . . . . $31,167 $(2,134) $298 $29,331Equity securities . . . . . . . . . . . . . . . . . . . . . . . . . . . . . . . . . . . . . 9,434 (386) 120 9,168
Available-for-sale:Sponsored closed-end funds . . . . . . . . . . . . . . . . . . . . . . . . . . . . 3,355 (365) 7 2,997
Total marketable securities . . . . . . . . . . . . . . . . . . . . . . . . . . . . . . . $43,956 $(2,885) $425 $41,496
December 31, 2014
CostUnrealized
LossUnrealized
GainFair
Value
($ in thousands)
Trading:Sponsored funds . . . . . . . . . . . . . . . . . . . . . . . . . . . . . . . . . . . . . $39,079 $(1,190) $423 $38,312Equity securities . . . . . . . . . . . . . . . . . . . . . . . . . . . . . . . . . . . . . 8,421 — 319 8,740
Available-for-sale:Sponsored closed-end funds . . . . . . . . . . . . . . . . . . . . . . . . . . . . 3,129 (163) 233 3,199
Total marketable securities . . . . . . . . . . . . . . . . . . . . . . . . . . . . . . . $50,629 $(1,353) $975 $50,251
F-17

Virtus Investment Partners, Inc.
Notes to Consolidated Financial Statements—(Continued)
For the years ended December 31, 2015, 2014 and 2013, the Company recognized a realized gain of$0.4 million, $8.2 million and $1.0 million, respectively, on trading securities.
Equity Method Investments
In 2014, the Company acquired an interest in a limited partnership for approximately $5.0 million whichincludes a future capital commitment for up to $4.9 million in the event that it is called by the partnership.
On April 9, 2013, the Company acquired a 24% noncontrolling Euro-denominated equity interest inKleinwort Benson Investors International, Ltd. (“KBII”), a subsidiary of Kleinwort Benson Investors (Dublin)(“KBID”) for €2.6 million or $3.4 million. KBII is a U.S. registered investment adviser that provides specializedequity strategies. In conjunction with this investment, the Company entered into a put and call option with KBID.This investment is translated into U.S. dollars at current exchange rates as of the end of each accounting period.Net income or loss of the noncontrolled affiliate is translated at average exchange rates in effect during theaccounting period. Net translation exchange gains and losses are excluded from income and recorded inaccumulated other comprehensive income.
Nonqualified Retirement Plan Assets
The Excess Incentive Plan allows certain employees to voluntarily defer compensation. The Company holdsthe Excess Incentive Plan assets in a rabbi trust, which is subject to the claims of the Company’s creditors in theevent of the Company’s bankruptcy or insolvency. Assets held in trust are included in investments and arecarried at fair value in accordance with ASC 320; the associated obligations to participants are included in otherliabilities in the Company’s Consolidated Balance Sheets.
Other Investments
Other investments represents interests in entities not accounted for under the equity method such as the costmethod or fair value.
6. Fair Value Measurements
The Company’s assets and liabilities measured at fair value on a recurring basis, excluding the assets andliabilities of consolidated sponsored investment products and the consolidated investment product discussed inNotes 17 and 18, respectively, as of December 31, 2015 and December 31, 2014, by fair value hierarchy levelwere as follows:
December 31, 2015Level 1 Level 2 Level 3 Total
($ in thousands)
AssetsCash equivalents . . . . . . . . . . . . . . . . . . . . . . . . . . . . . . . . . . . . . . . . . . . . $ 54,772 $— $— $ 54,772Marketable securities trading:
Sponsored funds . . . . . . . . . . . . . . . . . . . . . . . . . . . . . . . . . . . . . . . . 29,331 — — 29,331Equity securities . . . . . . . . . . . . . . . . . . . . . . . . . . . . . . . . . . . . . . . . 9,168 — — 9,168
Marketable securities available-for-sale:Sponsored closed-end funds . . . . . . . . . . . . . . . . . . . . . . . . . . . . . . . 2,997 — — 2,997
Other investmentsNonqualified retirement plan assets . . . . . . . . . . . . . . . . . . . . . . . . . 5,310 — — 5,310
Total assets measured at fair value . . . . . . . . . . . . . . . . . . . . . . . . . . . . $101,578 $— $— $101,578
F-18

Virtus Investment Partners, Inc.
Notes to Consolidated Financial Statements—(Continued)
December 31, 2014Level 1 Level 2 Level 3 Total
($ in thousands)
AssetsCash equivalents . . . . . . . . . . . . . . . . . . . . . . . . . . . . . . . . . . . . . . . . . . . . $202,054 $— $— $202,054Marketable securities trading:
Sponsored funds . . . . . . . . . . . . . . . . . . . . . . . . . . . . . . . . . . . . . . . . 38,312 — — 38,312Equity securities . . . . . . . . . . . . . . . . . . . . . . . . . . . . . . . . . . . . . . . . 8,740 — — 8,740
Marketable securities available-for-sale:Sponsored closed-end funds . . . . . . . . . . . . . . . . . . . . . . . . . . . . . . . 3,199 — — 3,199
Other investmentsNonqualified retirement plan assets . . . . . . . . . . . . . . . . . . . . . . . . . 5,063 — — 5,063
Total assets measured at fair value . . . . . . . . . . . . . . . . . . . . . . . . . . . . $257,368 $— $— $257,368
The following is a discussion of the valuation methodologies used for the Company’s assets measured at fairvalue.
Cash equivalents represent investments in money market funds. Cash investments in actively traded moneymarket funds are valued using published net asset values and are classified as Level 1.
Sponsored funds represent investments in open-end mutual funds, variable insurance funds and closed-endfunds for which the Company acts as the investment manager. The fair value of open-end mutual funds andvariable insurance funds is determined based on their published net asset values and are categorized as Level 1.The fair value of closed-end funds is determined based on the official closing price on the exchange they aretraded on and are categorized as Level 1.
Equity securities include securities traded on active markets and are valued at the official closing price(typically last sale or bid) on the exchange on which the securities are primarily traded and are categorized asLevel 1.
Nonqualified retirement plan assets represent mutual funds within a nonqualified retirement plan whose fairvalue is determined based on their published net asset value and are categorized as Level 1.
Cash, accounts receivable, accounts payable and accrued liabilities equal or approximate fair value based onthe short-term nature of these instruments.
Transfers into and out of levels are reflected when significant inputs used for the fair value measurement,including market inputs or performance attributes, become observable or unobservable or when the Companydetermines it has the ability, or no longer has the ability, to redeem, in the near term, certain investments that theCompany values using a net asset value, or if the book value no longer represents fair value. There were notransfers between Level 1 and Level 2 during the years ended December 31, 2015 and 2014.
F-19

Virtus Investment Partners, Inc.
Notes to Consolidated Financial Statements—(Continued)
7. Furniture, Equipment and Leasehold Improvements, Net
Furniture, equipment and leasehold improvements, net are summarized as follows:
December 31,
2015 2014
($ in thousands)
Furniture and office equipment . . . . . . . . . . . . . . . . . . . . . . . . . . . . . $ 5,840 $ 4,762Computer equipment and software . . . . . . . . . . . . . . . . . . . . . . . . . . . 6,600 6,148Leasehold improvements . . . . . . . . . . . . . . . . . . . . . . . . . . . . . . . . . . 11,071 8,454
23,511 19,364Accumulated depreciation and amortization . . . . . . . . . . . . . . . . . . . (14,395) (12,171)
Furniture, equipment and leasehold improvements, net . . . . . . . . . . . $ 9,116 $ 7,193
8. Income Taxes
The components of the provision for income taxes are as follows:
Years Ended December 31,
2015 2014 2013
($ in thousands)
CurrentFederal . . . . . . . . . . . . . . . . . . . . . . . . . . . . . . . . . . . . $28,077 $31,787 $10,395State . . . . . . . . . . . . . . . . . . . . . . . . . . . . . . . . . . . . . . 2,539 3,168 1,787
Total current tax expense . . . . . . . . . . . . . . . . . . . . . . . . . . 30,616 34,955 12,182
DeferredFederal . . . . . . . . . . . . . . . . . . . . . . . . . . . . . . . . . . . . 4,339 3,200 29,933State . . . . . . . . . . . . . . . . . . . . . . . . . . . . . . . . . . . . . . 2,017 1,194 2,663
Total deferred tax expense . . . . . . . . . . . . . . . . . . . . . . . . . 6,356 4,394 32,596
Total expense for income taxes . . . . . . . . . . . . . . . . . . . . . $36,972 $39,349 $44,778
The following presents a reconciliation of the provision (benefit) for income taxes computed at the federalstatutory rate to the provision (benefit) for income taxes recognized in the Consolidated Statements of Operationsfor the years indicated:
Years Ended December 31,
2015 2014 2013
($ in thousands)
Tax at statutory rate . . . . . . . . . . . . . . . . . . . . . . . . . . . . . . . . . . . . $23,675 35% $ 47,922 35% $41,968 35%State taxes, net of federal benefit . . . . . . . . . . . . . . . . . . . . . . . . . . 2,717 4 4,357 3 2,893 2Uncertain tax positions . . . . . . . . . . . . . . . . . . . . . . . . . . . . . . . . . — — (30,961) (22) — —IRS audit resolution . . . . . . . . . . . . . . . . . . . . . . . . . . . . . . . . . . . . — — 15,505 11 — —Effect of net income attributable to noncontrolling interests . . . . 1,492 2 — — — —Change in valuation allowance . . . . . . . . . . . . . . . . . . . . . . . . . . . 7,812 12 2,165 2 (264) —Other, net . . . . . . . . . . . . . . . . . . . . . . . . . . . . . . . . . . . . . . . . . . . . 1,276 2 361 — 181 —
Income tax expense . . . . . . . . . . . . . . . . . . . . . . . . . . . . . . . . . . . . $36,972 55% $ 39,349 29% $44,778 37%
F-20

Virtus Investment Partners, Inc.
Notes to Consolidated Financial Statements—(Continued)
The provision for income taxes reflects U.S. federal, state and local taxes at an estimated effective tax rateof 55%, 29% and 37% for the years ended December 31, 2015, 2014 and 2013, respectively. The Company’s taxposition for the years ended December 31, 2015 and 2014 was impacted by changes in the valuation allowancerelated to the unrealized loss position on the Company’s marketable securities. Additionally, the Company’seffective tax rate for the year ended December 31, 2014 was impacted by a net tax benefit of approximately$15.5 million due to the settlement of the Internal Revenue Service (“IRS”) examination of its 2011 federalconsolidated corporate income tax return. The net benefit arises from the settlement of the Company’s 2011 IRSexam and is comprised of the recognition of tax benefits from previously uncertain tax positions ofapproximately $31.0 million and a reduction in the available loss deduction of approximately $15.5 million ofwhich both related to the past dissolution of a subsidiary.
Deferred taxes resulted from temporary differences between the amounts reported in the consolidatedfinancial statements and the tax basis of assets and liabilities. The tax effects of temporary differences are asfollows:
December 31,
2015 2014
($ in thousands)
Deferred tax assets:Intangible assets . . . . . . . . . . . . . . . . . . . . . . . . . . . . . . . . . . . . . . . . . $ 27,728 $ 36,340Net operating losses . . . . . . . . . . . . . . . . . . . . . . . . . . . . . . . . . . . . . . 20,591 21,547Compensation accruals . . . . . . . . . . . . . . . . . . . . . . . . . . . . . . . . . . . . 7,804 6,757Investments . . . . . . . . . . . . . . . . . . . . . . . . . . . . . . . . . . . . . . . . . . . . . 8,704 8,717Unrealized loss/(gain) . . . . . . . . . . . . . . . . . . . . . . . . . . . . . . . . . . . . . 12,157 2,362Other . . . . . . . . . . . . . . . . . . . . . . . . . . . . . . . . . . . . . . . . . . . . . . . . . . 118 46
Gross deferred tax assets . . . . . . . . . . . . . . . . . . . . . . . . . . . . . . . . . . 77,102 75,769Valuation allowance . . . . . . . . . . . . . . . . . . . . . . . . . . . . . . . . . . . . . . (10,855) (2,397)
Gross deferred tax assets after valuation allowance . . . . . . . . . . . . . . 66,247 73,372
Deferred tax liabilities:Intangible assets . . . . . . . . . . . . . . . . . . . . . . . . . . . . . . . . . . . . . . . . . (12,104) (12,718)Other investments . . . . . . . . . . . . . . . . . . . . . . . . . . . . . . . . . . . . . . . . — (492)
Gross deferred tax liabilities . . . . . . . . . . . . . . . . . . . . . . . . . . . . . . . . (12,104) (13,210)
Deferred tax assets, net . . . . . . . . . . . . . . . . . . . . . . . . . . . . . . . . . . . . $ 54,143 $ 60,162
At each reporting date, the Company evaluates the positive and negative evidence used to determine thelikelihood of realization of its deferred tax assets. The Company maintained a valuation allowance in the amountof $10.9 million and $2.4 million at December 31, 2015 and 2014, respectively, relating to deferred tax assets onitems of a capital nature as well as certain state deferred tax assets.
As of December 31, 2015, the Company had $40.3 million of net operating loss carry-forwards for federalincome tax purposes. The related federal net operating loss carry-forwards are scheduled to begin to expire in theyear 2029. As of December 31, 2015, the Company had state net operating loss carry-forwards, varying bysubsidiary and jurisdiction, represented by a $6.5 million deferred tax asset. The state net operating loss carry-forwards are scheduled to begin to expire in 2016.
Internal Revenue Code Section 382 limits tax deductions for net operating losses, capital losses and netunrealized built-in losses after there is a substantial change in ownership in a corporation’s stock involving a
F-21

Virtus Investment Partners, Inc.
Notes to Consolidated Financial Statements—(Continued)
50 percentage point increase in ownership by 5% or larger stockholders. During the year ended December 31,2009, due to changes in the Company’s stockholder base, the Company incurred an ownership change as definedin Section 382. At December 31, 2015, the Company has approximately $62.3 million in pre-change built-inlosses that are reflected within the Company’s deferred tax assets noted above and are subject to an annuallimitation of $4.2 million plus any cumulative unused Section 382 limitation from post-change tax years.
Activity in unrecognized tax benefits is as follows:
Years Ended December 31,
2015 2014 2013
($ in thousands)
Balance, beginning of year . . . . . . . . . . . . . . . . . . . . . . . . . . $— $ 32,602 $33,948Decrease related to tax positions taken in prior years . . . . . . — (32,602) (1,346)Increase related to positions taken in the current year . . . . . . — — —
Balance, end of year . . . . . . . . . . . . . . . . . . . . . . . . . . . . . . . . $— $ — $32,602
The Company’s practice is to classify interest and penalties related to income tax matters in income taxexpense. The Company recorded no interest or penalties related to uncertain tax positions at December 31, 2015,2014 and 2013.
During the year ended December 31, 2015, the Company recognized tax benefits of $1.1 million related tocumulative windfall deductions on certain stock-based incentive plans. Under ASC 718, these tax benefits areutilized for financial statement purposes when they serve to reduce income taxes payable. Under the Company’saccounting policy, net operating losses and benefits from other sources are recognized before windfall benefitcarryovers. The tax benefit related to these windfall deductions was recorded as an increase to stockholders’equity in the Company’s Consolidated Balance Sheets.
The earliest federal tax year that remains open for examination is 2008 since unutilized net operating losscarry-forwards from 2008 could be denied when claimed in future years. The earliest open years in theCompany’s major state tax jurisdictions are 2001 for Connecticut and 2011 for all of the Company’s remainingstate tax jurisdictions.
9. Debt
Credit Facility
The Company has an amended and restated senior secured revolving credit facility (the “Credit Facility”)that has a five-year term expiring in September 2017 and provides borrowing capacity of up to $75.0 million,with a $7.5 million sub-limit for the issuance of standby letters of credit. In addition, the Credit Facility providesfor a $50.0 million increase in borrowing capacity conditioned on approval by the lending group. The CreditFacility is secured by substantially all of the assets of the Company. At December 31, 2015 and 2014, there wereno amounts outstanding under the Credit Facility. As of December 31, 2015, the Company had the capacity todraw on the entire $75.0 million under the Credit Facility.
Amounts outstanding under the Credit Facility bear interest at an annual rate equal to, at the Company’soption, either LIBOR for interest periods of one, two, three or six months or an alternate base rate (as defined inthe Credit Facility agreement), plus, in each case, an applicable margin, that ranges from 0.75% to 2.50%. Underthe terms of the Credit Facility, the Company is also required to pay certain fees, including an annual
F-22

Virtus Investment Partners, Inc.
Notes to Consolidated Financial Statements—(Continued)
commitment fee that ranges from 0.35% to 0.50% on undrawn amounts and a letter of credit participation fee atan annual rate equal to the applicable margin as well as any applicable fronting fees, each of which is payablequarterly in arrears.
The Credit Facility contains customary covenants, including covenants that restrict (subject in certaininstances to minimum thresholds or exceptions) the ability of the Company and certain of its subsidiaries to incuradditional indebtedness, create liens, merge or make acquisitions, dispose of assets, enter into leases, sale/leasebacks or acquisitions of capital stock, and make loans, guarantees and investments, among other things. Inaddition, the Credit Facility contains certain financial covenants, the most restrictive of which include: (i) aminimum interest coverage ratio (generally, adjusted EBITDA to interest expense as defined in and for theperiod specified in the Credit Facility agreement) of at least 4.00:1, and (ii) a leverage ratio (generally, total debtas of any date to adjusted EBITDA as defined in and for the period specified in the Credit Facility agreement) ofno greater than 2.75:1. For purposes of the Credit Facility, adjusted EBITDA generally means, for any period, netincome of the Company before interest expense, income taxes, depreciation and amortization expense, andexcluding non-cash stock-based compensation, unrealized mark-to-market gains and losses, certain severance,and certain non-cash non-recurring gains and losses as described in and specified under the Credit Facility. AtDecember 31, 2015 and 2014, the Company was in compliance with all financial covenants under the CreditFacility.
The Credit Facility agreement also contains customary provisions regarding events of default which couldresult in an acceleration of amounts due under the facility. Such events of default include our failure to payprincipal or interest when due, our failure to satisfy or comply with covenants, a change of control, theimposition of certain judgments, the invalidation of liens we have granted, and a cross-default to other debtobligations.
10. Commitments and Contingencies
Legal Matters
The Company is regularly involved in litigation and arbitration as well as examinations, inquiries andinvestigations by various regulatory bodies, including the SEC, involving its compliance with, among otherthings, securities laws, client investment guidelines, laws governing the activities of broker-dealers and otherlaws and regulations affecting its products and other activities. Legal and regulatory matters of this natureinvolve or may involve but are not limited to the Company’s activities as an employer, issuer of securities,investor, investment adviser, broker-dealer or taxpayer. In addition, in the normal course of business, theCompany discusses matters with its regulators raised during regulatory examinations or is otherwise subject totheir inquiry. These matters could result in censures, fines, penalties or other sanctions.
The Company accrues for a liability when it is both probable that a liability has been incurred and theamount of the liability can be reasonably estimated. Significant judgment is required in both the determination ofprobability and the determination as to whether a loss is reasonably estimable. In addition, in the event theCompany determines that a loss is not probable, but is reasonably possible, and it becomes possible to developwhat the Company believes to be a reasonable range of possible loss, then the Company will include disclosuresrelated to such matter as appropriate and in compliance with ASC 450, Loss Contingencies. The disclosures,accruals or estimates, if any, resulting from the foregoing analysis are reviewed at least quarterly and adjusted toreflect the impact of negotiations, settlements, rulings, advice of legal counsel and other information and eventspertaining to a particular matter. Based on information currently available, available insurance coverage andestablished reserves, the Company believes that the outcomes of its legal and regulatory proceedings are notlikely, either individually or in the aggregate, to have a material adverse effect on the Company’s results of
F-23

Virtus Investment Partners, Inc.
Notes to Consolidated Financial Statements—(Continued)
operations, cash flows or its consolidated financial condition. However, in the event of unexpected subsequentdevelopments and given the inherent unpredictability of these legal and regulatory matters, the Company canprovide no assurance that its assessment of any claim, dispute, regulatory examination or investigation or otherlegal matter will reflect the ultimate outcome and an adverse outcome in certain matters could, from time to time,have a material adverse effect on the Company’s results of operations or cash flows in particular quarterly orannual periods.
Regulatory Matter
As previously disclosed, in December 2014 the SEC announced a settlement with F-Squared Investments(“F-Squared”), an unaffiliated former subadviser, which settled charges that F-Squared had violated the federalsecurities laws as described in Investment Advisers Act Release No. 3988. The settlement related to F-Squared’sinaccurate performance information for the period of April 2001 through September 2008, including indices thatcertain Virtus mutual funds tracked beginning in September 2009 and January 2011. As part of the SEC’s non-public, confidential investigation of this matter, the SEC staff informed the Company that it was inquiring intowhether the Company had violated securities laws or regulations with respect to F-Squared’s historicalperformance information. In November 2015, without admitting or denying the SEC’s findings, the Companyconsented to the entry of the order which found that the Company violated certain Sections of the InvestmentAdvisers Act and the Investment Company Act of 1940. The Company agreed to pay a total of $16.5 million,which it paid in the fourth quarter of 2015.
In re Virtus Investment Partners, Inc. Securities Litigation; formerly styled as Tom Cummins v. VirtusInvestment Partners Inc. et al
On February 20, 2015, a putative class action complaint alleging violation of the federal securities laws wasfiled by an individual shareholder against the Company and certain of the Company’s current officers (the“defendants”) in the United States District Court for the Southern District of New York. On April 21, 2015, threeplaintiffs, including the original plaintiff, filed motions to be appointed lead plaintiff. On June 9, 2015, the courtentered an order appointing Arkansas Teachers Retirement System lead plaintiff. On August 21, 2015, plaintifffiled a Consolidated Class Action Complaint (the “Consolidated Complaint”) amending the originally filedcomplaint. The Consolidated Complaint was purportedly filed on behalf of all purchasers of the Company’scommon stock between January 25, 2013 and May 11, 2015 (the “Class Period”). The Consolidated Complaintalleges that during the Class Period, the defendants disseminated materially false and misleading statements andconcealed material adverse facts relating to certain funds subadvised by F-Squared. The Consolidated Complaintalleges claims under Sections 10(b) and 20(a) of the Securities Exchange Act of 1934, as amended, andRule 10b-5. The plaintiff seeks to recover unspecified damages. The Company believes that the suit is withoutmerit and intends to defend it vigorously. A motion to dismiss the Consolidated Complaint was filed on behalf ofthe Company and the other defendants on October 21, 2015. Briefing of the motion was completed onDecember 4, 2015 and oral argument was held on December 17, 2015. The motion is pending. The Companybelieves that there is not a material loss that is probable and reasonably estimable related to this claim.
Mark Youngers v. Virtus Investment Partners, Inc. et al
On May 8, 2015, a putative class action complaint alleging violations of certain provisions of the federalsecurities laws was filed in the United States District Court for the Central District of California by an individualwho alleges he is a former shareholder of one of the Virtus mutual funds formerly subadvised by F-Squared andformerly known as the AlphaSector Funds. The complaint purports to allege claims against the Company, certainof the Company’s officers and affiliates, and certain other parties (the “defendants”). The complaint was
F-24

Virtus Investment Partners, Inc.
Notes to Consolidated Financial Statements—(Continued)
purportedly filed on behalf of purchasers of the AlphaSector Funds between May 8, 2010 and December 22,2014, inclusive (the “Class Period”). The complaint alleges that during the Class Period the defendantsdisseminated materially false and misleading statements and concealed or omitted material facts necessary tomake the statements made not misleading. On June 7, 2015, a group of three individuals, including the originalplaintiff, filed a motion to be appointed lead plaintiff. No other motions to be appointed lead plaintiff were filed.On July 27, 2015, the court granted the motion, appointing movants as lead plaintiff. On July 27, 2015, the courtissued an order to show cause requiring lead plaintiff to explain no later than July 31, 2015, why his claimsshould not be transferred and consolidated with the In re Virtus Investment Partners, Inc. Securities Litigationaction discussed above. On October 1, 2015, plaintiff filed a First Amended Class Action Complaint which,among other things, added a derivative claim for breach of fiduciary duty on behalf of Virtus OpportunitiesTrust. On October 19, 2015, The United States District Court for the Central District of California entered anorder transferring the action to the Southern District of New York. On January 4, 2016, Plaintiffs filed a SecondAmended Complaint. Defendant’s filed a motion to dismiss on February 1, 2016. The Company believes theplaintiff’s claims asserted in the complaint are frivolous and intends to defend it vigorously. The Companybelieves that there is not a material loss that is probable and reasonably estimable related to this claim.
Lease Commitments
The Company incurred rental expenses, primarily related to office space, under operating leases of $4.3million, $3.7 million and $3.4 million in 2015, 2014 and 2013, respectively. Minimum aggregate rental paymentsrequired under operating leases that have initial or remaining non-cancelable lease terms in excess of one year asof December 31, 2015 are as follows: $4.8 million in 2016; $5.0 million in 2017; $4.5 million in 2018; $2.9million in 2019; $2.4 million in 2020; and $3.2 million thereafter.
11. Equity Transactions
During the years ended December 31, 2015 and 2014, pursuant to the Company’s share repurchase programimplemented in the fourth quarter of 2010, the Company repurchased 638,703 and 225,441 common shares,respectively, at a weighted average price of $125.22 per share and $178.54 per share, respectively, plustransaction costs for a total cost of approximately $80.0 million and $40.3 million, respectively. As ofDecember 31, 2015, the Company has repurchased a total of 1,214,144 shares of common stock at a weightedaverage price of $129.85 per share plus transaction costs for a total cost of $157.7 million.
On October 21, 2015, the Company’s board of directors authorized an additional 1,500,000 shares ofcommon stock under the current share repurchase program and at December 31, 2015 1,485,856 shares remainavailable for repurchase. Under terms of the program, the Company may repurchase shares of its common stockfrom time to time at its discretion through open market repurchases and/or privately negotiated transactions,depending on price and prevailing market and business conditions. The program, which has no specified term,may be suspended or terminated at any time.
During each quarter of the year ended December 31, 2015 and the second, third and fourth quarters of theyear ended December 31, 2014, the Board of Directors declared quarterly cash dividends of $0.45 each. Totaldividends declared were $16.0 million for the year ended December 31, 2015 and $12.5 million for the yearended December 31, 2014. At December 31, 2015, $4.2 million is shown as dividends payable in liabilities in theConsolidated Balance Sheet, primarily representing the fourth quarter dividend to be paid on February 12, 2016to all shareholders of record on January 29, 2016. There were no cash dividends during the year endedDecember 31, 2013.
F-25

Virtus Investment Partners, Inc.
Notes to Consolidated Financial Statements—(Continued)
12. Accumulated Other Comprehensive Income
The changes in accumulated other comprehensive loss, by component, are as follows:
Unrealized Gainsand (Losses)on Securities
Available-for-Sale
ForeignCurrency
TranslationAdjustments
($ in thousands)
Balance December 31, 2014 . . . . . . . . . . . . . . . . . . . . . . . . . $(107) $(135)
Unrealized net loss on available-for-sale securities, net oftax of $71 . . . . . . . . . . . . . . . . . . . . . . . . . . . . . . . . . . . . . . (358) —
Foreign currency translation adjustments, net of tax of$266 . . . . . . . . . . . . . . . . . . . . . . . . . . . . . . . . . . . . . . . . . . — (434)
Amounts reclassified from accumulated othercomprehensive loss . . . . . . . . . . . . . . . . . . . . . . . . . . . . . . — —
Net current-period other comprehensive loss . . . . . . . . . . . . (358) (434)
Balance December 31, 2015 . . . . . . . . . . . . . . . . . . . . . . . . . $(465) $(569)
Unrealized Gainsand (Losses)on Securities
Available-for-Sale
ForeignCurrency
TranslationAdjustments
($ in thousands)
Balance December 31, 2013 . . . . . . . . . . . . . . . . . . . . . . . . . $(231) $ 81
Unrealized net gains on available-for-sale securities, net oftax of ($76) . . . . . . . . . . . . . . . . . . . . . . . . . . . . . . . . . . . . . 124 —
Foreign currency translation adjustments, net of tax of$132 . . . . . . . . . . . . . . . . . . . . . . . . . . . . . . . . . . . . . . . . . . — (216)
Amounts reclassified from accumulated othercomprehensive loss . . . . . . . . . . . . . . . . . . . . . . . . . . . . . . — —
Net current-period other comprehensive income (loss) . . . . . 124 (216)
Balance December 31, 2014 . . . . . . . . . . . . . . . . . . . . . . . . . $(107) $(135)
13. Retirement Savings Plan
The Company sponsors a defined contribution 401(k) retirement plan (the “401(k) Plan”) covering allemployees who meet certain age and service requirements. Employees may contribute a percentage of theireligible compensation into the 401(k) Plan, subject to certain limitations imposed by the Internal Revenue Code.The Company matches employees’ contributions at a rate of 100% of employees’ contributions up to the first3.0% and 50.0% of the next 2.0% of the employees’ compensation contributed to the 401(k) Plan. TheCompany’s matching contributions were $2.1 million, $2.8 million and $2.5 million in 2015, 2014 and 2013,respectively.
14. Stock-Based Compensation
The Company has an Omnibus Incentive and Equity Plan (the “Plan”) under which officers, employees anddirectors may be granted equity-based awards, including restricted stock units (“RSUs”), stock options and
F-26

Virtus Investment Partners, Inc.
Notes to Consolidated Financial Statements—(Continued)
unrestricted shares of common stock. At December 31, 2015, 322,986 shares of common stock remain availablefor issuance of the 1,800,000 shares that were reserved for issuance under the Plan. Each RSU entitles the holderto one share of common stock when the restriction expires. RSUs generally have a term of one to three years andmay be time-vested or performance-contingent. Stock options generally cliff vest after three years and have acontractual life of ten years. Stock options are granted with an exercise price equal to the fair market value of theshares at the date of grant. The fair value of each RSU is estimated using the intrinsic value method, which isbased on the fair market value price on the date of grant unless it contains a performance metric that isconsidered a market condition. RSUs that contain a market condition are valued using a simulation valuationmodel. Shares that are issued upon exercise of stock options and vesting of RSUs are newly issued shares fromthe Plan and are not issued from treasury stock.
Stock-based compensation expense is summarized as follows:
Years Ended December 31,
2015 2014 2013
($ in thousands)
Stock-based compensation expense . . . . . . . . . . . . . . . . . . . . $11,863 $9,778 $7,960
RSU activity for the year ended December 31, 2015 is summarized as follows:
Numberof shares
WeightedAverage
Grant DateFair Value
Outstanding at December 31, 2014 . . . . . . . . . . . . . . . . . . . . . . . . . . 179,936 $143.25Granted . . . . . . . . . . . . . . . . . . . . . . . . . . . . . . . . . . . . . . . . . . . . . . . . 118,380 $134.37Forfeited . . . . . . . . . . . . . . . . . . . . . . . . . . . . . . . . . . . . . . . . . . . . . . . (19,289) $142.41Settled . . . . . . . . . . . . . . . . . . . . . . . . . . . . . . . . . . . . . . . . . . . . . . . . . (87,410) $102.00
Outstanding at December 31, 2015 . . . . . . . . . . . . . . . . . . . . . . . . . . 191,617 $156.66
The grant-date intrinsic value of RSUs granted during the year ended December 31, 2015 was $15.9 million.The weighted-average grant-date fair value of RSUs granted during the years ended December 31, 2015, 2014and 2013 was $134.37, $183.83 and $188.36 per share, respectively. The total fair value of RSUs vested duringthe years ended December 31, 2015, 2014 and 2013 was $11.8 million, $21.1 million and $17.9 million,respectively. For the years ended December 31, 2015, 2014 and 2013, a total of 37,488, 50,952 and 38,222RSUs, respectively, were withheld through net share settlement by the Company to settle minimum employee taxwithholding obligations. The Company paid $5.1 million, $9.1 million and $7.5 million for the years endedDecember 31, 2015, 2014 and 2013, respectively, in minimum employee tax withholding obligations related toRSUs withheld. These net share settlements had the effect of share repurchases by the Company as they reducedthe number of shares that would have been otherwise issued as a result of the vesting.
As of December 31, 2015, unamortized stock-based compensation expense for outstanding RSUs was $16.7million, with a weighted average remaining contractual life of 1.7 years. As of December 31, 2014, unamortizedstock-based compensation expense for outstanding RSUs was $12.6 million, with weighted average remainingcontractual life of 1.1 years. The Company did not capitalize any stock-based compensation expenses during theyears ended December 31, 2015, 2014 and 2013. There were no unvested stock options at December 31, 2015.
During the years ended December 31, 2015 and 2014, the Company granted 33,632 and 30,101 RSUs,respectively, each of which contains two performance based metrics in addition to a service condition. The two
F-27

Virtus Investment Partners, Inc.
Notes to Consolidated Financial Statements—(Continued)
performance metrics are based on the Company’s growth in operating income, as adjusted, relative to peers overa one year period and total shareholder return (“TSR”) relative to peers over a three year period. For the yearsended December 31, 2015 and 2014, total stock-based compensation expense included $2.5 million and$1.4 million respectively, for these performance contingent RSUs. As of December 31, 2015, unamortizedstock-based compensation expense related to these performance contingent RSUs was $6.2 million. As ofDecember 31, 2014, unamortized stock-based compensation expense related to these performance contingentRSUs was $3.5 million.
Compensation expense for these performance contingent awards is recognized over the three year serviceperiod based upon the value determined under the intrinsic value method for the growth in operating income, asadjusted portion of the awards and the Monte Carlo simulation valuation model for the TSR portion of theawards since it represents a market condition. Compensation expense for the TSR portion of the awards is fixedat the date of grant and will not be adjusted in future periods based upon the achievement of the TSRperformance metric. Compensation expense for the growth in operating income, as adjusted, portion of theawards is recorded each period based upon a probability assessment of the expected outcome of the performancemetric with a final adjustment upon the final outcome.
Stock option activity for the year ended December 31, 2015 is summarized as follows:
Numberof shares
WeightedAverage
Exercise Price
Outstanding at December 31, 2014 . . . . . . . . . . . . . . . . . . . . . . . . . 162,824 $18.79Granted . . . . . . . . . . . . . . . . . . . . . . . . . . . . . . . . . . . . . . . . . . . . . . — $ —Exercised . . . . . . . . . . . . . . . . . . . . . . . . . . . . . . . . . . . . . . . . . . . . . (6,188) $19.04Forfeited . . . . . . . . . . . . . . . . . . . . . . . . . . . . . . . . . . . . . . . . . . . . . — $ —
Outstanding at December 31, 2015 . . . . . . . . . . . . . . . . . . . . . . . . . 156,636 $18.78
Vested and exercisable at December 31, 2015 . . . . . . . . . . . . . . . . 156,636 $18.78
The weighted-average remaining contractual term for stock options outstanding at December 31, 2015 andDecember 31, 2014 was 2.9 and 3.9 years, respectively. The weighted-average remaining contractual term forstock options vested and exercisable at December 31, 2015 was 2.9 years. At December 31, 2015, the aggregateintrinsic value of stock options outstanding and vested and exercisable was $15.5 million. The total grant-datefair value of stock options vested during the years ended December 31, 2014 and 2013 was $0.4 million and $0.2million, respectively. There were no options vested during the year ended December 31, 2015. The total intrinsicvalue of stock options exercised for the years ended December 31, 2015, 2014 and 2013 was $0.7 million, $4.2million, $5.1 million, respectively. Cash received from stock option exercises was $0.1 million, $0.8 million and$0.6 million for 2015, 2014 and 2013, respectively.
Employee Stock Purchase Plan
The Company offers an employee stock purchase plan that allows employees to purchase shares of commonstock on the open market at market price through after-tax payroll deductions. The initial transaction fees arepaid for by the Company and shares of common stock are purchased on a quarterly basis. The Company does notreserve shares for this plan or discount the purchase price of the shares.
F-28

Virtus Investment Partners, Inc.
Notes to Consolidated Financial Statements—(Continued)
15. Earnings Per Share
The computation of basic and diluted earnings per share is as follows:
Years Ended December 31,
2015 2014 2013
($ in thousands, except per share amounts)
Net Income . . . . . . . . . . . . . . . . . . . . . . . . . . . . . . . . . . . . $30,671 $96,965 $77,130Noncontrolling interests . . . . . . . . . . . . . . . . . . . . . . . . . . . 4,435 735 (1,940)
Net Income Attributable to Common Stockholders . . . $35,106 $97,700 $75,190
Shares:Basic: Weighted-average number of shares
outstanding . . . . . . . . . . . . . . . . . . . . . . . . . . . . . . . . . . . 8,797 9,091 8,188Plus: Incremental shares from assumed conversion of
dilutive instruments . . . . . . . . . . . . . . . . . . . . . . . . . . . . 163 201 245
Diluted: Weighted-average number of sharesoutstanding . . . . . . . . . . . . . . . . . . . . . . . . . . . . . . . . . . . 8,960 9,292 8,433
Earnings per share—basic . . . . . . . . . . . . . . . . . . . . . . . . . $ 3.99 $ 10.75 $ 9.18Earnings per share—diluted . . . . . . . . . . . . . . . . . . . . . . . . $ 3.92 $ 10.51 $ 8.92
For the years ended December 31, 2015 and 2014, there were 1,521 and 6,085 instruments, respectively,excluded from the above computations of weighted-average shares for diluted EPS because the effect would beanti-dilutive. For the year ended December 31, 2013, there were no instruments excluded from the abovecomputations of weighted-average shares for diluted EPS because the effect would be anti-dilutive.
16. Concentration of Credit Risk
The concentration of credit risk with respect to advisory fees receivable is generally limited due to the shortpayment terms extended to clients by the Company. The following funds provided 10 percent or more of the totalrevenues of the Company:
Years Ended December 31,
2015 2014 2013
($ in thousands)
Virtus Emerging Markets Opportunities FundInvestment management, administration and transfer
agent fees . . . . . . . . . . . . . . . . . . . . . . . . . . . . . . . . $62,329 $50,435 $53,202Percent of total revenues . . . . . . . . . . . . . . . . . . . . . . 16% 11% 14%
Virtus Multi-Sector Short Term Bond FundInvestment management, administration and transfer
agent fees . . . . . . . . . . . . . . . . . . . . . . . . . . . . . . . . $49,174 $55,401 $52,568Percent of total revenues . . . . . . . . . . . . . . . . . . . . . . 13% 12% 14%
Virtus Equity Trend Fund (a)Investment management, administration and transfer
agent fees . . . . . . . . . . . . . . . . . . . . . . . . . . . . . . . . $30,398 $61,566 $41,921Percent of total revenues . . . . . . . . . . . . . . . . . . . . . . 8% 14% 11%
(a) Formerly Virtus Premium AlphaSector™ Fund
F-29

Virtus Investment Partners, Inc.
Notes to Consolidated Financial Statements—(Continued)
17. Consolidated Sponsored Investment Products
Sponsored Investment Products
In the normal course of its business, the Company sponsors various investment products. The Companyconsolidates, as a consolidated sponsored investment product, an investment product when it owns a majority ofthe voting interest in the entity or it is the primary beneficiary of an investment product that is a VIE. Theconsolidation and deconsolidation of these investment products have no impact on net income attributable tostockholders. The Company’s risk with respect to these investments is limited to its investment in these products.The Company has no right to the benefits from, and does not bear the risks associated with these investmentproducts, beyond the Company’s investments in, and fees generated from these products. The Company does notconsider cash and investments held by consolidated sponsored investment products or any other VIE to be assetsof the Company other than its direct investment in these products.
As of December 31, 2015 and December 31, 2014, the Company consolidated twelve sponsored investmentproducts, respectively. During the year ended December 31, 2015, the Company consolidated three additionalsponsored investment products and deconsolidated three sponsored investment products because it no longer hasa majority voting interest.
The following table presents the balances of the consolidated sponsored investment products that werereflected in the Consolidated Balance Sheets as of December 31, 2015 and 2014:
As of December 31,
2015 2014
($ in thousands)
Total cash . . . . . . . . . . . . . . . . . . . . . . . . . . . . . . . . . . . . . . . . . . . . . . . . . . . . . . . . . . . . . . . $ 11,866 $ 8,687Total investments . . . . . . . . . . . . . . . . . . . . . . . . . . . . . . . . . . . . . . . . . . . . . . . . . . . . . . . . . 323,335 236,652All other assets . . . . . . . . . . . . . . . . . . . . . . . . . . . . . . . . . . . . . . . . . . . . . . . . . . . . . . . . . . . 8,549 6,960Total liabilities . . . . . . . . . . . . . . . . . . . . . . . . . . . . . . . . . . . . . . . . . . . . . . . . . . . . . . . . . . . (15,387) (12,556)Redeemable noncontrolling interest . . . . . . . . . . . . . . . . . . . . . . . . . . . . . . . . . . . . . . . . . . . (73,864) (23,071)
The Company’s net interests in consolidated sponsored investment products . . . . . . . . . . . $254,499 $216,672
The Company’s net interest as a percentage of total investments of consolidatedsponsored investment products . . . . . . . . . . . . . . . . . . . . . . . . . . . . . . . . . . . . . . . . . . . . . 78.7% 91.6%
F-30
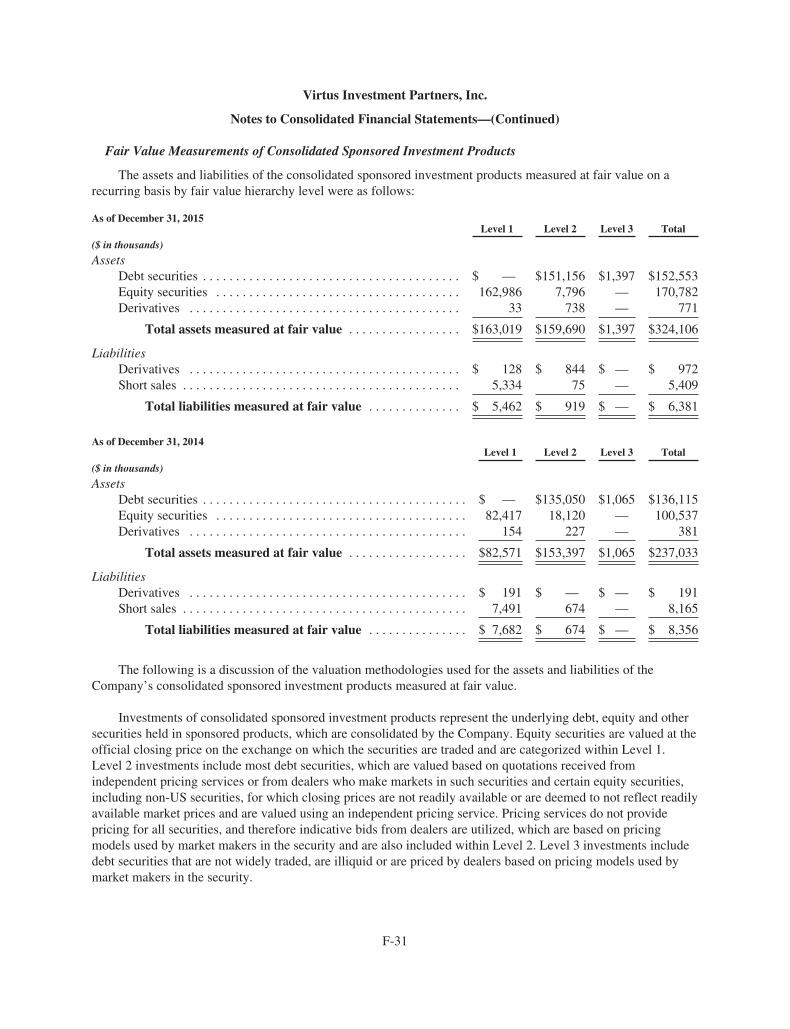
Virtus Investment Partners, Inc.
Notes to Consolidated Financial Statements—(Continued)
Fair Value Measurements of Consolidated Sponsored Investment Products
The assets and liabilities of the consolidated sponsored investment products measured at fair value on arecurring basis by fair value hierarchy level were as follows:
As of December 31, 2015Level 1 Level 2 Level 3 Total
($ in thousands)
AssetsDebt securities . . . . . . . . . . . . . . . . . . . . . . . . . . . . . . . . . . . . . . . $ — $151,156 $1,397 $152,553Equity securities . . . . . . . . . . . . . . . . . . . . . . . . . . . . . . . . . . . . . 162,986 7,796 — 170,782Derivatives . . . . . . . . . . . . . . . . . . . . . . . . . . . . . . . . . . . . . . . . . 33 738 — 771
Total assets measured at fair value . . . . . . . . . . . . . . . . . $163,019 $159,690 $1,397 $324,106
LiabilitiesDerivatives . . . . . . . . . . . . . . . . . . . . . . . . . . . . . . . . . . . . . . . . . $ 128 $ 844 $ — $ 972Short sales . . . . . . . . . . . . . . . . . . . . . . . . . . . . . . . . . . . . . . . . . . 5,334 75 — 5,409
Total liabilities measured at fair value . . . . . . . . . . . . . . $ 5,462 $ 919 $ — $ 6,381
As of December 31, 2014Level 1 Level 2 Level 3 Total
($ in thousands)
AssetsDebt securities . . . . . . . . . . . . . . . . . . . . . . . . . . . . . . . . . . . . . . . . $ — $135,050 $1,065 $136,115Equity securities . . . . . . . . . . . . . . . . . . . . . . . . . . . . . . . . . . . . . . 82,417 18,120 — 100,537Derivatives . . . . . . . . . . . . . . . . . . . . . . . . . . . . . . . . . . . . . . . . . . 154 227 — 381
Total assets measured at fair value . . . . . . . . . . . . . . . . . . $82,571 $153,397 $1,065 $237,033
LiabilitiesDerivatives . . . . . . . . . . . . . . . . . . . . . . . . . . . . . . . . . . . . . . . . . . $ 191 $ — $ — $ 191Short sales . . . . . . . . . . . . . . . . . . . . . . . . . . . . . . . . . . . . . . . . . . . 7,491 674 — 8,165
Total liabilities measured at fair value . . . . . . . . . . . . . . . $ 7,682 $ 674 $ — $ 8,356
The following is a discussion of the valuation methodologies used for the assets and liabilities of theCompany’s consolidated sponsored investment products measured at fair value.
Investments of consolidated sponsored investment products represent the underlying debt, equity and othersecurities held in sponsored products, which are consolidated by the Company. Equity securities are valued at theofficial closing price on the exchange on which the securities are traded and are categorized within Level 1.Level 2 investments include most debt securities, which are valued based on quotations received fromindependent pricing services or from dealers who make markets in such securities and certain equity securities,including non-US securities, for which closing prices are not readily available or are deemed to not reflect readilyavailable market prices and are valued using an independent pricing service. Pricing services do not providepricing for all securities, and therefore indicative bids from dealers are utilized, which are based on pricingmodels used by market makers in the security and are also included within Level 2. Level 3 investments includedebt securities that are not widely traded, are illiquid or are priced by dealers based on pricing models used bymarket makers in the security.
F-31

Virtus Investment Partners, Inc.
Notes to Consolidated Financial Statements—(Continued)
The following table is a reconciliation of assets of consolidated sponsored investment products for Level 3investments for which significant unobservable inputs were used to determine fair value.
Year Ended December 31,
2015 2014
(in thousands)
Level 3 Debt Securities (a)Balance at beginning of period . . . . . . . . . . . . . . . . . . . . $1,065 $ —Purchases . . . . . . . . . . . . . . . . . . . . . . . . . . . . . . . . . . . . . 913 1,119Sales . . . . . . . . . . . . . . . . . . . . . . . . . . . . . . . . . . . . . . . . (370) —Paydowns . . . . . . . . . . . . . . . . . . . . . . . . . . . . . . . . . . . . (10) (3)Change in unrealized loss, net . . . . . . . . . . . . . . . . . . . . . (113) (51)Change in realized loss, net . . . . . . . . . . . . . . . . . . . . . . . (141) —Transfers from Level 2 . . . . . . . . . . . . . . . . . . . . . . . . . . 151 —Transfers to Level 2 . . . . . . . . . . . . . . . . . . . . . . . . . . . . . (98) —
Balance at end of period . . . . . . . . . . . . . . . . . . . . . . . . $1,397 $1,065
(a) None of the securities were internally fair valued at December 31, 2015 or December 31, 2014.
For the year ended December 31, 2015, securities held by consolidated sponsored investment products withan end of period value of $8.4 million were transferred from Level 2 to Level 1 because certain non-US securitiesquoted market prices were no longer adjusted based on third-party factors derived from model-based valuationtechniques for which the significant assumptions were observable in the market. Securities with an end of periodmarket value of $0.2 million and $1.5 million were transferred from Level 1 to Level 2 during the years endedDecember 31, 2015 and December 31, 2014, respectively, because certain non-US securities’ quoted marketprices were adjusted based on third-party factors derived from model-based valuation techniques for which thesignificant assumptions were observable in the market or an exchange price for preferred shares was no longeravailable.
Derivatives
The Company has certain consolidated sponsored investment products which include derivative instrumentsas part of their investment strategies to contribute to the achievement of defined investment objectives. Thesederivatives may include futures contracts, swaps contracts, options contracts and forward contracts. Derivativeinstruments in an asset position are classified as other assets of consolidated sponsored investment products inthe Consolidated Balance Sheets. Derivative instruments in a liability position are classified as liabilities ofconsolidated sponsored investment products within the Consolidated Balance Sheets. The change in fair value ofsuch derivatives is recorded in realized and unrealized gain (loss) on investments of consolidated sponsoredinvestment products, net, in the Consolidated Statements of Operations. In connection with entering into thesederivative contracts, these funds may be required to pledge to the broker an amount of cash equal to the “initialmargin” requirements that varies based on the type of derivative. The cash pledged or on deposit is recorded inthe Consolidated Balance Sheets of the Company as Cash pledged or on deposit of consolidated sponsoredinvestment products. The fair value of such derivatives at December 31, 2014 was immaterial.
F-32

Virtus Investment Partners, Inc.
Notes to Consolidated Financial Statements—(Continued)
The Company’s consolidated sponsored investment products were party to the following derivativeinstruments for the year ended December 31, 2015:
Volume
($ in thousands)
Purchased options . . . . . . . . . . . . . . . . . . . . . . . . . . . . $ 3,015 (a)Written options . . . . . . . . . . . . . . . . . . . . . . . . . . . . . . . 755 (b)Futures contracts long/short . . . . . . . . . . . . . . . . . . . . . 278 (c)Forward foreign currency exchange purchase
contracts . . . . . . . . . . . . . . . . . . . . . . . . . . . . . . . . . . 5,591 (d)Forward foreign currency exchange sale contracts . . . 29,069 (e)Interest rate swaps . . . . . . . . . . . . . . . . . . . . . . . . . . . . 69,094 (f)Other swaps . . . . . . . . . . . . . . . . . . . . . . . . . . . . . . . . . 35,180 (f), (g)
(a) Represents average premiums paid for the period.(b) Represents average premiums received for the period.(c) Represents average unrealized gains/losses for the period.(d) Represents average value payable at trade date.(e) Represents average value at receivable at settlement date.(f) Represents notional value of holdings as of the end of the period.(g) Includes credit default, total return, inflation and variance swaps.
The following is a summary of the consolidated sponsored investment products’ derivative instruments as ofDecember 31, 2015. For financial reporting purposes, the Company does not offset derivative assets andderivative liabilities that are subject to netting arrangements in its Consolidated Balance Sheets.
Fair Value
Assets Liabilities
($ in thousands)
Futures contracts . . . . . . . . . . . . . . . . . . . . . . . . . . . . . . . . . . . $ 77 $ 128Forward foreign currency exchange contracts . . . . . . . . . . . . 388 287Swaps . . . . . . . . . . . . . . . . . . . . . . . . . . . . . . . . . . . . . . . . . . . 897 502Purchased options . . . . . . . . . . . . . . . . . . . . . . . . . . . . . . . . . . 2,071 63Purchased swaptions . . . . . . . . . . . . . . . . . . . . . . . . . . . . . . . . 803 —Written options . . . . . . . . . . . . . . . . . . . . . . . . . . . . . . . . . . . . — 654
Total derivative assets and liabilities in the ConsolidatedBalance Sheets . . . . . . . . . . . . . . . . . . . . . . . . . . . . . . . . . . 4,236 1,634
Derivatives not subject to a master netting agreement . . . . . . (978) (281)
Total assets and liabilities subject to a master nettingagreement . . . . . . . . . . . . . . . . . . . . . . . . . . . . . . . . . . . . . $3,258 $1,353
F-33

Virtus Investment Partners, Inc.
Notes to Consolidated Financial Statements—(Continued)
The following is a summary of the Company’s consolidated sponsored investment products’ assets andliabilities, net of amounts available for offset under a master netting arrangement and net of any related cashcollateral received:
As of December 31, 2015
Amount Subject to aMaster NettingArrangement
Derivatives Availablefor Offset
Collateral Pledged orReceived Net Amount
($ in thousands)
Derivative assets . . . . . $3,258 $(1,140) $(1,784) $334Derivative liabilities . . . 1,353 (1,140) (209) 4
The Company’s consolidated sponsored investment products have counterparty risk associated with thesederivative assets and liabilities. Multiple counterparties are utilized to mitigate this risk, and the maximumexposure to a single bank does not exceed 33.1% of the total derivative assets or 43.3% of the total derivativeliabilities.
The following is a summary of the net gains (losses) recognized in income by primary risk exposure:
Year Ended December 31,
2015
($ in thousands)
Interest rate contracts . . . . . . . . . . . . . . . . . . . . $ (80)Foreign currency exchange contracts . . . . . . . . 181Equity contracts . . . . . . . . . . . . . . . . . . . . . . . . . 312Commodity contracts . . . . . . . . . . . . . . . . . . . . 324Credit contracts . . . . . . . . . . . . . . . . . . . . . . . . . 8
Total . . . . . . . . . . . . . . . . . . . . . . . . . . . . . . . . . $745
Short Sales
Some of the Company’s consolidated sponsored investment products may engage in short sales, which aretransactions in which a security is sold, which is not owned or is owned but there is no intention to deliver, inanticipation that the price of the security will decline. Short sales are recorded in the Consolidated BalanceSheets within other liabilities of consolidated sponsored investment products.
Borrowings
One of the Company’s consolidated sponsored investment products employs leverage in the form of usingproceeds from short sales, which allows it to use its long positions as collateral in order to purchase additionalsecurities. The use of these proceeds from short sales is secured by the assets of the consolidated sponsoredinvestment product, which are held with the custodian in a separate account. This consolidated sponsoredinvestment product is permitted to borrow up to 33.33% of its total assets.
18. Consolidated Investment Product
During 2015, the Company contributed $40.0 million to a SPE that was created specifically to accumulatebank loan assets for securitization as a potential CLO that will be managed by its Newfleet affiliate. The SPE is aVIE and the Company consolidates the SPE’s assets and liabilities as a consolidated investment product withinits financial statements as it is the primary beneficiary of the VIE. The Company determined that it is the primary
F-34

Virtus Investment Partners, Inc.
Notes to Consolidated Financial Statements—(Continued)
beneficiary of the VIE as the Company has the power to direct the activities that most significantly impact theeconomic performance of th entity and has the obligation to absorb losses, or the rights to receive benefits from,the VIE that could potentially be significant to the VIE.
The following table presents the balances of the consolidated investment product that were reflected in theConsolidated Balance Sheet as of December 31, 2015. There was no consolidated investment product atDecember 31, 2014.
As of December 31,
2015
($ in thousands)
Total cash equivalents . . . . . . . . . . . . . . . . . . . . . . . . . $ 8,297Total investments . . . . . . . . . . . . . . . . . . . . . . . . . . . . 199,485Other assets . . . . . . . . . . . . . . . . . . . . . . . . . . . . . . . . . 1,467Debt . . . . . . . . . . . . . . . . . . . . . . . . . . . . . . . . . . . . . . . (152,597)Securities purchased payable . . . . . . . . . . . . . . . . . . . (18,487)
The Company’s net interests in the consolidatedinvestment product . . . . . . . . . . . . . . . . . . . . . . . . $ 38,165
Fair Value Measurements of Consolidated Investment Product
The assets and liabilities of the consolidated investment product measured at fair value on a recurring basisas of December 31, 2015 by fair value hierarchy level were as follows:
Level 1 Level 2 Level 3 Total
($ in thousands)
AssetsCash equivalents . . . . . . . . . . . . . . . . . . . . . . . . . . . . $8,297 $ — $— $ 8,297Bank loans . . . . . . . . . . . . . . . . . . . . . . . . . . . . . . . . — 199,485 — 199,485
Total Assets Measured at Fair Value . . . . . . $8,297 $199,485 $— $207,782
The following is a discussion of the valuation methodologies used for the assets and liabilities of theCompany’s consolidated investment product measured at fair value.
Cash equivalents represent investments in money market funds. Cash investments in actively traded moneymarket funds are valued using published net asset values and are classified as Level 1.
Bank loans represent the underlying debt securities held in the sponsored product which are consolidated bythe Company. Bank loan investments include debt securities, which are valued based on quotations received froman independent pricing service. Pricing services do not provide pricing for all securities, and therefore indicativebids from dealers are utilized, which are based on pricing models used by market makers in the security and arealso included within Level 2.
The estimated fair value of debt at December 31, 2015, which has a variable interest rate, approximates itscarrying value and is classified as Level 2. The securities purchase payable at December 31, 2015 approximatesfair value due to the short-term nature of the instruments.
F-35

Virtus Investment Partners, Inc.
Notes to Consolidated Financial Statements—(Continued)
Debt of Consolidated Investment Product
On August 17, 2015, the SPE, entered into a three-year term $160.0 million financing transaction with abank lending counterparty (the “Financing Facility”). The proceeds of the Financing Facility are intended to beused to purchase and warehouse commercial bank loan assets pending the securitization of such assets as aCLO. The size of the Financing Facility may be increased subject to the occurrence of certain events and themutual consent of the parties. The Financing Facility is secured by all the assets of the SPE and initially bearsinterest at a rate of three-month LIBOR plus 1.25% per annum (with such interest rate, upon completion of theinitial nine-month ramp-up period, increasing to three-month LIBOR plus 2.0% per annum). The FinancingFacility contains standard covenants and event of default provisions (including loan-to-value ratio triggers) andforeclosure remedies upon such default in favor of the lender thereunder. The $40.0 million the Companycontributed to the SPE serves as first loss protection for the bank lending counterparty under the FinancingFacility. In the event of default, the recourse to the Company is limited to its investment in the SPE. AtDecember 31, 2015 $152.6 million was outstanding under the Financing Facility.
19. Consolidation
As of December 31, 2015, 13 products were consolidated by the Company including, 12 consolidatedsponsored investment products and one consolidated investment product. As of December 31, 2014, 12 productswere consolidated by the Company, comprised entirely of sponsored investment products.
The following tables reflect the impact of the consolidated sponsored investment products and consolidatedinvestment product in the Consolidated Balance Sheets as of December 31, 2015 and December 31, 2014,respectively:
As of December 31, 2015Balance Before
Consolidation ofInvestment
Products
ConsolidatedSponsoredInvestment
Products
ConsolidatedInvestment
Products
Eliminationsand
Adjustments (a)
Balances asReported in
ConsolidatedBalance Sheet
($ in thousands)
Total cash . . . . . . . . . . . . . . . . . . . . . . $ 87,574 $ 11,866 $ 8,297 $ — $107,737Total investments . . . . . . . . . . . . . . . . 349,147 323,335 199,485 (292,409) 579,558All other assets . . . . . . . . . . . . . . . . . 162,673 8,549 1,467 (255) 172,434
Total assets . . . . . . . . . . . . . . . . . . . . $599,394 $343,750 $209,249 $(292,664) $859,729
Total liabilities . . . . . . . . . . . . . . . . . . $ 89,937 $ 15,642 $171,084 $ (255) $276,408Redeemable noncontrolling
interest . . . . . . . . . . . . . . . . . . . . . . — — — 73,864 73,864Equity attributable to stockholders of
the Company . . . . . . . . . . . . . . . . . 509,624 328,108 38,165 (366,273) 509,624Non-redeemable noncontrolling
interest . . . . . . . . . . . . . . . . . . . . . . (167) — — — (167)
Total liabilities and equity . . . . . . . $599,394 $343,750 $209,249 $(292,664) $859,729
F-36

Virtus Investment Partners, Inc.
Notes to Consolidated Financial Statements—(Continued)
As of December 31, 2014Balance Before
Consolidation ofInvestment
Products
ConsolidatedSponsoredInvestment
Products
ConsolidatedInvestment
Products
Eliminationsand
Adjustments (a)
Balances asReported in
ConsolidatedBalance Sheet
($ in thousands)
Total cash . . . . . . . . . . . . . . . . . . . . . . $202,847 $ 8,687 $— $ — $211,534Total investments . . . . . . . . . . . . . . . . 279,863 236,652 — (216,415) 300,100All other assets . . . . . . . . . . . . . . . . . 180,436 6,960 — (257) 187,139
Total assets . . . . . . . . . . . . . . . . . . . . $663,146 $252,299 $— $(216,672) $698,773
Total liabilities . . . . . . . . . . . . . . . . . $ 99,794 $ 12,813 $— $ (257) $112,350Redeemable noncontrolling
interest . . . . . . . . . . . . . . . . . . . . . . — — — 23,071 23,071Equity attributable to stockholders of
the Company . . . . . . . . . . . . . . . . . 563,542 239,486 — (239,486) 563,542Non-redeemable noncontrolling
interest . . . . . . . . . . . . . . . . . . . . . . (190) — — — (190)
Total liabilities and equity . . . . . . . $663,146 $252,299 $— $(216,672) $698,773
(a) Adjustments include the elimination of intercompany transactions between the Company, its consolidatedsponsored investment products and consolidated investment product, primarily the elimination of theinvestments, consolidated sponsored investment product equity, consolidated investment product equity andrecording of any noncontrolling interest.
The following table reflects the impact of the consolidated sponsored investment products in theConsolidated Statement of Operations for the years ended December 31, 2015, 2014 and 2013, respectively:
For the Year Ended December 31, 2015
Balance BeforeConsolidation of
InvestmentProducts
ConsolidatedSponsoredInvestment
Products
ConsolidatedInvestment
Products
Eliminationsand
Adjustments (a)
Balances asReported inConsolidatedStatement ofOperations
($ in thousands)
Total operating revenues . . . . . . . . . . $383,581 $ — $ — $ (1,604) $381,977Total operating expenses . . . . . . . . . . 297,465 5,738 — (1,604) 301,599
Operating income (loss) . . . . . . . . . . 86,116 (5,738) — — 80,378Total other non-operating expense . . . (14,214) (11,677) (1,832) 14,988 (12,735)
Income (loss) before income taxexpense . . . . . . . . . . . . . . . . . . . . . . 71,902 (17,415) (1,832) 14,988 67,643
Income tax expense . . . . . . . . . . . . . . 36,972 — — — 36,972
Net income (loss) . . . . . . . . . . . . . . . . 34,930 (17,415) (1,832) 14,988 30,671Noncontrolling interests . . . . . . . . . . . 176 — — 4,259 4,435
Net income (loss) attributable tocommon stockholders . . . . . . . . . . $ 35,106 $(17,415) $(1,832) $19,247 $ 35,106
F-37

Virtus Investment Partners, Inc.
Notes to Consolidated Financial Statements—(Continued)
For the Year Ended December 31, 2014
Balance BeforeConsolidation of
InvestmentProducts
ConsolidatedSponsoredInvestment
Products
ConsolidatedInvestment
Products
Eliminationsand
Adjustments (a)
Balances asReported inConsolidatedStatement ofOperations
($ in thousands)
Total operating revenues . . . . . . . . . . $451,259 $ — $— $ (661) $450,598Total operating expenses . . . . . . . . . . 316,840 3,699 — (661) 319,878
Operating income (loss) . . . . . . . . . . 134,419 (3,699) — — 130,720Total other non-operating income
(expense) . . . . . . . . . . . . . . . . . . . . . 2,502 2,619 — 473 5,594
Income (loss) before income taxexpense . . . . . . . . . . . . . . . . . . . . . . 136,921 (1,080) — 473 136,314
Income taxes . . . . . . . . . . . . . . . . . . . . 39,349 — — — 39,349
Net income (loss) . . . . . . . . . . . . . . . . 97,572 (1,080) — 473 96,965Noncontrolling interests . . . . . . . . . . . 128 — — 607 735
Net income (loss) attributable tocommon stockholders . . . . . . . . . . $ 97,700 $(1,080) $— $1,080 $ 97,700
For the Year Ended December 31, 2013
Balance BeforeConsolidation of
InvestmentProducts
ConsolidatedSponsoredInvestment
Products
ConsolidatedInvestment
Products
Eliminationsand
Adjustments (a)
Balances asReported inConsolidatedStatement ofOperations
($ in thousands)
Total operating revenues . . . . . . . . . . $389,202 $ — $— $ 13 $389,215Total operating expenses . . . . . . . . . . 274,913 785 — 13 275,711
Operating income (loss) . . . . . . . . . . 114,289 (785) — — 113,504Total other non-operating income . . . 5,620 6,098 — (3,314) 8,404
Income (loss) before income taxexpense . . . . . . . . . . . . . . . . . . . . . . 119,909 5,313 — (3,314) 121,908
Income tax expense . . . . . . . . . . . . . . 44,778 — — — 44,778
Net income (loss) . . . . . . . . . . . . . . . . 75,131 5,313 — (3,314) 77,130Noncontrolling interests . . . . . . . . . . . 59 — — (1,999) (1,940)
Net income (loss) attributable tocommon stockholders . . . . . . . . . . $ 75,190 $5,313 $— $(5,313) $ 75,190
(a) Adjustments include the elimination of intercompany transactions between the Company, its consolidatedsponsored investment products and consolidated investment product, primarily the elimination of theinvestments, consolidated sponsored investment product equity, consolidated investment product equity andrecording of any noncontrolling interest.
20. Subsequent Event
On February 17, 2016, the Company declared a quarterly cash dividend of $0.45 per common share to bepaid on May 13, 2016 to shareholders of record at the close of business on April 29, 2016.
F-38

Virtus Investment Partners, Inc.
Notes to Consolidated Financial Statements—(Continued)
21. Selected Quarterly Data (Unaudited)
2015
($ in thousands, except share data)FourthQuarter
ThirdQuarter
SecondQuarter
FirstQuarter
Revenues . . . . . . . . . . . . . . . . . . . . . . . . . . . . . . . . . . . . $86,115 $92,375 $99,656 $103,831Operating Income . . . . . . . . . . . . . . . . . . . . . . . . . . . . . 16,506 23,122 16,208 24,542Net Income (Loss) Attributable to Common
Stockholders . . . . . . . . . . . . . . . . . . . . . . . . . . . . . . . 6,636 (649) 9,777 19,342Earnings (loss) per share—Basic . . . . . . . . . . . . . . . . . $ 0.78 $ (0.07) $ 1.10 $ 2.16Earnings (loss) per share—Diluted . . . . . . . . . . . . . . . . $ 0.76 $ (0.07) $ 1.08 $ 2.11
2014
($ in thousands, except share data)FourthQuarter
ThirdQuarter (1)
SecondQuarter
FirstQuarter
Revenues . . . . . . . . . . . . . . . . . . . . . . . . . . . . . . . . . $112,137 $117,841 $112,749 $107,871Operating Income . . . . . . . . . . . . . . . . . . . . . . . . . . 36,665 38,927 22,502 32,626Net Income Attributable to Common
Stockholders . . . . . . . . . . . . . . . . . . . . . . . . . . . . 18,879 37,340 19,543 21,938Earnings per share—Basic . . . . . . . . . . . . . . . . . . . $ 2.09 $ 4.10 $ 2.14 $ 2.41Earnings per share—Diluted . . . . . . . . . . . . . . . . . $ 2.05 $ 4.02 $ 2.10 $ 2.34
(1) The third quarter of 2014 includes a net tax benefit of approximately $15.5 million due to completion of theaudit of the Company’s 2011 federal corporate income tax return.
F-39

[THIS PAGE INTENTIONALLY LEFT BLANK]

Exhibit 31.1
CERTIFICATION UNDER SECTION 302
I, George R. Aylward, certify that:
1. I have reviewed this annual report on Form 10-K of Virtus Investment Partners, Inc.;
2. Based on my knowledge, this report does not contain any untrue statement of a material fact or omitto state a material fact necessary to make the statements made, in light of the circumstances under whichsuch statements were made, not misleading with respect to the period covered by this report;
3. Based on my knowledge, the financial statements, and other financial information included in thisreport, fairly present in all material respects the financial condition, results of operations and cash flows ofthe registrant as of, and for, the periods presented in this report;
4. The registrant’s other certifying officer(s) and I are responsible for establishing and maintainingdisclosure controls and procedures (as defined in Exchange Act Rules 13a-15(e) and 15d-15(e)) and internalcontrol over financial reporting (as defined in Exchange Act Rules 13a-15(f) and 15d-15(f)) for theregistrant and have:
(a) Designed such disclosure controls and procedures, or caused such disclosure controls andprocedures to be designed under our supervision, to ensure that material information relating to theregistrant, including its consolidated subsidiaries, is made known to us by others within those entities,particularly during the period in which this report is being prepared;
(b) Designed such internal control over financial reporting, or caused such internal control overfinancial reporting to be designed under our supervision, to provide reasonable assurance regarding thereliability of financial reporting and the preparation of financial statements for external purposes inaccordance with generally accepted accounting principles;
(c) Evaluated the effectiveness of the registrant’s disclosure controls and procedures and presented inthis report our conclusions about the effectiveness of the disclosure controls and procedures, as of the end ofthe period covered by this report based on such evaluation; and
(d) Disclosed in this report any change in the registrant’s internal control over financial reporting thatoccurred during the registrant’s most recent fiscal quarter (the registrant’s fourth fiscal quarter in the case ofan annual report) that has materially affected, or is reasonably likely to materially affect, the registrant’sinternal control over financial reporting; and
5. The registrant’s other certifying officer(s) and I have disclosed, based on our most recent evaluationof internal control over financial reporting, to the registrant’s auditors and the audit committee of theregistrant’s board of directors (or persons performing the equivalent functions):
(a) All significant deficiencies and material weaknesses in the design or operation of internal controlover financial reporting which are reasonably likely to adversely affect the registrant’s ability to record,process, summarize and report financial information; and
(b) Any fraud, whether or not material, that involves management or other employees who have asignificant role in the registrant’s internal control over financial reporting.
Date: February 24, 2016
/S/ GEORGE R. AYLWARD
George R. AylwardPresident, Chief Executive Officer and Director
(Principal Executive Officer)

Exhibit 31.2
CERTIFICATION UNDER SECTION 302
I, Michael A. Angerthal, certify that:
1. I have reviewed this annual report on Form 10-K of Virtus Investment Partners, Inc.;
2. Based on my knowledge, this report does not contain any untrue statement of a material fact or omitto state a material fact necessary to make the statements made, in light of the circumstances under whichsuch statements were made, not misleading with respect to the period covered by this report;
3. Based on my knowledge, the financial statements, and other financial information included in thisreport, fairly present in all material respects the financial condition, results of operations and cash flows ofthe registrant as of, and for, the periods presented in this report;
4. The registrant’s other certifying officer(s) and I are responsible for establishing and maintainingdisclosure controls and procedures (as defined in Exchange Act Rules 13a-15(e) and 15d-15(e)) and internalcontrol over financial reporting (as defined in Exchange Act Rules 13a-15(f) and 15d-15(f)) for theregistrant and have:
(a) Designed such disclosure controls and procedures, or caused such disclosure controls andprocedures to be designed under our supervision, to ensure that material information relating to theregistrant, including its consolidated subsidiaries, is made known to us by others within those entities,particularly during the period in which this report is being prepared;
(b) Designed such internal control over financial reporting, or caused such internal control overfinancial reporting to be designed under our supervision, to provide reasonable assurance regarding thereliability of financial reporting and the preparation of financial statements for external purposes inaccordance with generally accepted accounting principles;
(c) Evaluated the effectiveness of the registrant’s disclosure controls and procedures and presented inthis report our conclusions about the effectiveness of the disclosure controls and procedures, as of the end ofthe period covered by this report based on such evaluation; and
(d) Disclosed in this report any change in the registrant’s internal control over financial reporting thatoccurred during the registrant’s most recent fiscal quarter (the registrant’s fourth fiscal quarter in the case ofan annual report) that has materially affected, or is reasonably likely to materially affect, the registrant’sinternal control over financial reporting; and
5. The registrant’s other certifying officer(s) and I have disclosed, based on our most recent evaluationof internal control over financial reporting, to the registrant’s auditors and the audit committee of theregistrant’s board of directors (or persons performing the equivalent functions):
(a) All significant deficiencies and material weaknesses in the design or operation of internal controlover financial reporting which are reasonably likely to adversely affect the registrant’s ability to record,process, summarize and report financial information; and
(b) Any fraud, whether or not material, that involves management or other employees who have asignificant role in the registrant’s internal control over financial reporting.
Date: February 24, 2016
/S/ MICHAEL A. ANGERTHAL
Michael A. AngerthalExecutive Vice President, Chief Financial Officer
(Principal Financial Officer and Principal Accounting Officer)

Exhibit 32.1
CERTIFICATIONS OF CEO AND CFO PURSUANT TO 18 U.S.C. SECTION 1350,AS ADOPTED PURSUANT TO
SECTION 906 OF THE SARBANES-OXLEY ACT OF 2002
In connection with this Annual Report on Form 10-K of Virtus Investment Partners, Inc. (the “Company”)for the fiscal year ended December 31, 2015, as filed with the Securities and Exchange Commission on the datehereof (the “Report”), each of the undersigned officers of the Company hereby certifies, pursuant to 18 U.S.C.Section 1350, as adopted pursuant to Section 906 of the Sarbanes-Oxley Act of 2002, that to the best of hisknowledge:
(1) the Report fully complies with the requirements of Section 13(a) or 15(d) of the Securities ExchangeAct of 1934; and
(2) the information contained in the Report fairly presents, in all material respects, the financial conditionand results of operations of the Company.
Dated: February 24, 2016
/S/ GEORGE R. AYLWARD
George R. AylwardPresident, Chief Executive Officer and Director
(Principal Executive Officer)
/S/ MICHAEL A. ANGERTHAL
Michael A. AngerthalExecutive Vice President, Chief Financial Officer
(Principal Financial Officer andPrincipal Accounting Officer)

[THIS PAGE INTENTIONALLY LEFT BLANK]

SUPPLEMENTAL FINANCIAL INFORMATION
Schedule of Non-GAAP Information
The company reports its financial results on a Generally Accepted Accounting Principles (GAAP) basis; howevermanagement believes that evaluating the company’s ongoing operating results may be enhanced if investors haveadditional non-GAAP financial measures. Management reviews non-GAAP financial measures to assess ongoingoperations and considers them only to be additional metrics for both management and investors to consider thecompany’s financial performance over time, as noted in the footnotes below. Management does not advocate thatinvestors consider such non-GAAP financial measures in isolation from, or as a substitute for, financial resultsprepared in accordance with GAAP.
Reconciliation of Revenues, Operating Expenses and Operating Income on a GAAP Basis to Revenues,Operating Expenses and Operating Income, as Adjusted
(Dollars in millions, except per share data)
Twelve Months Ended12/31/2015 12/31/2014
Non-GAAP Financial MeasuresRevenues, as adjusted . . . . . . . . . . . . . . . . . . . . . . . . . . . . . . . . . . . . . . . . . . . . . . . . . . . . . . . $295.0 $337.2Operating expenses, as adjusted . . . . . . . . . . . . . . . . . . . . . . . . . . . . . . . . . . . . . . . . . . . . . . . $186.7 $186.7Operating income, as adjusted . . . . . . . . . . . . . . . . . . . . . . . . . . . . . . . . . . . . . . . . . . . . . . . . $108.3 $150.5Operating margin, as adjusted . . . . . . . . . . . . . . . . . . . . . . . . . . . . . . . . . . . . . . . . . . . . . . . . 36.7% 44.6%Net income attributable to common stockholders, as adjusted . . . . . . . . . . . . . . . . . . . . . . . $ 67.8 $ 93.9Earnings per share – diluted, as adjusted . . . . . . . . . . . . . . . . . . . . . . . . . . . . . . . . . . . . . . . . $ 7.57 $10.10
U.S. GAAP Financial MeasuresRevenues . . . . . . . . . . . . . . . . . . . . . . . . . . . . . . . . . . . . . . . . . . . . . . . . . . . . . . . . . . . . . . . . $382.0 $450.6Operating expenses . . . . . . . . . . . . . . . . . . . . . . . . . . . . . . . . . . . . . . . . . . . . . . . . . . . . . . . . $301.6 $319.9Operating income . . . . . . . . . . . . . . . . . . . . . . . . . . . . . . . . . . . . . . . . . . . . . . . . . . . . . . . . . . $ 80.4 $130.7Operating margin . . . . . . . . . . . . . . . . . . . . . . . . . . . . . . . . . . . . . . . . . . . . . . . . . . . . . . . . . . 21.0% 29.0%Net income attributable to common stockholders . . . . . . . . . . . . . . . . . . . . . . . . . . . . . . . . . $ 35.1 $ 97.7Earnings per share – diluted . . . . . . . . . . . . . . . . . . . . . . . . . . . . . . . . . . . . . . . . . . . . . . . . . . $ 3.92 $10.51
The non-GAAP financial measures included in this appendix differ from financial measures determined inaccordance with U.S. GAAP as a result of the reclassification of certain income statement items, as well as theadjustment of certain expenses and other items that are not reflective of the earnings generated from providinginvestment management and related services. Non-GAAP financial measures have material limitations andshould not be viewed in isolation or as a substitute for U.S. GAAP measures.
In particular, the company reclassifies:
1. Distribution and other asset-based expenses – These costs are generally passed directly through toexternal parties. Management believes that making this adjustment aids in comparing the company’soperating results with other asset management firms that do not distribute products throughintermediary distribution partners or utilize third party service providers for investment managementrelated services.
2. Consolidated investment products – Management believes that excluding the operating activities ofmajority-owned funds and CLOs to reflect revenues and expenses of the company prior to theconsolidation of these products is consistent with the approach of reflecting its operating results as onlyrevenues generated and expenses incurred related to providing investment management and relatedservices will be included in operating income, as adjusted.
S-1

Net income attributable to common stockholders, as adjusted, excludes from net income:
• Closed-end fund launch costs – Expenses related to the launch of closed-end funds, or similar products,including structuring fees and sales-based compensation related to the launch. The timing of closed-endfund issuances can be unpredictable, and related costs can fluctuate considerably. In addition, revenueassociated with these costs will not fully impact financial results until future periods. Managementbelieves that making these adjustments aids in comparing the company’s operating results with priorperiods and with other asset management firms that do not issue closed-end funds, or similar products.
• Amortization of intangible assets – Non-cash amortization expense or impairment expense, if any,attributable to acquisition-related intangible assets. Management believes that making this adjustmentaids in comparing the company’s operating results with other asset management firms that have notengaged in acquisitions.
• Seed capital and CLO investments – Gains and losses (realized and unrealized), dividends and interestincome generated by seed capital and CLO investments. Earnings or losses generated by investments inseed capital products can vary significantly from period-to-period and do not reflect the company’soperating results from providing investment management and related services. Management believesthat making this adjustment aids in comparing the company’s operating results with prior periods andwith other asset management firms that do not have meaningful seed capital and CLO investments.
• Other – Certain expenses and losses related to restructuring, severance, regulatory matters, andtransition items that are not reflective of the ongoing earnings generation of the business. In addition,income tax expense/(benefit) items, such as adjustments for uncertain tax positions, valuationallowances and other unusual items not related to current operating results to reflect a normalizedeffective rate. Management believes that making these adjustments aids in comparing the company’soperating results with prior periods.
Revenues, as adjusted, comprise the fee revenues paid by clients for investment management and relatedservices. Revenues, as adjusted, for purposes of calculating net income attributable to common stockholders, asadjusted, differ from U.S. GAAP revenues in that they are reduced by distribution and other asset-based expensesthat are generally passed through to external parties, and exclude the impact of consolidated sponsoredinvestment products.
Operating expenses, as adjusted, is calculated to reflect expenses from ongoing continuing operationsattributable to stockholders. Operating expenses, as adjusted, for purposes of calculating net income attributableto common stockholders, as adjusted, differ from U.S. GAAP expenses in that they exclude amortization orimpairment, if any, of intangible assets, restructuring and severance, the impact of consolidated sponsoredinvestment products, and certain other expenses that do not reflect the ongoing earnings generation of thebusiness.
Operating margin, as adjusted, is a metric used to evaluate efficiency represented by operating income, asadjusted, divided by revenues, as adjusted.
Earnings per share, as adjusted, represent net income attributable to common stockholders, as adjusted, dividedby weighted average shares outstanding, on either a basic or diluted basis.
S-2

Additional Information Regarding Investment Performance Ratings
For the period ending December 31, 2015, 88%, 91% and 96% of assets eligible for Morningstar rating had 5-, 4- or 3-star load-waived ratings for the 3-, 5-, and 10-year periods, respectively, based on risk adjusted returns of a total of 39,31, and 22 funds, respectively. Had sales load been included, results would be lower. For each fund with at least athree-year history, Morningstar calculates a Morningstar RatingTM based on a Morningstar Risk-Adjusted Returnmeasure that accounts for variation in a fund’s monthly performance (including the effect of sales charges, loads, andredemption fees), placing more emphasis on downward variation and rewarding consistent performance. The top 10%of funds in each category receive 5 stars, the next 22.5% receive 4 stars, the next 35% receive 3 stars, the next 22.5%receive 2 stars and the bottom 10% receive 1 star. The Overall Morningstar RatingTM for a fund is derived from aweighted average of performance figures associated with its three-, five- and ten- year (if applicable) MorningstarRating metrics. Ratings are for class shares indicated only; other share classes bear different fees and expenses, whichaffect performance. Load-waived star ratings do not include any front-end sales load and are intended for thoseinvestors who have access to such terms (e.g., for plan participants of a defined contribution plan).
Additional Information on Virtus Funds rated by Morningstar as of 12/31/15 (Class A Shares):
Description
Overall(WithLoad)
Overall(Without
Load)
3 yr.(WithLoad)
3 yr.(Without
Load)
5 yr.(WithLoad)
5 Yr.(Without
Load)
10 yr.(WithLoad)
10 yr.(Without
Load)
Number of 3/4/5 Star Funds 28 30 27 27 23 25 12 15
Percentage of Assets 88% 90% 88% 88% 88% 91% 92% 96%
Number of 4/5 Star Funds 17 19 14 14 16 17 8 9
Percentage of Assets 78% 79% 71% 71% 79% 80% 83% 84%
Total Funds 39 39 39 39 31 31 22 22
Morningstar Data as of 12/31/2015 (Class I Shares)
Overall Rating Three-Year Ratiing Five-Year Rating Ten-Year Rating
Fund Name Category StarsRanking/Funds
in Category StarsRanking/Funds
in Category StarsRanking/Funds
in Category StarsRanking/Funds
in Category
Emerging Markets Opportunities Diversified Emerging Mkts 5 123/840 4 136/578 5 4/386 5 2/172
Global Real Estate Securities Global Real Estate 5 20/250 5 1/191 5 1/160 NR NR
Low Duration Income Short-Term Bond 5 14/559 5 31/493 5 20/406 5 23/278
Mid-Cap Core Mid-Cap Growth 5 144/733 4 161/644 5 53/577 NR NR
Multi-Sector Short Term Bond Short-Term Bond 5 159/559 4 58/493 5 6/406 NR NR
Small-Cap Sustainable Growth Small Growth 5 102/730 4 172/660 5 2/588 NR NR
Lipper ranks the fund based on the total return as of 12/31/15. Each fund is ranked within a universe of funds similar inportfolio characteristics and capitalization. Rankings do not include the effect of a fund’s sales load, if applicable.Lipper ranking is for Class I shares only, other classes may have different performance characteristics. Lipper, Inc. is anationally recognized organization that ranks the performance of mutual funds. Strong ratings are not indicative ofpositive fund performance. Absolute performance for some funds was negative. For complete investment performance,please visit www.Virtus.com.
Data quoted represents past performance. Past performance is no guarantee of future results. Currentperformance may be lower or higher than the performance data quoted. Investing involves risk, including the possibleloss of principal. The value of your investment will fluctuate over time and you may gain or lose money. Consider therisks of investing in equity securities, foreign and emerging markets, derivatives, banks loans, high yield-high riskfixed income securities, concentrated sectors, and/or master limited partnerships, which apply to one or more of thefunds mentioned.
Please carefully consider a Fund’s investment objectives, risks, charges, and expenses before investing. For thisand other information about the Virtus Mutual Funds, call 1-800-243-4361 or visit www.Virtus.com for aprospectus. Read it carefully before you invest or send money.
S-3

Virtus Mutual Funds are distributed by VP Distributors, LLC, member, FINRA and subsidiary of VirtusInvestment Partners, Inc.
Virtus ETFs are distributed by ETF Distributors, LLC, member, FINRA and subsidiary of Virtus InvestmentPartners, Inc.
Companies in the Composite of Other Publicly Traded Traditional Asset Management Companies
Affiliated Managers Group, Inc.; AllianceBernstein Holding L.P.; Artisan Partners Asset Management Inc.;Calamos Asset Management, Inc.; Cohen & Steers, Inc.; Eaton Vance Corp.; Federated Investors, Inc.; FranklinResources, Inc.; GAMCO Investors, Inc.; Invesco Ltd.; Janus Capital Group Inc.; Legg Mason, Inc.; Manning &Napier, Inc.; OM Asset Management plc, T. Rowe Price Group, Inc.; and Waddell & Reed Financial, Inc.
S-4

[THIS PAGE INTENTIONALLY LEFT BLANK]

[THIS PAGE INTENTIONALLY LEFT BLANK]

2015 ANNUAL REPORT
C O M B I N E D C A P A B I L I T I E S
VIR
TU
S IN
VE
ST
ME
NT
PA
RT
NE
RS
| 20
15
AN
NU
AL
RE
PO
RT