Virtual University of Pakistan - · PDF fileVirtual University of Pakistan. www ... Billion as...
44
Virtual University of Pakistan Evaluation Sheet for Project Spring 2011 FIN619: Final Project (Finance) Credit Hours:3 Student’s Name: Wasif Pervaiz Dar Student’s ID: mc090403897 Evaluation Criteria Result Proposal Valid Final Project Pass Written Work Status Pass Presentation & Viva Voce Final Result
-
Upload
dinhkhuong -
Category
Documents
-
view
217 -
download
2
Transcript of Virtual University of Pakistan - · PDF fileVirtual University of Pakistan. www ... Billion as...
Virtual University of Pakistan
Evaluation Sheet for Project
Spring 2011
FIN619: Final Project (Finance) Credit Hours:3
Student’s Name: Wasif Pervaiz Dar
Student’s ID: mc090403897
Evaluation Criteria Result
Proposal Valid
Final Project Pass
Written Work Status Pass
Presentation & Viva Voce
Final Result

Good Attempt
Some deficiencies in your project work have been highlighted along with guidelines
You are going to give permission to prepare presentation with this condition that you
present improved work in your presentation & viva voce as per given instructions
Start preparing for presentation & viva voce and improve
your work. Also read lesson # 7 of this course
Your conclusion & recommendations must be strong as
panel will not be lenient at these sections
www.vuzs.net 1
Following guidelines will help you out during presentation in
order to defend your work by delivering effective analysis of
ratios
Subject: Guidelines for Interpretation of Ratios The following guidelines will help you to understand what
interpretation means and how it should be done.
What does interpretation of ratios mean? Interpretation means explanation of the ratios results. It
does not mean definition of ratios rather it should enable the readers to understand what the calculated ratio indicates
and what the trend for that particular ratio is. It should cover four steps:
Step # 1) Result understanding: i.e. what does the answer derived from ratio calculation indicates? You have to critically
analyze the result of calculated ratio by explaining the
relationship of numerator with that of a denominator.
Step #2) Trend Analysis: i.e. what are the variations in a company’s ratio results i.e. the trend for the same company
and the reasons for that change in trend? All three selected companies should be analyzed in this way.
Step #3) Comparison: i.e. among the three selected companies which company is leading/ taking edge and why?
Step #4) Bench mark (if applicable): i.e. the comparison of
ratio with the benchmark/rule of thumb/standard of that ratio
in that particular industry (as these standards vary according to the type of industry selected for analysis e.g. Manufacturing,
Banking, FMCG companies, etc). Also give reasoning of deviation from that standard.
You have to strictly interpret the calculated ratios in the way
described above step wise.

www.vuzs.net 2
Final Project
Activity Ratio Analysis of Fauji Fertilizer Co. Limited, Fauji
Fertilizer Bin Qasim Limited and Dawood Hercules Limited
in Fertilizer Sector for FY 2008-2010
A REPORT
SUBMITTED TO THE DEPARTMENT OF MANAGEMENT SCIENCES,
VIRTUAL UNIVERSITY OF PAKISTAN
IN PARTIAL FULFILLMENT OF THE REQUIREMENTS FOR
THE DEGREE OF MASTER IN BUSINESS ADMINISTRATION
Submitted By
mc090403897
Wasif Pervaiz Dar
Virtual University of Pakistan
Department of Management Sciences,
Virtual University of Pakistan

www.vuzs.net 3
www.vuzs.net 4
DEDICATION
I would like to dedicate this project to my parents, my elder brother and my cousin
Wasim Zafar Dar who have supported me during the journey of my MBA studies and
whose encouragement has enabled me to submit this project.
I also dedicate it to my wife that is a great source of encouragement and motivation for
me.

www.vuzs.net 5
ACKNOWLEDGEMENT
IN THE NAME OF ALLAH, THE MOST MERCIFUL, THE MOST KIND
Firstly I am very thankful and obliged to my GOD. GOD blessing me a lot and give
me the strength, hope and cool calm temperament that keep me alive my thinking and
my motivation to complete the project in a very short and tight period of time. Without
my ALLAH blessing it is not possible for me to complete this project in time. I am
very thankful to my ALLAH.
I would also like express my sincere and deep thankfulness to my parents, brother, my
cousin, my internet fellows and Google.com as well. They all are support me a lot in
moral sense and technical aspects as well. My parents, brother and my cousin keep
motivating me. My internet class fellow and Google.com support, guide and help me
in technical grounds.
Further, I would also like to mention and express my very special gratitude to my wife
who keep motivating me, boost my morale, give me the confidence and pray for me
for the in time completion of this project.
www.vuzs.net 6
EXECUTIVE SUMMARY
This Project is about to conduct Activity ratio analysis of the three companies listed in
the country stock exchange in a similar sector. The sector from which the sample of
three companies are taken is a fertilizer sector and the companies that will under study
in this project of activity ratio analysis for the financial period of 2008, 2009 and 2010
are the followings
1. DAWOOD HERCULES LTD.
2. FAUJI FERTILIZER CO. LTD.
3. FAUJI FERTILIZER BIN QASIM LTD.
The main objective of the project is to analyze the activity position of the selected
companies and to know about the fact that which company is effectively managing
and utilize its assets. The project analysis is being done as a compulsory requirement
of MBA – Finance and also for the stakeholders, general readers and students as well.
Project analysis is planned and designed in a tabular and graphical form supported
with necessary working and the interpretation. Different sites, books and articles are
consulted to complete this project; references are mentioned at the end of this project
under the heading of Bibliography.

www.vuzs.net 7
Table of contents
Letter of Undertaking
Dedication
Acknowledgement
Executive Summary
1 - Chapter 1 – Introduction ------------------------------------------- 6
1 – Introduction of the Project -------------------------------- 6
– Companies‟ Introduction ----------------------------------- 6
– Fauji Fertilizer Co. Ltd. ------------------------------ 6
– Fauji Fertilizer Bin Qasim Ltd. --------------------- 8
– Dawood Hercules Ltd. -- ---------------------------- 9
1.1 – Financial Period ------------------------------------------ 11
1.3 – Objectives --------------------------------------------------11
1.4 – Significance ------------------------------------------------12
2 – Chapter 2 – Data Processing & Analysis-----------------------13
2.1 – Data Collection Sources --------------------------------- 13
2.1.1 – Primary Sources ------------------------------- 13
2.1.2 – Secondary Sources -----------------------------13
2.2 – Data Processing & Analysis -----------------------------13
3 – Chapter 3 – Data Analysis------------------------------------------14
4 – Chapter 4 - Bibliography ------------------------------------------36

www.vuzs.net 8
CHAPTER – 1
INTRODUCTION
1 – Introduction of the Project:
Pakistan‟s economy is an agricultural based and its importance is well established in
the country. It plays an important and vital role in the growth of the economy, its
activity, generating revenues/foreign exchange and in the development of the
industrial sector of the country. It provides raw material to the industrial sector of the
country like sugar, cotton, textile, foods, jute, tobacco and other industries and
regarded as a backbone of the Pakistan‟s economic activity. It is contributed almost
21% of the Pakistan‟s GDP and employs about 41% of the total labor force.
Fertilizers have played an important role in the growth and development of the
agricultural sector especially to meet the growing demand of the food and to achieve
the self sufficiency level. Keeping the importance of fertilizer sector in my mind, I
have choose fertilizer sector from which top 3 listed companies have been selected for
my project of Activity Ratio Analysis and these companies are
Fauji Fertilizer Co. Ltd.
Fauji Fertilizer Bin Qasim Limited
Dawood Hercules Chemical Limited
Now, I would like to briefly introduce the selected companies and their business
activities
FAUJI FERTILIZER CO. LTD.
Fauji Fertilizer Company Limited (FFC) is Pakistan's leading urea manufacturing
company with over 60% market share. It is principally engaged in the production,
purchasing, and marketing of fertilizers and chemicals. It offers ammonia/urea under

www.vuzs.net 9
the brand name „Sona‟, as well as nitrogen, phosphate, and potash based fertilizers
with a vision to acquire self - sufficiency in fertilizer production in the country, FFC
was incorporated in 1978 as a private limited company. This was a joint venture
between Fauji Foundation (a leading charitable trust in Pakistan) and Haldor Topsoe
A/S of Denmark.
The initial share capital of
the company was 813.9
Million Rupees. The
present share capital of the
company stands above Rs.
8.48 Billion. Additionally,
FFC has more than Rs. 8.3
Billion as long term investments which include stakes in the subsidiaries FFBL,
FFCEL and associate FCCL.
VISION STATEMENT
FFC's vision for the 21st Century remains focused on harmonizing the Company with
fresh challenges and encompasses diversification and embarking on ventures within
and beyond the territorial limits of the Country in collaboration with leading business
partners.
MISSION STATEMENT
FFC is committed to play its leading role in industrial and agricultural advancement in
Pakistan by providing quality fertilizers and allied services to its customers and given
the passion to excel, take on fresh challenges, set new goals and take initiatives for
development of profitable business ventures.

www.vuzs.net 10
FAUJI FERTILIZER BIN QASIM LTD.
Fauji Fertilizer Bin Qasim Limited Plant site is a modern Granular Urea and Di-
Ammonium Phosphate (DAP) fertilizers manufacturing complex, built at a cost of
US$ 468 Million and located in Eastern Zone of Bin Qasim, Karachi, with Head
Office at Harley Street, Rawalpindi.
Initially named as FFC-Jordan Fertilizer Company (FJFC), wef 17th Nov 1993, with
FFC (30%), FF (10%) and JPMC (10%) as main sponsors. The company was formally
listed with stock
exchanges in
May 1996 and
commercial
production
commenced
w.e.f. Jan 2000.
However, it
continued to run
in crises due to technical, financial and managerial reasons till 2001. DAP Plant
brought to suspension in 2001 due to accumulated loss of Rs. 6.5 Billion. It resumed
production in Sep 2003, after a lapse of 2 years.
Renamed as Fauji Fertilizer Bin Qasim Ltd. (FFBL) in 2003, as such Jordan
Phosphate Mines Co. (JPMC) had sold its entire equity in the company. Accordingly
Phosphoric acid supply agreement with Jordan was terminated. The company turned
out to be profitable after 3 years i.e, by 2004 and declared 'maiden dividend' in 2004.
Profitability has constantly been on the rise since then and 2007 has been the most
profitable year of the company. One of the milestones in the success of FFBL is its

www.vuzs.net 11
accreditation of ISO certification, which was achieved in Mar 2006 for both the Head
Office and Plant site
VISION STATEMENT
To be a premier organization focused on quality and growth, leading to enhanced
stakeholders value.
MISSION STATEMENT
FFBL is committed to remain amongst the best companies by maintaining the spirit of
excellence through sustained growth rate in all activities, competitive price, quality
fertilizer and providing safe and conducive working environment for the employees.
DAWOOD HERCULES CHEMICALS LIMITED
Dawood Hercules Chemicals Limited was incorporated as a public limited company
on 17th
April 1968, as a joint venture between Dawood Group of Industries and
Hercules Inc. USA. It
was the first private
sector venture in
Pakistan to receive a
loan from the World
Bank and was the
largest ammonia/urea
plant in country at that
time. Initially the
plant's capacity was
345,000 metric tons of
urea per annum. The plant was revamped in 1989 / 1991 to enhance the capacity to

www.vuzs.net 12
445,500 metric tons of urea per annum. Also, it made the manufacturing facilities
more energy efficient and environment friendly. In recent years, Dawood Hercules has
made a colossal investment to incorporate the latest technology; the most significant
are the construction of new Prilling tower in a record time; the tallest industrial
structure in Pakistan, replacement of Primary Waste Heat Exchanger, Primary
Reformer Harps Assemblies and conventional instrumentation (with Distributed
Control System).
VISION STATEMENT
To excel in the fertilizer and allied business at national and international level by
maintaining highest standards of product quality thereby playing our role in the
development of the country's economy and adding value to the shareholders'
investment.
MISSION STATEMENT
To offer consistent dividends to the shareholders.
To chalk out a plan to improve production techniques and quality standards.
To provide career grooming opportunities to the talented professionals.
To become a good corporate citizen.
To develop long-term relationship with the employees.
To create high performing Organizational Environment in which ideas are generated
and nurtured.
To inculcate honest and ethical behavior.
To create safe, healthy environment and friendly atmosphere for the employees.
To improve quality of life for the employees.
To make the farmer community prosper.
www.vuzs.net 13
1.1 – Financial Period Under-Consideration for Analysis
Following financial periods are considered and under-consideration for the Project
Analysis.
2008
2009
2010
1.2 – Objectives
Ratio analysis is an integral part of the financial statement analysis and it is most
widely and powerful tool used to analyze the companies financial statements. The
main objective of ratio analysis is to deeply analyze the information provided in the
financial statements and present meaningful results in terms of liquidity, solvency,
activity and profitability of the company in a relative form.
Here in this project, I will just remain focus and limit my research to the extent of the
Activity ratio which is used to asses, how quickly a company turnover their assets into
sales or cash. Companies are invested their capital in various assets to generate
revenues and earn incomes and those managed their assets smartly usually achieve
larger amount of sales and profits as well.
Hence, the main objective of the project is to facilitate all the stakeholders especially
the investors and bankers to evaluate the three listed companies‟ ability that how
effectively and efficiently they manage their operations and resources/assets and to
know the activity position of the selected companies. This Project will also state the
reasons that why the companies are able and not able to manage their assets
effectively. The Project will also enable the investors and the other stakeholders to
www.vuzs.net 14
make the decision that which one is better to invest, safe and having great potential to
grow as compared to the rest of the two companies in a similar sector.
1.3 – Significance
The project will provide very significant, rich and valuable information for all the
stakeholders, financial analysts and the students as well. Study of the project will
become enable to identify the companies‟ past and current performance with respect to
the management of their resources and further will lead them to paint the future
growth of the selected companies on the bases of the facts, figures and analysis
provided in the project within the limit of activity ratio.
This project will give them solid analysis in a graphical and tabular form with an
interpretation and conclusion drawn on bases of facts and figures and allow them to
take decision that which company is better to invest and less riskier as compared to the
other two selected companies in a fertilizer sector.

www.vuzs.net 15
CHAPTER – 2
DATA PROCESSING & ANALYSIS
2.1 – Data Collection Sources
2.1.1 – Primary Sources
This project is based upon the secondary sources of data and logic is that annual
reports or companies‟ statements are treated as secondary source of data and the whole
project is based on companies‟ annual reports and financial statements.
2.1.2 – Secondary Sources
Companies‟ annual accounts report and their official sites has been consulted and used
as a secondary source to collect the basic and necessary information like financial
statements, company profile, introduction, business activity, and their vision and
mission statements.
Articles, books, stock exchange, brokers and different sites has also been considered
as secondary source available on the internet or in a physical form to collect the raw
data and information as much as possible on the topic selected in order to get a nice
and comprehensive shape of the project.
2.2 – Data Processing & Analysis
Following tools and softwares will be used to process the raw data and then analyze it
properly in a given format.
MS Word
MS Excel
www.vuzs.net 16
Calculators
Financial Reports
CHAPTER – 3
DATA ANALYSIS
This Project is about to perform ACTIVITY RATIO ANAYLYSIS of the selected
companies for the financial year 2008, 2009 and 2010.
Following ratios are calculated to complete the Project Analysis.
Accounts Receivable Turnover
Average Collection Period
Accounts Payable Turnover
Average Payment Period
Inventory Turnover
Average Age of Inventory
Total Assets Turnover
Fixed Assets Turnover
Operating Cycle
Formatted: Highlight
Formatted: After: -0.01"

www.vuzs.net 17
ACCOUNTS RECEIVABLE TURNOVER
Accounts receivables turnover ratio is used to measure the efficiency of the company
in extending credit to their clients as well as the collection of debts from them.
Account receivables turnover ratio is an activity ratio and is used to measure, how
efficiently a company uses their debtor accounts.
Formula
Accounts Receivable Turnover = receivableaccountsAverage
salescreditnetAnnual
Tabular Representation
Company Name Year 2008 Year 2009 Year 2010
DAWH
7,428,702,879 /
6,781,875 =
1095.38
11,040,361,936 /
9,424,788 =
1171.41
8,715,711 /
6,080 =
1433.51
FFBL
26,820,812 /
264,603 =
101.36
36,724,920 /
381,091 =
96.37
43,256,712 /
653,357 =
66.21
FFC
30,592,806 /
1,109,266 =
27.58
36,163,174 /
376,408 =
96.07
44,874,359 /
307,421 =
145.97
WORKING
Average Accounts Receivables = (Opening Accounts Receivables + Closing Accounts
Receivables)/2
DAWH
2008 - Average Accounts Receivables = (4,742,483 + 8,821,267)/2 = 6,781,875
2009 - Average Accounts Receivables = (8,821,267 + 10,028,308)/2 = 9,424,788
2010 - Average Accounts Receivables = (10,028 + 2,131)/2 = 6,080
FFBL
2008 - Average Accounts Receivables = (243,751 + 285,454)/2 = 264,603
2009 - Average Accounts Receivables = (285,454 + 476,728)/2 = 381,091
2010 - Average Accounts Receivables = (476,728 + 829,985)/2 = 653,357
Formatted: Highlight
Comment [a1]: Why you have used rounded off
data here. Use the data given in balance sheet e.g. in
2009 figure is 10,028,308 but here you mentioned
only 10,028 similarly use appropriate figure of the
year 2010
www.vuzs.net 18
FFC
2008 - Average Accounts Receivables = (1,722,602 + 495,929)/2 = 1,109,266
2009 - Average Accounts Receivables = (495,929 + 256,886)/2 = 376,408
2010 - Average Accounts Receivables = (256,886 + 357,956)/2 = 307,421
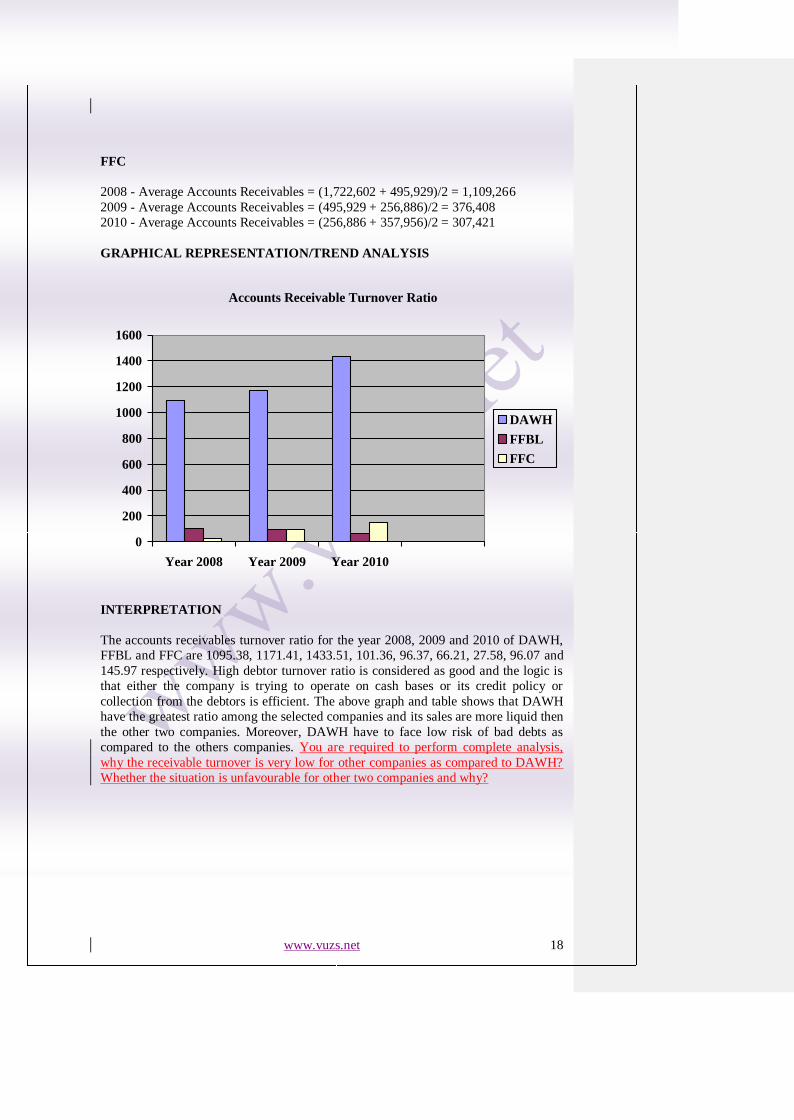
GRAPHICAL REPRESENTATION/TREND ANALYSIS
Accounts Receivable Turnover Ratio
0
200
400
600
800
1000
1200
1400
1600
Year 2008 Year 2009 Year 2010
DAWH
FFBL
FFC
INTERPRETATION
The accounts receivables turnover ratio for the year 2008, 2009 and 2010 of DAWH,
FFBL and FFC are 1095.38, 1171.41, 1433.51, 101.36, 96.37, 66.21, 27.58, 96.07 and
145.97 respectively. High debtor turnover ratio is considered as good and the logic is
that either the company is trying to operate on cash bases or its credit policy or
collection from the debtors is efficient. The above graph and table shows that DAWH
have the greatest ratio among the selected companies and its sales are more liquid then
the other two companies. Moreover, DAWH have to face low risk of bad debts as
compared to the others companies. You are required to perform complete analysis,
why the receivable turnover is very low for other companies as compared to DAWH?
Whether the situation is unfavourable for other two companies and why?

www.vuzs.net 19
AVERAGE COLLECTION PERIOD
Average collection period ratio is used to determine the average number of days
required to convert account receivables/debtors into cash.
Formula
Average Collection Period = TurnoverReceivableAccounts
365
Tabular Representation
Why you did not mention the unit here
Gave you some examples below. So properly mention the result for each year
along with proper unit
Company Name Year 2008 Year 2009 Year 2010
DAWH
365 /
1095.38 =
0.33 days
365 /
1171.41 =
0.31
365 /
1433.51 =
0.25
FFBL
365 /
101.36 =
3.60
365 /
96.37 =
3.79
365 /
66.21 =
5.51
FFC
365 /
27.58 =
13.23
approximately 13
days
365 /
96.07 =
3.78
Approx. 8 days
365 /
145.97 =
2.50
Approx 2 days
WORKING
There is no need of working.
www.vuzs.net 20
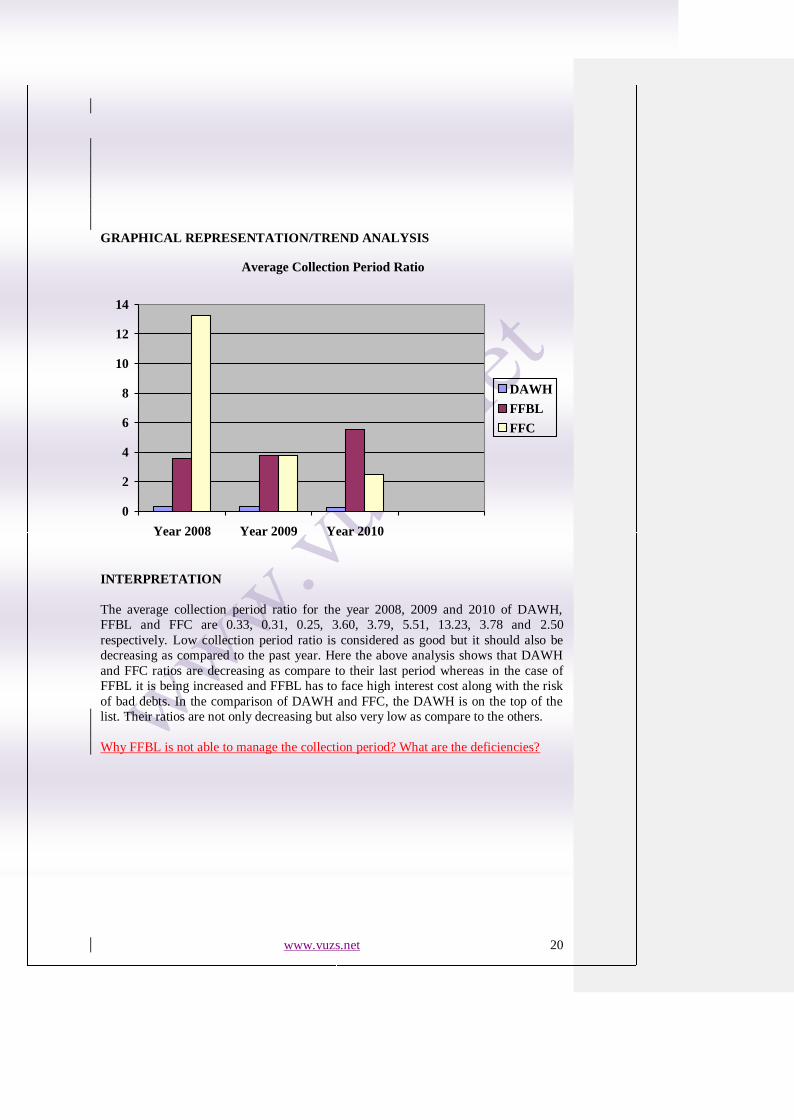
GRAPHICAL REPRESENTATION/TREND ANALYSIS
Average Collection Period Ratio
0
2
4
6
8
10
12
14
Year 2008 Year 2009 Year 2010
DAWH
FFBL
FFC
INTERPRETATION
The average collection period ratio for the year 2008, 2009 and 2010 of DAWH,
FFBL and FFC are 0.33, 0.31, 0.25, 3.60, 3.79, 5.51, 13.23, 3.78 and 2.50
respectively. Low collection period ratio is considered as good but it should also be
decreasing as compared to the past year. Here the above analysis shows that DAWH
and FFC ratios are decreasing as compare to their last period whereas in the case of
FFBL it is being increased and FFBL has to face high interest cost along with the risk
of bad debts. In the comparison of DAWH and FFC, the DAWH is on the top of the
list. Their ratios are not only decreasing but also very low as compare to the others.
Why FFBL is not able to manage the collection period? What are the deficiencies?

www.vuzs.net 21
ACCOUNTS PAYABLES TURNOVER RATIO
Accounts payables turnover ratio is used to measure the rate of credit period that the
company enjoys from their suppliers. Account payable turnover ratio is an activity
ratio and is used to measure, how well a company uses its creditor accounts.
Formula
Accounts Payables Turnover = payableaccountsAverage
PurchaseCredit
Tabular Representation
Mention properly the unit of ratio
Company Name Year 2008 Year 2009 Year 2010
DAWH
2,352,484,270 /
124,972,969 =
18.82
4,802,826,560 /
159,686,708 =
30.08
2,794,454 /
231,222 =
12.09
FFBL 34,788,687 / 16,950,151 / 23,578,057 /
www.vuzs.net 22
2,809,964 =
12.38
3,760,182 =
4.51
3,472,212 =
6.79
FFC
8,451,947 /
371,131 =
22.77
8,755,051 /
374,484 =
23.38
11,772,979 /
424,263 =
27.75
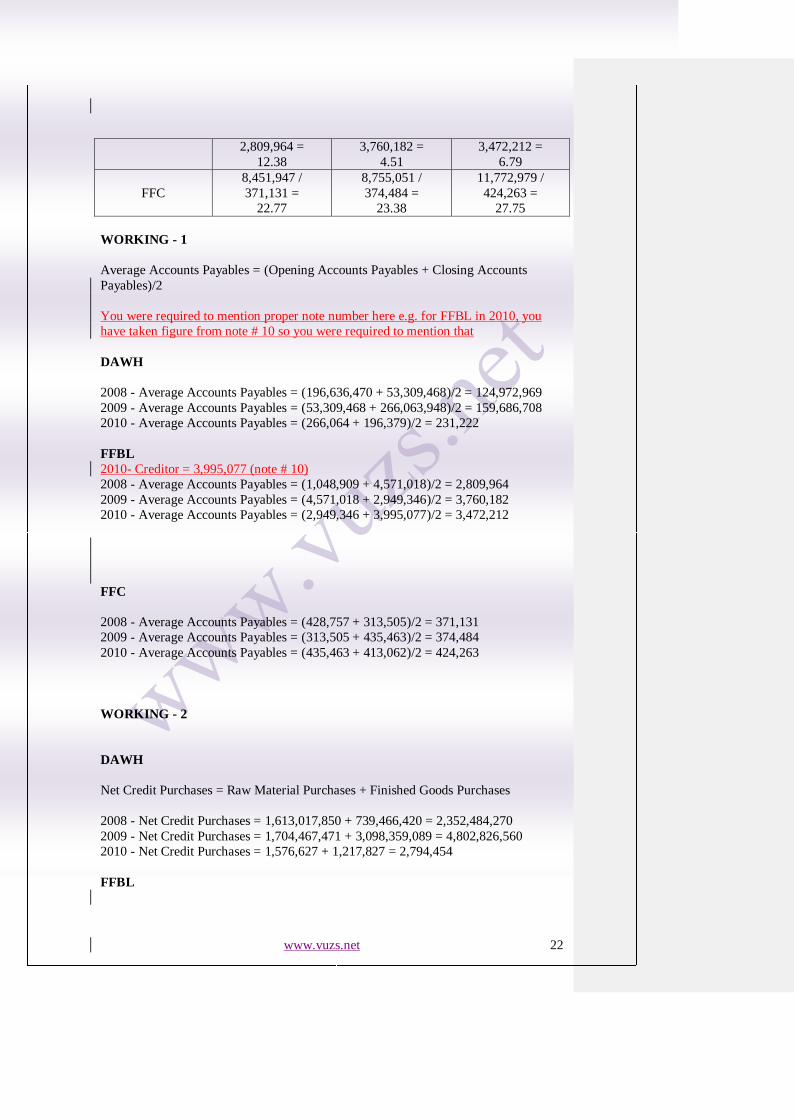
WORKING - 1
Average Accounts Payables = (Opening Accounts Payables + Closing Accounts
Payables)/2
You were required to mention proper note number here e.g. for FFBL in 2010, you
have taken figure from note # 10 so you were required to mention that
DAWH
2008 - Average Accounts Payables = (196,636,470 + 53,309,468)/2 = 124,972,969
2009 - Average Accounts Payables = (53,309,468 + 266,063,948)/2 = 159,686,708
2010 - Average Accounts Payables = (266,064 + 196,379)/2 = 231,222
FFBL
2010- Creditor = 3,995,077 (note # 10)
2008 - Average Accounts Payables = (1,048,909 + 4,571,018)/2 = 2,809,964
2009 - Average Accounts Payables = (4,571,018 + 2,949,346)/2 = 3,760,182
2010 - Average Accounts Payables = (2,949,346 + 3,995,077)/2 = 3,472,212
FFC
2008 - Average Accounts Payables = (428,757 + 313,505)/2 = 371,131
2009 - Average Accounts Payables = (313,505 + 435,463)/2 = 374,484
2010 - Average Accounts Payables = (435,463 + 413,062)/2 = 424,263
WORKING - 2
DAWH
Net Credit Purchases = Raw Material Purchases + Finished Goods Purchases
2008 - Net Credit Purchases = 1,613,017,850 + 739,466,420 = 2,352,484,270
2009 - Net Credit Purchases = 1,704,467,471 + 3,098,359,089 = 4,802,826,560
2010 - Net Credit Purchases = 1,576,627 + 1,217,827 = 2,794,454
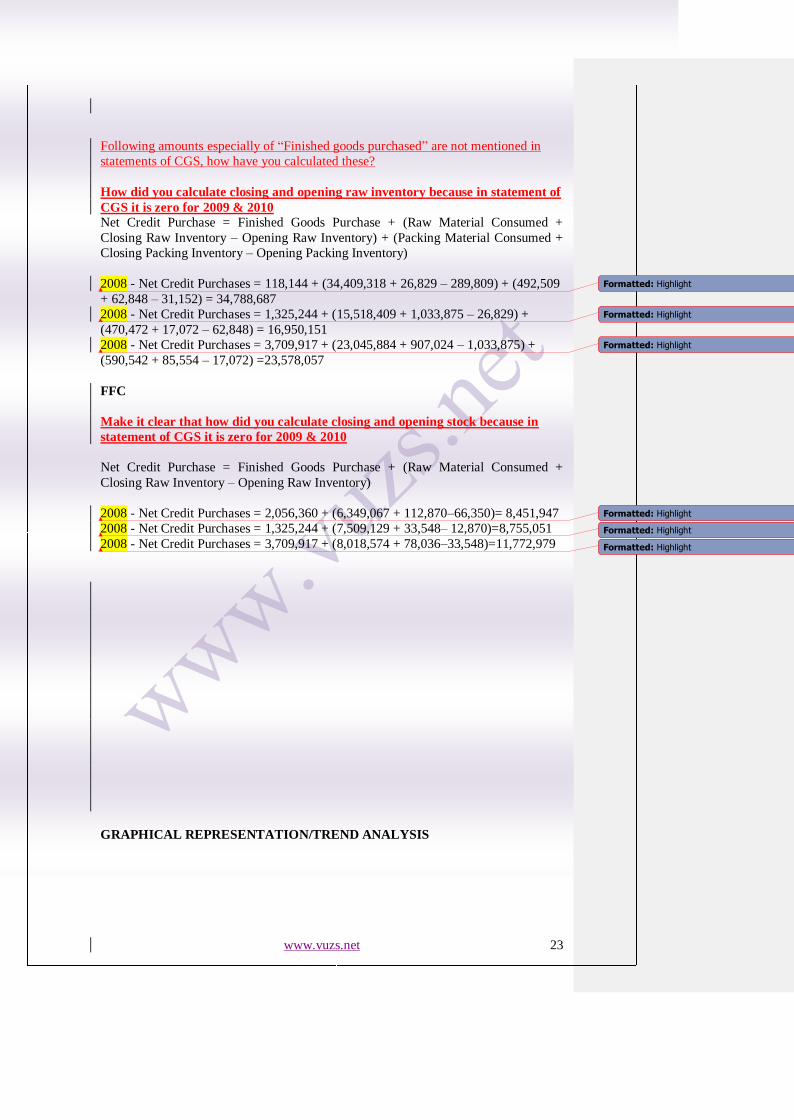
FFBL
www.vuzs.net 23
Following amounts especially of “Finished goods purchased” are not mentioned in
statements of CGS, how have you calculated these?
How did you calculate closing and opening raw inventory because in statement of
CGS it is zero for 2009 & 2010 Net Credit Purchase = Finished Goods Purchase + (Raw Material Consumed +
Closing Raw Inventory – Opening Raw Inventory) + (Packing Material Consumed +
Closing Packing Inventory – Opening Packing Inventory)
2008 - Net Credit Purchases = 118,144 + (34,409,318 + 26,829 – 289,809) + (492,509
+ 62,848 – 31,152) = 34,788,687
2008 - Net Credit Purchases = 1,325,244 + (15,518,409 + 1,033,875 – 26,829) +
(470,472 + 17,072 – 62,848) = 16,950,151
2008 - Net Credit Purchases = 3,709,917 + (23,045,884 + 907,024 – 1,033,875) +
(590,542 + 85,554 – 17,072) =23,578,057
FFC
Make it clear that how did you calculate closing and opening stock because in
statement of CGS it is zero for 2009 & 2010
Net Credit Purchase = Finished Goods Purchase + (Raw Material Consumed +
Closing Raw Inventory – Opening Raw Inventory)
2008 - Net Credit Purchases = 2,056,360 + (6,349,067 + 112,870–66,350)= 8,451,947
2008 - Net Credit Purchases = 1,325,244 + (7,509,129 + 33,548– 12,870)=8,755,051
2008 - Net Credit Purchases = 3,709,917 + (8,018,574 + 78,036–33,548)=11,772,979
GRAPHICAL REPRESENTATION/TREND ANALYSIS
Formatted: Highlight
Formatted: Highlight
Formatted: Highlight
Formatted: Highlight
Formatted: Highlight
Formatted: Highlight
www.vuzs.net 24
Accounts Payables Turnover Ratio
0
5
10
15
20
25
30
35
Year 2008 Year 2009 Year 2010
DAWH
FFBL
FFC
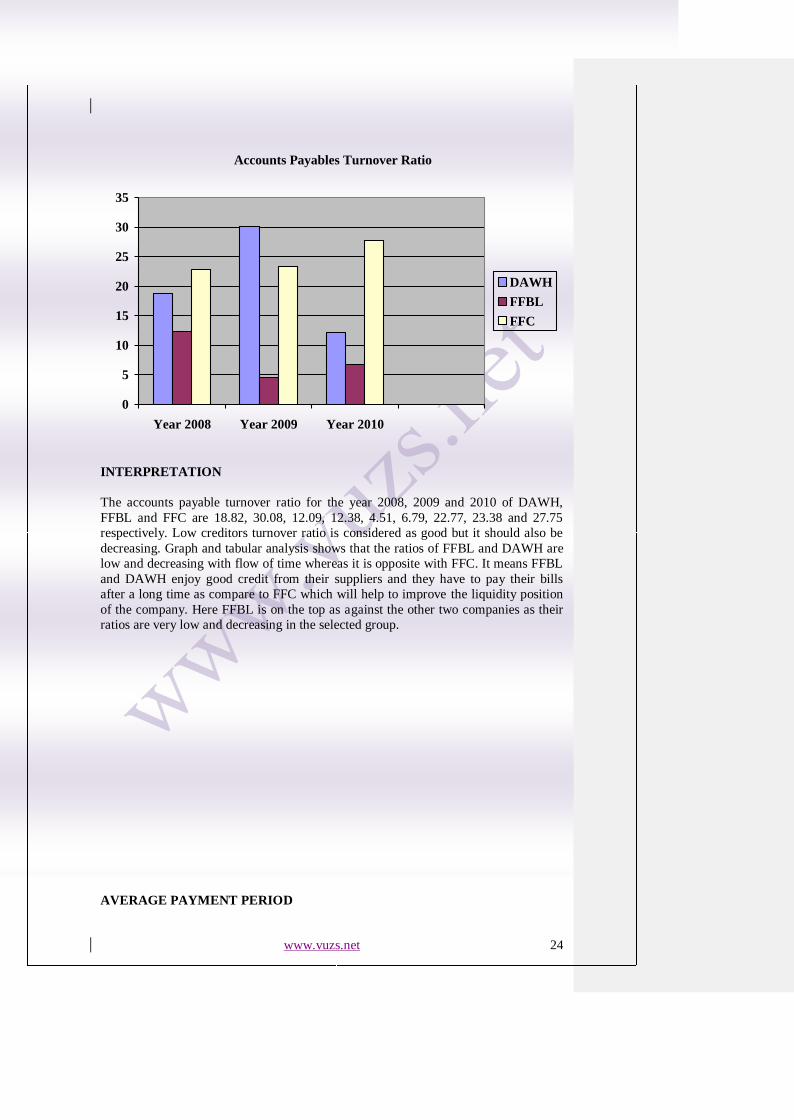
INTERPRETATION
The accounts payable turnover ratio for the year 2008, 2009 and 2010 of DAWH,
FFBL and FFC are 18.82, 30.08, 12.09, 12.38, 4.51, 6.79, 22.77, 23.38 and 27.75
respectively. Low creditors turnover ratio is considered as good but it should also be
decreasing. Graph and tabular analysis shows that the ratios of FFBL and DAWH are
low and decreasing with flow of time whereas it is opposite with FFC. It means FFBL
and DAWH enjoy good credit from their suppliers and they have to pay their bills
after a long time as compare to FFC which will help to improve the liquidity position
of the company. Here FFBL is on the top as against the other two companies as their
ratios are very low and decreasing in the selected group.
AVERAGE PAYMENT PERIOD

www.vuzs.net 25
Average payment period ratio is used to determine the average number of days
required to pay its account payables/creditors.
Formula
Average Payment Period = TurnoverPayableAccounts
365
Tabular Representation
Mention properly the unit of ratio
Company Name Year 2008 Year 2009 Year 2010
DAWH
365 /
18.82 =
19.39
365 /
30.08 =
12.13
365 /
12.09 =
30.19
FFBL
365 /
12.38 =
29.48
365 /
4.51 =
80.93
365 /
6.79 =
53.76
FFC
365 /
22.77 =
16.03
365 /
23.38 =
15.61
365 /
27.75 =
13.15
WORKING
There is no need of working.
GRAPHICAL REPRESENTATION/TREND ANALYSIS

www.vuzs.net 26
Average Payment Period Ratio
0
10
20
30
40
50
60
70
80
90
Year 2008 Year 2009 Year 2010
DAWH
FFBL
FFC
INTERPRETATION
The average payment period ratio for the year 2008, 2009 and 2010 of DAWH, FFBL
and FFC are 19.39, 12.13, 30.19, 29.48, 80.93, 53.76, 16.03, 15.61 and 13.15
respectively. High average payment period ratio is considered as good but it should
also be increasing. FFBL is on top here again as the creditor turnover ratio is low in
group hence FFBL is enjoying longest credit period offered by their supplier and it
will help to save the interest expense as well and give them a room to improve the
cash position or hold inventory or can use to extend the credit to their clients.
It is right that FFBL is best among all in payment policy but properly analyze payment
period in comparison with collection period. DAWH collection period is less in 2008
& 2010 as compared to its payment period which is not a good sign. So, how company
be able to cover this situation in 2010
But FFC is having high payment period in all years as compared to its collection
period, so what consequences company have in such situation and how it can improve
the situation?

www.vuzs.net 27
INVENTORY TURNOVER RATIO
Inventory Turnover Ratio indicates that how well a company utilizes and manages its
inventory. This ratio is used to measure the number of times a company sells its
inventory during the period.
Formula
Inventory Turnover = InventoryAverage
soldgoodsofCost
Tabular Representation
Mention properly the unit of ratio
Company Name Year 2008 Year 2009 Year 2010
DAWH
4,312,462,959 /
478,539,402 =
9.01
7,080,456,675 /
86,426,958 =
81.92
5,214,376 /
149,701 =
34.83
FFBL
18,594,752 /
3,132,343 =
5.94
27,059,566 /
3,451,876 =
7.84
29,793,541 /
1,248,840 =
23.86

www.vuzs.net 28
FFC
18,234,692 /
450,465 =
40.48
20,515,044 /
201,091 =
102.02
25,310,406 /
177,904 =
142.27
WORKING
Average Inventory = (Opening Inventory + Closing Inventory)/2
DAWH
2008 - Average Inventory = (867,510,588 + 89,568,216)/2 = 478,539,402
2009 - Average Inventory = (89,568,216 + 83,285,699)/2 = 86,426,958
2010 - Average Inventory = (83,285 + 216,117)/2 = 149,701
FFBL
2008 - Average Inventory = (587,946 + 5,676,739)/2 = 3,132,343
2009 - Average Inventory = (5,676,739 + 1,227,013)/2 = 3,451,876
2010 - Average Inventory = (1,227,013 + 1,270,667)/2 = 1,248,840
FFC
2008 - Average Inventory = (642,836 + 258,094)/2 = 450,465
2009 - Average Inventory = (258,094 + 144,087)/2 = 201,091
2010 - Average Inventory = (144,087 + 211,720)/2 = 177,904
GRAPHICAL REPRESENTATION/TREND ANALYSIS

www.vuzs.net 29
Inventory Turnover Ratio
0
20
40
60
80
100
120
140
160
Year 2008 Year 2009 Year 2010
DAWH
FFBL
FFC
INTERPRETATION
The Inventory turnover ratio for the year 2008, 2009 and 2010 of DAWH, FFBL and
FFC are 9.01, 81.92, 34.83, 5.94, 7.84, 23.86, 40.48, 102.02 and 142.27 respectively.
High inventory turnover ratio is considered as good and the logic is that company is
efficiently managing and selling its inventory. Here FFC stand as top in his group as
graph and tabular analysis shows that its ratios are increasing and high as compare to
other companies of the selected group. Its means FFC cash tie up position in the
inventory is low as compare to the others. But there is a risk of stockouts that can loss
in the business.
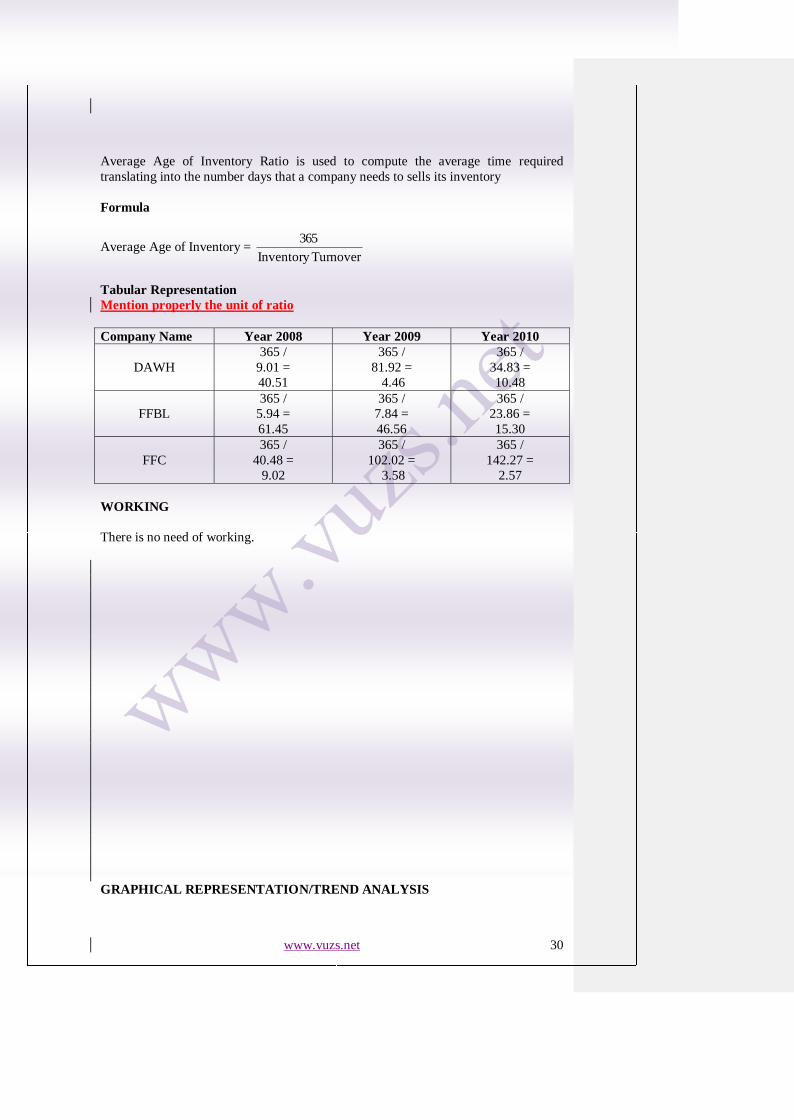
AVERAGE AGE OF INVENTORY RATIO
www.vuzs.net 30
Average Age of Inventory Ratio is used to compute the average time required
translating into the number days that a company needs to sells its inventory
Formula
Average Age of Inventory = TurnoverInventory
365
Tabular Representation
Mention properly the unit of ratio
Company Name Year 2008 Year 2009 Year 2010
DAWH
365 /
9.01 =
40.51
365 /
81.92 =
4.46
365 /
34.83 =
10.48
FFBL
365 /
5.94 =
61.45
365 /
7.84 =
46.56
365 /
23.86 =
15.30
FFC
365 /
40.48 =
9.02
365 /
102.02 =
3.58
365 /
142.27 =
2.57
WORKING
There is no need of working.
GRAPHICAL REPRESENTATION/TREND ANALYSIS
www.vuzs.net 31
Average Age of Inventory Ratio
0
10
20
30
40
50
60
70
Year 2008 Year 2009 Year 2010
DAWH
FFBL
FFC
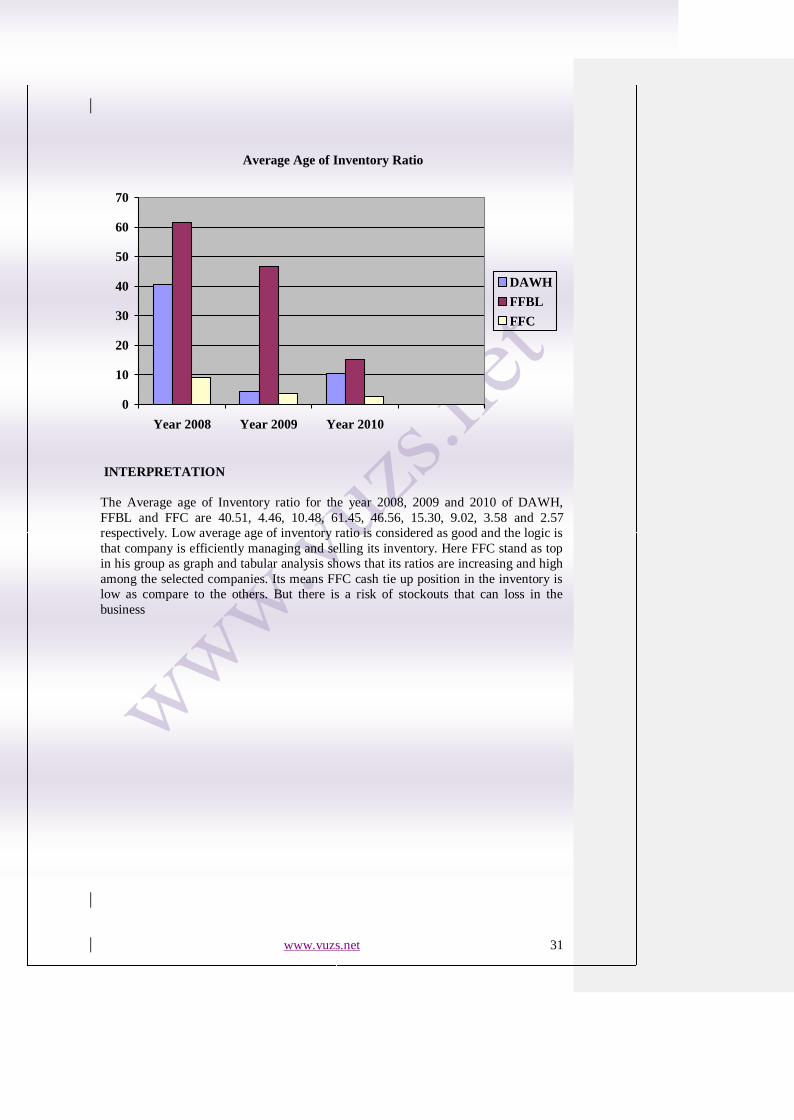
INTERPRETATION
The Average age of Inventory ratio for the year 2008, 2009 and 2010 of DAWH,
FFBL and FFC are 40.51, 4.46, 10.48, 61.45, 46.56, 15.30, 9.02, 3.58 and 2.57
respectively. Low average age of inventory ratio is considered as good and the logic is
that company is efficiently managing and selling its inventory. Here FFC stand as top
in his group as graph and tabular analysis shows that its ratios are increasing and high
among the selected companies. Its means FFC cash tie up position in the inventory is
low as compare to the others. But there is a risk of stockouts that can loss in the
business

www.vuzs.net 32
TOTAL ASSET TURNOVER RATIO
Mention properly the unit of ratio
This ratio is used to measure the efficiency of the company that how nicely the
company used their total assets to generate revenue.
Formula
Total Asset Turnover = AssetsNet Total
SalesCredit Net
Tabular Representation
Company Name Year 2008 Year 2009 Year 2010
DAWH
7,428,702,879 /
25,630,139,749 =
0.29
11,040,361,936 /
29,607,407,984 =
0.37
8,715,711 /
27,226,307 =
0.32
FFBL
26,820,812 /
46,771,671 =
0.57
36,724,920 /
36,225,182 =
1.01
43,256,712 /
35,335,992 =
1.22
FFC
30,592,806 /
31,918,963 =
0.96
36,163,174 /
38,551,582 =
0.94
44,874,359 /
43,060,856 =
1.04
WORKING
There is no need of working.
www.vuzs.net 33
GRAPHICAL REPRESENTATION/TREND ANALYSIS
Total Asset Turnover Ratio
0
0.2
0.4
0.6
0.8
1
1.2
1.4
Year 2008 Year 2009 Year 2010
DAWH
FFBL
FFC
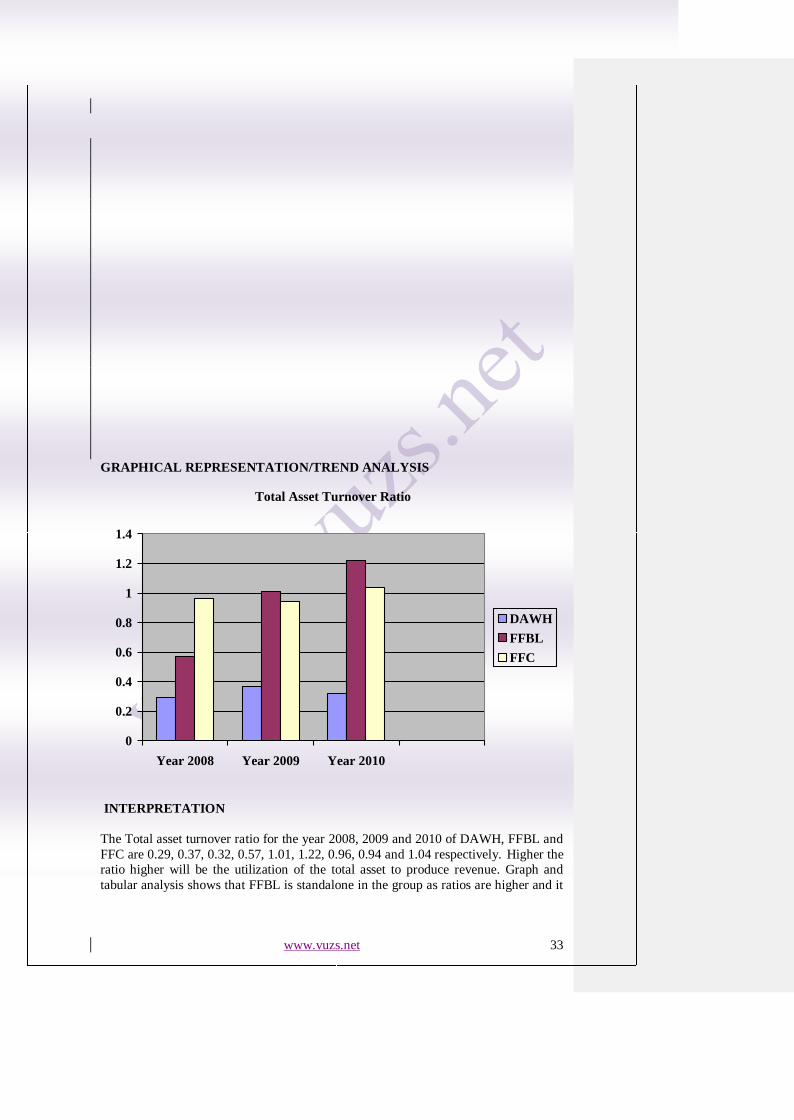
INTERPRETATION
The Total asset turnover ratio for the year 2008, 2009 and 2010 of DAWH, FFBL and
FFC are 0.29, 0.37, 0.32, 0.57, 1.01, 1.22, 0.96, 0.94 and 1.04 respectively. Higher the
ratio higher will be the utilization of the total asset to produce revenue. Graph and
tabular analysis shows that FFBL is standalone in the group as ratios are higher and it
www.vuzs.net 34
is going on increase as compare to the historical figures. Its means FFBL is better
using its total assets to produce revenue as compared to the DAWH and FFC.
TOTAL FIXED ASSET TURNOVER RATIO
This ratio is used to measure the productivity of the company that how nicely a
company used their fixed assets in order to generate certain level of revenue.
Formula
www.vuzs.net 35
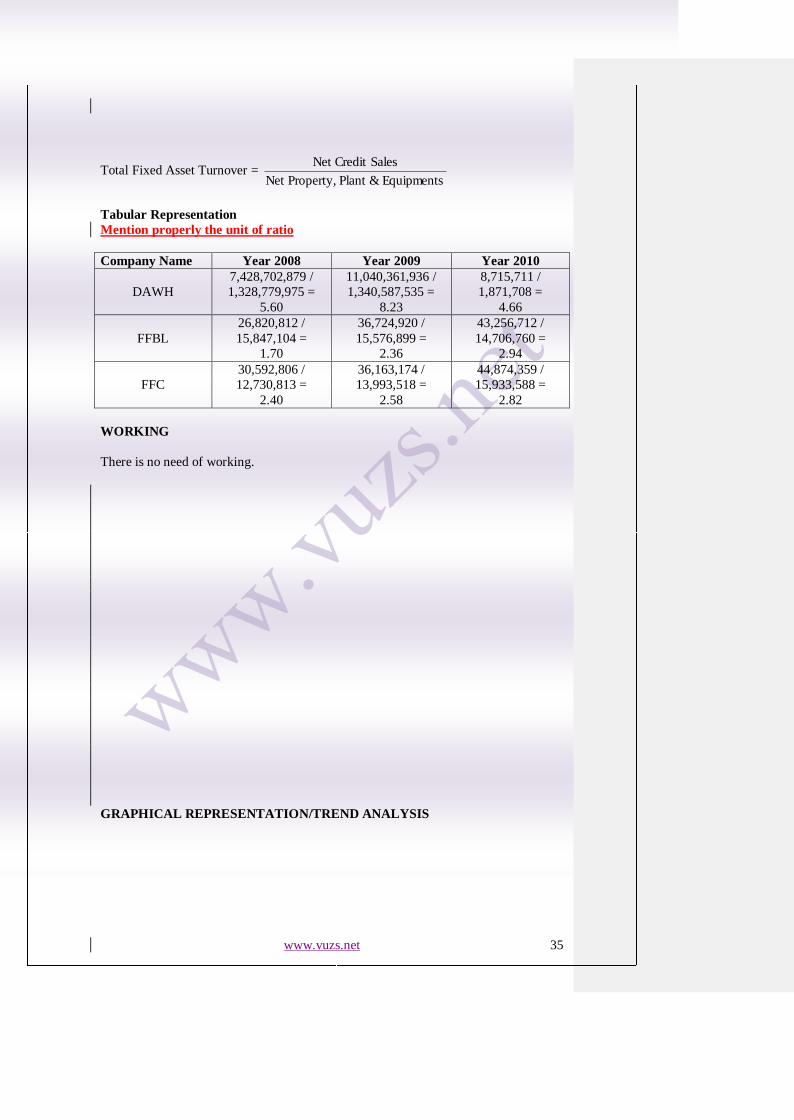
Total Fixed Asset Turnover = Equipments &Plant Property,Net
SalesCredit Net
Tabular Representation
Mention properly the unit of ratio
Company Name Year 2008 Year 2009 Year 2010
DAWH
7,428,702,879 /
1,328,779,975 =
5.60
11,040,361,936 /
1,340,587,535 =
8.23
8,715,711 /
1,871,708 =
4.66
FFBL
26,820,812 /
15,847,104 =
1.70
36,724,920 /
15,576,899 =
2.36
43,256,712 /
14,706,760 =
2.94
FFC
30,592,806 /
12,730,813 =
2.40
36,163,174 /
13,993,518 =
2.58
44,874,359 /
15,933,588 =
2.82
WORKING
There is no need of working.
GRAPHICAL REPRESENTATION/TREND ANALYSIS

www.vuzs.net 36
Total Fixed Asset Turnover Ratio
0
1
2
3
4
5
6
7
8
9
Year 2008 Year 2009 Year 2010
DAWH
FFBL
FFC
INTERPRETATION
The Total fixed asset turnover ratio for the year 2008, 2009 and 2010 of DAWH,
FFBL and FFC are 5.60, 8.23, 4.66, 1.70, 2.36, 2.94, 2.40, 2.58 and 2.82 respectively.
Higher the ratio higher will be the utilization of the total fixed asset to produce
revenue. Graph and tabular analysis shows that DAWH is on top in the group as ratios
are higher but it is decreasing as compare to the historical data on the other hand FFC
and FFBL ratios are low as compare to DAWH but their ratio are increasing with the
passage of time and FFC is more consistent in the group.
Why DAWH is facing decreasing trend and how the other two companies be able to
manage increasing trend?

www.vuzs.net 37
OPERATING CYCLE RATIO
This ratio is used to calculate the average time period that the cash is tied-up in the
purchases of inventory and held to sales and then the average number of days required
to liquidate the credit sales from its debtors/accounts receivable
Formula
Operating Cycle = DIO + DSO
DIO = Days Inventory Outstanding = Sold Goods ofCost
Inventory Average x 365 = Average age of
Inventory
DSO = Days Sales Outstanding = SalesCredit Total
Receivable Accounts Average x 365 = Average
Collection Period
Tabular Representation
Company Name Year 2008 Year 2009 Year 2010
DAWH 40.51 + 0.33 =
40.84
4.46 + 0.31 =
4.77
10.48 + 0.25 =
10.73
FFBL 61.45 + 3.60 =
65.05
46.56 + 3.79 =
50.35
15.30 + 5.51 =
20.81

www.vuzs.net 38
FFC 9.02 + 13.23 =
22.25
3.58 + 3.78 =
7.36
2.57 + 2.50 =
5.07
WORKING
There is no need of working as calculated in the earlier part of this project.
GRAPHICAL REPRESENTATION/TREND ANALYSIS
Operating Cycle Ratio
0
10
20
30
40
50
60
70
Year 2008 Year 2009 Year 2010
DAWH
FFBL
FFC
INTERPRETATION

www.vuzs.net 39
The operating cycle ratio for the year 2008, 2009 and 2010 of DAWH, FFBL and FFC
are 40.84, 4.77, 10.73, 65.05, 50.35, 20.81, 22.25, 7.36 and 5.07 respectively. Lower
the ratio higher will be cash available to meet the short term obligation and less cash is
tied up in inventory and receivables. FFC is exceptional in the group of selected
companies. Their ratios are low in the group and also dropping as compare to the
historical figures. What is the reason behind that? Present proper detailed analysis
Web link provided to download FINANCIAL STATEMENTS of the Selected
Companies
Dawood Hercules Limited
http://www.dawoodhercules.com/financial.html
Fauji Fertilizer Bin Qasim Limited
http://www.ffbl.com.pk/AnnualReport.htm
Fauji Fertlizer Co. Limited
http://www.ffc.com.pk/annualreport.html
www.vuzs.net 40
Conclusion
You are required to properly conclude with overall findings that why DAWH &
FFC are better and why FFBL is not
Conclusion is that DAWH and FFC is better to use their asset with respect to the
activity ratio Analysis.
Recommendation
Properly recommend for all companies that which area each company required
to improve and how it can improve
I recommended FFC as it is more consistent then the other companies.
www.vuzs.net 41
CHAPTER – 4
BIBLIOGRAPHY
William L. Megginson, Scott B. Smart.(2008). Introduction to Corporate
Finance: Activity Ratio, Website:
http://books.google.com.pk/books?id=OTcIDFiNiVIC&pg=PA50&lpg=PA50
&dq=introduction+of+activity+ratio&source=bl&ots=Xc1QP4-
UmX&sig=dY-cmuMb_s1Ap-
97TwentopyGJA&hl=en&ei=ZwieTbPFFsysrAfGsdTEBA&sa=X&oi=book_r
esult&ct=result&resnum=10&ved=0CFIQ6AEwCQ#v=onepage&q=introduc
tion%20of%20activity%20ratio&f=false
Activity Ratio, Website:
http://www.investopedia.com/terms/a/activityratio.asp
http://financial-education.com/2007/01/31/activity-ratios/
http://www.accountingformanagement.com/accounting_ratios.htm
http://www.scribd.com/doc/51790153/14/OBJECTIVE-OF-RATIO-ANALYSIS
http://bizfinance.about.com/od/financialratios/f/Inventory_Turnover_Ratio.htm

www.vuzs.net 42
http://www.bizwiz.ca/inventory_turnover_ratio.html
http://www.investorwords.com/5005/total_asset_turnover.html
http://www.google.com.pk/
Activity Ratio,
FIN 621 – Financial Statement Analysis – Lecture Handout
FIN 621 – Financial Statement Analysis – Lecture Videos
http://www.nfdc.gov.pk/update.htm
Agriculture in Pakistan, Website:
http://en.wikipedia.org/wiki/Agriculture_in_Pakistan
Fauji Fertilizer Co. Ltd. Introduction, Website:
http://www.ffc.com.pk/aboutffc.aspx,
http://www.infogrok.com/index.php/vmchk/2169-swot/fauji-fertilizer-company-
limited-fauf-swot-profile/flypage.pbv.tpl.html
http://www.scribd.com/doc/29506620/Analysis-of-Fertilizer-Industry-of-
Pakistan
Fauji Fertilizer Co. Ltd. Mission Statement, Website:
http://www.ffc.com.pk/missionstat.aspx
Fauji Fertilizer Co. Ltd. Vision Statement, Website:
http://www.ffc.com.pk/visionstat.aspx
Dawood Hercules Limited, Introduction, Website:
http://www.scribd.com/doc/29506620/Analysis-of-Fertilizer-Industry-of-
Pakistan
http://www.dawoodhercules.com/
Fauji Fertilizer Bin Qasim Limited, Website:
http://www.ffbl.com.pk/
STA – 630 – Research Method – Lecture Handout