Digital Video Interface Comparison for Global Security Applications

Virtual Diagnostics Interface: Real Time Comparison of Experimental Data and CFD Predictions for a NASA Ares I-Like Vehicle
Richard J. Schwartz*, Gary A. Fleming**
*Swales Aerospace, supporting the Advanced Sensing and Optical Measurement Branch
NASA Langley Research Center, Hampton, Virginia USA [email protected]
**Assistant Branch Head, Advanced Sensing and Optical Measurement Branch
NASA Langley Research Center, Hampton, Virginia USA [email protected]
Keywords: Virtual Diagnostics Interface, ViDI, real time data acquisition, data comparison
Abstract - Virtual Diagnostics Interface technology, or
ViDI, is a suite of techniques utilizing image processing, data handling and three-dimensional computer graphics. These techniques aid in the design, implementation, and analysis of complex aerospace experiments. LiveView3D is a software application component of ViDI used to display experimental wind tunnel data in real-time within an interactive, three-dimensional virtual environment. The LiveView3D software application was under development at NASA Langley Research Center (LaRC) for nearly three years. LiveView3D recently was upgraded to perform real-time (as well as post-test) comparisons of experimental data with pre-computed Computational Fluid Dynamics (CFD) predictions. This capability was utilized to compare experimental measurements with CFD predictions of the surface pressure distribution of the NASA Ares I Crew Launch Vehicle (CLV) - like vehicle when tested in the NASA LaRC Unitary Plan Wind Tunnel (UPWT) in December 2006 - January 2007 timeframe. The wind tunnel tests were conducted to develop a database of experimentally-measured aerodynamic performance of the CLV-like configuration for validation of CFD predictive codes.
I. INTRODUCTION
Experimental data and computational predictions are vital
components in the design of modern aerospace vehicles. Confidence in both sources of information is critical. Often this confidence is conveyed through the comparison not only of computational predictions with experiment, but through the assessment of experimental data with respect to the mathematically-derived predictions. Traditionally, the bulk of the comparison work has been conducted in a post-test analysis phase of the experiment. The LiveView3D system, a tool developed under the ViDI technology thrust, was
expanded to allow researchers to compare and analyze computational predictions and experimental data in real-time. The first application of LiveView3D, for this purpose was for the NASA Ares CLV project.
The LiveView3D system was composed of a set of custom software programs working in conjunction with commercial-off-the-shelf graphics applications. The programs are integrated together to allow semi-autonomous operation of the real-time data visualization via an easy to use interface. The goal of the ViDI portion of the test was to visualize and compare on-body pressure data from over one-hundred surface pressure taps with CFD predictions as well as schlieren data with CFD-derived density contour plots of the off-body flowfield. The LiveView3D system produced three-dimensional graphics in an interactive virtual environment as well as traditional two-dimensional X-Y plots of pressure data. The visualization was available to the research engineers, in real-time, in the wind tunnel control room. This played an integral role in modifying the test matrix based on the comparisons between the experimental data and computational predictions as the test progressed. The off-body flow density data was compared post-test.
II. TEST CONFIGURATION
The Ares configuration consists of a first stage derived from
a Space Shuttle reusable solid rocket motor (RSRM) and a newly designed liquid fueled second stage. The payload is the Orion Crew Exploration Vehicle (CEV), a reusable six person capsule designed for orbital and trans-lunar operation. During the first portion of the launch trajectory, the Orion capsule is topped by the Launch Escape System (LES), a solid rocket motor that can pull the capsule away from the booster rocket in an emergency situation. The Ares-like booster tested in the NASA LaRC UPWT was an early design used for the

development of a baseline aerodynamic database for comparison and validation of the CFD. It was an axisymmetric configuration devoid of protuberances and most other detail (Fig. 1).
III. COMPUTATIONAL DATA
The computational predictions were created using USM3D,
a part of the TetrUSS system [1] and included the surface pressure distribution as well as off-body flowfield density contours. This data was received in the Tecplot file format. Additionally, a subset of this data, containing the coefficient of pressure (Cp) data at locations where the surface pressure taps on the model was located, was received in a SIF file format — a format indigenous to the NASA LaRC Data Acquisition System (DAS). Both data sources were used in the real-time data visualization. For each of these sources of computational predictions, the information required translation into a format readable by Autodesk 3ds max [2], the visualization program used by the LiveView3D system.
A. Tecplot Data File Conversion
Tecplot 360 [3] is a visualization program designed to
handle large three-dimensional data sets. A Tecplot file format can include the three-dimensional geometry data and on- and off-body data. A translation program was written in MaxScript, the native programming language of 3ds max, to extract the pertinent data for use with the LiveView3D system. This program parsed out the appropriate information to define the triangular mesh surface and the Cp value associated with each triangular surface element. The MaxScript program then constructed a three-dimensional mesh with each triangular surface colored based on the associated Cp value. In order for the 3ds max visualization to be directly comparable to the Tecplot visualization, the Cp values of the surfaces required color mapping using the same palette, or color table that Tecplot uses.
The color maps used by Tecplot allowed up to 256 color
values, identified by triplet pairs of 8 bit Red, Green and Blue (RGB) values. A standard “small rainbow” palette provided by Tecplot was chosen. A Microsoft® Visual Basic.Net [4] program was written to extract the color triplet information from the Tecplot palette file. This information was then saved in a format readable by the MaxScript program.
The Tecplot mesh consisted of half of the configuration,
split along the longitudinal axis. The mesh was copied, mirrored and joined along the longitudinal axis in 3ds max to create the complete configuration. A separate mesh was made for each Mach number, Reynolds number, and angle of attack to be tested (Fig 2).
B. Discrete Surface Pressures from SIF Files
A SIF data file containing a series of 1000 discrete CFD Cp
predictions were made available. Each set of 1000 Cp values
lay along a straight line that ran the full length of the configuration, with the data sets located at 5 degree intervals along the circumference of the vehicle. This format served as a useful starting point for extracting the data to be used in direct comparison to the discreet surface pressure taps on the wind tunnel model.
The wind tunnel model had 105 pressure taps that were
arranged along a straight line from the nose to the aft skirt of the model. To determine the pressure around the circumference of the configuration, the model was placed at an angle of attack and then rolled through 180 degrees in 15 degree increments.
Two Visual Basic.Net programs were written to organize
and parse out the data from the SIF files. The original SIF file contained the data for all the angles of attack and roll angles in one file. This resulted in a file too large and cumbersome to work with. The first program split the one SIF file by test condition, resulting in over eighteen hundred individual SIF files. Each one of these files contained the 1000 Cp values that spanned the length of the model in a straight line. The second program was used to extract the 105 values from the 1000 present in the file that most closely corresponded to the locations where the pressure taps were located along that line. The end result was a series of files that contained the CFD predictions for the surface pressure taps at all anticipated test conditions. The file names contained the pertinent information on the flow conditions and model attitude for easy recall by the LiveView3D program.
C. Density Contour Data for Schlieren Comparisons The CFD predicted off body flow density was displayed in
Tecplot using a grayscale palette. This was done to mimic the grayscale imaging capability of the wind tunnel schlieren system. To extract the image, a screen capture of the side view was saved to a bitmap image (Fig. 3). The images would later be mapped into the virtual environment along with the corresponding schlieren pictures. Note that the CFD results correspond to density contours, whereas the schlieren flow visualization reveals density gradients.
IV. EXPERIMENTAL SETUP
This test was conducted at NASA LaRC in the UPWT. The
wind tunnel is a closed-loop, continuously running supersonic facility with two separate test sections. Test Section 1 is 48 inches by 48 inches in cross-section and is capable of attaining Mach numbers from 1.5 to 2.9. Test Section 2 is 52 inches high by 48 inches wide and capable of running from Mach 2.3 to 4.6. Each test section contains a model traversing and positioning system that can remotely translate upstream and downstream and rotate the model in roll, pitch and yaw [5]. Both test sections were used for this test to span the full Mach number range of the facility (Fig. 4).

The model was sized to one percent of full-scale. It was fitted with a removable shroud that represented the cover for the LES rocket motors and a large, removable simulated exhaust plume for the aft end. Most of the testing was performed without the LES shroud and plume (Fig. 5).
The model contained 146 surface pressure taps. 105 of these taps were located in a straight line that ran from near the tip of the nose to the back of the aft skirt on the model. Heavier concentrations of the taps were placed where the vehicle configuration changed radius. The pressure tubing was routed inside the model, and exited aft through the sting mechanism. Once external of the model and sting, the tubing was placed in a flexible conduit such that the model could be pitched through an angle of attack range and rolled through 180 degrees.
Grit was applied to various portions of the model to promote
transition from laminar to turbulent flow. Numerous patterns were applied with different grit sizes as the testing progressed.
A conventional Schlieren system was used to visualize the
off-body flow features such as shocks and expansion waves. Images of the Schlieren visualization were captured using a National Television System Committee (NTSC) video camera. The video signal was viewed in the control room and was routed to the ViDI computer framegrabber for capture and inclusion in the real-time data visualization in the virtual environment. Additionally, a high resolution digital camera recorded still images of the Schlieren visualization. These images were used for comparing the CFD-derived flowfield gradient contour map predictions with the experimental results during post-test processing.
V. LIVEVIEW3D
The LiveView3D data visualization system is based on a
workstation-class PC-compatible computer. The computer is currently equipped with a commercially-available frame grabber capable of capturing video from industry standard RS-170 analog monochrome video cameras. The computer is also outfitted with a professional-grade graphics card with dual monitor outputs.
The LiveView3D software consists of two separate
computer programs that work in unison: the LiveView3D Controller and the three-dimensional graphical visualization environment (Fig 6). The LiveView3D Controller is a custom computer program written in Microsoft® Visual Basic [6]. The Controller provides a graphical user interface to allow the researcher to control various aspects of the data visualization, and to save and recall data streams for display. The three-dimensional graphical visualization environment is provided by Autodesk 3ds max. 3ds max is a CAD-like software package with advanced modeling, lighting, rendering, and animation toolsets for generating very high quality interactive visualizations. The LiveView3D Controller communicates with 3ds max using the Microsoft® ActiveX [7] protocol.
This allows user input parameters from the Controller to be passed to custom-developed code within 3ds Max, whereby the user-requested changes to the visualization are implemented. Further hardware and software details are available in Reference [8].
For this application, the computer was equipped with a second video card, which allowed three monitors to be used as a single display. Two standard 21-inch flat panel screens were used to display the LiveView3D controller program. A 42-inch flat screen plasma unit was dedicated to display the three-dimensional graphics of the virtual environment.
The LiveView3D and UPWT DAS computers were
interfaced via Ethernet and used TCP/IP for communications. This allowed a stream of up to 500 scalar parameters acquired and/or computed by the DAS to be transmitted and incorporated into the LiveView3D visualization.
A pre-requisite for operation of the LiveView3D system is a
three-dimensional Computer-Aided Design (CAD) model of the test configuration. Typically, this consists of the merging of a detailed scale representation of the test facility with a three-dimensional CAD file of the wind tunnel model being tested. To complete the virtual environment, the test configuration was added to the facility. A three-dimensional CAD model, usually available from the model designer, is imported and scaled to match the facility. It is then linked to the sting mechanism, allowing it to move in the same way as the actual test hardware moves.
The ability to recall and display CFD data was added to
LiveView3D for this test. The CFD data was provided in two formats: a surface mesh with a color contour of the Cp distribution, and SIF files containing the Cp predicted values at the pressure tap locations. These files were organized via file naming conventions that described the test conditions, such as Mach and Reynolds numbers, angle of attack and model roll angle. Controlling the display of the CFD in the virtual environment could be conducted either manually in LiveView3D, or automated. In this mode, the proper CFD result would be displayed based on the test conditions LiveView3D received from the DAS system. This allowed LiveView3D to be placed in an automated mode of operation that displayed the CFD predictions that corresponded to the wind tunnel test conditions.
In addition to the three-dimensional graphical display of the
data, LiveView3D had a two-dimensional plotting capability that was used during this test. The Cp values computed from the surface pressure taps that ran the length of the model was plotted versus the non-dimensionalized length of the model. The plot also contained the corresponding CFD predictions for the test The plots were created and saved automatically when a data point was recorded by the wind tunnel DAS.

VI. VISUALIZATION ENVIRONMENT
The three-dimensional virtual environment for this test was populated by scale representations of the wind tunnel, model support system, test configuration, and special geometry for visualizing the experimental and computational Cp values.
Two types of three-dimensional geometry were used for the
Ares-like booster. The first was a CAD model from which the wind tunnel model was built. This would be used in the visualization for the few test conditions when there was no CFD solution available. The second source of geometry for the booster rocket came from the CFD solutions, as described above (Fig 7). The CFD geometry had the same outer mold lines as the CAD geometry, but contained the Cp distribution data in the form of a surface color contour plot. The user specified the geometry to display via a custom utility within 3ds max containing a graphical user interface created with the MaxScript programming language.
The Cp values from both the DAS and the CFD predictions
were represented in the virtual environment as a set of three cylinders at each pressure tap location along the line of one-hundred five pressure taps that spanned the length of the model. The remaining pressure taps were omitted to simplify the visualization and concentrate on the most pertinent data. A black cylinder was used to depict the experimental data, while a red cylinder represented the computational prediction. Additionally, a yellow cylinder was used to represent the differences between the experimental and computational values. The lengths of the cylinders changed according to the magnitude of the pressure data and their differences.
One of the challenges in visualizing the data was
differentiating between positive and negative values of Cp. A thin rectangular bar running the length of the model was created to establish a zero Cp reference level (Fig. 8). This bar was positioned to follow the contour of the model and allow the most negative expected Cp value to remain completely above the booster model surface. It was assigned a semi-opaque white color, and thin lines were added to tie the data cylinders to the surface locations of the pressure taps.
Three virtual cameras were positioned to view the model in
the regions of highest pressure tap density: the nose, inter-stage area and aft skirt (Fig. 9). Each camera was linked to the model geometry so they moved along with the model, preserving the view despite changes in the angle of attack or roll.
VII. OPERATIONS
Once configured, operating the LiveView3D system proved
to be straight forward and reliable, with thousands of data points acquired during the test. The program ran in a semi-autonomous mode that only required attention when a series of test points had been completed [8].
To begin running the LiveView3D system, communication was established with the wind tunnel DAS system. A previously compiled configuration file was then used to specify how data from the DAS would be assigned to geometric objects in the virtual environment. The user would specify the pressure taps to be included in the visualization, which was usually limited to the single row of 105 taps.
To display the Cp CFD predictions at the surface pressure
tap locations, the user was required to specify the Mach number and Reynolds number and angle of attack to select the model with the appropriate Cp surface contours. The roll angle was received automatically from the DAS.
As the wind tunnel ran, data from the DAS was sent to the
LiveView3D computer each time the wind tunnel operator took a data point. Angle of attack and roll angle values were used to automatically reposition the geometry in the virtual environment into the proper orientation. The Cp data was used to update the display of the experimental surface pressure taps, while values from the CFD data file, which were selected based on tunnel conditions reported by the DAS, were used for the corresponding display of the predicted values. This was done for both the three-dimensional visualization and the two-dimensional data plots. Once the visualizations were updated, a bitmap image was made for each of the three camera views of the model (nose, inter-stage and aft skirt). Then, the X-Y plot of the Cp versus the non-dimensionalized length (X/L) was saved (Fig 10). It took approximately 10 seconds for the LiveView3D system to complete a data acquisition cycle and refresh the visualizations.
There were several benefits to having the LiveView3D
display available to the researcher in real-time in the wind tunnel control room. As the test was getting started, there were several instances when one or more of the surface pressure taps were giving erroneous information. Since this became immediately apparent from the visualizations and the plots, the problems were resolved without the need to repeat a large number of runs.
A key application of the real-time comparisons between the
experimental data and the CFD predictions was in the establishment of the desired grit pattern applied to the model. The CFD predictions were based on the wind tunnel Reynolds numbers and assumed a fully-turbulent boundary layer. A boundary layer transition technique was applied to the wind tunnel model in an attempt to replicate the flow state assumed in the CFD solutions. This technique featured the application of local surface roughness, or grit particles, of a prescribed height and location on the model. The placement of the grit had to be determined through an iterative procedure in the wind tunnel. By comparing the Cp distribution between the experimental values and the computational predictions using LiveView3D, the effectiveness of the grit pattern could be assessed.

In general, the availability of instant comparisons between the experimental and computational values allowed the researcher to examine the differences and alter the experiment in real-time based on the observed differences between experiment and prediction. It was more efficient to operate this way as opposed to comparing the results in a post-test timeframe, when it may be impossible to return to the experiment and obtain more data. As a whole, the LiveView3D system increased the researcher’s situational awareness during the test. The unification of discreet experimental measurements with corresponding computational predictions, combined with an overall view of the surface pressure distributions, provided a powerful tool to visualize and understand the aerodynamic phenomena of interest.
VIII. OFF-LINE DATA PROCESSING
Two data processing tasks were addressed once the data had
been saved to disk. The first was the creation of animations in computer movie file formats. The second was the comparison of the CFD predictions of the off-body flow density to the high resolution Schlieren images acquired during the test.
A MaxScript program was written to import the three
individual bitmap images of the camera views of the test configuration with the Cp data rendered in real-time along with the two-dimensional X-Y plot to create a single image for each test condition (Fig 11). Then, the test conditions for a given run were formed into an animation, and saved in common computer movie file formats. A test matrix spreadsheet file that contained the wind tunnel runs was used to hyperlink the movie files to the appropriate test conditions, allowing the researcher to call back a particular set of data and view it on a desktop computer.
The comparison of Schlieren data with CFD predictions was
a straight forward task in 3ds max. The schlieren pictures and the CFD images were mapped to planes that were placed along the centerline of the model and were scaled by matching the outline of the model in the images with the three-dimensional computer model. To enhance the information content of the visualization, the model with the appropriate Cp surface distribution was used. A scale grid was added, and still images and a series of animations were created that had the CFD predictions fade in and out over the experimental data (Fig. 12).
IX. FUTURE DIRECTIONS
This experiment occupied the wind tunnel for nearly two months of 16-hour per day operations, which gave the ViDI software and its operators a thorough shakedown. Throughout this time, the software performed well, but there were several areas of improvement based on lessons learned.
As the experiment was run, individual renderings of the data and the two-dimensional data plots were created. In post-
processing, these files were organized and rendered into a single file, which were then used as elements for animations. This process could have been automated, so that between data runs the processing could have been accomplished. This would have allowed a final product to be created sooner and with much less need for operator intervention.
Another area of improvement would be to modify the codes
used to import the CFD surfaces such that they can be easily run during the test. Thus, instead of having to save mesh files with a pre-defined color palette, the program could create the geometry from the data with a palette selected in real-time, as required.
The most anticipated update to LiveView3D is the
incorporation of self-descriptive data files [9]. A technology developed by The National Center for Supercomputing Applications called HDF5 (Hierarchical Data Format, version 5) is a powerful technology that will greatly enhance the way data is stored, queried, and retrieved with the ViDI software. Through the use of HDF5, disparate forms of data can be unified into a common file, combining what are currently several data files (pressures, forces and moments, three-dimensional geometry, etc.) into a file or small set of files that are easily organized and cross-referenced. When considering how many gigabytes of data can be stored in a short time by the ViDI system, a robust and well-designed data file technology has the potential to significantly streamline the system operations.
X. SUMMARY
The ViDI LiveView3D system has matured into tool that
can be routinely applied to wind tunnel tests. The additional ability of displaying and comparing CFD data has added a new capability to the application, providing the researcher with a greater level of situational awareness during a test. The software was extensively used at the NASA LaRC UPWT for testing on a configuration similar to the NASA Ares CLV. The software provided real-time three-dimensional graphics and two-dimensional plots of coefficient of pressure values for over 100 channels of data acquired by the wind tunnel data acquisition system, in addition to visualizing Schlieren data in the virtual environment. This technology has been embraced by the local testing community, and is slated for continued development and deployment.
ACKNOWLEDGMENT
The authors would like to thank: Gary Erickson of the NASA Langley Configuration Aerodynamics Branch for his enthusiastic support; John Micol of the NASA LaRC Facilities Branch and his group at the UPWT were instrumental in providing the opportunities to develop the technologies in the facility; and Clifford Obara of the NASA LaRC Data Acquisition and Test Techniques Branch for his support in operating the software.

REFERENCES [1] Frink,N.T., Pirzadeh, S.Z, Parikh, P.C., Pandya, M.J., and Bhat, M.K., "The NASA Tetrahedral Unstructured Software System" , The Aeronautical Journal, Vol. 104, No. 1040, October 2000, pp. 491-499. [2] 3ds Max a registered trademark of Autodesk Inc. [3] Tecplot 360 a registered trademark of Tecplot Inc. [4] Microsoft Visual Basic.Net is a registered trademark of Microsoft Corporation in the United States and other countries [5] Erickson, G.E., “Overview of Selected Measurement Techniques for External Aerodynamic Testing in a Supersonic Wind Tunnel Facility”, AIAA 2000-2396, AIAA Fluids 2000 Conference, 19-22 June, 2000, Denver CO. [6] Microsoft Visual Basic a registered trademark of Microsoft Corporation in the United States and other countries [7] ActiveX is a registered trademark of Microsoft Corporation in the United States and other countries [8] R. Schwartz, G. Fleming, “Advanced Visualization of Experimental Data in Real Time Using LiveView3D,” AIAA-2006-3302, AIAA 24th Applied Aerodynamics, June 5-8, 2006, San Francisco, CA. [9] R. Schwartz, "ViDI: Virtual Diagnostics Interface Volume 2-Unified File Format and Web Services as Applied to Seamless Data Transfer", NASA/CR-2003-212668, December 2003
FIGURES
Figure 1. Configuration representing the Ares rocket as tested in the Unitary Plan Wind Tunnel.
Figure 2. CFD surface mesh with Cp distribution as translated into 3ds max for use in the virtual environment.

Figure 3. Computational prediction of flowfield density for comparison with Schlieren data.
Figure 4. One percent scale model of the Ares-like configuration in the Unitary Plan Wind Tunnel.
Figure 5. Rendering of model with nose flare and exhaust plume. Plume and flare were used for a small percentage of the runs.
Figure 6. Screen display of the LiveView3D controller program on the left, and the visualization environment, Autodesk 3ds max, on the right.

Figure 7. Virtual environment depicting several imported test configurations with CFD Cp surface predictions into the UPWT
virtual environment.
Figure 8. Test configuration with cylinders representing the Cp data from the surface pressure taps. The white bar above the model is the “zero-reference” line for
the Cp value display.

Figure 9. Fixed virtual camera views of the test configuration and surface pressure tap data
Figure 10. Real-time two-dimensional plot of the data created by LiveView3D. The black line represents the experimental data, while the red line depicts the
CFD prediction. Note that axis labeling has been omitted from this figure.

Figure 11. Single image composed of the three-dimensional renderings and two-dimensional plot. Series of these composite were produced to create animations
of the data from a single run. Note that labeling has been omitted from this figure.
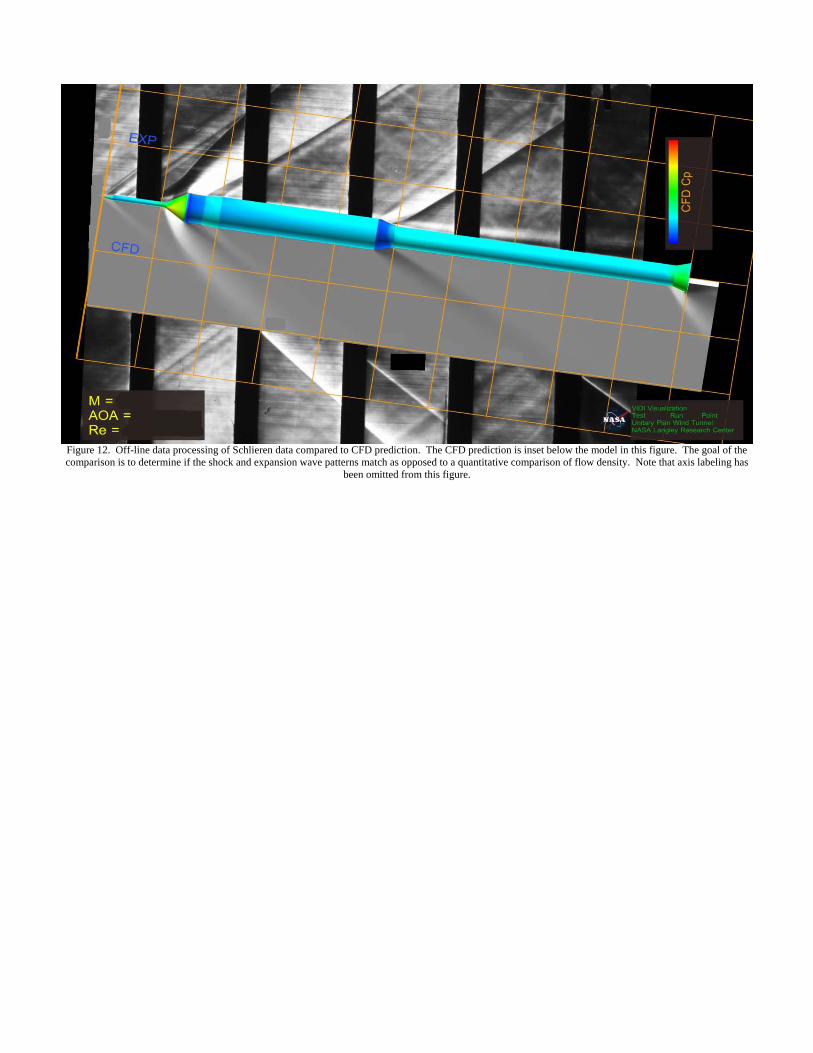
Figure 12. Off-line data processing of Schlieren data compared to CFD prediction. The CFD prediction is inset below the model in this figure. The goal of the comparison is to determine if the shock and expansion wave patterns match as opposed to a quantitative comparison of flow density. Note that axis labeling has
been omitted from this figure.