Virginia’s Speech-Language Pathology Workforce: 2016 · Virginia’s Speech-Language Pathology...
32
Virginia’s Speech-Language Pathology Workforce: 2016 Healthcare Workforce Data Center March 2017 Virginia Department of Health Professions Healthcare Workforce Data Center Perimeter Center 9960 Mayland Drive, Suite 300 Richmond, VA 23233 804-367-2115, 804-527-4466(fax) E-mail: [email protected] Follow us on Tumblr: www.vahwdc.tumblr.com
-
Upload
nguyenkhanh -
Category
Documents
-
view
221 -
download
4
Transcript of Virginia’s Speech-Language Pathology Workforce: 2016 · Virginia’s Speech-Language Pathology...

Virginia’s Speech-Language Pathology Workforce: 2016
Healthcare Workforce Data Center
March 2017
Virginia Department of Health Professions Healthcare Workforce Data Center
Perimeter Center 9960 Mayland Drive, Suite 300
Richmond, VA 23233 804-367-2115, 804-527-4466(fax) E-mail: [email protected]
Follow us on Tumblr: www.vahwdc.tumblr.com

Virginia Department of Health Professions
David E. Brown, D.C. Director
Lisa R. Hahn, MPA
Chief Deputy Director
Healthcare Workforce Data Center Staff:
Dr. Elizabeth Carter, Ph.D. Executive Director
Yetty Shobo, Ph.D. Deputy Director
Laura Jackson Operations Manager
Christopher Coyle Research Assistant
3,201 Speech-Language Pathologists voluntarily participated in this survey. Without their efforts the work of the center would not be possible. The Department of Health Professions, the Healthcare Workforce Data Center, and the Board of Audiology & Speech-Language Pathology express our sincerest appreciation for your ongoing cooperation.
Thank You!

The Board of Audiology & Speech-Language Pathology
Chair
A. Tucker Gleason, Ph.D., CCC-A Jeffersonton
Vice-Chair
Laura Purcell Verdun, MA, CCC-SLP
Oak Hill
Members
Corliss V. Booker, Ph.D., APRN, FNP-BC Chester
Bradley W. Kesser, MD
Charlottesville
Lillian B. Beahm, Au.D., CCC-A Roanoke
Angela W. Moss, MA, CCC-SLP
Henrico
Ronald Spencer, RN Midlothian
Executive Director
Leslie L. Knachel
Contents
Results in Brief ............................................................................................................................................................................ 2
Summary of Trends .................................................................................................................................................................... 3
Survey Response Rates ............................................................................................................................................................... 5
The Workforce ............................................................................................................................................................................ 6
Demographics ............................................................................................................................................................................. 7
Background ................................................................................................................................................................................ 8
Education ................................................................................................................................................................................. 10
Specializations & Credentials .................................................................................................................................................... 11
Current Employment Situation ................................................................................................................................................. 12
Employment Quality ................................................................................................................................................................. 13
2016 Labor Market ................................................................................................................................................................... 14
Work Site Distribution .............................................................................................................................................................. 15
Establishment Type .................................................................................................................................................................. 16
Time Allocation ........................................................................................................................................................................ 18
Patient Workload ..................................................................................................................................................................... 19
Retirement & Future Plans ....................................................................................................................................................... 20
Full-Time Equivalency Units ...................................................................................................................................................... 22
Maps ........................................................................................................................................................................................ 23 Council on Virginia’s Future Regions ............................................................................................................................................ 23 Area Health Education Center Regions ........................................................................................................................................ 24 Workforce Investment Areas ....................................................................................................................................................... 25 Health Services Areas ................................................................................................................................................................... 26 Planning Districts .......................................................................................................................................................................... 27
Appendix .................................................................................................................................................................................. 28 Weights ........................................................................................................................................................................................ 28

1
The Speech-Language Pathology Workforce: At a Glance:
The Workforce Background Current Employment t Licensees: 3,997 Rural Childhood: 30% Employed in Prof.: 94% Virginia’s Workforce: 3,449 HS Degree in VA: 44% Hold 1 Full-time Job: 59% FTEs: 2,634 Prof. Degree in VA: 46% Satisfied?: 95%
Survey Response Rate Education Job Turnover t All Licensees: 80% Masters: 98% Switched Jobs in 2016: 7% Renewing Practitioners: 87% Doctorate: 2% Employed over 2 yrs: 64%
Demographics Finances Primary Roles t Female: 97% Median Inc.: $60k-$70k Client Care: 77% Diversity Index: 25% Health Benefits: 63% Administration: 6% Median Age: 41 Under 40 w/ Ed debt: 64% Non-Clinical Educ.: 1%
Source: Va. Healthcare Workforce Data Center
2
Results in Brief
3,201 speech-language pathologists (SLPs) voluntarily took part in the 2016 Speech-Language Pathologist Workforce
Survey. The Virginia Department of Health Professions’ Healthcare Workforce Data Center (HWDC) administers the survey during the license renewal process, which takes place every December for SLPs. These survey respondents represent 80% of the 3,997 SLPs who are licensed in the state and 87% of renewing practitioners.
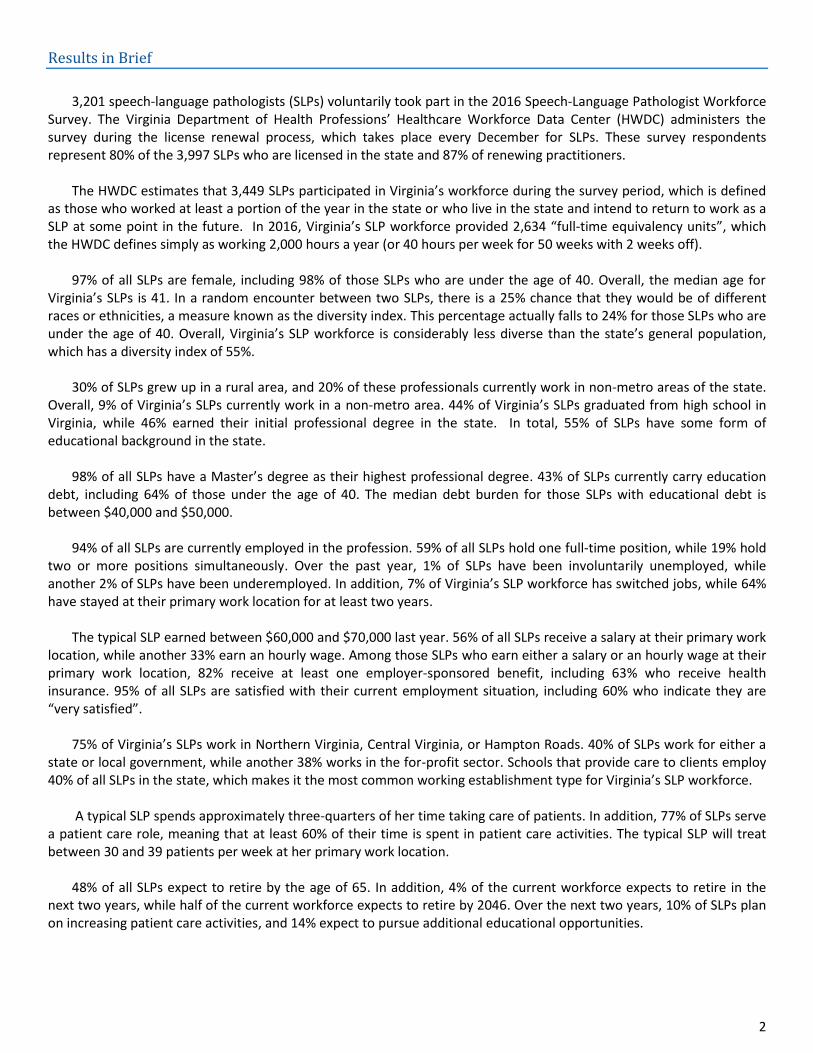
The HWDC estimates that 3,449 SLPs participated in Virginia’s workforce during the survey period, which is defined
as those who worked at least a portion of the year in the state or who live in the state and intend to return to work as a SLP at some point in the future. In 2016, Virginia’s SLP workforce provided 2,634 “full-time equivalency units”, which the HWDC defines simply as working 2,000 hours a year (or 40 hours per week for 50 weeks with 2 weeks off).
97% of all SLPs are female, including 98% of those SLPs who are under the age of 40. Overall, the median age for
Virginia’s SLPs is 41. In a random encounter between two SLPs, there is a 25% chance that they would be of different races or ethnicities, a measure known as the diversity index. This percentage actually falls to 24% for those SLPs who are under the age of 40. Overall, Virginia’s SLP workforce is considerably less diverse than the state’s general population, which has a diversity index of 55%.
30% of SLPs grew up in a rural area, and 20% of these professionals currently work in non-metro areas of the state.
Overall, 9% of Virginia’s SLPs currently work in a non-metro area. 44% of Virginia’s SLPs graduated from high school in Virginia, while 46% earned their initial professional degree in the state. In total, 55% of SLPs have some form of educational background in the state.
98% of all SLPs have a Master’s degree as their highest professional degree. 43% of SLPs currently carry education
debt, including 64% of those under the age of 40. The median debt burden for those SLPs with educational debt is between $40,000 and $50,000.
94% of all SLPs are currently employed in the profession. 59% of all SLPs hold one full-time position, while 19% hold
two or more positions simultaneously. Over the past year, 1% of SLPs have been involuntarily unemployed, while another 2% of SLPs have been underemployed. In addition, 7% of Virginia’s SLP workforce has switched jobs, while 64% have stayed at their primary work location for at least two years.
The typical SLP earned between $60,000 and $70,000 last year. 56% of all SLPs receive a salary at their primary work
location, while another 33% earn an hourly wage. Among those SLPs who earn either a salary or an hourly wage at their primary work location, 82% receive at least one employer-sponsored benefit, including 63% who receive health insurance. 95% of all SLPs are satisfied with their current employment situation, including 60% who indicate they are “very satisfied”.
75% of Virginia’s SLPs work in Northern Virginia, Central Virginia, or Hampton Roads. 40% of SLPs work for either a
state or local government, while another 38% works in the for-profit sector. Schools that provide care to clients employ 40% of all SLPs in the state, which makes it the most common working establishment type for Virginia’s SLP workforce.
A typical SLP spends approximately three-quarters of her time taking care of patients. In addition, 77% of SLPs serve a patient care role, meaning that at least 60% of their time is spent in patient care activities. The typical SLP will treat between 30 and 39 patients per week at her primary work location.
48% of all SLPs expect to retire by the age of 65. In addition, 4% of the current workforce expects to retire in the
next two years, while half of the current workforce expects to retire by 2046. Over the next two years, 10% of SLPs plan on increasing patient care activities, and 14% expect to pursue additional educational opportunities.

3
Summary of Trends
Although the number of licensed SLPs in Virginia actually fell slightly from 3,999 in 2015 to 3,997 in 2016, the number has increased by 585 since 2013. Virginia’s SLP workforce also increased from 3,015 in 2013 to 3,449 in 2016, although the increased number of workers produced fewer FTEs in the past year. The increase from 3,441 to 3,449 SLP workforce in Virginia between 2015 and 2016 did not result in the anticipated increase in FTEs. Rather, the FTE provided by Virginia’s SLP workforce declined from 2,647 in 2015 to 2,634 in 2016. However, both numbers are still higher than the 2,280 FTEs provided in 2013. The median age of Virginia’s SLP workforce has not changed significantly in the past four years. Since a one year drop in median age from 41 to 40 between 2013 and 2014, it has held steady at 41 years subsequently. However, there has been a change in the age distribution of the professionals indicating a younger SLP workforce. In 2013, 47% of all SLPs were under the age of 40, but this percentage increased to 48% in 2016. In addition, the percentage of SLPs who are age 55 or over decreased from 21% to 17% in the same period. The overall SLP workforce also became slightly more diverse as its diversity index increased from 24% to 25%. However, this trend reversed itself among SLPs who are under the age of 40. In 2013, the diversity index among SLPs who were under the age of 40 was 25% in 2013, but this percentage fell to 24% in 2016. Among all SLPs in Virginia, there was no change in the percentage who received a professional degree from a state institution. However, the percent receiving high school education from the state dropped from 45% in 2013 to 44% in 2014 and has remained at this percentage since then. The percent of SLPs working in rural area also dropped for the first time since 2013 from 10% to 9% in 2016. The financial situation of the typical SLP in the state improved during the year. Since 2013, the median annual income for a SLP has been between $50,000 and $60,000, but this increased to between $60,000 and $70,000 in 2016. However, SLPs were slightly less likely to receive an employer-sponsored work benefit in addition to their income. In 2013, 81% of SLPs received an employer-sponsored benefit, but this percentage decreased to 76% in 2016. However, with respect to employer-sponsored retirement plans, 55% had access to one in 2013, but 60% of SLPs had access to one in 2016. Education debts also cast a cloud on the improving financial landscape of the SLP workforce. Although the percent under age 40 carrying debt remains the same 64% it was in 2013, the percent overall carrying debt increased from 38% to 43% between 2013 and 2016. The debt distribution is also less favorable as the percent carrying $100,000 or more education debt increased from 3% to 5% in the overall population and from 5% to 9% in the population under age 40 between 2013 and 2016. There were some changes in the sectors in which SLPs worked in 2016. The percent working for state government and non-profit organizations increased from 36% and 19%, respectively, in 2013 to 40% and 21% in 2016. By contrast, those working for for-profit organization declined from 43% to 38%. The SLP labor market exhibited more stability during the year. For instance, the percentage of SLPs who were underemployed fell from 4% in 2013 to 2% in 2016. In addition, while 9% of SLPs switched jobs and 26% worked at a new location in 2013, these percentages fell to 7% and 21%, respectively, in 2016. At the same time, however, Virginia’s SLPs were more likely to remain at their jobs for the long term. For example, the percentage of SLPs who have remained at their primary work location for at least two years increased from 62% to 64%. In 2013, 47% of all SLPs expected to retire by the age of 65. In 2016, however, this percentage increased to 48%. At the same time, the percentage of SLPs who expect to retire by the age of 60 stayed at 18%. On the other hand, whereas 5% of all SLPs expected to retire within the next two years in 2013, only 4% expected to do the same in 2016. Meanwhile, the percentage of SLPs who expect to retire within the next ten years fell from 18% to 15% in the same period.

4

5
Survey Response Rates
A Closer Look:
Response Rates
Statistic Non
Respondents Respondent
Response Rate
By Age
Under 30 261 295 53%
30 to 34 121 551 82%
35 to 39 87 528 86%
40 to 44 68 492 88%
45 to 49 47 438 90%
50 to 54 46 299 87%
55 to 59 51 265 84%
60 and Over 115 333 74%
Total 796 3,201 80%
New Licenses
Issued in 2016 224 61 21%
Metro Status
Non-Metro 48 228 83%
Metro 544 2,559 83%
Not in Virginia 204 414 67%
Licensee Counts License Status # %
Renewing Practitioners
3,500 88%
New Licensees 285 7%
Non-Renewals 212 5%
All Licensees 3,997 100%
Response Rates Completed Surveys 3,201
Response Rate, all licensees 80%
Response Rate, Renewals 87%
At a Glance:
Licensed SLPs Number: 3,997 New: 7% Not Renewed: 5%
Survey Response Rates All Licensees: 80% Renewing Practitioners: 87%
Definitions
1. The Survey Period: The survey was conducted in December 2016.
2. Target Population: All SLPs who held a Virginia license at some point in 2016.
3. Survey Population: The survey was available to those who renewed their licenses online. It was not available to those who did not renew, including some SLPs newly licensed in 2016.
HWDC surveys tend to achieve very high response rates. 80% of renewing SLPs submitted a survey.
These represent 87% of SLPs who held a license at some point in 2016.
Source: Va. Healthcare Workforce Data Center
Source: Va. Healthcare Workforce Data Center
Source: Va. Healthcare Workforce Data Center
Source: Va. Healthcare Workforce Data Center
6
The Workforce
Virginia's SLP Workforce
Status # %
Worked in Virginia in Past Year
3,364 98%
Looking for Work in Virginia
85 2%
Virginia's Workforce
3,449 100%
Total FTEs 2,634
Licensees 3,997
At a Glance:
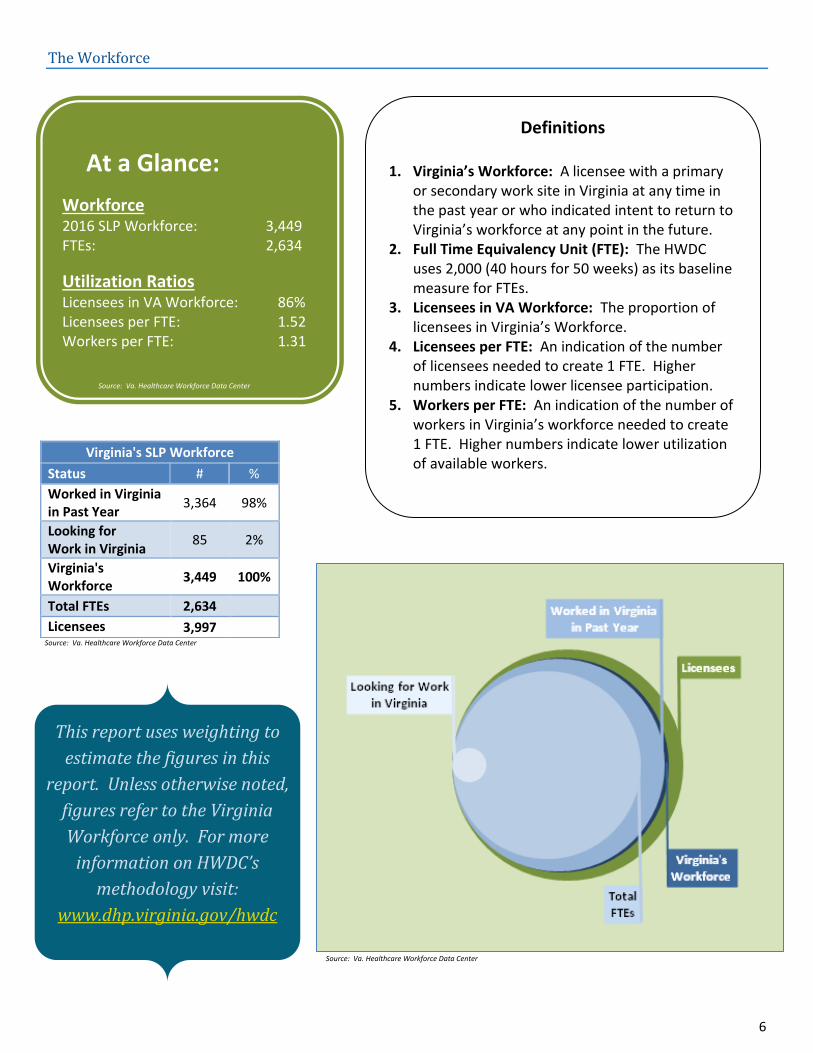
Workforce 2016 SLP Workforce: 3,449 FTEs: 2,634
Utilization Ratios Licensees in VA Workforce: 86% Licensees per FTE: 1.52 Workers per FTE: 1.31
Definitions
1. Virginia’s Workforce: A licensee with a primary or secondary work site in Virginia at any time in the past year or who indicated intent to return to Virginia’s workforce at any point in the future.
2. Full Time Equivalency Unit (FTE): The HWDC uses 2,000 (40 hours for 50 weeks) as its baseline measure for FTEs.
3. Licensees in VA Workforce: The proportion of licensees in Virginia’s Workforce.
4. Licensees per FTE: An indication of the number of licensees needed to create 1 FTE. Higher numbers indicate lower licensee participation.
5. Workers per FTE: An indication of the number of workers in Virginia’s workforce needed to create 1 FTE. Higher numbers indicate lower utilization of available workers.
This report uses weighting to
estimate the figures in this
report. Unless otherwise noted,
figures refer to the Virginia
Workforce only. For more
information on HWDC’s
methodology visit:
www.dhp.virginia.gov/hwdc
Source: Va. Healthcare Workforce Data Center
Source: Va. Healthcare Workforce Data Center
Source: Va. Healthcare Workforce Data Center

7
Demographics
A Closer Look:
Age & Gender
Age Male Female Total
# %
Male #
% Female
# % in Age
Group
Under 30 9 2% 467 98% 476 15%
30 to 34 6 1% 518 99% 524 17%
35 to 39 10 2% 480 98% 490 16%
40 to 44 15 4% 412 96% 427 14%
45 to 49 5 1% 376 99% 381 12%
50 to 54 12 5% 243 96% 255 8%
55 to 59 13 6% 212 94% 225 7%
60 + 11 4% 302 97% 313 10%
Total 81 3% 3,010 97% 3,091 100%
Race & Ethnicity
Race/ Ethnicity
Virginia* SLPs SLPs Under 40
% # % # %
White 63% 2,669 87% 1,301 87%
Black 19% 202 7% 94 6%
Asian 6% 63 2% 33 2%
Other Race 0% 22 1% 11 1% Two or more races
2% 38 1% 17 1%
Hispanic 9% 90 3% 37 2%
Total 100% 3,084 100% 1,493 100% *Population data in this chart is from the US Census, Annual Estimates of the Resident Population by Sex, Race, and Hispanic Origin for the United States, States, and Counties: July 1, 2014.
At a Glance:
Gender % Female: 97% % Under 40 Female: 98%
Age Median Age: 41 % Under 40: 48% % 55+: 17%
Diversity Diversity Index: 25% Under 40 Div. Index: 24%
In a chance encounter between two SLPs, there is a 25% chance that they would be of a different race/ethnicity (a measure known as the Diversity Index). For Virginia’s population as a whole, the diversity index is at 55%.
48% of SLPs are under the age of 40, and 98% of these professionals are female. In addition, the diversity index among SLPs who are under the age of 40 is 24%.
Source: Va. Healthcare Workforce Data Center
Source: Va. Healthcare Workforce Data Center
Source: Va. Healthcare Workforce Data Center
Source: Va. Healthcare Workforce Data Center

8
Background
A Closer Look:
Primary Location: USDA Rural Urban Continuum
Rural Status of Childhood Location
Code Description Rural Suburban Urban
Metro Counties
1 Metro, 1 million+ 23% 69% 9%
2 Metro, 250,000 to 1 million 51% 43% 6%
3 Metro, 250,000 or less 36% 57% 8%
Non-Metro Counties
4 Urban pop 20,000+, Metro adj
53% 40% 7%
6 Urban pop, 2,500-19,999, Metro adj
63% 31% 5%
7 Urban pop, 2,500-19,999, nonadj
82% 19% 0%
8 Rural, Metro adj 59% 36% 5%
9 Rural, nonadj 65% 35% 0%
Overall 30% 62% 8%
At a Glance:
Childhood Urban Childhood: 8% Rural Childhood: 30%
Virginia Background HS in Virginia: 44% Prof. Education in VA: 46% HS/Prof. Educ. in VA: 55%
Location Choice % Rural to Non-Metro: 20% % Urban/Suburban
to Non-Metro: 5%
30% of SLPs grew up in self-described rural areas, and 20% of
these professionals currently work in non-metro counties. Overall, 9% of Virginia’s SLP
workforce currently works in non-metro counties.
Source: Va. Healthcare Workforce Data Center
Source: Va. Healthcare Workforce Data Center
Source: Va. Healthcare Workforce Data Center

9
Top Ten States for SLP Recruitment
Rank
All Professionals
High School # Professional
School #
1 Virginia 1,347 Virginia 1,399
2 New York 223 Washington, D.C. 182
3 Pennsylvania 209 New York 169
4 Maryland 122 Pennsylvania 143
5 New Jersey 111 North Carolina 139
6 North Carolina 99 Tennessee 111
7 West Virginia 97 Maryland 106
8 Florida 90 Florida 86
9 Ohio 67 West Virginia 70
10 Outside
U.S./Canada 62 Ohio 69
Rank
Licensed in the Past 5 Years
High School # Professional
School #
1 Virginia 423 Virginia 451
2 Pennsylvania 94 New York 84
3 New York 86 Washington, D.C. 68
4 Maryland 53 Pennsylvania 62
5 North Carolina 47 North Carolina 60
6 New Jersey 47 Maryland 60
7 Florida 36 Florida 37
8 West Virginia 33 Tennessee 32
9 Illinois 28 Massachusetts 25
10 Ohio 27 West Virginia 25
44% of Virginia’s SLPs received their high school degree
in Virginia, and 46% received their initial professional degree in
the state.
At a Glance:
Not in VA Workforce Total: 550 % of Licensees: 14% Federal/Military: 5% Va Border State/DC: 29%
14% of licensed SLPs did not participate in Virginia’s workforce in 2016. 88% of these
professionals worked at some point in the past year, including 84% who currently work as SLPs.
Source: Va. Healthcare Workforce Data Center
Among SLPs who have been licensed in the past five years, 37% received their high school
degree in Virginia, and 40% received their initial professional
degree in the state.
Source: Va. Healthcare Workforce Data Center
Source: Va. Healthcare Workforce Data Center
Source: Va. Healthcare Workforce Data Center

10
Education
A Closer Look:
Highest Professional Degree Degree # %
Masters Degree 2,989 98%
Doctorate - SLP 41 1%
Other Doctorate 18 1%
Total 3,048 100%
Educational Debt
Amount Carried All SLPs SLPs Under 40
# % # %
None 1,573 57% 483 36%
Less than $10,000 145 5% 95 7%
$10,000-$19,999 153 6% 100 7%
$20,000-$29,999 150 5% 105 8%
$30,000-$39,999 136 5% 102 8%
$40,000-$49,999 120 4% 81 6%
$50,000-$59,999 99 4% 73 5%
$60,000-$69,999 69 2% 56 4%
$70,000-$79,999 71 3% 57 4%
$80,000-$89,999 57 2% 50 4%
$90,000-$99,999 43 2% 35 3%
$100,000 or More 149 5% 117 9%
Total 2,766 100% 1,356 100%
At a Glance:
Education Masters: 98% Doctorate: 2%
Educational Debt Carry debt: 43% Under age 40 w/ debt: 64% Median debt: $40k-$50k
43% of SLPs currently have educational debt, including 64% of
those under the age of 40. For those with educational debt, the median debt amount is between
$40,000 and $50,000.
Source: Va. Healthcare Workforce Data Center
Source: Va. Healthcare Workforce Data Center
98% of all SLPs hold a Masters as their highest professional degree.
Source: Va. Healthcare Workforce Data Center
Source: Va. Healthcare Workforce Data Center
11
Specializations & Credentials
A Closer Look:
Credentials
Credential # % of
Workforce
CCC-SLP: Speech-Language Pathology
2,790 81%
VitalStim Certified 492 14%
DOE Endorsement 77 2%
CBIS - Certified Brain Injury Specialist
21 1%
CF-SLP: Fellowship 15 < 1%
BRS-S: Swallowing 6 < 1%
CCC-A: Audiology 4 < 1%
BRS-CL: Child Language 2 < 1%
BRS-FD: Fluency Disorders 2 < 1%
Other 139 4%
At Least One Credential 2,877 83%
Self-Designated Specialties
Specialty # % of
Workforce
Swallowing & Swallowing Disorders
948 27%
School/Pediatrics 923 27%
Child Language 922 27%
Autism 778 23%
Child/Infant 557 16%
Geriatrics 539 16%
Medical 421 12%
Brain Injury 363 11%
Voice 238 7%
Fluency Disorders 235 7%
Deaf and Hard of Hearing 156 5%
Other 275 8%
At Least One Specialty 2,241 65%
At a Glance:
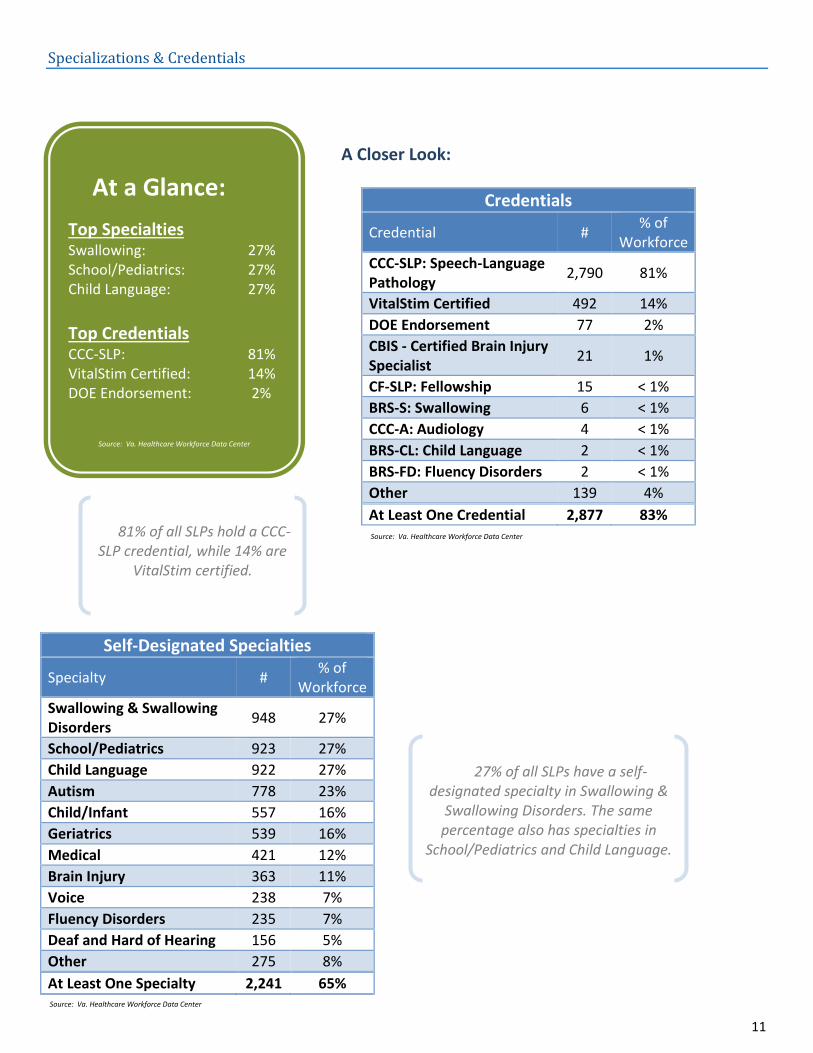
Top Specialties Swallowing: 27% School/Pediatrics: 27% Child Language: 27%
Top Credentials CCC-SLP: 81% VitalStim Certified: 14% DOE Endorsement: 2%
Source: Va. Healthcare Workforce Data Center
Source: Va. Healthcare Workforce Data Center
Source: Va. Healthcare Workforce Data Center
27% of all SLPs have a self-designated specialty in Swallowing &
Swallowing Disorders. The same percentage also has specialties in
School/Pediatrics and Child Language.
81% of all SLPs hold a CCC-SLP credential, while 14% are
VitalStim certified.

12
Current Employment Situation
A Closer Look:
Current Work Status Status # %
Employed, capacity unknown 1 < 1%
Employed in a SLP-related capacity 2,887 94%
Employed, NOT in a SLP-related capacity
54 2%
Not working, reason unknown 0 0%
Involuntarily unemployed 5 < 1%
Voluntarily unemployed 100 3%
Retired 22 1%
Total 3,070 100%
Current Positions Positions # %
No Positions 127 4%
One Part-Time Position 526 17%
Two Part-Time Positions 145 5%
One Full-Time Position 1,801 59%
One Full-Time Position & One Part-Time Position
354 12%
Two Full-Time Positions 0 0%
More than Two Positions 74 2%
Total 3,027 100%
Current Weekly Hours Hours # %
0 hours 127 4%
1 to 9 hours 116 4%
10 to 19 hours 170 6%
20 to 29 hours 244 8%
30 to 39 hours 736 25%
40 to 49 hours 1,319 44%
50 to 59 hours 211 7%
60 to 69 hours 65 2%
70 to 79 hours 10 0%
80 or more hours 6 < 1%
Total 3,004 100%
At a Glance:
Employment Employed in Profession: 94% Involuntarily Unemployed: < 1%
Positions Held 1 Full-time: 59% 2 or More Positions: 19%
Weekly Hours: 40 to 49: 44% 60 or more: 3% Less than 30: 18%
94% of licensed SLPs are currently employed in the profession. 59% of SLPs have one full-time job, and 44% of SLPs work
between 40 and 49 hours per week.
Source: Va. Healthcare Workforce Data Center
Source: Va. Healthcare Workforce Data Center
Source: Va. Healthcare Workforce Data Center
Source: Va. Healthcare Workforce Data Center
13
Employment Quality
A Closer Look:
Income Hourly Wage # %
Volunteer Work Only 23 1%
Less than $20,000 138 6%
$20,000-$29,999 97 4%
$30,000-$39,999 157 6%
$40,000-$49,999 324 13%
$50,000-$59,999 493 20%
$60,000-$69,999 473 19%
$70,000-$79,999 337 13%
$80,000-$89,999 251 10%
$90,000-$99,999 138 6%
$100,000-$109,999 58 2%
$110,000-$119,999 17 1%
$120,000 or More 14 1%
Total 2,521 100%
Job Satisfaction Level # %
Very Satisfied 1,766 60%
Somewhat Satisfied 1,045 35%
Somewhat Dissatisfied 107 4%
Very Dissatisfied 34 1%
Total 2,951 100%
Employer-Sponsored Benefits
Benefit # % % of Wage/Salary
Employees
Paid Sick Leave 1,749 61% 66%
Retirement 1,738 60% 65%
Health Insurance 1,680 58% 63%
Dental Insurance 1,591 55% 60%
Paid Vacation 1,590 55% 61%
Group Life Insurance 1,030 36% 39%
Signing/Retention Bonus 175 6% 7%
Receive At Least One Benefit 2,191 76% 82% *From any employer at time of survey.
At a Glance:
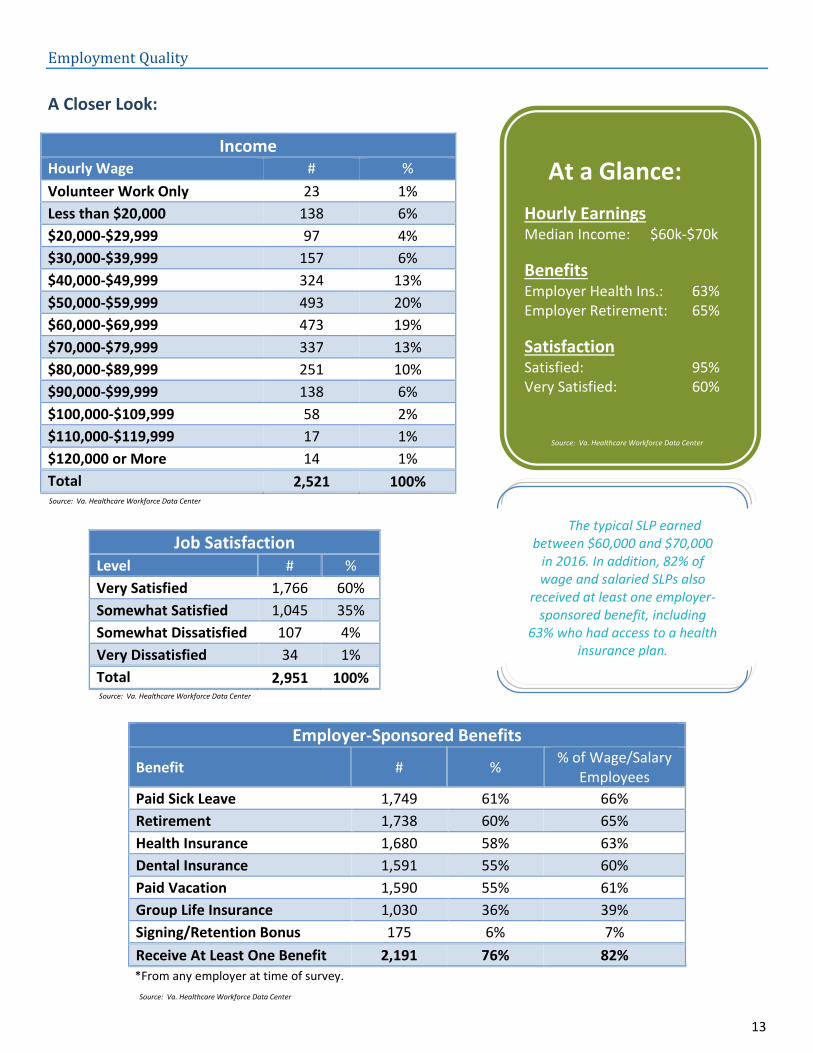
Hourly Earnings Median Income: $60k-$70k
Benefits Employer Health Ins.: 63% Employer Retirement: 65%
Satisfaction Satisfied: 95% Very Satisfied: 60%
Source: Va. Healthcare Workforce Data Center
The typical SLP earned between $60,000 and $70,000
in 2016. In addition, 82% of wage and salaried SLPs also
received at least one employer-sponsored benefit, including
63% who had access to a health insurance plan.
Source: Va. Healthcare Workforce Data Center
Source: Va. Healthcare Workforce Data Center
Source: Va. Healthcare Workforce Data Center
14
2016 Labor Market
A Closer Look:
1
1 As reported by the US Bureau of Labor Statistics. The non-seasonally adjusted monthly unemployment rate ranged from 4.2% in January 2016 to 3.8% in December 2016.
Underemployment in Past Year In the past year did you . . .? # %
Experience Involuntary Unemployment? 23 1%
Experience Voluntary Unemployment? 209 6%
Work Part-time or temporary positions, but would have preferred a full-time/permanent position?
78 2%
Work two or more positions at the same time? 678 20%
Switch employers or practices? 256 7%
Experienced at least one 1,026 30%
Location Tenure
Tenure Primary Secondary
# % # %
Not Currently Working at this Location
54 2% 41 6%
Less than 6 Months 227 8% 107 14%
6 Months to 1 Year 178 6% 91 12%
1 to 2 Years 573 20% 184 25%
3 to 5 Years 722 25% 162 22%
6 to 10 Years 494 17% 85 12%
More than 10 Years 655 23% 68 9%
Subtotal 2,903 100% 739 100%
Did not have location 99
2,682
Item Missing 447
28
Total 3,449
3,449
Employment Type
Primary Work Site # %
Salary/Commission 1,333 56%
Hourly Wage 792 33%
By Contract/Per Diem 207 9%
Business/Practice Income
54 2%
Unpaid 6 < 1%
Subtotal 2,392 100%
At a Glance:
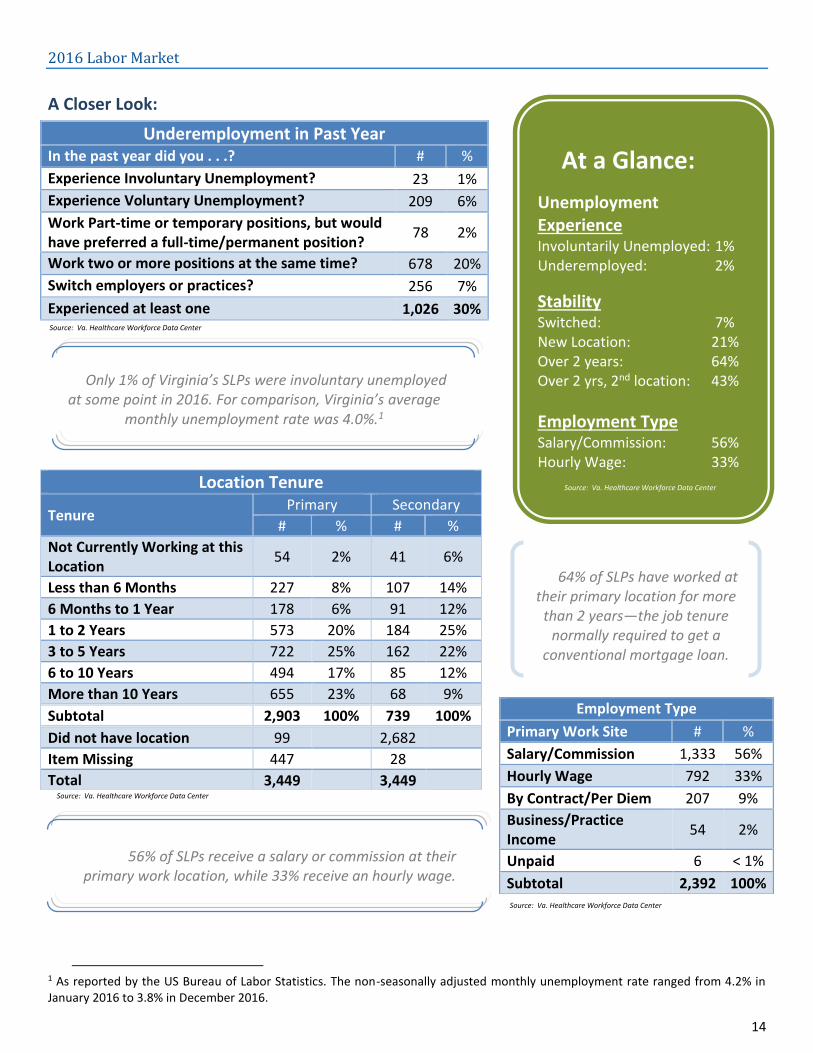
Unemployment Experience Involuntarily Unemployed: 1% Underemployed: 2%
Stability Switched: 7% New Location: 21% Over 2 years: 64% Over 2 yrs, 2nd location: 43%
Employment Type Salary/Commission: 56% Hourly Wage: 33% Hourly Wage: 72%
Only 1% of Virginia’s SLPs were involuntary unemployed at some point in 2016. For comparison, Virginia’s average
monthly unemployment rate was 4.0%.1
64% of SLPs have worked at their primary location for more
than 2 years—the job tenure normally required to get a
conventional mortgage loan.
56% of SLPs receive a salary or commission at their primary work location, while 33% receive an hourly wage.
Source: Va. Healthcare Workforce Data Center
Source: Va. Healthcare Workforce Data Center
Source: Va. Healthcare Workforce Data Center
Source: Va. Healthcare Workforce Data Center

15
Work Site Distribution
A Closer Look:
Regional Distribution of Work Locations
COVF Region
Primary Location
Secondary Location
# % # %
Central 603 21% 131 17%
Eastern 35 1% 9 1%
Hampton Roads 586 20% 131 17%
Northern 985 34% 254 34%
Southside 92 3% 24 3%
Southwest 130 4% 34 5%
Valley 167 6% 40 5%
West Central 258 9% 60 8%
Virginia Border State/DC
25 1% 26 3%
Other US State 17 1% 41 5%
Outside of the US 1 0% 0 0%
Total 2,899 100% 750 100%
Item Missing 451
16
Number of Work Locations
Locations
Work Locations in
2016
Work Locations
Now*
# % # %
0 85 3% 127 4%
1 2,139 72% 2,158 72%
2 411 14% 398 13%
3 246 8% 251 8%
4 59 2% 25 1%
5 13 0% 7 0%
6 or More
35 1% 22 1%
Total 2,988 100% 2,988 100% *At the time of survey completion, December 2016.
At a Glance:
Concentration Top Region: 34% Top 3 Regions: 75% Lowest Region: 1%
Locations 2 or more (2016): 26% 2 or more (Now*): 24%
75% of all SLPs work in Northern Virginia, Central Virginia, and
Hampton Roads.
Source: Va. Healthcare Workforce Data Center
Source: Va. Healthcare Workforce Data Center
24% of SLPs currently have multiple work locations, while
26% of SLPs had at least two work locations in the past year.
Source: Va. Healthcare Workforce Data Center

16
Establishment Type
A Closer Look:
Location Sector
Sector
Primary Location
Secondary Location
# % # %
For-Profit 1,046 38% 498 69%
Non-Profit 587 21% 123 17%
State/Local Government 1,097 40% 101 14%
Veterans Administration 13 0% 0 0%
U.S. Military 5 0% 0 0%
Other Federal Gov’t 9 0% 2 0%
Total 2,757 100% 724 100%
Did not have location 99
2682
Item Missing 593
42
At a Glance: (Primary Locations)
Sector For Profit: 38% Federal: 1%
Top Establishments School (Providing Care To Clients): 40% Skilled Nursing Facility: 10% Private Practice (Group): 9%
40% of all SLPs work for a state or local government, while another 38% work in
the for-profit sector.
Source: Va. Healthcare Workforce Data Center
Source: Va. Healthcare Workforce Data Center
Source: Va. Healthcare Workforce Data Center

17
Top 10 Location Type
Establishment Type
Primary Location
Secondary Location
# % # %
School (Providing Care to Clients) 1,077 40% 74 11%
Skilled Nursing Facility 270 10% 119 17%
Private Practice, Group 238 9% 84 12%
Hospital, Inpatient Department 204 8% 80 11%
Hospital, Outpatient Department 196 7% 18 3%
Home Health Care 157 6% 102 14%
Rehabilitation Facility 139 5% 43 6%
Private Practice, Solo 102 4% 70 10%
Academic Institution (Teaching Health Professions Students or Research)
69 3% 18 3%
Community-Based Clinic or Health Center
42 2% 6 1%
Residential Facility/Group Home 34 1% 17 2%
Administrative/Business Organization
13 < 1% 4 1%
Child Day Care 2 < 1% 5 1%
Physician Office 0 0% 2 < 1%
Other 128 5% 62 9%
Total 2,671 100% 704 100%
Did Not Have a Location 99 2682
Among SLPs who also have a secondary work location, skilled nursing facilities are the most common establishment type,
employing 17% of the state’s SLP workforce.
Schools that provide care to clients are the most
common establishment type among SLPs with a primary
work location, employing 40% of Virginia’s SLP workforce.
Source: Va. Healthcare Workforce Data Center
Source: Va. Healthcare Workforce Data Center

18
Time Allocation
A Closer Look:
Time Allocation
Time Spent
Client Care Admin. Non-Clinical Education
Professional Education
Research Other
Prim Site
Sec. Site
Prim Site
Sec. Site
Prim Site
Sec. Site
Prim Site
Sec. Site
Prim Site
Sec. Site
Prim Site
Sec. Site
All or Almost All (80-100%)
43% 66% 3% 4% 0% 2% 0% 1% 0% 0% 0% 2%
Most (60-79%)
34% 16% 3% 1% 0% 1% 0% 0% 0% 0% 0% 0%
About Half (40-59%)
12% 5% 7% 4% 0% 0% 0% 1% 0% 0% 1% 0%
Some (20-39%)
5% 3% 24% 11% 3% 1% 2% 1% 0% 0% 3% 2%
A Little (1-19%)
3% 3% 45% 44% 37% 14% 28% 13% 10% 6% 24% 15%
None (0%)
2% 7% 19% 37% 58% 82% 69% 84% 90% 94% 72% 81%
At a Glance: (Primary Locations)
Typical Time Allocation Client Care: 70%-79% Administration: 10%-19%
Roles Client Care: 77% Administration: 6% Non-Clinical Edu.: 1%
Patient Care SLPs Median Admin. Time: 1%-9% Ave. Admin. Time: 10%-19%
The typical SLP spends around three-quarters of her time treating patients. In fact, 77% of SLPs fill a client care role, defined as spending 60% or more of their time in that activity.
Source: Va. Healthcare Workforce Data Center
Source: Va. Healthcare Workforce Data Center
Source: Va. Healthcare Workforce Data Center

19
Patient Workload
A Closer Look:
2 This column estimates the total number of client sessions across both primary and secondary work locations.
Client Sessions /
Week
Primary Work Location
Secondary Work Location
Total2
# % # % # %
None 121 4% 52 7% 106 4%
1-9 452 16% 440 60% 334 12%
10-19 336 12% 76 10% 341 12%
20-29 366 13% 64 9% 380 14%
30-39 264 9% 29 4% 275 10%
40-49 151 5% 15 2% 173 6%
50-59 255 9% 14 2% 250 9%
60-69 118 4% 6 1% 129 5%
70-79 42 1% 3 < 1% 63 2%
80-89 208 7% 18 2% 211 8%
90-99 83 3% 3 < 1% 86 3%
100 or More 405 14% 10 1% 452 16%
Total 2,801 100% 730 100% 2,800 100%
# of Weekly Sessions
Primary Work Location Secondary Work Location
Individual Sessions Group Sessions Individual Sessions Group Sessions
# % # % # % # %
None 142 5% 1,415 51% 61 8% 588 81%
1-9 1,153 41% 414 15% 523 72% 97 13%
10-19 632 23% 335 12% 94 13% 19 3%
20-29 385 14% 315 11% 26 4% 20 3%
30-39 264 9% 175 6% 7 1% 2 < 1%
40-49 113 4% 81 3% 8 1% 0 0%
50-59 71 3% 28 1% 3 < 1% 1 < 1%
60-69 19 1% 5 < 1% 6 1% 0 0%
70-79 5 < 1% 1 < 1% 0 0% 0 0%
80 or more 10 < 1% 5 < 1% 4 1% 1 < 1%
Total 2,795 100% 2,775 100% 730 100% 728 100%
At a Glance:
Weekly Session Totals (Median) Primary Location: 30-39 Secondary Location: 1-9 Total 30-39
% with Group Sessions Primary Location: 49% Secondary Location: 19%
Source: Va. Healthcare Workforce Data Center
Source: Va. Healthcare Workforce Data Center
Source: Va. Healthcare Workforce Data Center
A typical SLP has approximately 30 to 39 client sessions per week across both their primary and secondary work locations
20
Retirement & Future Plans
A Closer Look:
Retirement Expectations
Expected Retirement Age
All Over 50
# % # %
Under age 50 45 2% - -
50 to 54 87 3% 5 1%
55 to 59 352 13% 48 7%
60 to 64 766 29% 166 25%
65 to 69 979 37% 306 47%
70 to 74 231 9% 71 11%
75 to 79 50 2% 19 3%
80 or over 15 1% 4 1%
I do not intend to retire 97 4% 33 5%
Total 2,621 100% 652 100%
Future Plans
2 Year Plans: # %
Decrease Participation
Leave Profession 53 2%
Leave Virginia 140 4%
Decrease Client Care Hours 165 5%
Decrease Teaching Hours 15 < 1%
Increase Participation
Increase Client Care Hours 340 10%
Increase Teaching Hours 101 3%
Pursue Additional Education 468 14%
Return to Virginia’s Workforce 43 1%
At a Glance:
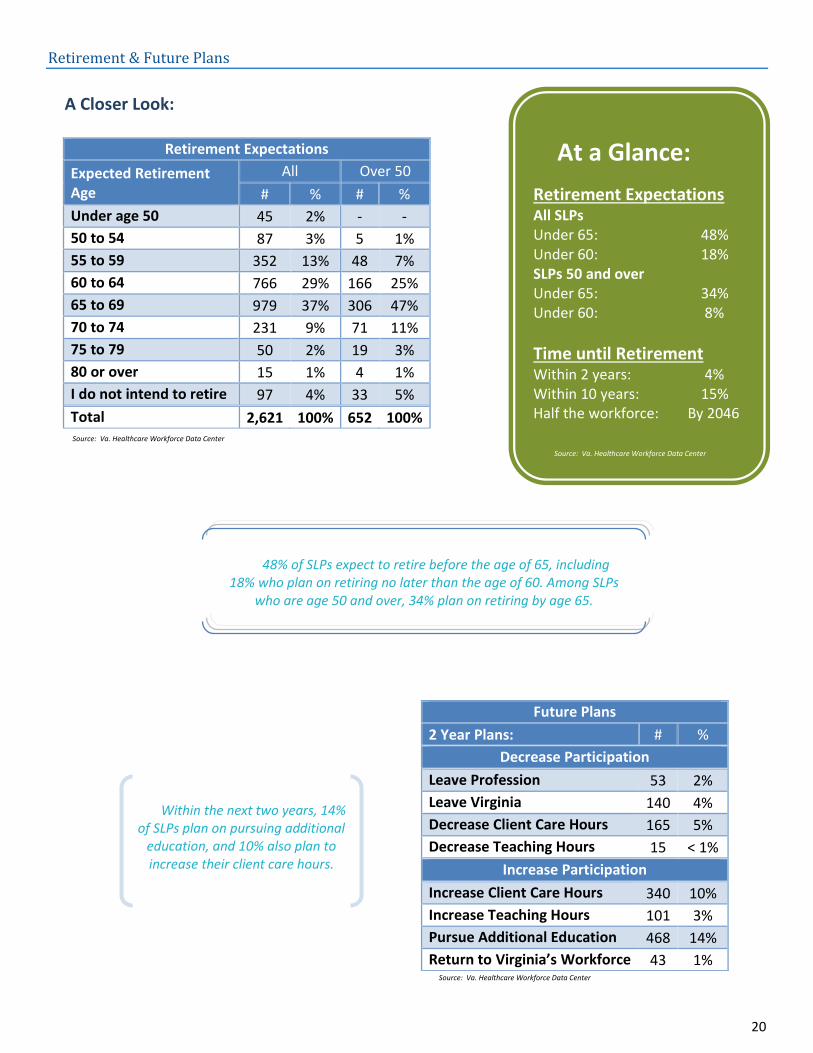
Retirement Expectations All SLPs Under 65: 48% Under 60: 18% SLPs 50 and over Under 65: 34% Under 60: 8%
Time until Retirement Within 2 years: 4% Within 10 years: 15% Half the workforce: By 2046
48% of SLPs expect to retire before the age of 65, including 18% who plan on retiring no later than the age of 60. Among SLPs
who are age 50 and over, 34% plan on retiring by age 65.
Within the next two years, 14% of SLPs plan on pursuing additional
education, and 10% also plan to increase their client care hours.
Source: Va. Healthcare Workforce Data Center
Source: Va. Healthcare Workforce Data Center
Source: Va. Healthcare Workforce Data Center
21
Time to Retirement
Expect to retire within. . . # % Cumulative
%
2 years 101 4% 4%
5 years 70 3% 7%
10 years 211 8% 15%
15 years 209 8% 23%
20 years 330 13% 35%
25 years 332 13% 48%
30 years 383 15% 62%
35 years 408 16% 78%
40 years 324 12% 90%
45 years 112 4% 95%
50 years 36 1% 96%
55 years 2 0% 96%
In more than 55 years 5 0% 96%
Do not intend to retire 97 4% 100%
Total 2,621 100%
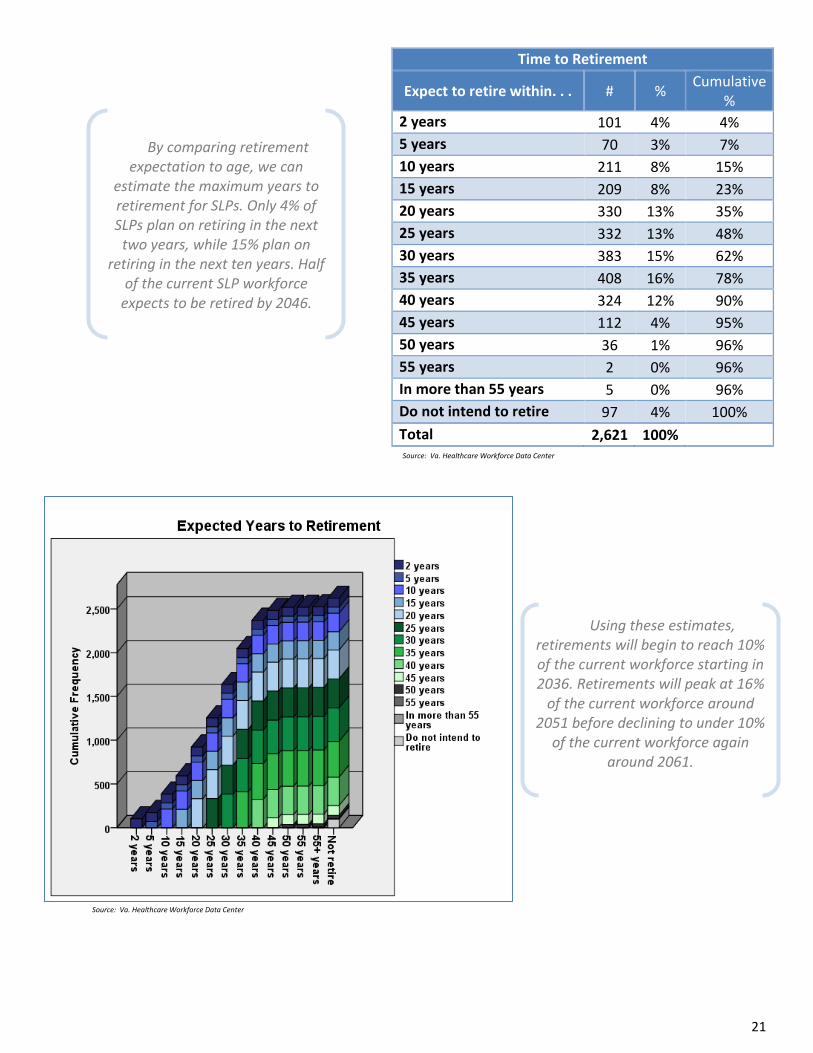
By comparing retirement expectation to age, we can
estimate the maximum years to retirement for SLPs. Only 4% of SLPs plan on retiring in the next
two years, while 15% plan on retiring in the next ten years. Half
of the current SLP workforce expects to be retired by 2046.
Source: Va. Healthcare Workforce Data Center
Using these estimates, retirements will begin to reach 10% of the current workforce starting in 2036. Retirements will peak at 16%
of the current workforce around 2051 before declining to under 10%
of the current workforce again around 2061.
Source: Va. Healthcare Workforce Data Center

22
Full-Time Equivalency Units
A Closer Look: 3
3 Due to assumption violations in Mixed between-within ANOVA (Levene’s Test was significant).
Full-Time Equivalency Units
Average Median
Age
Under 30 0.79 0.83
30 to 34 0.80 0.84
35 to 39 0.74 0.80
40 to 44 0.77 0.76
45 to 49 0.75 0.76
50 to 54 0.86 0.93
55 to 59 0.88 0.96
60 and Over
0.75 0.74
Gender
Male 0.93 1.05
Female 0.78 0.83
At a Glance:
FTEs Total: 2,634 FTEs/1,000 Residents: 0.316 Average: 0.79
Age & Gender Effect Age, Partial Eta2: Negligible Gender, Partial Eta2: Negligible
Partial Eta2 Explained: Partial Eta2 is a statistical
measure of effect size.
The typical SLP provided 0.81 FTEs in 2016, or approximately 32 hours per week for 50 weeks. Although FTEs appear to vary by gender, statistical tests did not verify that a difference exists.3
Source: Va. Healthcare Workforce Data Center
Source: Va. Healthcare Workforce Data Center
Source: Va. Healthcare Workforce Data Center
Source: Va. Healthcare Workforce Data Center

23
Maps
Council on Virginia’s Future Regions

24
Area Health Education Center Regions

25
Workforce Investment Areas

26
Health Services Areas

27
Planning Districts
28
Appendix
Weights
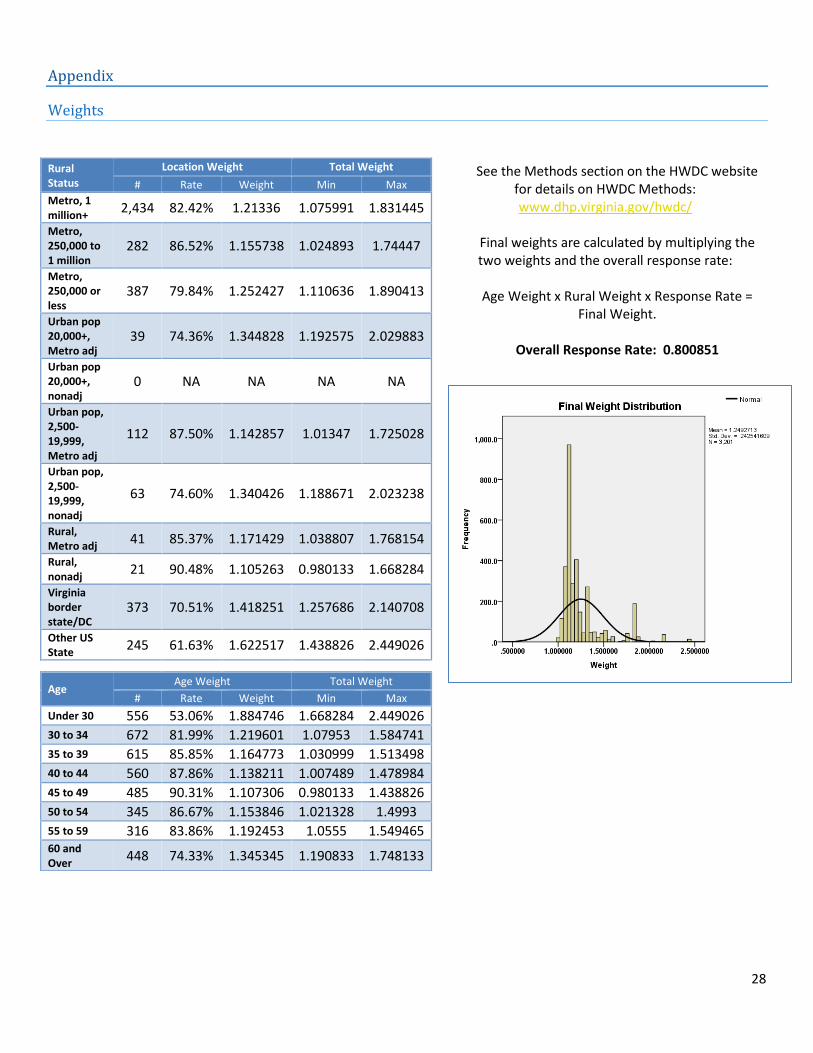
See the Methods section on the HWDC website for details on HWDC Methods: www.dhp.virginia.gov/hwdc/
Final weights are calculated by multiplying the two weights and the overall response rate:
Age Weight x Rural Weight x Response Rate =
Final Weight.
Overall Response Rate: 0.800851
Rural Status
Location Weight Total Weight
# Rate Weight Min Max
Metro, 1 million+
2,434 82.42% 1.21336 1.075991 1.831445
Metro, 250,000 to 1 million
282 86.52% 1.155738 1.024893 1.74447
Metro, 250,000 or less
387 79.84% 1.252427 1.110636 1.890413
Urban pop 20,000+, Metro adj
39 74.36% 1.344828 1.192575 2.029883
Urban pop 20,000+, nonadj
0 NA NA NA NA
Urban pop, 2,500-19,999, Metro adj
112 87.50% 1.142857 1.01347 1.725028
Urban pop, 2,500-19,999, nonadj
63 74.60% 1.340426 1.188671 2.023238
Rural, Metro adj
41 85.37% 1.171429 1.038807 1.768154
Rural, nonadj
21 90.48% 1.105263 0.980133 1.668284
Virginia border state/DC
373 70.51% 1.418251 1.257686 2.140708
Other US State
245 61.63% 1.622517 1.438826 2.449026
Age Age Weight Total Weight
# Rate Weight Min Max
Under 30 556 53.06% 1.884746 1.668284 2.449026 30 to 34 672 81.99% 1.219601 1.07953 1.584741 35 to 39 615 85.85% 1.164773 1.030999 1.513498 40 to 44 560 87.86% 1.138211 1.007489 1.478984 45 to 49 485 90.31% 1.107306 0.980133 1.438826
50 to 54 345 86.67% 1.153846 1.021328 1.4993 55 to 59 316 83.86% 1.192453 1.0555 1.549465 60 and Over
448 74.33% 1.345345 1.190833 1.748133