
Virginia’s Certified Nurse Aide Workforce: · PDF fileSchool of Nursing Michael...
30
Virginia’s Certified Nurse Aide Workforce: 2012 Healthcare Workforce Data Center June 2013 Virginia Department of Health Professions Healthcare Workforce Data Center Perimeter Center 9960 Mayland Drive, Suite 300 Richmond, VA 23233 804-367-2115, 804-527-4466(fax) E-mail: [email protected] Follow us on Tumblr: www.vahwdc.tumblr.com
Transcript of Virginia’s Certified Nurse Aide Workforce: · PDF fileSchool of Nursing Michael...
Virginia’s Certified Nurse Aide Workforce: 2012
Healthcare Workforce Data Center
June 2013
Virginia Department of Health Professions Healthcare Workforce Data Center
Perimeter Center 9960 Mayland Drive, Suite 300
Richmond, VA 23233 804-367-2115, 804-527-4466(fax) E-mail: [email protected]
Follow us on Tumblr: www.vahwdc.tumblr.com

Healthcare Workforce Data Center Advisory Council1 Jeffrey S. Cribbs, Sr., Chair President & CEO Richmond Memorial Health Foundation
Christopher Bailey Senior Vice President, Virginia Hospital and Healthcare Association
The Honorable George Barker Senate of Virginia
Peter Blake Vice Chancellor for Workforce Services Virginia Community College System
Arthur Garson, Jr., MD, MPH Vice President and Provost University of Virginia
JoAnne Kirk Henry, EdD, RNC Emerita Faculty Virginia Commonwealth University School of Nursing
Michael Jurgensen Senior VP, Health Policy & Planning Medical Society of Virginia
Timothy O. Kestner, MLA Economist, Virginia Employment Commission
Daniel G. LeBlanc Senior Advisor to the Governor for Workforce
William L. Lukhard Executive Council, AARP
P. J. Maddox Professor and Chair, Health Administration and Policy George Mason University
Tod Massa Director of Policy Research and Data Warehousing State Council of Higher Education in Virginia
Susan Motley, CEO Virginia Nurses Association
The Honorable John O’Bannon, III Virginia House of Delegates
Sandra Whitley Ryals Director, Virginia Department of Health Professions
David C. Sarrett, DMD, MS Program Director, Area Health Education Centers (AHEC) Associate Vice President for Health Sciences Virginia Commonwealth University
The Honorable Marilyn Tavenner Secretary of Health and Human Resources
Kathy H. Wibberly, Ph.D. Director, Division of Primary Care and Rural Health Office of Minority Health and Public Health Policy Virginia Department of Health
1 Members in place in 2009 during survey development.
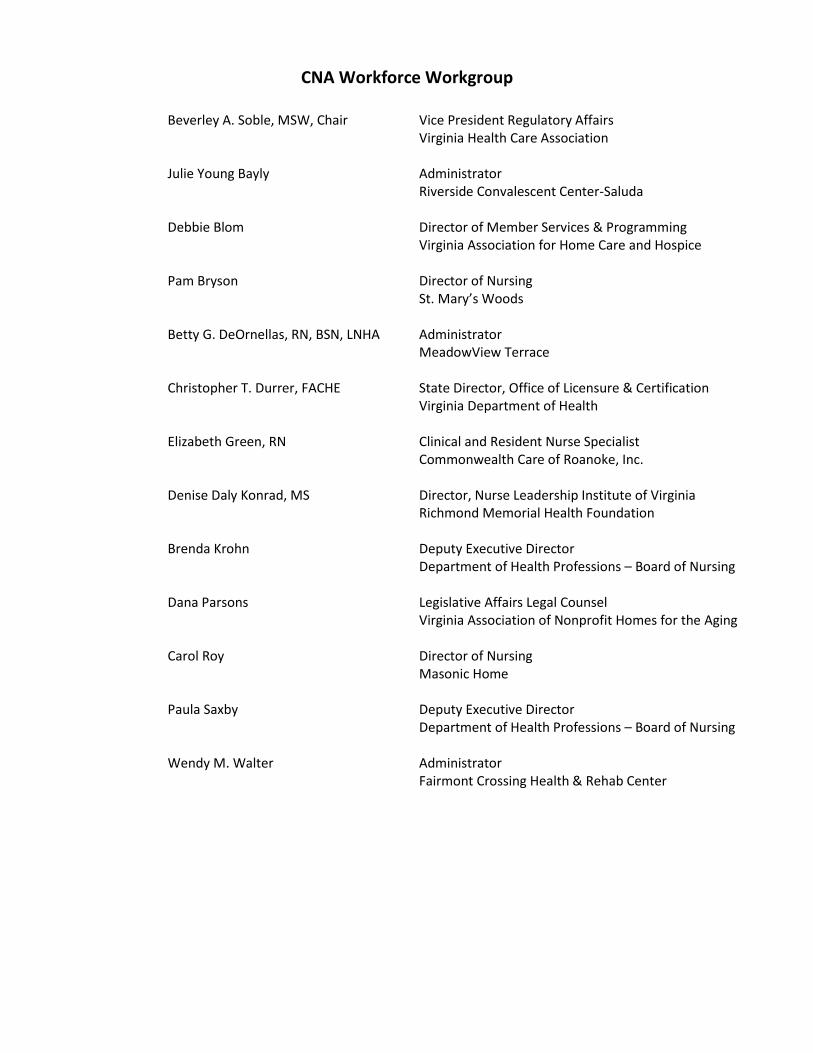
CNA Workforce Workgroup
Beverley A. Soble, MSW, Chair Vice President Regulatory Affairs Virginia Health Care Association Julie Young Bayly Administrator Riverside Convalescent Center-Saluda Debbie Blom Director of Member Services & Programming Virginia Association for Home Care and Hospice Pam Bryson Director of Nursing St. Mary’s Woods Betty G. DeOrnellas, RN, BSN, LNHA Administrator MeadowView Terrace Christopher T. Durrer, FACHE State Director, Office of Licensure & Certification Virginia Department of Health Elizabeth Green, RN Clinical and Resident Nurse Specialist Commonwealth Care of Roanoke, Inc. Denise Daly Konrad, MS Director, Nurse Leadership Institute of Virginia Richmond Memorial Health Foundation Brenda Krohn Deputy Executive Director Department of Health Professions – Board of Nursing Dana Parsons Legislative Affairs Legal Counsel Virginia Association of Nonprofit Homes for the Aging Carol Roy Director of Nursing Masonic Home Paula Saxby Deputy Executive Director Department of Health Professions – Board of Nursing Wendy M. Walter Administrator Fairmont Crossing Health & Rehab Center

Virginia Department of Health Professions
Dianne L. Reynolds-Cane, M.D. Director
Arne W. Owens
Chief Deputy Director
HWDC Staff:
Dr. Elizabeth Carter, Ph.D. Executive Director
Justin Crow, MPA Research Analyst
Laura Jackson Operations Manager
Christopher Coyle Research Assistant
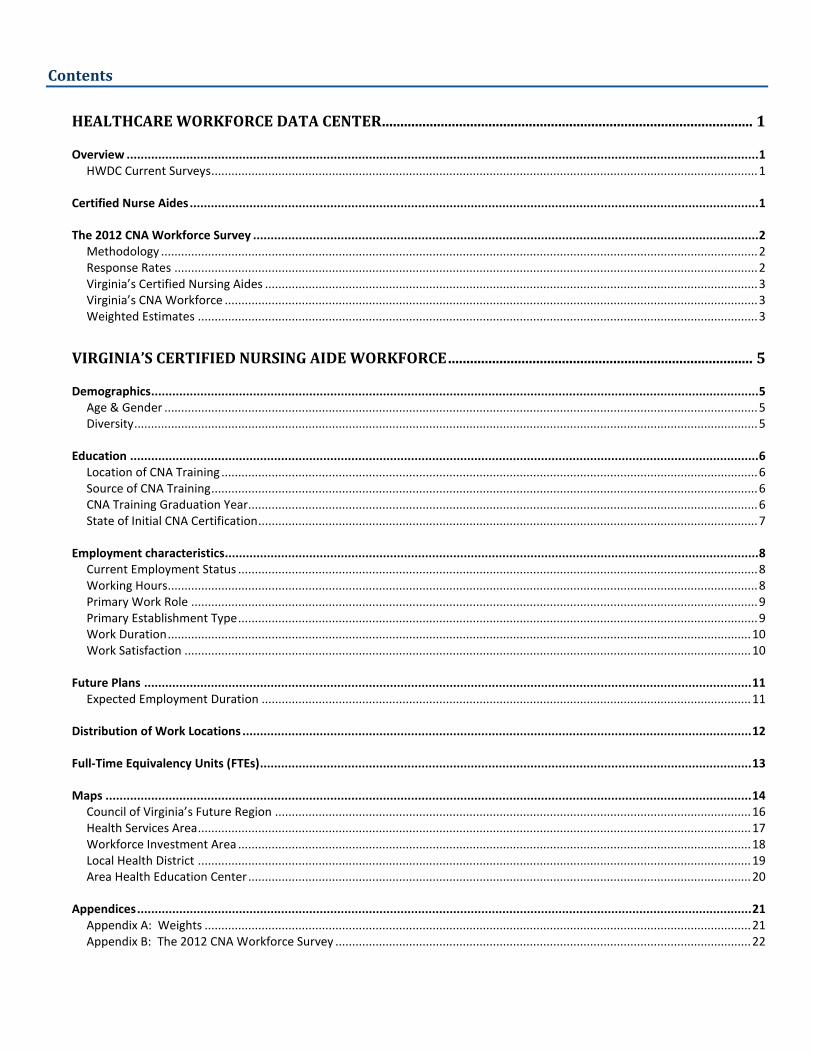
Contents
HEALTHCARE WORKFORCE DATA CENTER ..................................................................................................... 1
Overview .................................................................................................................................................................................... 1 HWDC Current Surveys ................................................................................................................................................................... 1
Certified Nurse Aides .................................................................................................................................................................. 1
The 2012 CNA Workforce Survey ................................................................................................................................................ 2 Methodology .................................................................................................................................................................................. 2 Response Rates .............................................................................................................................................................................. 2 Virginia’s Certified Nursing Aides ................................................................................................................................................... 3 Virginia’s CNA Workforce ............................................................................................................................................................... 3 Weighted Estimates ....................................................................................................................................................................... 3
VIRGINIA’S CERTIFIED NURSING AIDE WORKFORCE ................................................................................... 5
Demographics ............................................................................................................................................................................. 5 Age & Gender ................................................................................................................................................................................. 5 Diversity .......................................................................................................................................................................................... 5
Education ................................................................................................................................................................................... 6 Location of CNA Training ................................................................................................................................................................ 6 Source of CNA Training ................................................................................................................................................................... 6 CNA Training Graduation Year........................................................................................................................................................ 6 State of Initial CNA Certification ..................................................................................................................................................... 7
Employment characteristics........................................................................................................................................................ 8 Current Employment Status ........................................................................................................................................................... 8 Working Hours ................................................................................................................................................................................ 8 Primary Work Role ......................................................................................................................................................................... 9 Primary Establishment Type ........................................................................................................................................................... 9 Work Duration .............................................................................................................................................................................. 10 Work Satisfaction ......................................................................................................................................................................... 10
Future Plans ............................................................................................................................................................................. 11 Expected Employment Duration .................................................................................................................................................. 11
Distribution of Work Locations ................................................................................................................................................. 12
Full-Time Equivalency Units (FTEs) ............................................................................................................................................ 13
Maps ........................................................................................................................................................................................ 14 Council of Virginia’s Future Region .............................................................................................................................................. 16 Health Services Area ..................................................................................................................................................................... 17 Workforce Investment Area ......................................................................................................................................................... 18 Local Health District ..................................................................................................................................................................... 19 Area Health Education Center ...................................................................................................................................................... 20
Appendices ............................................................................................................................................................................... 21 Appendix A: Weights ................................................................................................................................................................... 21 Appendix B: The 2012 CNA Workforce Survey ............................................................................................................................ 22
1
Healthcare Workforce Data Center
Overview
The Virginia Department of Health Profession’s Healthcare Workforce Data Center (HWDC) collects and
disseminates workforce information on Virginia’s licensed, certified and registered healthcare practitioners. The 2007 report of the Governor’s Health Reform Commission recommended that the HWDC be established within the Department of Health Professions (DHP) due to its existing repository of licensure information for over 80 professions. In the spring of 2008, HWDC was launched with Workforce Investment Act grant funding and continues with support from the Department and shared grant funding from the U.S. Health Resources Services Administration on behalf of the new Virginia Health Workforce Development Authority and other partner organizations.
With significant input and collaborative effort from key stakeholders and experts, HWDC has developed initial supply
and demand forecasts for physicians and nurses, published results from existing physician and nursing workforce surveys originally developed by the Board of Medicine and Board of Nursing, updated and launched revised surveys as well as developed new workforce surveys as listed in the “Current Collection” in the HWDC Survey Timetable below.
HWDC Current Surveys
Certified Nurse Aides
The Federal Omnibus Budget and Reconciliation Act of 1987 mandated that all states receiving Medicare and
Medicaid funding for nursing homes establish a Nurse Aide Registry (among other mandates). Pursuant to this mandate, Virginia began certifying “certified nurse aides” or “C.N.A.s” who work in nursing facilities in 1989. It is important to note that only those nurse aides working in nursing homes are required to be certified. Uncertified nurse aides with similar job titles (e.g., nurse aide, nursing assistant) working in other settings are not required to obtain certification. Despite this, a significant proportion of employers require certification as a condition of employment.
Assisted Living Facility Administrators Audiologists Certified Nurse Aides Clinical Psychologists Dental Hygienists Dentists Doctors of Osteopathy
Licensed Clinical Social Workers Licensed Practical Nurses Licensed Professional Counselors Medical Doctors Nurse Practitioners Nursing Home Administrators Pharmacists
Pharmacy Technicians Physical Therapists Physical Therapy Assistants Physician Assistants Registered Nurses Speech-Language Pathologists
2
The 2012 CNA Workforce Survey
Methodology
The CNA Workforce Survey is administered to Certified Nurse Aides through the Department of Health Professions
online renewal process. CNAs must renew their certificates once every two years. Only those CNAs who work in long term care are required to be certified. Currently, HWDC surveys are only available to those renewing their certificates online. New Virginia certificants and those returning from a long absence did not have access to the online survey.2 Additionally, paper renewals were available to persons who specifically requested them. The survey was not offered to students or new applicants. This survey was conducted during the two year period between September 1, 2010 and August 31, 2012. Unlike other professions, where all regulated individuals complete their survey in the same month of the year, CNAs have a rolling renewal process in which surveys are completed in the month in which a CNA’s current certificate is set to expire.3 The survey text is available in Appendix B.
Response Rates
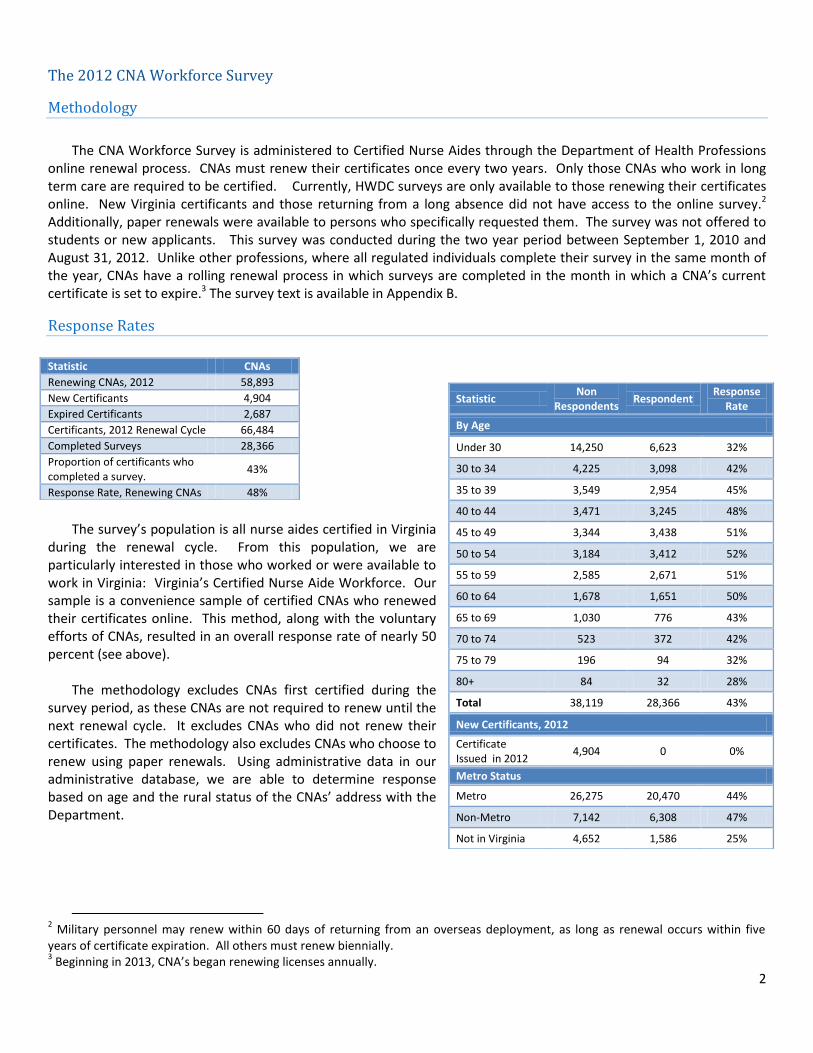
The survey’s population is all nurse aides certified in Virginia
during the renewal cycle. From this population, we are particularly interested in those who worked or were available to work in Virginia: Virginia’s Certified Nurse Aide Workforce. Our sample is a convenience sample of certified CNAs who renewed their certificates online. This method, along with the voluntary efforts of CNAs, resulted in an overall response rate of nearly 50 percent (see above).
The methodology excludes CNAs first certified during the
survey period, as these CNAs are not required to renew until the next renewal cycle. It excludes CNAs who did not renew their certificates. The methodology also excludes CNAs who choose to renew using paper renewals. Using administrative data in our administrative database, we are able to determine response based on age and the rural status of the CNAs’ address with the Department.
2 Military personnel may renew within 60 days of returning from an overseas deployment, as long as renewal occurs within five
years of certificate expiration. All others must renew biennially. 3 Beginning in 2013, CNA’s began renewing licenses annually.
Statistic CNAs
Renewing CNAs, 2012 58,893
New Certificants 4,904
Expired Certificants 2,687
Certificants, 2012 Renewal Cycle 66,484
Completed Surveys 28,366
Proportion of certificants who completed a survey.
43%
Response Rate, Renewing CNAs 48%
Statistic Non
Respondents Respondent
Response Rate
By Age
Under 30 14,250 6,623 32%
30 to 34 4,225 3,098 42%
35 to 39 3,549 2,954 45%
40 to 44 3,471 3,245 48%
45 to 49 3,344 3,438 51%
50 to 54 3,184 3,412 52%
55 to 59 2,585 2,671 51%
60 to 64 1,678 1,651 50%
65 to 69 1,030 776 43%
70 to 74 523 372 42%
75 to 79 196 94 32%
80+ 84 32 28%
Total 38,119 28,366 43%
New Certificants, 2012
Certificate Issued in 2012
4,904 0 0%
Metro Status
Metro 26,275 20,470 44%
Non-Metro 7,142 6,308 47%
Not in Virginia 4,652 1,586 25%

3
Virginia’s Certified Nurse Aides
Not all of Virginia’s CNAs live or work in the state. Nearly 91 percent of Virginia’s CNAs live in Virginia. In addition,
nearly 7 percent have an address on record in a state bordering Virginia or in the District of Columbia. As indicated earlier, only nurse aides or nurse assistants employed in nursing homes are required to be certified in
Virginia. Nurse aides, nurse assistants, orderlies, home health aides, personal care aides or other persons in similar occupations who work in hospitals, home health, community health, clinics or other settings are not required to be certified. Nevertheless, many employers require persons working in these positions and settings to be certified as nurse aides.
Virginia’s CNA Workforce
For purposes of this report, Virginia’s CNA workforce consists of certified nurse
aides who reported having at least one practice location and who identified at least one practice location in Virginia in our survey. If a respondent indicated practicing but did not list a location, the address on file with the department was used as a proxy to determine participation in Virginia’s workforce. Virginia’s CNA workforce also includes certified respondents who reside in Virginia and are not working, but who intend to return to practice at some point. As noted above, the CNA workforce does not include uncertified practitioners who work in similar occupations outside of nursing homes.4 Using these criteria, 27,081 CNA survey respondents are in Virginia’s workforce.
Weighted Estimates
To account for differences in response rates by key characteristics, this report
uses weighted estimates. The HWDC assigns a weight to each response based on the overall response rate of CNAs based on the age of the respondent in five year categories and the rural status of the respondent’s mailing address.
For the latter, the HWDC uses a measure of rurality developed by the US Department of Agriculture known as the Rural-Urban Continuum Code. More information on these codes is available on the USDA website here: http://www.ers.usda.gov/Briefing/Rurality/RuralUrbCon/. Response rates may vary on other important characteristics such as race/ethnicity, gender, specialty or worksite characteristics. However, the HWDC does not have population-wide data on these characteristics to generate response rates and weights. For information on weights, see Appendix A. Due to the rounding of weighted data in HWDC’s statistical software, weighting may result in some minor anomalies in tables and other presented data (e.g., data may not add to totals in tables).
4 The US Bureau of Labor Statistics and the Virginia Employment Commission’s Labor Market use the Standard Occupational
Classification (SOC) System for classifying workers into occupations. The SOC includes several separate occupations which may include certified or uncertified nurse aides. Some SOC occupations which may include CNAs in Virginia are “nurse assistants” (311014), “orderlies” (311015), “personal care aides” (399021), “home health aides” (311011), “psychiatric aides” (311013) and “healthcare support workers, all others” (319099).
Status Respondents
Working in Virginia 24,713
Not working, but plans to return to work in Virginia
2,368
Total 27,081
Status Weighted Estimate
Working in Virginia 56,295
Not working, but plans to return to work in Virginia
5,980
Total 62,275

4
Using this methodology, we estimate that 62,275 CNAs participated in Virginia’s CNA workforce during the two-year survey period, including 56,295 CNAs who worked in Virginia in 2012 and 5,980 CNAs who did not indicate working in Virginia in 2012, but who indicated plans to return to work in Virginia in the future. As noted on the previous page, the Certified Nurse Aide workforce does not include uncertified practitioners who work in similar occupations outside of nursing homes. The information in this report pertains to Virginia’s CNA workforce.

5
Virginia’s Certified Nurse Aide Workforce
Demographics
Age & Gender
The median age of Virginia’s CNAs was 37. However, this
distribution was skewed toward younger CNAs. Nearly one-third of all CNAs were under the age of 30, while less than 10 percent of CNAs were age 60 or above. Meanwhile, approximately 40 percent of CNAs were either in their 30s or 40s.
Nearly 95 percent of all Virginia’s CNAs were female. Males
were significantly underrepresented, accounting for no more than seven percent of CNAs within any given 5-year age cohort.
Diversity5
With respect to Virginia’s overall population, non-Hispanic
blacks were significantly overrepresented among CNAs, accounting for more than half of all practitioners. Meanwhile, non-Hispanic whites, Hispanics and Asian/Pacific Islanders were all significantly underrepresented among CNAs, although non-Hispanic whites still accounted for more than 40% of all CNAs in Virginia.
5 All Healthcare Workforce Data Surveys follow Federal OMB standards for data collection on race and ethnicity. This allows valid
comparisons with data collected by the US Census Bureau and other sources. For more information on these standards see: http://www.whitehouse.gov/omb/inforeg_statpolicy.
Race/ Ethnicity
Est. 2011 Virginia Population
CNAs
Estimate % Weighted Estimate
%
White, non-Hispanic 5,222,122 64% 25,276 41%
Black, non-Hispanic 1,548,069 19% 32.136 52%
Hispanic of any race 660,730 8% 1,711 3%
Asian or Pacific Islander
463,913 6% 1,822 3%
American Indian or Alaskan Native
21,474 0% 251 0%
Other Race - - 744 1%
Two or more races 180,296 2% - -

6
Education
Location of CNA Training
Nearly 90 percent of all CNAs who are certified to work in Virginia
received their training inside the Commonwealth. Among all other states, only North Carolina and New York accounted for more than one percent of all CNAs in Virginia’s workforce. In total, approximately four percent of all CNAs received their training in a state bordering Virginia or the District of Columbia.
Source of CNA Training
CNAs received their training at four main types of institutions:
Nursing Homes, Public Schools, Private/Proprietary Schools and Community Colleges. All four institutional types provided significant contributions toward the training of Virginia’s CNAs. Fully one-half of all CNAs were trained at either Public or Private Schools, while 20 percent were trained at Community Colleges. Only 31 percent of all CNAs were trained by employers in Nursing Homes.
CNA Training Graduation Year
Nearly one-half of all CNAs graduated from their CNA training
program in 2005 or later. Even within this group, graduation years were skewed toward earlier graduation dates. Approximately 63 percent of CNAs within this group graduated between 2008 and 2010, which was the last year in which CNAs included in this survey could have graduated. Meanwhile, nearly 20 percent of CNAs graduated in the first half of the 2000s, while 22 percent graduated in the 1990s. Another 10 percent graduated before 1990.

7
State of Initial CNA Certification
Nearly 90 percent of all CNAs received their initial CNA
certification in Virginia. Among all other states and U.S. territories in which CNAs received their initial certification, only two – North Carolina and New York – accounted for more than one percent of all CNA certifications. In total, approximately five percent of all initial CNA certifications were earned in states that border Virginia or the District of Columbia.
8
Employment characteristics
Current Employment Status
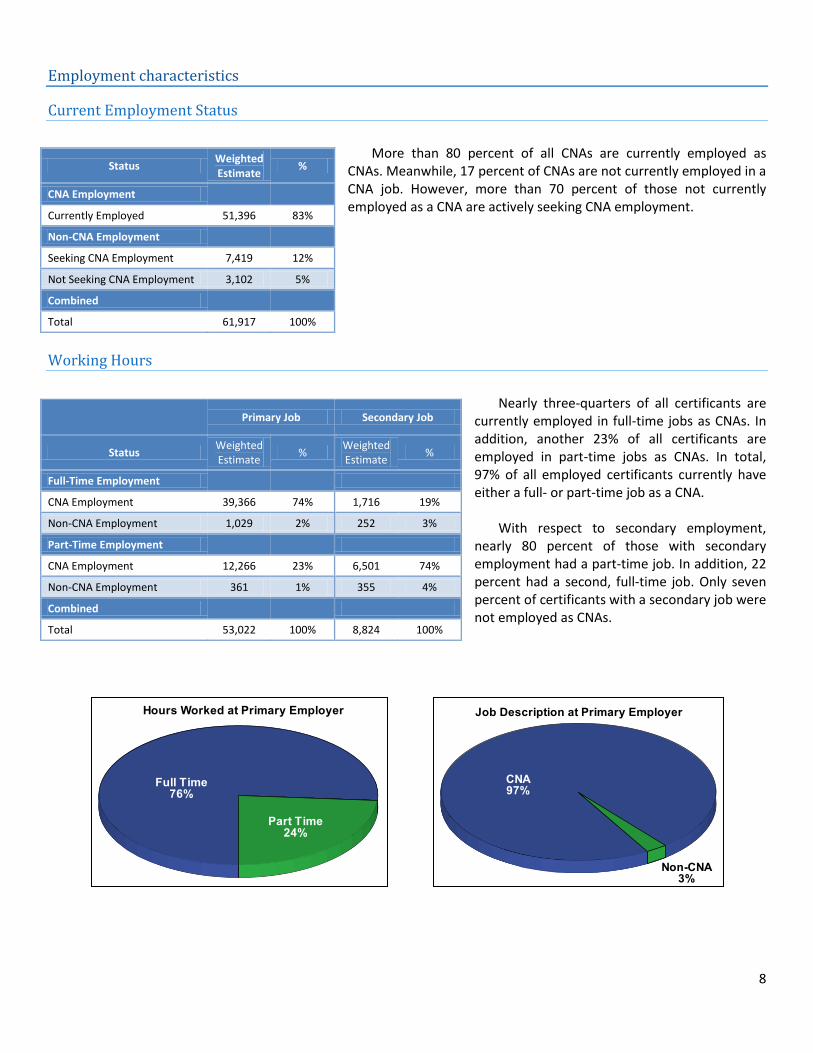
More than 80 percent of all CNAs are currently employed as
CNAs. Meanwhile, 17 percent of CNAs are not currently employed in a CNA job. However, more than 70 percent of those not currently employed as a CNA are actively seeking CNA employment.
Working Hours
Nearly three-quarters of all certificants are
currently employed in full-time jobs as CNAs. In addition, another 23% of all certificants are employed in part-time jobs as CNAs. In total, 97% of all employed certificants currently have either a full- or part-time job as a CNA.
With respect to secondary employment,
nearly 80 percent of those with secondary employment had a part-time job. In addition, 22 percent had a second, full-time job. Only seven percent of certificants with a secondary job were not employed as CNAs.
Status Weighted Estimate
%
CNA Employment
Currently Employed 51,396 83%
Non-CNA Employment
Seeking CNA Employment 7,419 12%
Not Seeking CNA Employment 3,102 5%
Combined
Total 61,917 100%
Primary Job Secondary Job
Status Weighted Estimate
% Weighted Estimate
%
Full-Time Employment
CNA Employment 39,366 74% 1,716 19%
Non-CNA Employment 1,029 2% 252 3%
Part-Time Employment
CNA Employment 12,266 23% 6,501 74%
Non-CNA Employment 361 1% 355 4%
Combined
Total 53,022 100% 8,824 100%
9
Primary Work Role
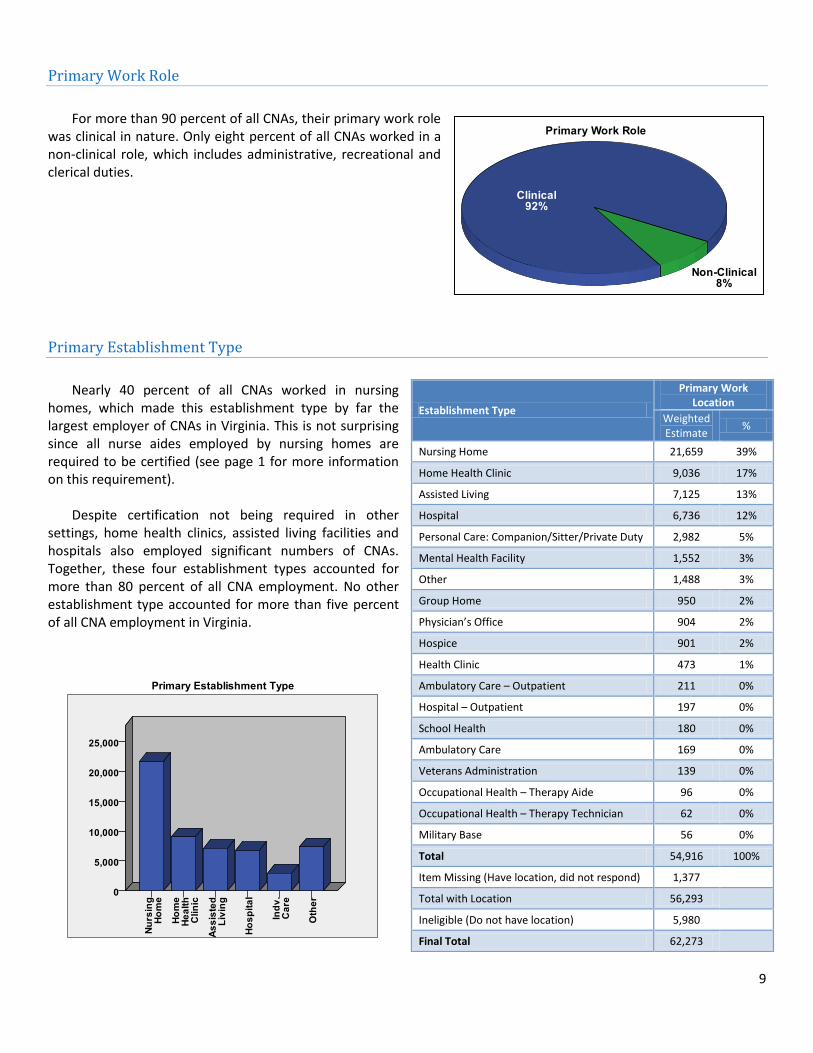
For more than 90 percent of all CNAs, their primary work role
was clinical in nature. Only eight percent of all CNAs worked in a non-clinical role, which includes administrative, recreational and clerical duties.
Primary Establishment Type
Nearly 40 percent of all CNAs worked in nursing
homes, which made this establishment type by far the largest employer of CNAs in Virginia. This is not surprising since all nurse aides employed by nursing homes are required to be certified (see page 1 for more information on this requirement).
Despite certification not being required in other
settings, home health clinics, assisted living facilities and hospitals also employed significant numbers of CNAs. Together, these four establishment types accounted for more than 80 percent of all CNA employment. No other establishment type accounted for more than five percent of all CNA employment in Virginia.
Establishment Type
Primary Work Location
Weighted Estimate
%
Nursing Home 21,659 39%
Home Health Clinic 9,036 17%
Assisted Living 7,125 13%
Hospital 6,736 12%
Personal Care: Companion/Sitter/Private Duty 2,982 5%
Mental Health Facility 1,552 3%
Other 1,488 3%
Group Home 950 2%
Physician’s Office 904 2%
Hospice 901 2%
Health Clinic 473 1%
Ambulatory Care – Outpatient 211 0%
Hospital – Outpatient 197 0%
School Health 180 0%
Ambulatory Care 169 0%
Veterans Administration 139 0%
Occupational Health – Therapy Aide 96 0%
Occupational Health – Therapy Technician 62 0%
Military Base 56 0%
Total 54,916 100%
Item Missing (Have location, did not respond) 1,377
Total with Location 56,293
Ineligible (Do not have location) 5,980
Final Total 62,273

10
Work Duration
More than one-quarter of all employed CNAs have been with
their primary employer for between two and five years. Meanwhile, another 22 percent of CNAs have worked for between one and two years at their primary employer. In total, 33 percent of all CNAs have worked at their current employer for more than five years, while less than 20 percent have worked at their current employer for less than one year.
Work Satisfaction
Virtually all CNAs (97 percent) were satisfied with their primary
job as a CNA, including nearly three-quarters who were very satisfied. In total, only three percent of CNAs were dissatisfied with their primary job as a CNA.
Length of Employment Weighted Estimate
%
6 Months or Less 4,699 9%
6-12 Months 5,596 10%
1-2 Years 11,907 22%
2-5 Years 14,182 26%
5-10 Years 9,448 17%
10+ Years 8,866 16%
Total 54,698 100%
Satisfaction Level Weighted Estimate
%
Very Satisfied 40,729 74%
Somewhat Satisfied 12,469 23%
Somewhat Dissatisfied 990 2%
Very Dissatisfied 668 1%
Total 54,856 100%

11
Future Plans
Expected Employment Duration
Overall, 32 percent of all CNAs expect to remain in the CNA role
at least the next ten years, while 20 percent expected to leave within the next two years, including only six percent who plan on leaving in the next 12 months. Nearly half of all CNAs plan on remaining in the CNA role for between two and ten years.
Expected Length of Employment
Weighted Estimate
%
6 Months or Less 877 2%
6-12 Months 2,194 4%
1-2 Years 7,635 14%
2-5 Years 14,759 27%
5-10 Years 12,010 22%
10+ Years 17,711 32%
Total 55,186 100%
12
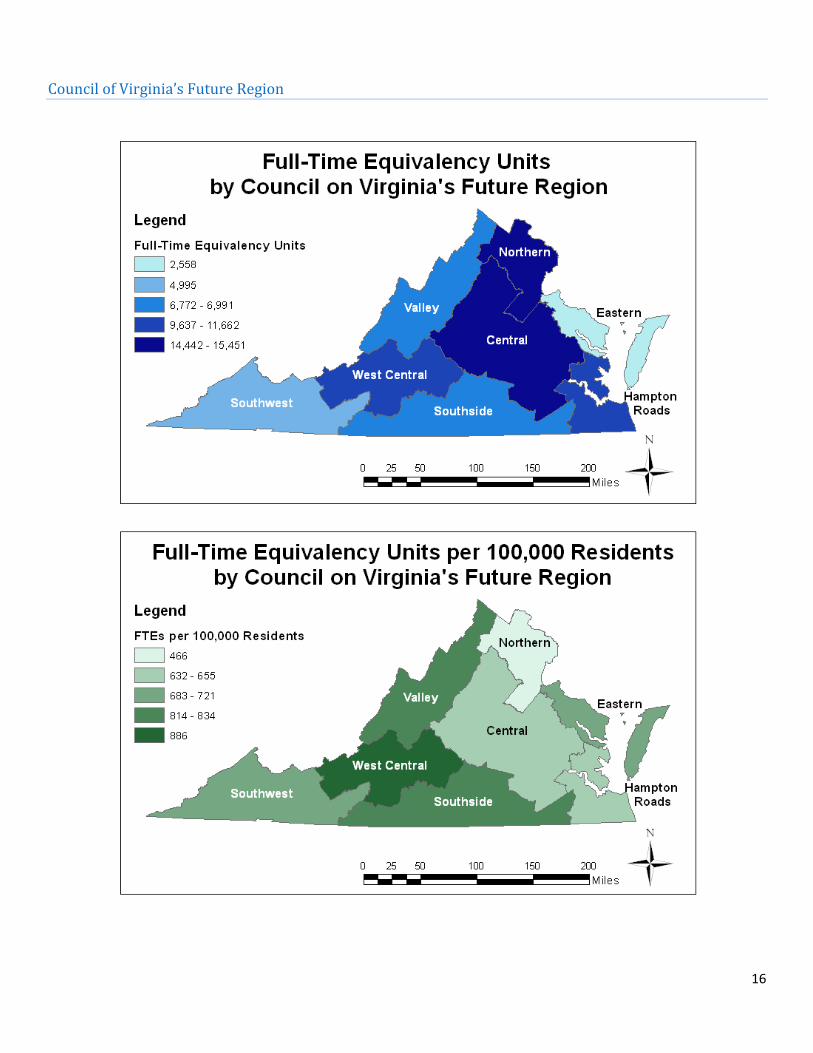
Distribution of Work Locations
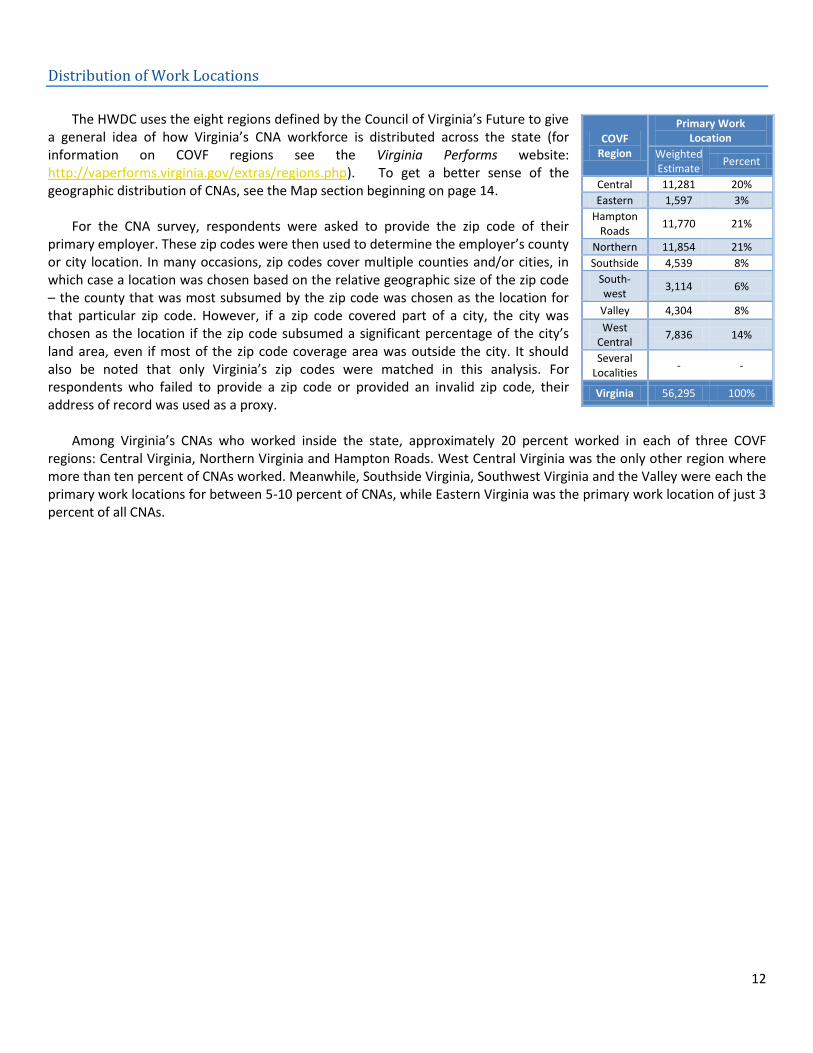
The HWDC uses the eight regions defined by the Council of Virginia’s Future to give
a general idea of how Virginia’s CNA workforce is distributed across the state (for information on COVF regions see the Virginia Performs website: http://vaperforms.virginia.gov/extras/regions.php). To get a better sense of the geographic distribution of CNAs, see the Map section beginning on page 14.
For the CNA survey, respondents were asked to provide the zip code of their
primary employer. These zip codes were then used to determine the employer’s county or city location. In many occasions, zip codes cover multiple counties and/or cities, in which case a location was chosen based on the relative geographic size of the zip code – the county that was most subsumed by the zip code was chosen as the location for that particular zip code. However, if a zip code covered part of a city, the city was chosen as the location if the zip code subsumed a significant percentage of the city’s land area, even if most of the zip code coverage area was outside the city. It should also be noted that only Virginia’s zip codes were matched in this analysis. For respondents who failed to provide a zip code or provided an invalid zip code, their address of record was used as a proxy.
Among Virginia’s CNAs who worked inside the state, approximately 20 percent worked in each of three COVF
regions: Central Virginia, Northern Virginia and Hampton Roads. West Central Virginia was the only other region where more than ten percent of CNAs worked. Meanwhile, Southside Virginia, Southwest Virginia and the Valley were each the primary work locations for between 5-10 percent of CNAs, while Eastern Virginia was the primary work location of just 3 percent of all CNAs.
COVF Region
Primary Work Location
Weighted Estimate
Percent
Central 11,281 20%
Eastern 1,597 3%
Hampton Roads
11,770 21%
Northern 11,854 21%
Southside 4,539 8%
South-west
3,114 6%
Valley 4,304 8%
West Central
7,836 14%
Several Localities
- -
Virginia 56,295 100%

13
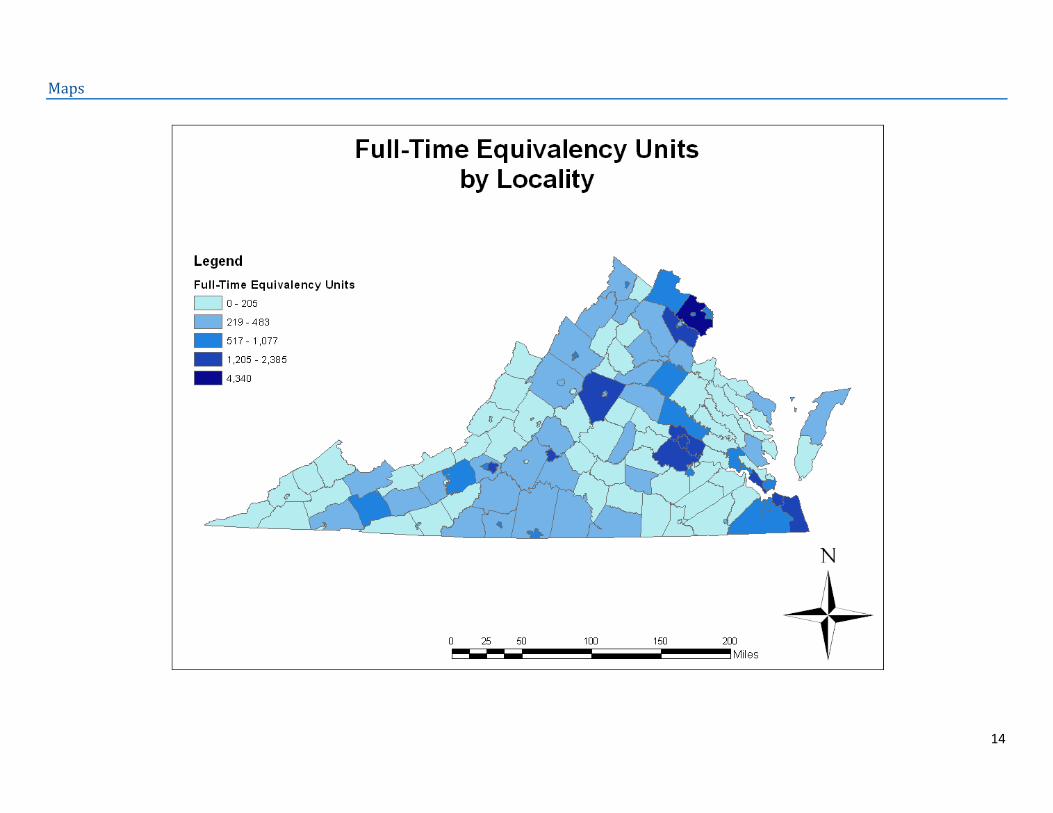
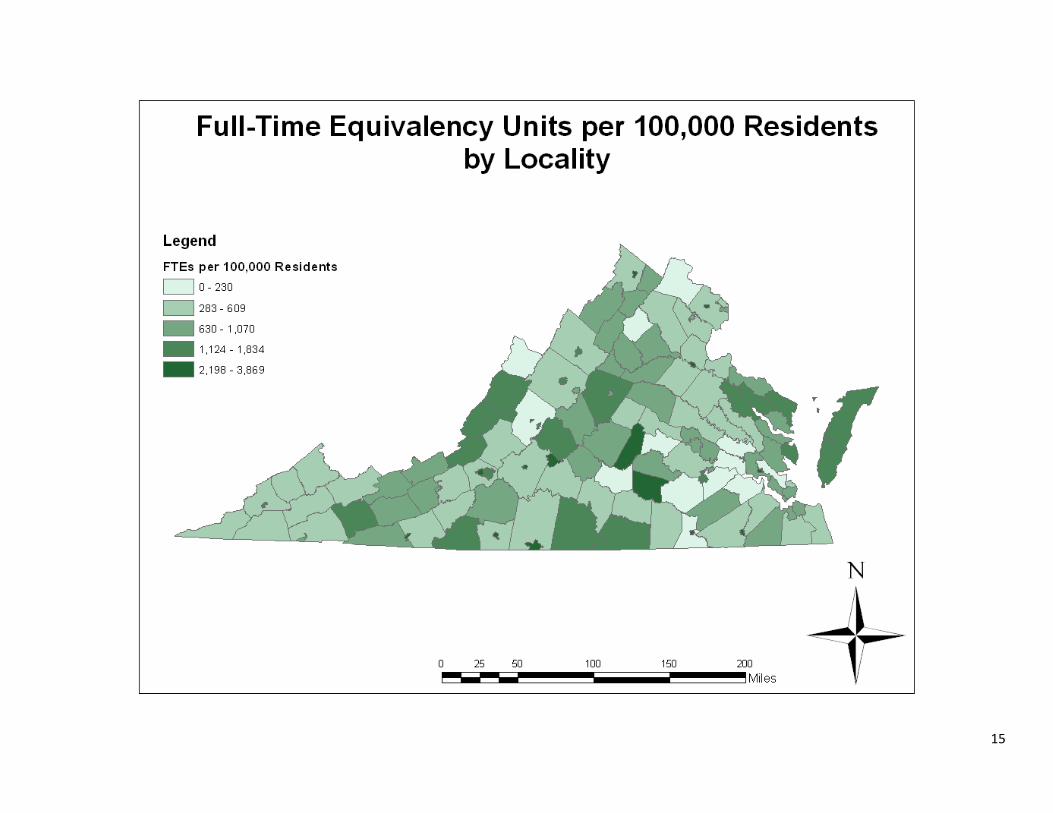
Full-Time Equivalency Units (FTEs)
Economists and human resources professionals often refer to Full Time Equivalency
units (or FTEs) when discussing labor market participation. Conceptually, an FTE represents one full time worker or one full time position. One FTE may be provided by two part-time workers or one full time worker. Alternatively, one worker with one full time job and one part time job may provide 1.5 FTEs. FTEs provide an easy way to compare labor or job supply while accounting for differing levels of work supplied by individuals.
FTEs are defined using a variety of methods. Human resources professionals (and
employees) often think in terms of positions or jobs, with one full time position equivalent to one FTE and one part time position equivalent to 0.5 FTEs. Economists (and payroll professionals), however, often need more precise measures of hours worked. Economists often use hours worked (as we did in the previous section). Using FTEs, however, provides a human scale for examining data and provides for easy benchmarking across data sources.
When using FTEs, readers are cautioned to look closely at how FTEs are defined. Does FTE refer to positions, or is it
derived from hours worked (or some other measure of services provided, such as medications dispensed)? How many hours equates to one FTE? Unless defined equivalently, direct comparisons of FTEs require caution. In many cases, direct comparisons are not appropriate. The HWDC defines one FTE as 2,000 hours worked per year. That equates to someone working 40-hours per week for 50 weeks (2-weeks off).6 Other common methods, such as a full 52 week schedule, or a 35-hour work week can be calculated using the HWDC’s raw figures.
For the CNA survey, respondents were asked directly whether they worked as full-time or part-time employees at
their primary and secondary work locations. For the purposes of this survey, a full-time job is considered to be one in which an employee works a minimum of 32 hours per week. Likewise, a part-time job is one in which the employees works less than 32 hours per week.
FTEs by age, along with the FTE per individual in the age group, are reported in the table above. The distribution
(proportion by age group) is equivalent to the distribution by hour. All told, 56,295 Virginia CNAs provided 53,565.60 FTEs at their primary and secondary locations, or about 0.95 FTEs per CNA.
FTEs are reported alongside hours in the following charts and in the map section beginning on page 14.
6 There does not seem to be a common method for estimating FTEs. The method described here is used by the US Bureau of Labor
Statistics when calculating accident rates in the workforce.
Age Total FTEs
Mean Sum
Under 30 0.90 15,141.45
30 to 34 0.96 6,061.21
35 to 39 0.98 5,499.92
40 to 44 0.99 5,841.44
45 to 49 1.00 5,877.94
50 to 54 0.99 5,656.65
55 to 59 1.00 4,557.32
60 to 64 0.97 2,736.12
65 to 69 0.88 1,341.70
70 to 74 0.78 580.95
75 to 79 0.78 191.28
80 and over 0.80 79.62
Total 0.95 53,565.60
14
Maps
15
16
Council of Virginia’s Future Region
17
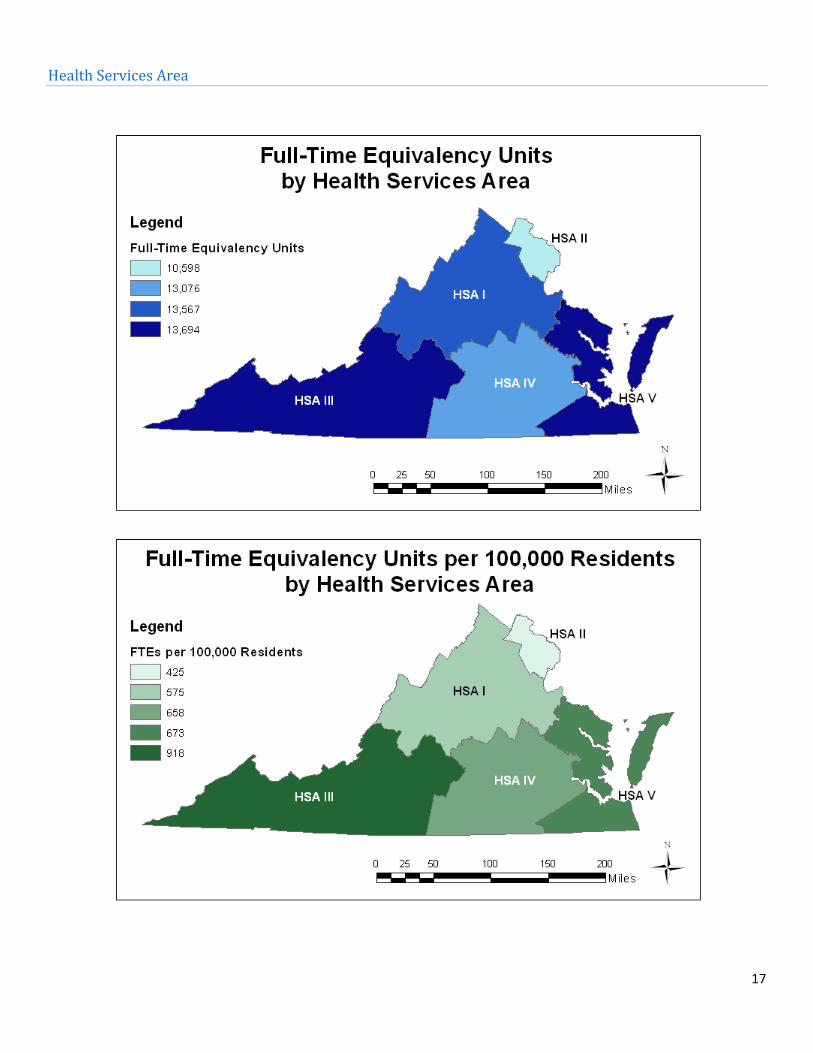
Health Services Area

18
Workforce Investment Area
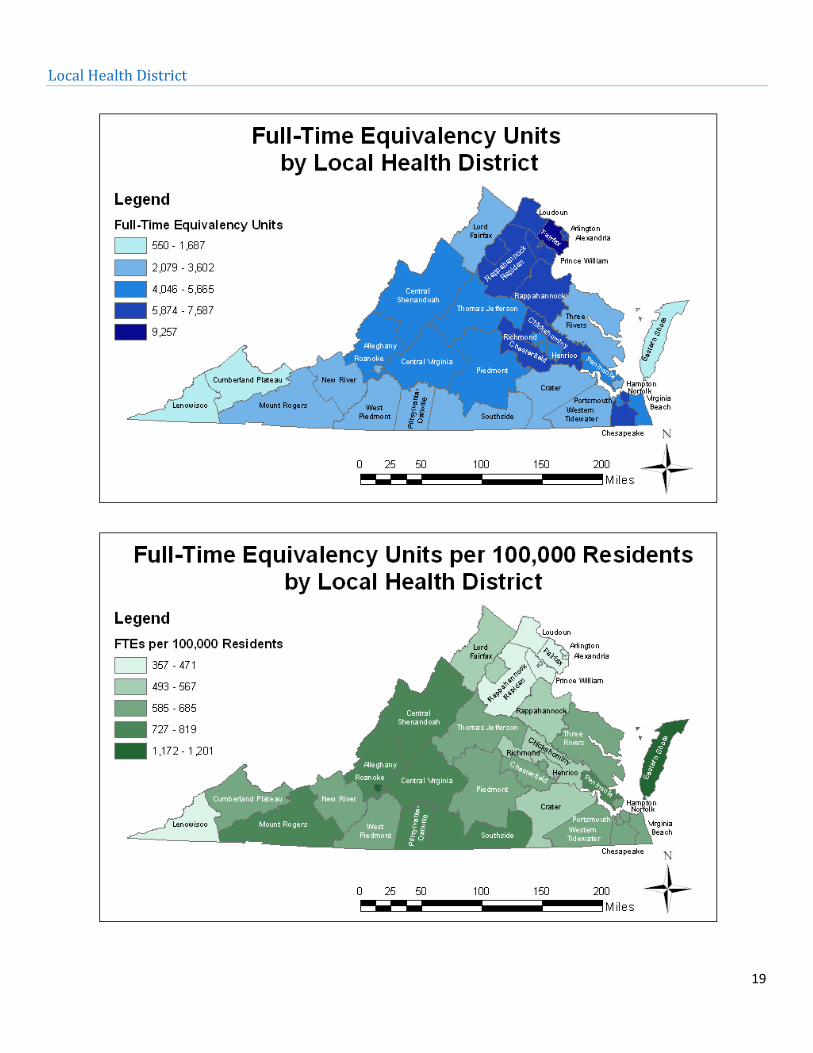
19
Local Health District
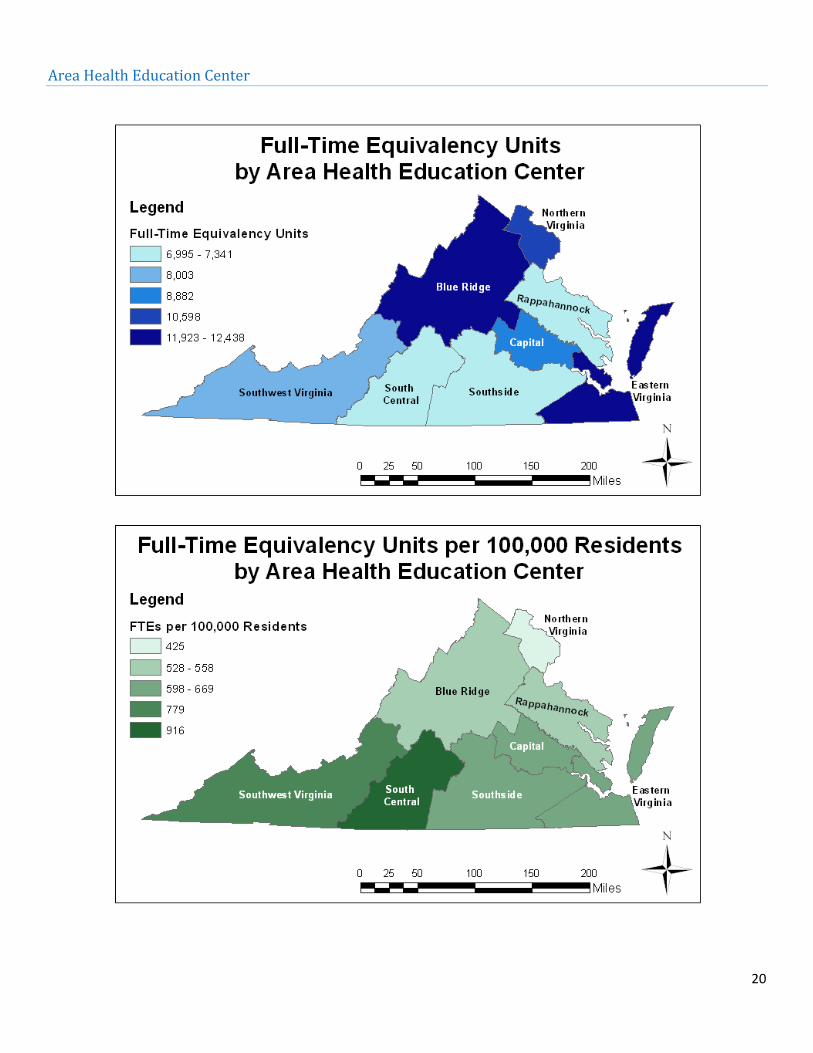
20
Area Health Education Center
21
Appendices
Appendix A: Weights
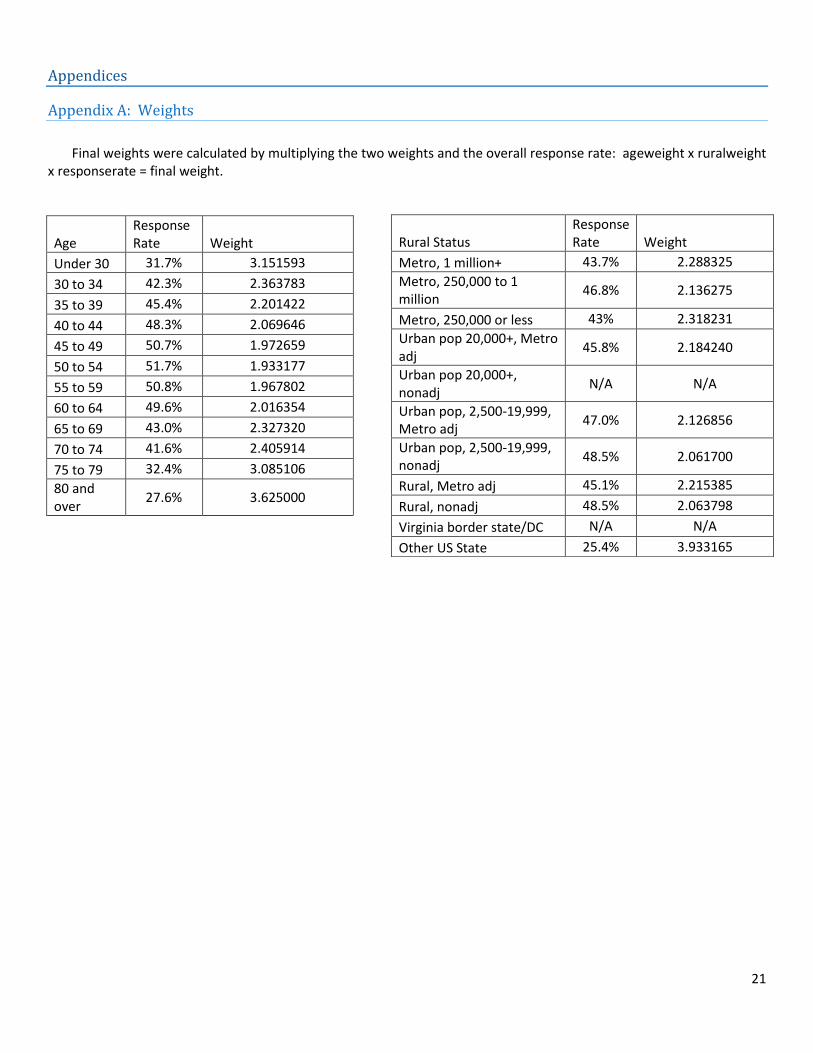
Final weights were calculated by multiplying the two weights and the overall response rate: ageweight x ruralweight
x responserate = final weight.
Age Response Rate Weight
Under 30 31.7% 3.151593
30 to 34 42.3% 2.363783
35 to 39 45.4% 2.201422
40 to 44 48.3% 2.069646
45 to 49 50.7% 1.972659
50 to 54 51.7% 1.933177
55 to 59 50.8% 1.967802
60 to 64 49.6% 2.016354
65 to 69 43.0% 2.327320
70 to 74 41.6% 2.405914
75 to 79 32.4% 3.085106
80 and over
27.6% 3.625000
Rural Status Response Rate Weight
Metro, 1 million+ 43.7% 2.288325
Metro, 250,000 to 1 million
46.8% 2.136275
Metro, 250,000 or less 43% 2.318231
Urban pop 20,000+, Metro adj
45.8% 2.184240
Urban pop 20,000+, nonadj
N/A N/A
Urban pop, 2,500-19,999, Metro adj
47.0% 2.126856
Urban pop, 2,500-19,999, nonadj
48.5% 2.061700
Rural, Metro adj 45.1% 2.215385
Rural, nonadj 48.5% 2.063798
Virginia border state/DC N/A N/A
Other US State 25.4% 3.933165
22
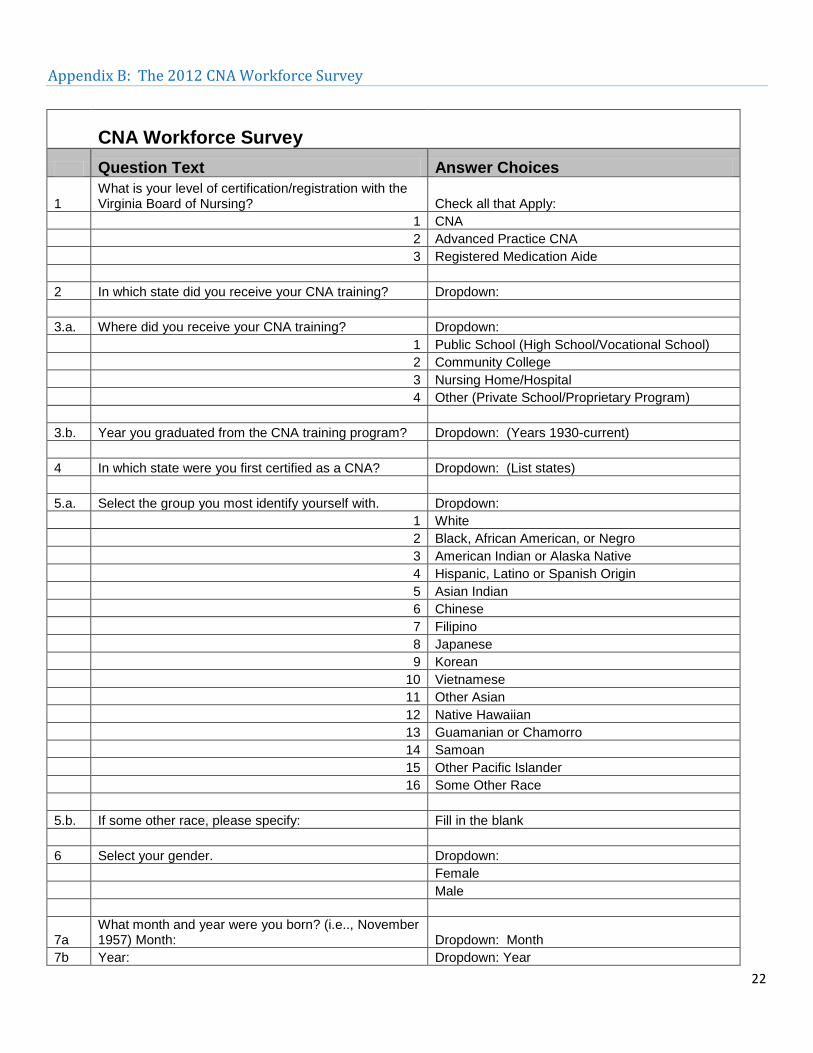
Appendix B: The 2012 CNA Workforce Survey
CNA Workforce Survey
Question Text Answer Choices
1 What is your level of certification/registration with the Virginia Board of Nursing? Check all that Apply:
1 CNA
2 Advanced Practice CNA
3 Registered Medication Aide
2 In which state did you receive your CNA training? Dropdown:
3.a. Where did you receive your CNA training? Dropdown:
1 Public School (High School/Vocational School)
2 Community College
3 Nursing Home/Hospital
4 Other (Private School/Proprietary Program)
3.b. Year you graduated from the CNA training program? Dropdown: (Years 1930-current)
4 In which state were you first certified as a CNA? Dropdown: (List states)
5.a. Select the group you most identify yourself with. Dropdown:
1 White
2 Black, African American, or Negro
3 American Indian or Alaska Native
4 Hispanic, Latino or Spanish Origin
5 Asian Indian
6 Chinese
7 Filipino
8 Japanese
9 Korean
10 Vietnamese
11 Other Asian
12 Native Hawaiian
13 Guamanian or Chamorro
14 Samoan
15 Other Pacific Islander
16 Some Other Race
5.b. If some other race, please specify: Fill in the blank
6 Select your gender. Dropdown:
Female
Male
7a What month and year were you born? (i.e.., November 1957) Month: Dropdown: Month
7b Year: Dropdown: Year

23
8 Select one option that describes your current employment status as a CNA. Dropdown:
1 Seeking employment as a CNA
2 Employed as a CNA
3 Temporarily not working as a CNA and not looking for a job as a CNA
4 Not employed as a CNA
5 Retired or with no plans to return to work as a CNA
9
If you are employed as a CNA select one that best describes the hours you work at your primary place of employment. (This is the place where you work the most hours per week) Dropdown:
1 Employed less than 32 hours/week as a CNA
2 Employed less than 32 hours/week NOT as a CNA
3 Employed 32 hours/week or more as a CNA
4 Employed 32 hours/week or more NOT as a CNA
5 Not employed/not employed as a CNA (go to Question 17.a.)
10 Select one area that best describes your primary CNA work role? Dropdown:
Clinical
Non Clinical (Administration, Recreation, Clerical)
11.a.
Select one setting that best describes your primary CNA employment. (This is the place where you work the most hours per week) Dropdown:
1 Ambulatory Care
2 Ambulatory Care Outpatient
3 Assisted Living
4 Group Home
5 Health Clinic
6 Home Health Care
7 Hospice
8 Hospital
9 Hospital Outpatient
10 Mental Health Facility
11 Military Base
12 Nursing Home
13 Occupational Health - Therapy Aide
14 Occupational Health - Therapy Technician
15 Personal Care: Companion / Sitter / Private Duty
16 Physician’s Office
17 School Health
18 Veterans Administration
19 Other
11.b. If Other, please specify: Fill in the blank
24
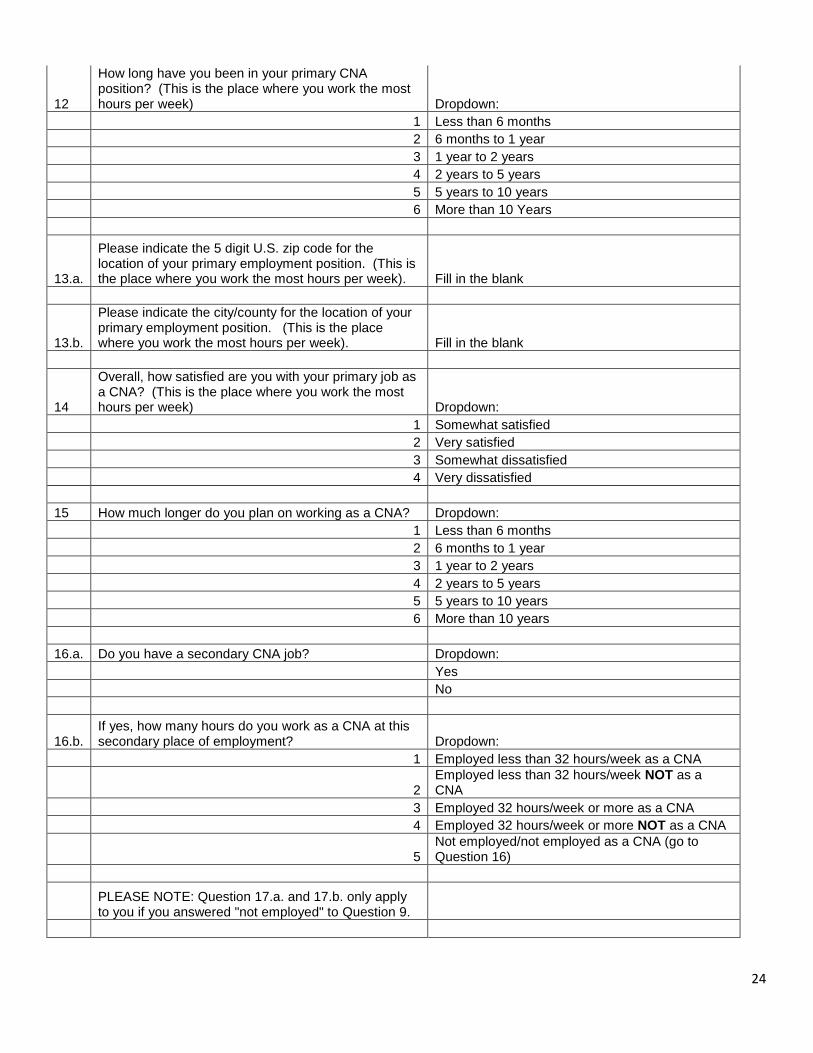
12
How long have you been in your primary CNA position? (This is the place where you work the most hours per week) Dropdown:
1 Less than 6 months
2 6 months to 1 year
3 1 year to 2 years
4 2 years to 5 years
5 5 years to 10 years
6 More than 10 Years
13.a.
Please indicate the 5 digit U.S. zip code for the location of your primary employment position. (This is the place where you work the most hours per week). Fill in the blank
13.b.
Please indicate the city/county for the location of your primary employment position. (This is the place where you work the most hours per week). Fill in the blank
14
Overall, how satisfied are you with your primary job as a CNA? (This is the place where you work the most hours per week) Dropdown:
1 Somewhat satisfied
2 Very satisfied
3 Somewhat dissatisfied
4 Very dissatisfied
15 How much longer do you plan on working as a CNA? Dropdown:
1 Less than 6 months
2 6 months to 1 year
3 1 year to 2 years
4 2 years to 5 years
5 5 years to 10 years
6 More than 10 years
16.a. Do you have a secondary CNA job? Dropdown:
Yes
No
16.b. If yes, how many hours do you work as a CNA at this secondary place of employment? Dropdown:
1 Employed less than 32 hours/week as a CNA
2 Employed less than 32 hours/week NOT as a CNA
3 Employed 32 hours/week or more as a CNA
4 Employed 32 hours/week or more NOT as a CNA
5 Not employed/not employed as a CNA (go to Question 16)
PLEASE NOTE: Question 17.a. and 17.b. only apply to you if you answered "not employed" to Question 9.

25
17.a. If you are currently not employed as a CNA, do you plan on seeking employment as a CNA? Dropdown:
Yes
No
17.b. If yes, select one that applies: Dropdown:
1 Within 6 months
2 Within 6 months to 1 year
3 Within 1 year to 2 years
4 Within 2 years to 5 years
5 Within 5 years to 10 years
6 More than 10 years
18.a. Are you currently enrolled in a nursing education program? Dropdown:
Yes
No
18.b. If yes, what does the nursing education program lead to? Dropdown:
1 LPN
2 RN
3 Other
18.c. If other, please specify. Fill in the blank
END OF SURVEY