Virginia ADAP Data Report July 2009
19
Virginia ADAP Data Report July 2009 Anne Giuranna Rhodes, ABD Department of Epidemiology and Community Health Virginia Commonwealth University/ George Mason University
-
Upload
hayes-meyers -
Category
Documents
-
view
34 -
download
2
description
Virginia ADAP Data Report July 2009. Anne Giuranna Rhodes, ABD Department of Epidemiology and Community Health Virginia Commonwealth University/ George Mason University. ADAP Summary: April 2008 to March 2009. Total clients served: 3254 (3229) - PowerPoint PPT Presentation
Transcript of Virginia ADAP Data Report July 2009

Virginia ADAP Data Report July 2009
Anne Giuranna Rhodes, ABDDepartment of Epidemiology and Community Health
Virginia Commonwealth University/ George Mason University

ADAP Summary:April 2008 to March 2009
• Total clients served: 3254 (3229)
• Average cost per 30 day prescription: $359 ($372)
• Average cost per prescription(all): $441 ($398)
• Cost per person per month: $1,323 ($1,186) [1066]
• Number of new clients: 789 (701)
• Clients accessing anti-depressants: 395 (157)
•Numbers in parentheses are from 1 year ago (April 2007 to March 2008)•Number in brackets is from NASTAD report for National ADAP – June 2008

Monthly Data: Persons and Costs April 2005 to March 2009

New Persons Per MonthJanuary 2004 to March 2009
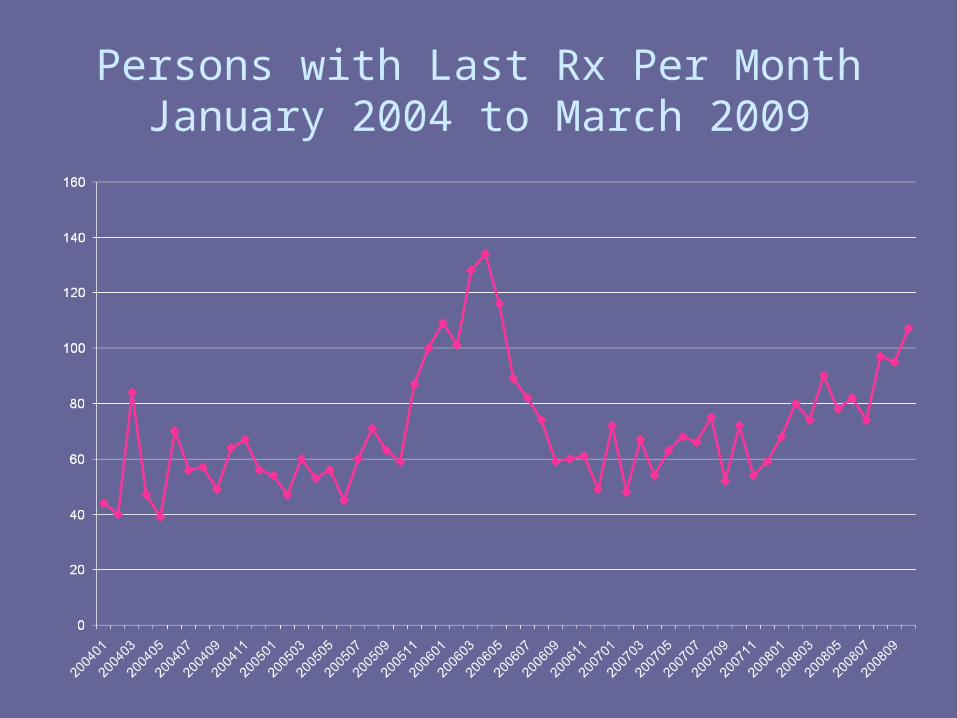
Persons with Last Rx Per MonthJanuary 2004 to March 2009
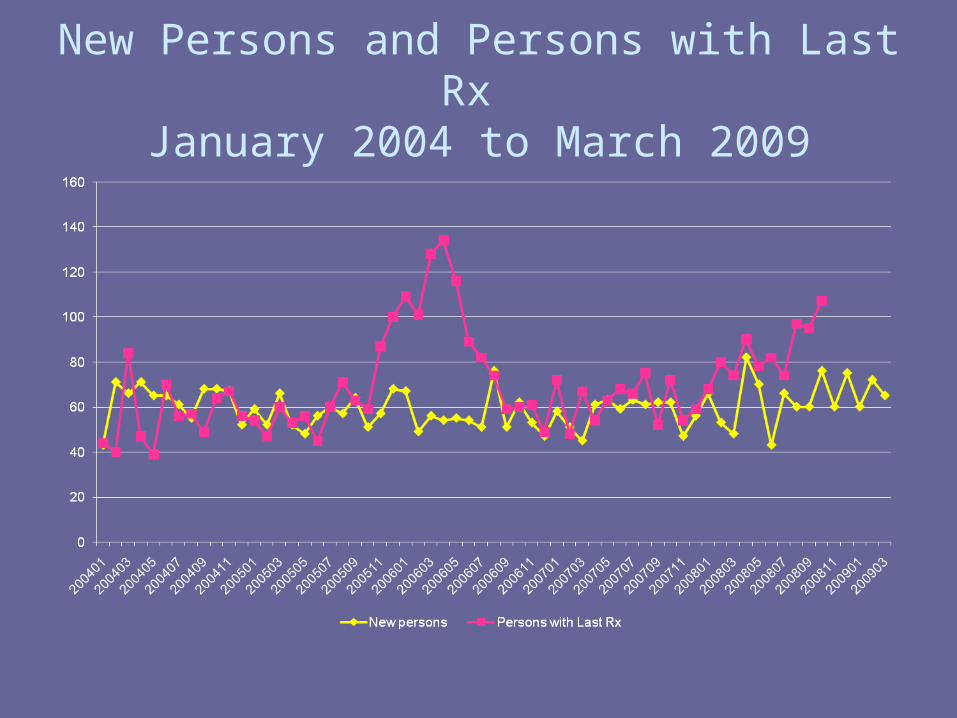
New Persons and Persons with Last Rx January 2004 to March 2009

Length of Time on ADAP by Year and Gender

Value of Filled PrescriptionsValue of Filled Prescriptions
Fiscal Year Total Value
April 2000 to March 2001 $13,283,421
April 2001 to March 2002 $15,662,031
April 2002 to March 2003 $17,143,724
April 2003 to March 2004 $20,312,242
April 2004 to March 2005 $22,481,523
April 2005 to March 2006 $23,818,875
April 2006 to March 2007 $22,694,646
April 2007 to March 2008 $22,200,203
April 2008 to March 2009 $ 24,862,782
April 2009 to March 2010 (projected) $26,215,243
*Note: Value is not reduced by a) Medicaid back-billing reimbursements, b) Year-end General funds, c) Pharmaceutical company rebates and free goods,
d) Re-dispensing of medications that are dispensed but not picked up

ADAP and Consortia by RegionApril 2008 to March 2009

National ADAP and VA ADAPDemographics: June 2008
National Numbers from NASTA Reporthttp://www.nastad.org/Docs/highlight/200946_7861%20FULL%20REPORT%20v3.pdf

All Clients Served: April 2008 to March 2009Race/Ethnicity and Gender

Clients by Region March 2008 to April 2009 (n=3254)
Southwest has seen largest decline in clients over the past 3 years

Clients by Age and Region:March 2008 to April 2009

Medication Types by RegionMarch 2008 to April 2009
• SW clients not receiving any HepC treatment
• Antidepressant usage lower in Northern and Northwest
• Vaccine usage highest in SW and Central

Clients By Region - # of ARVsJanuary to March 2009

New Classes of Drugs: Persons by MonthApril 2008 to March 2009

Specific Drugs by Region:April 2008 to March 2009

CD4 Counts by Region:April 2008 to March 2009
CD4 counts available for 51% of enrolled clients

Unknown CD4 Counts by Region:April 2008 to March 2009
CD4 counts available for 51% of enrolled clients