village based schools in mangochi: evaluation report - usaid
70
VILLAGE BASED SCHOOLS IN MANGOCHI: EVALUATION REPORT Karin A. L. Hyde* Esme C. Kadzamira** Juliet C. Sichinga*** Mike P. Chibwana** Ronald G. Ridker**** * - Consultant, Kenya ** - Centre for Educational Research & Training, Malawi *** - Ministry of Education, Malawi **** - Institute for Policy Reform, Washington D.C. ABSTRACT This evaluation of four village based schools in Mangochi district in southern Malawi was designed to assess the effectiveness and sustainability of an innovative community school model run by Save the Children Federation (US). Using a variety of techniques, student tests, parent interviews and focus groups, teacher and head teacher interviews and class room interviews, the schools were compared to government schools in the same geographical area on a number of dimensions, principally student achievement, community and parental involvement, teacher effectiveness and cost. The village based schools were generally rated higher than the government schools on all measures. The reasons for their better performance were judged to be, in order of importance: a curriculum that focused on the core subjects; more regular supervision; smaller class sizes and more participatory instructional strategies.
Transcript of village based schools in mangochi: evaluation report - usaid

VILLAGE BASED SCHOOLS IN MANGOCHI:EVALUATION REPORT
Karin A. L. Hyde*Esme C. Kadzamira**Juliet C. Sichinga***Mike P. Chibwana**Ronald G. Ridker****
* - Consultant, Kenya** - Centre for Educational Research & Training, Malawi*** - Ministry of Education, Malawi**** - Institute for Policy Reform, Washington D.C.
ABSTRACT
This evaluation of four village based schools in Mangochi district in southern Malawiwas designed to assess the effectiveness and sustainability of an innovative communityschool model run by Save the Children Federation (US). Using a variety of techniques,student tests, parent interviews and focus groups, teacher and head teacher interviews andclass room interviews, the schools were compared to government schools in the samegeographical area on a number of dimensions, principally student achievement, communityand parental involvement, teacher effectiveness and cost. The village based schools weregenerally rated higher than the government schools on all measures. The reasons for theirbetter performance were judged to be, in order of importance: a curriculum that focused onthe core subjects; more regular supervision; smaller class sizes and more participatoryinstructional strategies.
--i--
ACKNOWLEDGMENTS
The institutional support of the Centre for Educational Research and Training, theMinistry of Education, the Lilongwe and Mangochi offices of the Save the ChildrenFederation (SCF) and the Centre for Social Research helped ease a difficult task. PeterMvula of the Centre for Social Research supervised the data collection and data entry of thehousehold survey. We would like to acknowledge in particular the invaluable assistance ofMr. Lester Namathaka, SCF programme manager, supplied with unfailing willingness andgood humour.
Our research assistants -- Lizzie Chikoti, Lawrence Chikoko, Charles Madukani andKondwani M'manga were tireless and conscientious.
This study and the participation of Dr. Hyde and the Centre for Educational Researchand Training was funded under USAID/Malawi GABLE Project through the United StatesAgency for International Development's (AID) ABEL II project. Mrs. Sichinga'sparticipation was also supported under that project. The household survey and Dr. Ridker'scontribution were financed under a cooperative agreement (No. AEP-5463-A-00-4015-00)between the Institute for Policy Reform (IPR) and AID.
Views expressed in this paper are those of the authors and not necessarily those of IPR orAID.

--ii--
TABLE OF CONTENTSPage
ACKNOWLEDGMENTS ..........................................................................................................iLIST OF ABBREVIATIONS....................................................................................................vEXECUTIVE SUMMARY ......................................................................................................viINTRODUCTION .....................................................................................................................9
Background ..................................................................................................................9Project History ...........................................................................................................10Recruitment procedures See appendix 1 for a description of government
procedures. .......................................................................................................12Conditions of employment ........................................................................................13Curriculum adaptation..............................................................................................13Instructional materials ..............................................................................................14Monitoring procedures..............................................................................................14
EVALUATION DESIGN........................................................................................................16Rationale .....................................................................................................................16Objectives ...................................................................................................................16Evaluation Team ........................................................................................................17
THE ADMINISTRATIVE ENVIRONMENT ........................................................................23Administrative Backup..............................................................................................23Responsiveness ...........................................................................................................23Summary and Conclusions .......................................................................................24
COMMUNITY INVOLVEMENT ..........................................................................................25School Committees.....................................................................................................25Parental Involvement and Satisfaction ....................................................................26Mobilization................................................................................................................27Summary and Conclusions .......................................................................................28
THE INSTRUCTIONAL ENVIRONMENT...........................................................................30Overview .....................................................................................................................30Teacher Qualifications ..............................................................................................30Learning time and Class Sizes ..................................................................................31Instructional Activity.................................................................................................32Workload ....................................................................................................................33Instructional Support ................................................................................................34Summary and Conclusions .......................................................................................35
PUPIL PARTICIPATION .......................................................................................................36Absenteeism ................................................................................................................36Repetition....................................................................................................................37Promotion ...................................................................................................................37Dropout .......................................................................................................................38Summary and conclusions.........................................................................................39
RESULTS OF ACHIEVEMENT TESTS................................................................................40Introduction................................................................................................................40Mathematics Achievement ........................................................................................42Language.....................................................................................................................42Gender Differences ....................................................................................................44Shifts............................................................................................................................46

--iii--
Age ...............................................................................................................................48Summary and Conclusions .......................................................................................48
EXPLAINING THE DIFFERENCES IN ACHIEVEMENT TEST RESULTS .....................50The Achievement Test ...............................................................................................50Background and Household Factors ........................................................................51Instructional Activity.................................................................................................55Transfers and Repetition...........................................................................................56Summary.....................................................................................................................56
PROGRAMME COSTS .........................................................................................................58Introduction................................................................................................................58Recurrent costs...........................................................................................................58Total Costs ..................................................................................................................59Summary.....................................................................................................................60
OPTIONS FOR EXPANSION AND REPLICATION ...........................................................61Teacher Salaries .........................................................................................................61Supervision .................................................................................................................61Community Self-Help ................................................................................................62Adapted Curriculum .................................................................................................62Local Recruitment of PSLC Teachers .....................................................................62
CONCLUSIONS AND RECOMMENDATIONS ..................................................................64Recommendations for Ministry of Education .........................................................65Recommendations for SCF .......................................................................................66
REFERENCES ........................................................................................................................68Appendix 1: GOVERNMENT PROCEDURES.....................................................................69
List of Figures
Figure 1 Frequency Distribution of Scores, All Schools ........................................................37
List of Tables
Table 1 Evaluation Design......................................................................................................10Table 2 Supervision Visits by SCF Staff and PEA's, 1995/96 .............................................15Table 3 Characteristics of School Committees.......................................................................17Table 4 Characteristics of Respondents to Household Survey ...............................................18Table 5 Selected Characteristics of Focus Group Participants ...............................................19Table 6 Parental Awareness and Participation in Children's Schooling ................................20Table 7 Teacher Qualifications by Type of School and Gender.............................................23Table 8 Class Size and Enrolment by Standard and School ...................................................24Table 9 Class Activity by Type of School ..............................................................................26Table 10 Teacher Workload Indicators by Type of School....................................................27Table 11 Selected Teacher Characteristics by Type of School ..............................................27Table 12 Parents' Report of Children's Absenteeism and Time Allocation............................29Table 13 Repetition Rates by Type of School and Gender.....................................................30

--iv--
Table 14 Promotion Rates by Type of School and Gender, Standard 1, ...............................31Table 15 Dropout Rates by School and Gender, Standard 1, 1994/95 ..................................31Table 16 Characteristics of Student Sample ...........................................................................33Table 17 Mean Mathematics Scores by Type of School ........................................................34Table 18 T-test Results for Comparison of Language Means ................................................35Table 19 Mean Language Scores by Type of School .............................................................36Table 20 Mean Test Scores by Type of School and Gender .................................................36Table 21 Frequencies Above Cut-off Points for Tests, by School Type ...............................38Table 22 Mean Maths and Language Scores by Shift in VBS Schools..................................39Table 23 Mean Scores by Age and School Type, Standard 2 Pupils......................................39Table 24 Mean Test Scores By Standard and Age .................................................................43Table 25 Regression and Logit Results ..................................................................................44Table 26 Test Scores by Individual Schools...........................................................................47Table 27 Classroom Instructional Activity by School's Level of Performance......................49Table 28 VBS Recurrent Costs, Year 2 .................................................................................50
--v--
LIST OF ABBREVIATIONS
AS Government school, assisted by Save the Children FederationBRAC Bangladesh Rural Action CommitteeCCAP Church of Central Africa PresbyterianDEO District Education OfficerEFA Education for AllGS Government school, not assisted by Save the Children FederationJC Junior Certificate MANEB Malawi National Examinations BoardMOE Ministry of EducationMSCE Malawi Secondary Certificate of EducationODA Overseas Development AgencyPEA Primary Education AdvisorPI Principal InvestigatorPSLC Primary School Leaving CertificateRA Research AssistantSCF Save the Children Federation (United States)SD Standard DeviationVBS Village based schoolUNESCO United Nations Educational, Scientific and Cultural OrganizationUSAID United States Agency for International DevelopmentVDC Village development committee
Exchange Rate March, 1996: MK14.89 = $1
--vi--
VILLAGE BASED SCHOOLS IN MANGOCHI:EVALUATION REPORT
Karin A. L. HydeEsme C. KadzamiraJuliet C. Sichinga
Mike P. ChibwanaRonald G. Ridker
EXECUTIVE SUMMARY
This evaluation compares four Village Based Schools (VBS) in Chilipa Zone,Mangochi District sponsored by Save the Children Federation/US (SCF) with three normalgovernment schools (GS) and three government schools that have received some assistancefrom SCF (AS). The VBS schools differ from the GS and AS schools in the following ways:
• Community selection of teachers• Local recruitment of teachers • Regular supervision by a resident supervisor• Reduced curriculum, focusing English, Chichewa, mathematics and general studies• Attending children came from a smaller catchment area than in the government
schools, from 1 - 4 villages instead of up to 9 villages• Regular refresher courses, in addition to induction courses for teachers• Teachers were mostly primary school graduates
Both the VBS and the AS schools received the following benefits from SCF:
• Textbook and school material supplementation• Access to SCF's other programmes, like child sponsorship
The principal objectives of the evaluation were to asses the following:
• whether the modified curriculum is boosting the learning achievements of thechildren in the village based schools in
• the effectiveness of teachers with PSLC qualification in teaching pupils in standards1 and 2
• the degree and impact of parental and community involvement in the building andrunning of the schools and in the selection of teachers
• the supervisory and management role played by SCF and the Ministry
The evaluation spent one day at each school. Approximately 30 Standard 2 studentswere given an achievement test specially developed for the evaluation; their classes wereobserved and their teachers and headteachers interviewed. In addition, the school committeesand village headmen were also interviewed. Supervisory personnel in the Ministry ofEducation and the SCF were also interviewed. The day after the school visit, a different team

--vii--
returned to the community to administer a questionnaire to the parents of the children whohad been interviewed the previous day.
The major findings were as follows:
• Supervision and Instructional support is better in VBS schools than in either theSCF-assisted or the government schools
• Children in VBS schools performed significantly better in English and Chichewathan children in other schools
• Little difference in community support was observable in the different communities,however the VBS parents had more contact with teachers
• Gender balance was better in VBS schools, with respect to, teachers, and schoolcommittees than in the other schools, but no significant difference was observed withrespect to pupil enrolment
• Promotion rates appear to be higher, and repetition rates lower in village basedschools than in the government schools
• The VBS school committees all exhibited a more active form of supervision ofteachers than in the other types of school
The principal reasons for the relatively better performance of the SCF schools wereidentified as: the emphasis on the core subjects, a better level of supervision, smaller classesand better use of instructional time.
We should emphasize that educational provision in this part of rural Mangochi wasgenerally poor, both in coverage and in quality.
We make the following recommendations for the government:
A. The government should ensure that PEAs have the necessary transport andsupport to carry out their training and supervision responsibilities in allschools
B. The government should permit, in situations when JC and MSCE holdersare not available, PSLC holders to teach in village schools.
C. The government should seriously consider expanding the number of villageschools, provided that there is training and supervision support
D. The government should re-examine its current distribution system to assess itseffectiveness. It could also approach commercial distributors, e.g. SouthernBottlers, MANEB, etc to assist in the distribution of textbooks and othermaterials.
E. The government should more strenuously exploit local recruitment in caseswhen housing is a problem
F. Class sizes in lower primary standards should be lowered and urgent help in
--viii--
class management and multi-grade teaching strategies be given to teachers ofthese classes
We have the following recommendations for SCF:
A. SCF should recruit a community worker to help mobilize communityparticipation in the schools
B. SCF should sponsor another evaluation within two years to assess whether (i)the PSLC teachers remain effective in Standards 3 and 4 (ii) VBS pupils cantransfer smoothly into full primary schools (iii) detailed analysis of the gender dynamics within the VBS classrooms
C. Local builders should be compensated for their full time effort during theconstruction of classroom blocks
D. SCF should promote study visits of teachers in neighbouring governmentschools to SCF village schools to observe the instructional environment
--ix--
1 INTRODUCTION
1.1 Background
A country's responsibility to provide quality basic education for its children has nowbeen accepted by most countries around the world. This is evident from declarations that havebeen made in diverse conferences that were, for instance, organized by UNESCO in the 1960's,at the 1990 conference in Jomtien and most recently at the Education for All (EFA) mid-decadereview conference in Johannesburg. These conferences were inspired, in part, by a growingbody of research evidence that indicates that primary education strongly facilitates nationaldevelopment endeavours (Benavot 1989). There is evidence that primary education improvesproductivity in the formal and informal sectors both in the rural and urban areas. Further,primary education for girls tends to: reduce fertility rates and improve family nutrition. It alsoreduces both child and infant mortality rates (Floro & Wolf 1990; King & Hill 1993).
Malawi is a country that is currently making great efforts to increase schooling levels. It is one of a very few countries in the region that has had some success in increasing netenrolments of primary age children in the 1990s (Hyde 1996). Despite this progress, Malawi'sprimary education system is still besieged by numerous problems. Among the most prominentare: high drop out rates; high pupil:teacher ratios; high repetition rates; inadequate teachinginfrastructure; and mediocre teaching methodologies that emphasize rote learning at the expenseof fostering understanding of the content being delivered.l
The educational system of Malawi experienced slow but steady growth sinceindependence in 1963 up until the 1992/3 school year. For the whole of this period primary netenrolment rates, the measure of the percentage of .the cohort in school, was never greater than50 percent for boys, with a narrowing but persistent gender gap in favour of girls. A USAID-funded initiative provided a large infusion of funds into the educational system starting in1992/3, part of which was used to finance the schooling of non-repeating girls in primary school. The introduction of essentially free primary education for girls led to a jump in the numbers ofgirls in primary school and a reversal of the gender gap. For the first time in Malawi’s history,there were more girls enrolled in primary school than boys.
However, when the present government was elected in 1993, an important plank of itselection campaign was an “education for all” pledge. The abolition of fees and uniformrequirements opened the doors of primary school to all without restriction to age and wasenthusiastically taken advantage of by the citizens of Malawi. By some estimates, the primaryschool population doubled in 1994/5 school year. The Ministry of Education made valiantefforts to accommodate this expansion; hiring 19,000 new “temporary” teachers and providingthem with a two-week induction course; providing for the printing and distribution of additionaltext and exercise books.
The education system continues to have many problems, most of which have beenexacerbated by the dramatic rise in enrolments. Dropout, particularly at the primary level, hasrisen. The rise in enrolments have been uneven, so that while some areas have been relativelylittle affected, others have seen standard 1 enrolments double or even treble. The new entrantsranged widely in age, so the standard 1 teachers can be faced with classes of two or three

--10--
hundred aged from 6 to 20. The Ministry is still grappling with the problems this poses forinstructional methods and materials, not to mention the continued viability of the open doorpolicy.
Malawi maintains an 8-4-4 system with an examination, the PSLE (Primary Schoolleaving examination), at the end of the primary cycle to certify satisfactory completion. In 1993,no more than 11.5 percent of those who passed found places in secondary school.
At the start of primary school Chichewa is the medium of instruction, with Englishintroduced as a subject. Instruction in English starts towards the end of the primary cycle. Forthe first two years, the school day is 3.5 hours long, generally starting at about 7.30 AM.
Mangochi, a district that lies on the lake shore in the southern region of Malawi, has alarge Muslim population and has ranked quite low in access to education for a long period. Female participation is below average for the country. The district is an important centre fortourism in the country, but fishing and agriculture (both subsistence and estate) are alsoimportant economic activities.
The part of Mangochi in which the project is located is a hilly area in the centre ofMangochi. It is relatively undeveloped, generally without electricity, telephones or tarmac roads.
1.2 Project History
In 1993 Save the Children Federation/US (SCF) identified Mangochi as a potential sitefor an educational intervention. Mangochi was one of the districts lagging behind in theprovision of primary schooling, with 51 percent of the school going population out of school.
Focus group discussions conducted by SCF in Mangochi revealed many of the problemsalready cited above. However, particular emphasis was placed on, among other things, thefollowing: poor access to schools because of long distances to school and geographical barrierslike rivers; lack of reliable sources of income to finance schooling; irrelevant curriculum fromthe point of view of both parents and pupils; and also the high opportunity cost of sendingchildren to school.
Given these factors that militated against schooling in Mangochi, SCF decided tointroduce the Village Based Schools (VBS) model based on SCF's similar efforts in Mali and theBangladesh Rural Action Committee (BRAC) project in Bangladesh. These experiences werethen integrated with SCF's findings in Mangochi to arrive at a viable model for the Malawicontext. Within the district, SCF's efforts focused on Chilipa zone because it was an area inwhich the issues of long distance and geographical barriers were more pronounced1.
Given the size of Chilipa zone, criteria for site selection had to be arrived at to identifythe four villages that were to be the initial project areas. In choosing these villages the following
1 SCF has since opened four schools in Malindi, another area of Mangochi.

--11--
considerations were paramount:
a) the distance from a village to the nearest school. Villages whose nearest schoolswere at least 5 kilometres away were given first consideration.
b) the existing number of out-of-school children likely to register in the event of aschool being erected; and
c) the willingness of the community to engage in self help work through theprovision of their labour for building and maintaining the school structures.
These village based schools differed on a number of key dimensions from existinggovernment schools in the area, namely --
• the teachers were selected by the communities,• most of the teachers had only a primary school leaving certificate and• the national primary school curriculum had been modified to focus on the core
subjects of Chichewa, mathematics, English and general studies.
In endeavouring to turn their intentions into reality, SCF sought the cooperation of otheragencies from the very beginning. The Ministry of Education (MOE) has, for instance, been aconsistent and active partner. The Ministry, through the district education officer's (DEO) office,assists in the provision of instructional materials for both pupils and teachers, assists SCF in thetraining and supervision of the project teachers by providing resource persons; and has alsobegun to incorporate those teachers with ten years of schooling, i.e. a junior certificate (JC), andhigher qualifications into the government's recurrent budget in the second year of the project.
The SCF now oversees eight schools in Chilipa zone, enroling 1695 children andemploying 37 teachers in December, 1995. In addition it provides some support to allgovernment schools in the zone.
At the time the schools were started, and in preparation for SCF's eventual withdrawal,the communities were asked to select a nominal proprietor who would take over responsibilityfor the schools. In Chilipa, the Catholic Church was nominated, and the Moslem Associationof Malawi in Malindi.
The Moslem Association of Malawi has hired an individual to assist in the supervisionof the teachers in the Malindi schools. The discussions with the Catholic Diocese of Mangochihave not yet been as successful and SCF still bears most of the responsibility for supervision inChilipa zone.

--12--
1.3 Recruitment procedures2
Pupils - The recruitment of pupils into the VBS schools was guided by the desire toaccommodate children who lived too far from existing schools. In essence the VBS were,therefore, geared at providing schooling to its clients for the first three years so that the graduatescould join the existing government schools in standard 4. The assumption was that they wouldthen be old enough and strong enough to walk the longer distances to the government schools.
It should be noted that a number of provisos were attached to pupil recruitment:
1) the schools were to enrol pupils who were between six and twelve years old only;2) pupils who had spent at least one academic year in any form of school were to be
denied entry; and3) class sizes were to be restricted to a maximum of 35 pupils4) pupils were only supposed to come from the village in which the school was
located
Subsequently, all the above restrictions appear to have been relaxed. At parents'insistence, children both below and above the age limit were admitted. Anecdotal reports duringthe focus groups seemed to indicate that some children were withdrawn from schools outside thevillage to enrol in the village based schools. The class sizes were increased to a maximum of50 to be more in line with MOE guideline of 1:60. Finally, the communities allowed childrenfrom up to four neighbouring villages to attend the schools.
Teachers - The teachers were selected from the community, primarily through the chiefand his advisors. When requested to nominate teachers, the criteria were in conformity withMinistry of Education guidelines, i.e. that the individual have at least a JC and be of goodcharacter. However, most communities had no such individual living in their village. Afterdiscussion with the Ministry of Education, the requirement was lowered to Primary SchoolLeaving Certificate (PSLC)3. The candidates were then asked to sit for an aptitude test andundergo an oral interview in English. This was to ensure that they had the basic competenciesrequired to teach Standards 1 to 3. The successful candidates were then ranked and thecommunity made a final selection from this list. Character, not competence, was the overridingconcern for the community. Those chosen to be teachers were then given a two week trainingcourse. The training covered the presentation of lessons, maintenance of schemes of work andother records and lesson delivery. Some started teaching immediately and each village schoolhas at least one stand-by teacher who is called on when other teachers are dismissed, go onmaternity leave or resign.
2 See appendix 1 for a description of government procedures.
3l This is an accommodation that the government frequently makes for teachers who will be hired andpaid by NGOs. However, it insists that all government supported teachers must have at least a JuniorCertificate.

--13--
The VBS teachers are mostly young, between 22 and 35, and have never taught before.
The selected teachers were supposed to stay in the same schools and remain with thesame pupil cohort for three years.
1.4 Conditions of employment
All the teachers employed in these schools were paid by the SCF for the first year of theiremployment. It was envisaged that during the second year, the Ministry would include theteachers on its payroll. To facilitate a smooth handover of salary responsibility, SCF establisheda fund at the DEO's office to allow the teachers to be paid through the government payroll fromthe very beginning so that the VBS teachers would get accustomed to the Ministry's paymentprocedures.
The PSLC teachers with the VBS are all paid at a rate of MK358 per month, agreed atin consultation with the Ministry of Education. The rate for the MSCE teacher is over MK700a month. The teachers are all encouraged to upgrade their educational qualifications and aregiven help to study by correspondence for the JC and MSCE. The salaries of those teachers withthe higher qualifications are already being paid by the government at government rates in thesecond year of the schools. 1.5 Curriculum adaptation
During the planning phase, it was decided to focus the curriculum on the core subjectsof Chichewa, English, mathematics and general studies. They spend 30 periods a week (15hours) on instruction in these subjects, while Government schools spend 24 periods, or 12 hours,a week on these four subjects. Other subjects that are part of the official syllabus, i.e. music,physical education, and creative arts are supposed to be incorporated into the teaching of the coresubjects in VBS schools. The VBS children are not given explicit religious instruction.
These curriculum decisions appear to have been taken for several reasons. One was toincrease the likelihood that the children would acquire literacy and numeracy quickly. It wasdesired that children be able to transfer easily into the full primary government schools and itwas thought this would be more easily accomplished if their literacy were well established. Another reason was that dropout rates in the early standards were high and again it was desiredto increase the chances of pupils gaining literacy and numeracy before they dropped out.
In order to respond to the needs of the community, and make use of limited classroomspace, a number of additional features were incorporated. For example, all schools run a doubleshift. The morning shift runs from 8 am to 11.20 am and the afternoon shift from 12 pm or 1 pmto 3.20 pm or 4.20 pm. A mixture of standards come to the morning and afternoon shifts andhave a different set of teachers. On Fridays in some schools, afternoon classes start at 1.30 pmto accommodate those children who attend the Mosque.
--14--
1.6 Instructional materials
While the VBS schools are included in the distribution of textbooks that come to theDEO's office, SCF has also purchased some textbooks that were in short supply directly from the publisher. In addition, SCF supplies exercise books, chalk, chalk boards, etc both to thevillage based schools and to all the government schools in the Chilipa zone. Teachers also gotadditional materials, like charts and pentel pens for making their own charts and classroomillustrations. Each school was supposed to have a trunk for storage of the textbooks and othermaterials. However, one VBS school which had no doors stored its materials in the schoolcommittee chairperson's house which was nearby.
Teachers were encouraged to be innovative in the development of instructional materials. For example, they use resources available in the local environment to make paper substitutes. Dried banana leaves were frequently used for charts and teachers were taught to produce apermanent ink by dissolving coloured chalk in sugar water. Pupils were also encouraged tomake individual counters from reeds and string.
Each VBS classroom is supposed to have two centres of learning -- a nature table and ashopping corner. The tables were to be developed jointly by the teacher and pupils. The pupilswere encouraged to bring old containers and wrappers for the shopping corner and unusualleaves, stones, maize cobs, etc for the nature table. All classrooms we visited had these centresof learning.
1.7 Monitoring procedures
A supervisor was hired to cover the original four schools and now has responsibility forall the eight SCF schools in the Chilipa area. He uses the small SCF field office in Chilipavillage and lives nearby. He fills the role for the VBS that the primary education advisors aresupposed to fill for the government schools, i.e. conduct regular supervision visits to each schoolevery three weeks. During these visits he is supposed to inspect lesson plans and schemes ofwork, observe lessons and meet the headteacher to review records. He is also supposed todiscuss problems with individual teachers. Frequently, supervision visits are done incollaboration with PEAs.
Each school has a school committee with elected and/or nominated officers. There wasa requirement that women be represented on the committee. As these communities have neverhad a school before, their school committees were given training in the roles of the differentofficers and of the schools and asked to produce a plan of action for the development of theschool. These committees were also expected to have general oversight of the school, keepingtrack of absenteeism among pupils and teacher conduct and performance. The village headmanis always an ex-officio member of the committee.
1.8 Assistance to Government Schools
As part of the project, SCF also provided assistance to all 19 government primary schoolsin the Chilipa zone. In collaboration with the Ministry, in-service courses were provided forteachers and headteachers. It also provides or assists in the transport of school materials (chalk,exercise books, textbooks) to the government schools. It provided training for the school

--15--
committees in project planning, organization, implementation and evaluation. Practical help likeproviding fertilizer for school maize plots or seedlings for woodlots was also available. Trainingwas also furnished to PEAs and the SCF supervisor in techniques for supervision and guidanceof both para-professional and qualified teachers.
1.9 Village Based Model
In summary, the SCF village based schools have the following features that make themdifferent from other schools in the area:
• Community selection of teachers• Local recruitment of teachers • Regular supervision by locally resident supervisor• A reduced curriculum, emphasizing the subjects of English, Chichewa, mathematics
and general studies• Attending children came from a smaller catchment area, from 1 - 4 villages
The teachers are:
• Mostly primary school graduates• Given regular refresher courses, in addition to the induction course
Features they share with other schools in the area (also assisted by SCF) include:
• Textbook and school material supplementation• Access to SCF's other programmes, e.g. child sponsorship
2

--16--
EVALUATION DESIGN
2.1 Rationale
One and a half years after the schools' establishment and in preparation for the eventualSCF withdrawal of support, it was thought necessary to evaluate the effectiveness andsustainability of the schools in their present form. Further, SCF is actively pursuing funding forthe establishment of 50 new schools in Mangochi and Machinga, twenty-five of them by April1997.
In a wider context, the government of Malawi, in partnership with the Britishdevelopment agency, ODA, was developing a nationwide community schools programme as partof its drive to expand schooling. It was considered that the evaluation would also provideimportant information for this new initiative.
2.2 Objectives
In order to evaluate the impact of schools in the communities, the following were to beassessed:
• the evidence as to whether the reduced curriculum is boosting the learningachievements of the children in the village based schools in comparison with childrenin normal government schools and the SCF assisted government schools
• the effectiveness of teachers with PSLC qualification in teaching pupils in standards1 and 2 and what support, if any, is required to maintain or improve this effectiveness
• the degree of parental and community involvement in the building and running ofthe schools and in the selection of teachers and whether this has an impact on dropoutrates, on the participation of girls and on teacher accountability and effectiveness.
• the supervisory and management role played by SCF/US, the Ministry of Educationand other NGOs involved in the village schools
The evaluation was also expected to assess overall progress towards project objectivesand the feasibility of replicating the experience. In making the above assessments, the evaluationteam was expected to measure impact, indicate which factors/interventions are contributing toor detracting from that impact, and provide recommendations for improving the implementationof the project.
Specifically, the tasks would be to:
1. Compare levels of achievement between pupils in village based schools, SCF-assistedgovernment schools and ordinary government schools in the same area.
2. Assess and compare the instructional competence of teachers in village based schools,SCF-assisted schools and government schools in the same area.

--17--
3. Compare the pedagogical and administrative competence of headteachers in the SCF-assisted schools and the village based schools.
4. Assess the nature of the cooperation and collaboration between the school committees,the Ministry of Education at the district level, the communities and other NGOs in thearea and the implications for further collaboration.
5 Assess the level of parental satisfaction with the village based schools and their level ofinvolvement as compared to parents from the government schools.
6. Assess the cost per child of the village based schools and compare it with the cost perchild in the full government primary school4.
7. Assess the relative dropout, attendance and intake rates in the three types of schools,depending on the data available.
8. Assess the relative contribution of household and background characteristics to studentachievement
However, the absence of a baseline study and the poor record keeping encounteredin schools considerably hampered the evaluation team's ability to make definitiveassessments in several areas of interest.
2.3 Evaluation Team
The evaluation exercise took place over five weeks in February and March 1996. Theteam consisted of Dr. Karin Hyde (consultant and team leader), Ms. Esme Kadzamira and Mr.Mike Chibwana from the Centre for Educational Research and Training, and Mrs. Juliet Sichingafrom the Planning Department of the Ministry of Education. For the first two weeks, the teamwas joined by Dr. Ronald G. Ridker of the Institute for Policy Reform in Washington D.C. Withthe assistance of the Centre for Social Research, Dr. Ridker developed a householdquestionnaire that was administered to parents of tested children.
2.4 Description of Samples
2.4.1 School Based Study
Schools: Ten schools in all were visited. The four village based schools that had beenin operation for a year and half were all included. Two of the village schools were visited duringthe morning shift and two during the afternoon shift. Also included were three governmentschools in the Chilipa zone that had been the recipient of SCF assistance (details in section 1.8). The remaining three schools were selected from the Malindi/Namwera area and the MonkeyBay area. The SCF-assisted and government schools were randomly selected from a list of
4 Objectives 6 and 7 were dependent on data availability from the government, SCF and the schools.

--18--
schools, jointly compiled by the SCF programme manager and the DEO's office, that were stillaccessible by four-wheel drive. The damage to roadways caused by the heaviest rains in adecade made this restriction necessary5.
Students: An achievement test based on the national primary curriculum in English,mathematics and Chichewa was specially constructed for this exercise. Pre-testing was done intwo schools in Zomba district. A sample of approximately 30 Standard 2 students was selectedfrom each school using a systematic random design. Sampling was done independently bygender. The population from which the sample was drawn varied from school to school (seetable 8). The breakdown by gender, age and type of school is shown in table 16. The initial planwas to test a small sample of out-of-school children of about the same age to simulate resultsfrom a baseline. Unfortunately, we were unable to obtain names of out of school6 children anddecided instead to test approximately five children in standard 1 from the last seven schoolsvisited.
Teachers: While the focus was on standard 2 teachers, in practice at least one standard1 teacher was observed and interviewed at each school visited. The teacher was interviewedabout current teaching load, experience, qualifications, availability of pupil books and teachers'guides, the development of instructional material and the source and nature of instructionalsupport.
5 We believe this procedure positively biased the sample of government schools. We chose from a setof schools that were more established, closer to trading and administrative centres and with better roadcommunication.
6 We tried getting the names of out of school children from village headmen and headteachers, but wewere either told that there were no children out of school or were provided with names of six and seven year oldchildren.
--19--
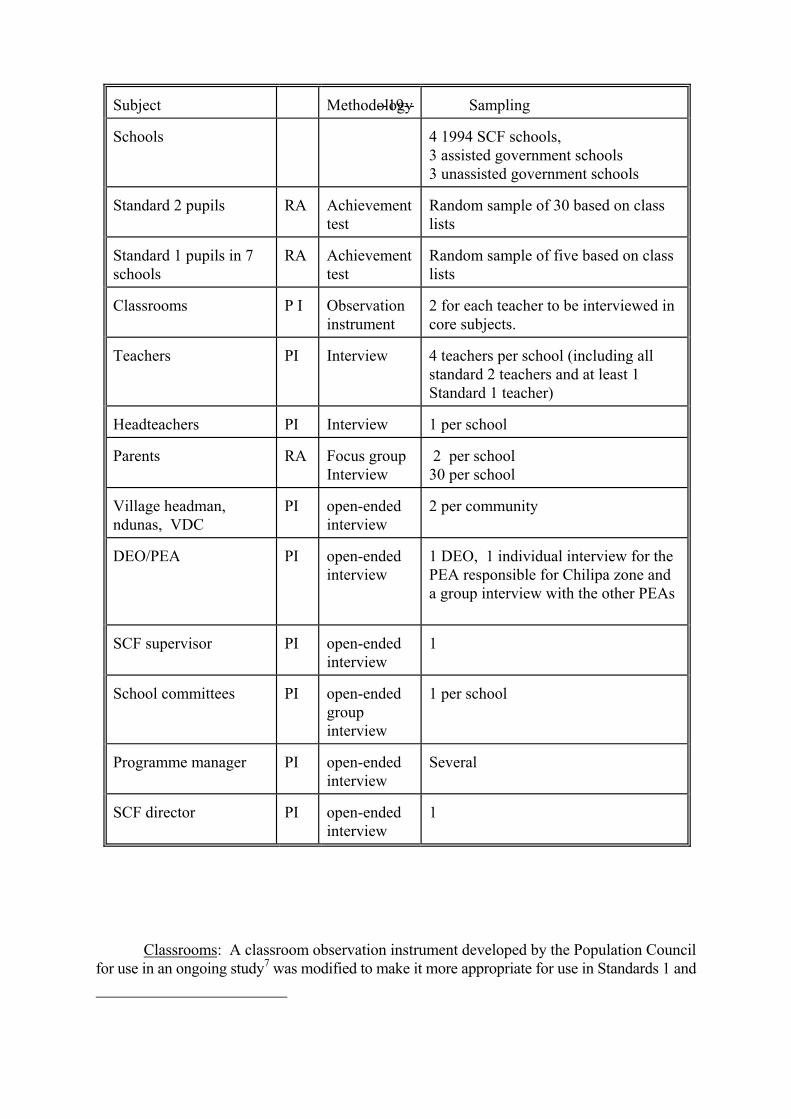
Classrooms: A classroom observation instrument developed by the Population Councilfor use in an ongoing study7 was modified to make it more appropriate for use in Standards 1 and
Subject Methodology Sampling
Schools 4 1994 SCF schools,3 assisted government schools3 unassisted government schools
Standard 2 pupils RA Achievementtest
Random sample of 30 based on classlists
Standard 1 pupils in 7 schools
RA Achievementtest
Random sample of five based on classlists
Classrooms P I Observationinstrument
2 for each teacher to be interviewed incore subjects.
Teachers PI Interview 4 teachers per school (including allstandard 2 teachers and at least 1Standard 1 teacher)
Headteachers PI Interview 1 per school
Parents RA Focus group Interview
2 per school30 per school
Village headman,ndunas, VDC
PI open-endedinterview
2 per community
DEO/PEA PI open-endedinterview
1 DEO, 1 individual interview for thePEA responsible for Chilipa zone anda group interview with the other PEAs
SCF supervisor PI open-endedinterview
1
School committees PI open-endedgroupinterview
1 per school
Programme manager PI open-endedinterview
Several
SCF director PI open-endedinterview
1

--20--
2. The instrument looked at instructional methods used by the teacher, questioning behaviourand the allocation of time within a 30 minute period. In addition, note was taken of seatingarrangements, furniture and instructional materials present in the classroom and the use of texts. This modified instrument was also pre-tested in Zomba district.
Community Leaders: The village headman and/or his ndunas (advisors) were askedabout how individuals from his/her community were mobilized to build the school, their currentrole, if any, with the school, their satisfaction with the school and teachers, and any efforts beingmade to increase the participation of girls
Parents: The parents were asked to come to the school after the session was over andparticipate in a focus group discussion covering their contribution to the development of theschool, its current operations, their level of satisfaction with the school and the teachers and, forthe parents in the village based schools, the possibilities of transferring responsibility forpayment of teacher salaries to the local community. A brief questionnaire was also administeredto the 242 focus group participants either before or after the discussion when basic demographicdata was gathered (see table 5). Two discussions were held in all but one VBS school. It rainedvery heavily that afternoon and only a few parents turned up.
Headteachers: The headteacher was questioned about links with the Ministry and/orSCF, instructional support, cooperation with parents, the community, the school committee andcommunity leaders as well as constraints to the smooth functioning of the school. Whenpossible, we obtained promotion, repetition and dropout statistics for Standards 1 and 2 . Weinterviewed ten headteachers, including two females, one from a government and one from aVBS school.
School Committees: Members of each school committee, the chair and two members,were asked about the composition of the committees, the training they had received, their currentrole with respect to the schools and their level of satisfaction with the school and teachers.
The District Education Officer, the Primary Education advisors and the SCF supervisorwere also interviewed on their links with, views of and expected future involvement with thevillage schools.
2.4.2 Household Survey
Parents: On the day following the visit to the school, 234 of the parents of the testedchildren were interviewed individually at home. This household interview sought to elicitinformation on parental education, income and resources as well as attitudes towards schooling. .2.5 Organization
The two complementary studies, one school based and the other household based, werecarried out simultaneously.
7 "Schooling and the Experience of Adolescents in Kenya".
--21--
Over the period of the study, the school team visited one school a day when the pupilswere given an achievement test8 , teachers and headteachers were interviewed and standard 1 and2 classrooms were observed. The students to be tested were selected the previous day when oneof the principal investigators visited the school. The parents of the tested students were invitedto attend a focus group discussion after school on the same day their children were tested. Theofficers of the school committee and the village headman and his advisors were also interviewed. To get a picture of the administrative and supervisory context in which these schools operated,the district education officer, the primary education advisors, the SCF education supervisor, andthe SCF field director were also formally interviewed. A less formal series of conversations washeld with the SCF programme manager who was based in Mangochi for additional backgroundand information. The household team followed the next day and interviewed the parents of thetested children from a list prepared by the school team.
Data collection for the school based study was done by a team of 8. The four principalinvestigators observed classes, interviewed teachers and headteachers and collected schoolrecord information. They also interviewed the school committee officers and the villageheadmen and advisors. Four research assistants carried out the testing of pupils and conductedthe focus group sessions.
Data for the household survey was collected by a team of three research assistantssupervised by a Research Fellow from the Centre for Social Research.
The interviews for the DEO, PEA, and SCF officers were conducted in English as werethe headteacher interviews and some teacher interviews. The rest of the interviews and thetesting were conducted in Chichewa, with some of the focus groups being conducted in Yao.
2.6 School Environment
The communities in which these schools were located were all at least thirty minutesfrom the boma9, in rural Mangochi. The government schools were all closer, between thirtyminutes and one and a quarter hours away from the boma and none was more than a kilometreaway from a tarmac (or formerly tarmacked) road. The closest VBS school was about two hoursaway and forty five minutes from a tarmac road. Both the AS schools and the GS schools werelocated in larger, more diverse villages -- that had markets, grocery shops, tailors, restaurants,tea rooms, large churches or mosques and even health centres. VBS villages in general did nothave such facilities.
The children in government and SCF-assisted schools were better off -- less likely to bewearing rags and more likely to be wearing shoes, although this was rare.
8 The test development exercise was led by Ms. Kadzamira with the assistance of two primary teachersand input from Ron Ridker.
9 District administrative centre.

--22--
The results of both the school based study (teachers, students, school committee) and thehousehold survey are reported in the subsequent chapters. In general, when the findings comefrom the household interviews, they are explicitly described as such. Otherwise, it can beassumed that the findings come from the school study.
* * * * * * * * * * * * *
The following sections deal with our investigation of the implications of the differences in teacher background, support and curriculum for the learning achievement of children, thelevels of dropout, repetition and promotion and of community involvement. Most results willbe presented in a three way comparison, between the village based schools (VBS), the SCF-assisted schools (AS) and the government schools (GS). A three way comparison was thoughtto be most useful because of the number of innovative features and additional support introducedin the village schools. The AS schools had benefited from a sub-set of the support services, i.e.provision of exercise books, educational materials, etc, and would therefore be useful forcomparison with both the village based and the government schools.
3

--23--
THE ADMINISTRATIVE ENVIRONMENT
3.1 Administrative Backup
All schools in the Mangochi area, including the VBS schools come under the generalsupervision of the District Education Officer. In practice, this means that
he participates in the planning for theestablishment of the schools, approves the finalplans and is kept informed of all developments. All practical details of development,maintenance, etc are handled by the staff of theSCF.
The SCF Education ProgrammeManager lives and works in Mangochi townand is responsible for all twelve VBS schoolsin Mangochi.
SCF also employs a supervisor in theChilipa zone who supervises those schools andis assisted by an employee of the MoslemAssociation of Malawi in the Malindi zone.
Administrative and instructionalsupervision of the government schools is theresponsibility of the Primary EducationAdvisors or PEAs (formerly known asInspectors). There are seven of them inMangochi district and each is responsible for azone which covers between 19 and 29 schools.
Unfortunately, all the PEAs live in the two largest towns in the district, either inMangochi town or Monkey Bay, and although they had three working motorbikes three yearsago, now they have only one that barely functions. Therefore, their movements are limitedcurrently to walking or public transport. For this and other reasons -- including inadequatesupplies of stationery and an unsatisfactory system of allowance payments -- the PEAsdeclared themselves unable to fulfill their assigned role of regularly visiting schools andadvising teachers.
On the other hand, the PEAs would accompany the SCF supervisor on visits to the VBSschools when they would utilize the transport provided by SCF.
3.2 Responsiveness
The visitors' books of all schools were inspected for the number of supervisory visits byeither SCF or the PEAs for the 1995/96 school year and the results tabulated in table 2.
SCHOOL SCF PEA TOTAL
VBS 1 4 2 5
VBS 2 4 2 4
VBS 3 5 3 5
VBS 4 1 1 2
AS 1 2 2
AS 2 0
AS 3 0
GS 1 1 1
GS 2 0
GS 3 0NB The SCF supervisor and the
PEA would sometimes visit schools as a team,consequently the total number of visits is lessthan the sum of individual visits.

--24--
The village based schools were being visited frequently and the government school wereseldom visited. The impact of this could be seen in several dimensions. First, records werepoorly kept in most government schools, both SCF - assisted and ordinary government schools. The registers were often incomplete. Required information like age, parent's name or villagewas often missing and attendance was not marked either systematically or regularly.
The government teachers were seldom, if ever, observed teaching by the PEAs andtherefore had little opportunity to discuss problems or teaching strategies with the qualifiedexperts.
The PEAs did visit the government schools for MANEB to deliver examination papers,and occasionally to deliver salaries, and we feel these visits should be used to supervise andguide teachers.
3.3 Summary and Conclusions
The SCF manages the VBS schools with the full cooperation of the Ministry ofEducation. For a variety of reasons, including the local residence of the supervisor andavailability of transport, the SCF staff are able to visit the VBS schools and keep themadequately supplied with materials like stationery, chalk, etc. They can also ensure thattextbooks, when available in the district, are supplied to the schools. The government schools,on the other hand, are almost never visited by the primary education advisors.
--25--
4 COMMUNITY INVOLVEMENT
4.1 School Committees
The school committees were seen as the major link between the community and theschool.
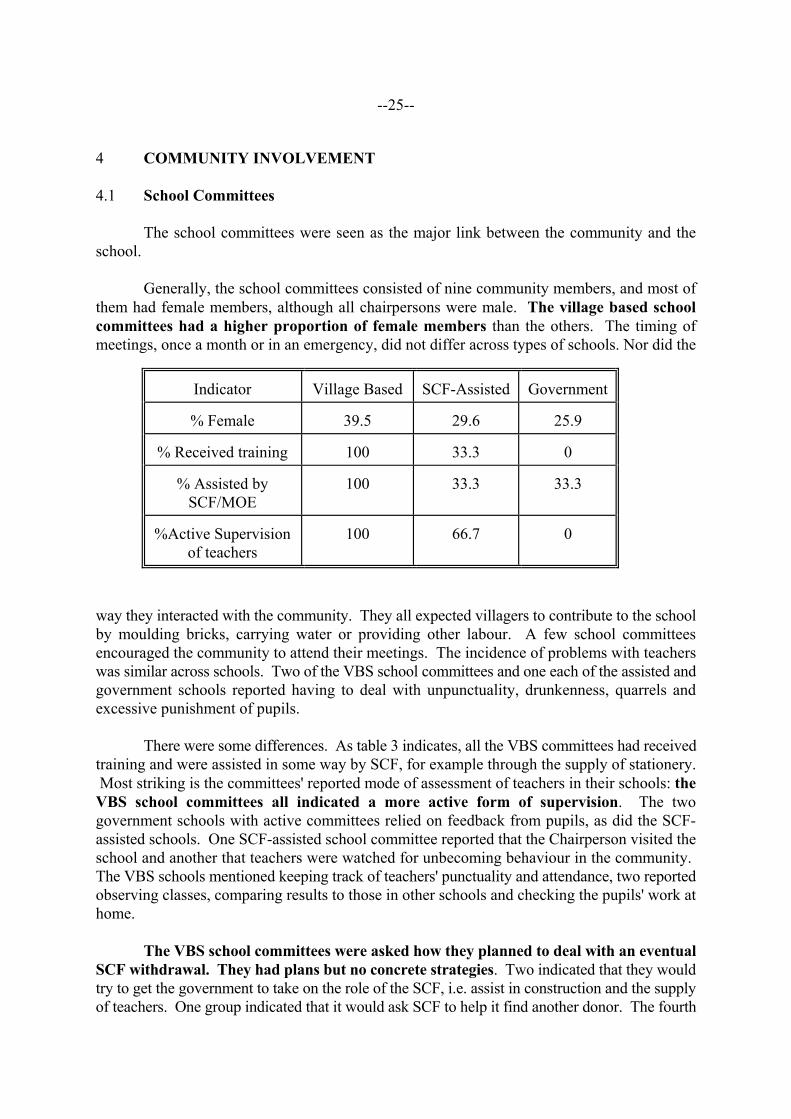
Generally, the school committees consisted of nine community members, and most ofthem had female members, although all chairpersons were male. The village based schoolcommittees had a higher proportion of female members than the others. The timing ofmeetings, once a month or in an emergency, did not differ across types of schools. Nor did the
way they interacted with the community. They all expected villagers to contribute to the schoolby moulding bricks, carrying water or providing other labour. A few school committeesencouraged the community to attend their meetings. The incidence of problems with teacherswas similar across schools. Two of the VBS school committees and one each of the assisted andgovernment schools reported having to deal with unpunctuality, drunkenness, quarrels andexcessive punishment of pupils.
There were some differences. As table 3 indicates, all the VBS committees had receivedtraining and were assisted in some way by SCF, for example through the supply of stationery. Most striking is the committees' reported mode of assessment of teachers in their schools: theVBS school committees all indicated a more active form of supervision. The twogovernment schools with active committees relied on feedback from pupils, as did the SCF-assisted schools. One SCF-assisted school committee reported that the Chairperson visited theschool and another that teachers were watched for unbecoming behaviour in the community. The VBS schools mentioned keeping track of teachers' punctuality and attendance, two reportedobserving classes, comparing results to those in other schools and checking the pupils' work athome.
The VBS school committees were asked how they planned to deal with an eventualSCF withdrawal. They had plans but no concrete strategies. Two indicated that they wouldtry to get the government to take on the role of the SCF, i.e. assist in construction and the supplyof teachers. One group indicated that it would ask SCF to help it find another donor. The fourth
Indicator Village Based SCF-Assisted Government
% Female 39.5 29.6 25.9
% Received training 100 33.3 0
% Assisted bySCF/MOE
100 33.3 33.3
%Active Supervisionof teachers
100 66.7 0
--26--
group had plans for developing a garden and getting a loan from SCF to start trading in beans.
4.2 Parental Involvement and Satisfaction
The parents and community leaders in all the villages experienced similar types ofinvolvement in the development of their schools. Whether under direct MOE supervision, theCatholic diocese or the SCF, they reported that their involvement in the construction of theschool was limited to summoning villagers and organizing their work on the part of thecommunity leaders, or of moulding bricks and fetching water, sand and stones.
Although the communities were supposed to have decided on the reduced curriculumthemselves, none of the parents who participated in the focus groups were aware that a choicehad been made and the reasons for the choice. So several individuals indicated that they wouldprefer that subjects like religious education, health education, science or agriculture be added tothe curriculum.
Only those parents who were members of the School Committee felt that they had acontinuing involvement with the school. There appeared to be little or no resentment of this stateof affairs. Many parents indicated that given their illiteracy and general lack of educationthey were not competent to have a say in the day to day affairs of the school in theircommunity.
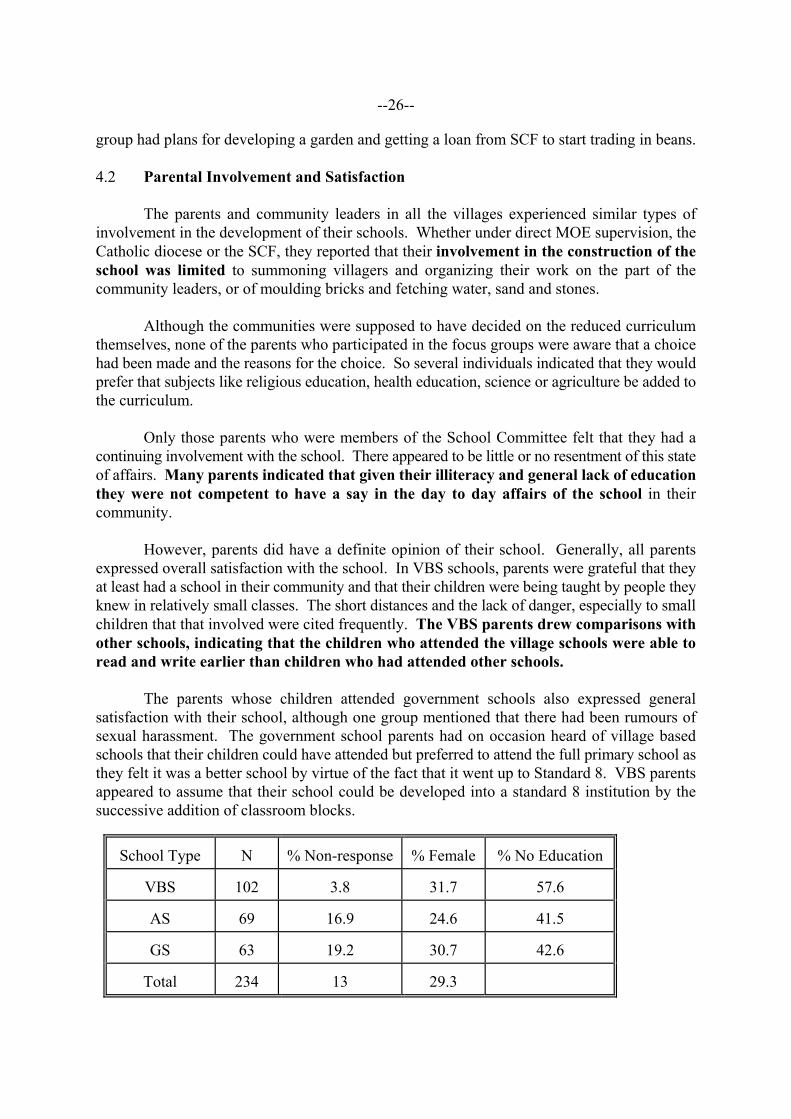
However, parents did have a definite opinion of their school. Generally, all parentsexpressed overall satisfaction with the school. In VBS schools, parents were grateful that theyat least had a school in their community and that their children were being taught by people theyknew in relatively small classes. The short distances and the lack of danger, especially to smallchildren that that involved were cited frequently. The VBS parents drew comparisons withother schools, indicating that the children who attended the village schools were able toread and write earlier than children who had attended other schools.
The parents whose children attended government schools also expressed generalsatisfaction with their school, although one group mentioned that there had been rumours ofsexual harassment. The government school parents had on occasion heard of village basedschools that their children could have attended but preferred to attend the full primary school asthey felt it was a better school by virtue of the fact that it went up to Standard 8. VBS parentsappeared to assume that their school could be developed into a standard 8 institution by thesuccessive addition of classroom blocks.
School Type N % Non-response % Female % No Education
VBS 102 3.8 31.7 57.6
AS 69 16.9 24.6 41.5
GS 63 19.2 30.7 42.6
Total 234 13 29.3
--27--
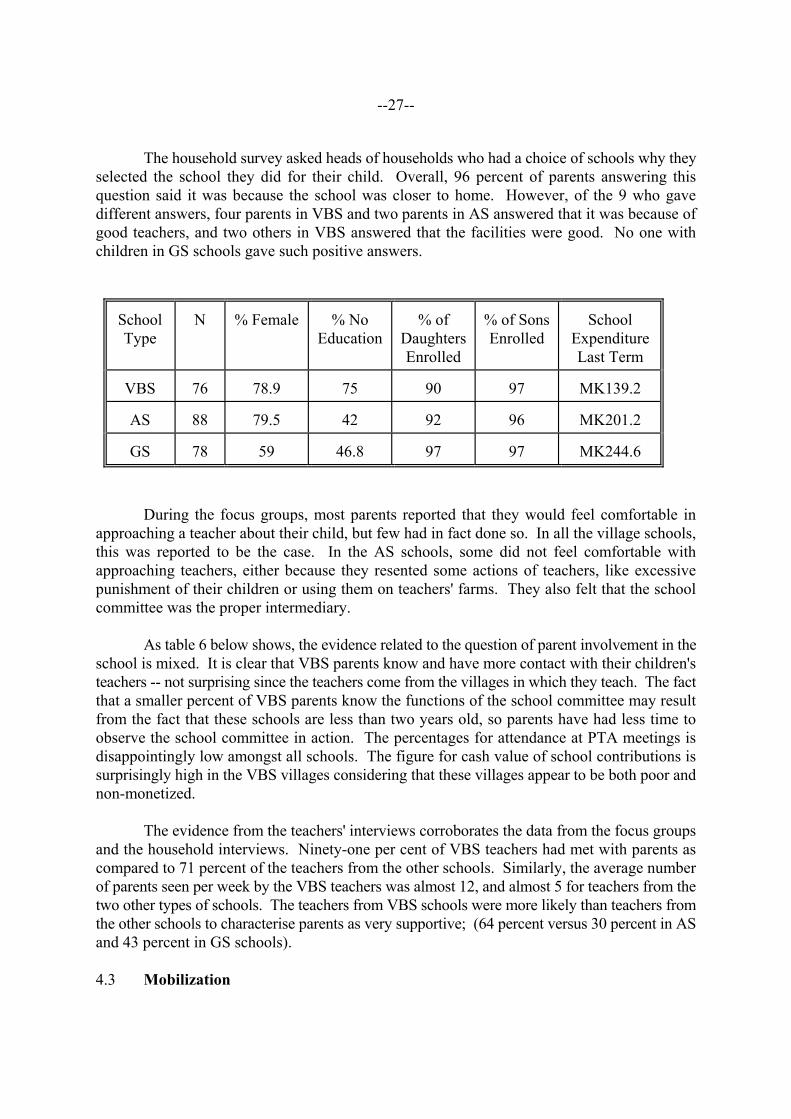
The household survey asked heads of households who had a choice of schools why theyselected the school they did for their child. Overall, 96 percent of parents answering thisquestion said it was because the school was closer to home. However, of the 9 who gavedifferent answers, four parents in VBS and two parents in AS answered that it was because ofgood teachers, and two others in VBS answered that the facilities were good. No one withchildren in GS schools gave such positive answers.
During the focus groups, most parents reported that they would feel comfortable inapproaching a teacher about their child, but few had in fact done so. In all the village schools,this was reported to be the case. In the AS schools, some did not feel comfortable withapproaching teachers, either because they resented some actions of teachers, like excessivepunishment of their children or using them on teachers' farms. They also felt that the schoolcommittee was the proper intermediary.
As table 6 below shows, the evidence related to the question of parent involvement in theschool is mixed. It is clear that VBS parents know and have more contact with their children'steachers -- not surprising since the teachers come from the villages in which they teach. The factthat a smaller percent of VBS parents know the functions of the school committee may resultfrom the fact that these schools are less than two years old, so parents have had less time toobserve the school committee in action. The percentages for attendance at PTA meetings isdisappointingly low amongst all schools. The figure for cash value of school contributions issurprisingly high in the VBS villages considering that these villages appear to be both poor andnon-monetized.
The evidence from the teachers' interviews corroborates the data from the focus groupsand the household interviews. Ninety-one per cent of VBS teachers had met with parents ascompared to 71 percent of the teachers from the other schools. Similarly, the average numberof parents seen per week by the VBS teachers was almost 12, and almost 5 for teachers from thetwo other types of schools. The teachers from VBS schools were more likely than teachers fromthe other schools to characterise parents as very supportive; (64 percent versus 30 percent in ASand 43 percent in GS schools).
4.3 Mobilization
SchoolType
N % Female % NoEducation
% ofDaughtersEnrolled
% of SonsEnrolled
SchoolExpenditureLast Term
VBS 76 78.9 75 90 97 MK139.2
AS 88 79.5 42 92 96 MK201.2
GS 78 59 46.8 97 97 MK244.6

--28--
In all the villages, the traditional mobilizing mechanisms were reported to have beenused to build the schools. In other words, the headman or chief had been approached first. Hethen sponsored a village meeting and requested assistance from clan or family heads to marshallabour from the whole community. These traditional patterns still appeared largely successful,as all ten schools had been built in this way. Three of the village based schools were in theprocess of putting up additional classroom blocks and most of the other schools had plans to usecommunity labour to erect additional classroom blocks.
However, we consider that these patterns are not adequate to get parents truly involvedin school management. Further, it may be necessary to pair literacy education with thedevelopment of schools to initiate the process of encouraging parents to be more activelyinvolved in school management.
4.4 Summary and Conclusions
All the communities had built their schools through self help and had been mobilized inthe conventional way, i.e. through the village headman. The school committees appeared to befunctioning in all but one school (a government school), but the VBS school committees playeda more active role with respect to the school than the others, particularly with respect to teachersupervision. They were also more likely to have a higher percentage of female members.
Parents' involvement in the school was largely confined to contributing their labour when
INDICATOR VBS AS GS
% Heard of Parent TeachersAssociation (PTA)
8* 19 5
% Attended PTA meeting thisacademic year
5* 13 0
% Heard of school committee 83* 58 61
% Member of school committee 5 2 2
% Knows what school committee does 44 65 71
% Knows name of at least one schoolcommittee member
57 67 63
% Knows name of child's teacher 76* 30 34
% Discussed child's performance 16* 2 0
% Cash value of assistance to school Mean Mean+ Median
MK378MK144MK100
MK57MK57MK20
MK112MK112MK78
* Significant at <=.15 Mean+ is mean with four highest values deleted.

--29--
the school was being built or extended. It was a role they appeared comfortable with and willingto maintain. However, several groups made the point that the builders, who provided thetechnical expertise and a more sustained effort, should be paid.
Parents were most likely to come to the school when summoned to explain a child'sabsence or be asked to deal with naughtiness. Some parents came to the school to request thatteachers help them discipline their children.
Parents' general lack of formal education was a barrier to their effective participation inthe running of the schools. This was true for all school types. In general, they did not feelcompetent to approach teachers or to challenge them, except in VBS schools where, of course,teachers were well known to them. They saw the school committee as having that responsibility,but we did not uncover any evidence that the school committees' involvement with parents wentany deeper than tapping their labour resources.
We feel that school committees and teachers, in both the village and government schoolsshould be encouraged to raise the complexity of their interaction with parents. While most ofthese parents may be illiterate, they have knowledge and experience that can be used by theschool as well as be built on to help develop the communities. Parent-teacher associations canbe initiated or revived as a means of encouraging the school committees to meet regularly withparents for an exchange of concerns and views.
SCF should be encouraged to give its officers a continuing community mobilization role,to introduce different options for interacting with teachers and the village school and helping theparents to overcome the intimidation they feel when faced with schooled individuals.
--30--
5 THE INSTRUCTIONAL ENVIRONMENT
5.1 Overview
A central question of the evaluation was whether or not the PSLC teachers wereeffective, i.e. were they able to transfer to these children just entering school the basic skills ofliteracy and numeracy that they would need as an essential basis for gaining other knowledge,both within and outside the school system. A key part of that answer can be obtained from theanalysis of the achievement test results in section 7. However, we also felt that directobservation of their teaching and an analysis of the teachers' interview responses was an integralcomponent of the answer.
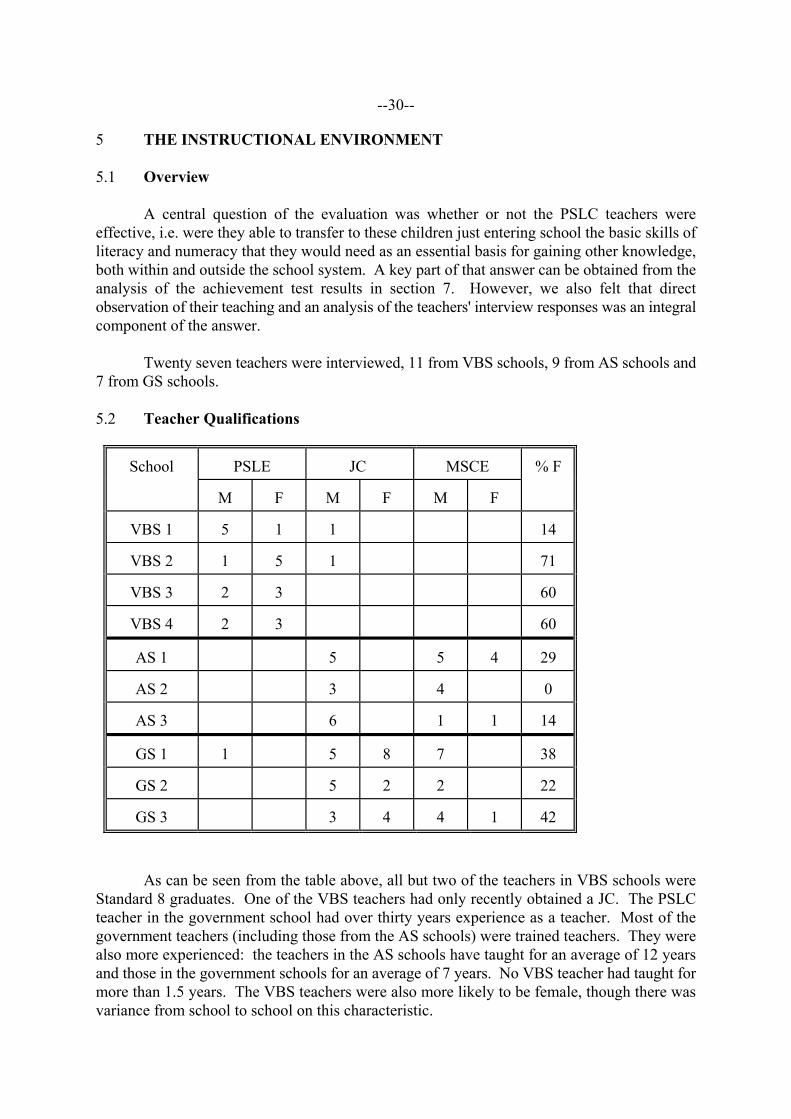
Twenty seven teachers were interviewed, 11 from VBS schools, 9 from AS schools and7 from GS schools. 5.2 Teacher Qualifications
As can be seen from the table above, all but two of the teachers in VBS schools wereStandard 8 graduates. One of the VBS teachers had only recently obtained a JC. The PSLCteacher in the government school had over thirty years experience as a teacher. Most of thegovernment teachers (including those from the AS schools) were trained teachers. They werealso more experienced: the teachers in the AS schools have taught for an average of 12 yearsand those in the government schools for an average of 7 years. No VBS teacher had taught formore than 1.5 years. The VBS teachers were also more likely to be female, though there wasvariance from school to school on this characteristic.
PSLE JC MSCESchool
M F M F M F
% F
VBS 1 5 1 1 14
VBS 2 1 5 1 71
VBS 3 2 3 60
VBS 4 2 3 60
AS 1 5 5 4 29
AS 2 3 4 0
AS 3 6 1 1 14
GS 1 1 5 8 7 38
GS 2 5 2 2 22
GS 3 3 4 4 1 42
--31--
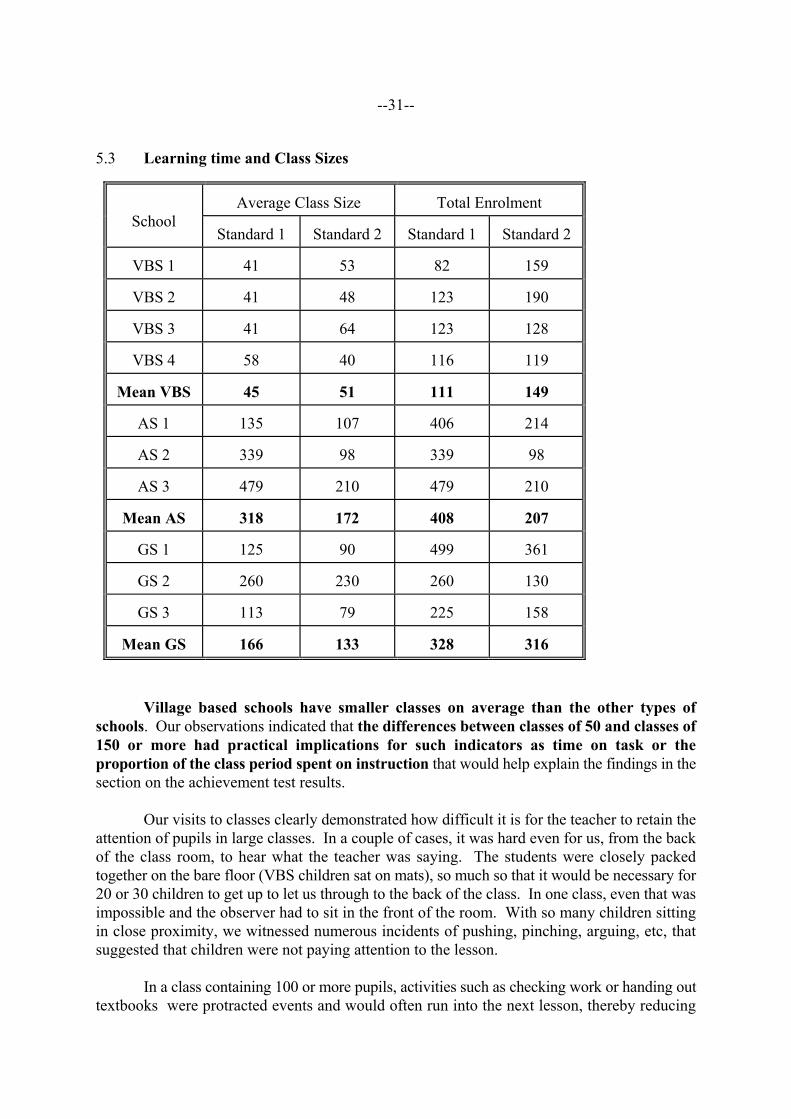
5.3 Learning time and Class Sizes
Village based schools have smaller classes on average than the other types ofschools. Our observations indicated that the differences between classes of 50 and classes of150 or more had practical implications for such indicators as time on task or theproportion of the class period spent on instruction that would help explain the findings in thesection on the achievement test results.
Our visits to classes clearly demonstrated how difficult it is for the teacher to retain theattention of pupils in large classes. In a couple of cases, it was hard even for us, from the backof the class room, to hear what the teacher was saying. The students were closely packedtogether on the bare floor (VBS children sat on mats), so much so that it would be necessary for20 or 30 children to get up to let us through to the back of the class. In one class, even that wasimpossible and the observer had to sit in the front of the room. With so many children sittingin close proximity, we witnessed numerous incidents of pushing, pinching, arguing, etc, thatsuggested that children were not paying attention to the lesson.
In a class containing 100 or more pupils, activities such as checking work or handing outtextbooks were protracted events and would often run into the next lesson, thereby reducing
Average Class Size Total EnrolmentSchool
Standard 1 Standard 2 Standard 1 Standard 2
VBS 1 41 53 82 159
VBS 2 41 48 123 190
VBS 3 41 64 123 128
VBS 4 58 40 116 119
Mean VBS 45 51 111 149
AS 1 135 107 406 214
AS 2 339 98 339 98
AS 3 479 210 479 210
Mean AS 318 172 408 207
GS 1 125 90 499 361
GS 2 260 230 260 130
GS 3 113 79 225 158
Mean GS 166 133 328 316

--32--
time available for instruction.
Teachers in these large classes used a number of management strategies of dubiouseffectiveness. Most classes had one or two older boys (in their mid-teens in our estimation) whosat at the back of the class and tried to help keep order, sometimes with a cane, sometimeswithout. To keep the class amused, the teacher would encourage the class to do a lot of singing,but only some of it was instructional or related to the subject being taught.
This situation was little improved when teachers combined classes, because of lack ofclassrooms, so that classes now had over 200 children. The extra teacher would then help inkeeping order in the classroom and in checking work, but not in actual instruction, so we aredubious as to whether learning was positively impacted by this move.
The differences in class size between the VBS and both types of government schools arelikely to have serious implications for the amount of learning that can go on. A recent reviewof research into the issue of class size and its implications for attainment concludes that theevidence supports a link between class sizes under 20 for children in the early years of schooling(Blatchford & Mortimore 1994). In other words, for the most effective teaching in the earlygrades, even the VBS classes are too large.
5.4 Instructional Activity
An observation instrument was used for systematic classification of the activities withinthe classrooms. We observed English, mathematics, Chichewa and general studies in all threetypes of schools. A major part of the observation was characterizing the kind of instruction thatoccurred during the course of the lesson. The major objective was to discover whether teachersin the three types of schools differed significantly in their instructional behaviour. Up to fourteachers in each school were observed and we tried to observe each teacher twice.
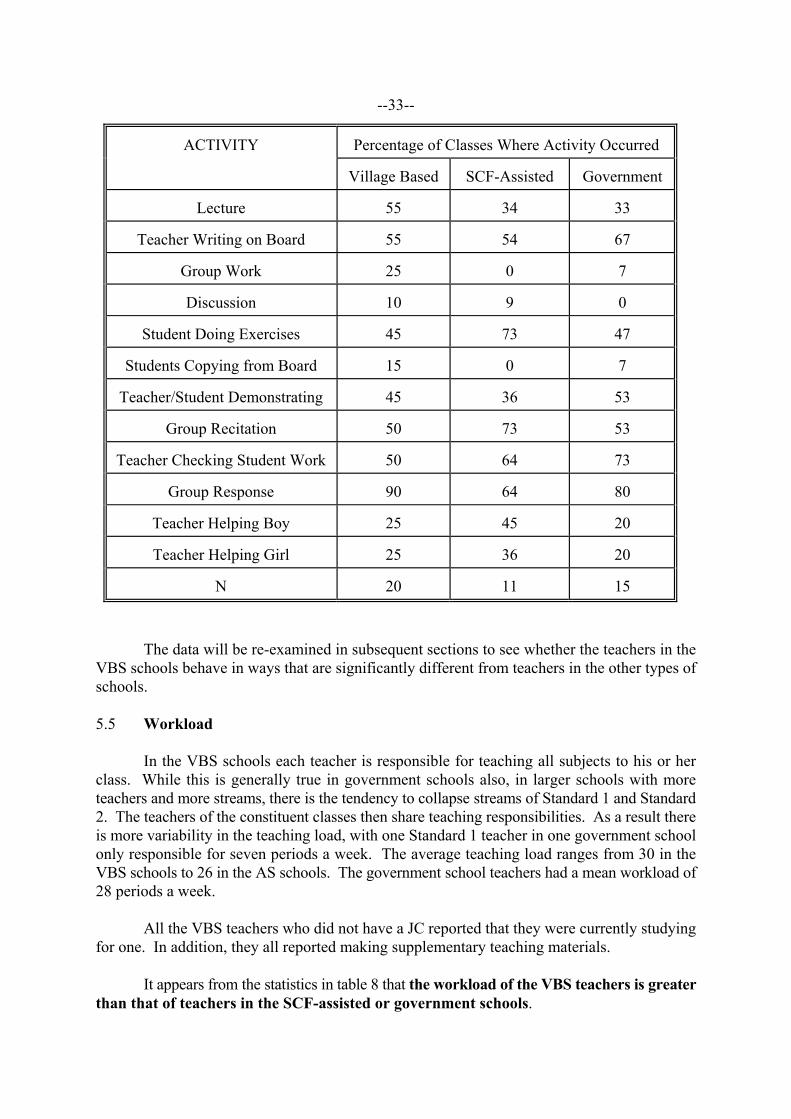
Table 9 indicates how common certain types of instructional activities were. The firstobservation is that the teachers in the village based schools exhibited a wider variety ofbehaviours than in the other schools. In both types of government school, some of the activitieswe looked for never occurred. This is an indication (but not a firm conclusion given the samplesizes) that instructional activity in the VBS schools may be more varied than in the governmentschools.
The VBS teachers were somewhat more likely to use 'lecture' i.e. talk about and explaina topic, but were also more likely to have the children work together in groups on an assignedtask (group work). They were also somewhat more likely to have students copying from theboard. These differences reflect our observations that more actual instruction went on the VBSschools.
--33--
The data will be re-examined in subsequent sections to see whether the teachers in theVBS schools behave in ways that are significantly different from teachers in the other types ofschools.
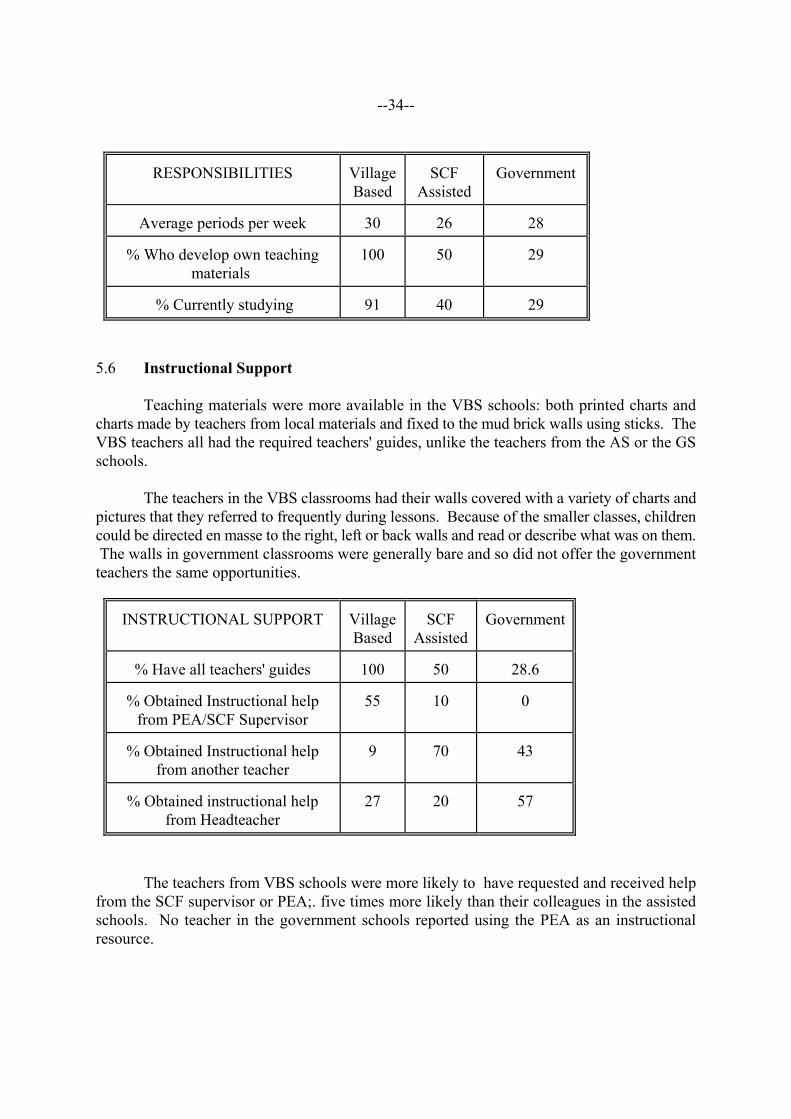
5.5 Workload
In the VBS schools each teacher is responsible for teaching all subjects to his or herclass. While this is generally true in government schools also, in larger schools with moreteachers and more streams, there is the tendency to collapse streams of Standard 1 and Standard2. The teachers of the constituent classes then share teaching responsibilities. As a result thereis more variability in the teaching load, with one Standard 1 teacher in one government schoolonly responsible for seven periods a week. The average teaching load ranges from 30 in theVBS schools to 26 in the AS schools. The government school teachers had a mean workload of28 periods a week.
All the VBS teachers who did not have a JC reported that they were currently studyingfor one. In addition, they all reported making supplementary teaching materials.
It appears from the statistics in table 8 that the workload of the VBS teachers is greaterthan that of teachers in the SCF-assisted or government schools.
Percentage of Classes Where Activity OccurredACTIVITY
Village Based SCF-Assisted Government
Lecture 55 34 33
Teacher Writing on Board 55 54 67
Group Work 25 0 7
Discussion 10 9 0
Student Doing Exercises 45 73 47
Students Copying from Board 15 0 7
Teacher/Student Demonstrating 45 36 53
Group Recitation 50 73 53
Teacher Checking Student Work 50 64 73
Group Response 90 64 80
Teacher Helping Boy 25 45 20
Teacher Helping Girl 25 36 20
N 20 11 15
--34--
5.6 Instructional Support
Teaching materials were more available in the VBS schools: both printed charts andcharts made by teachers from local materials and fixed to the mud brick walls using sticks. TheVBS teachers all had the required teachers' guides, unlike the teachers from the AS or the GSschools.
The teachers in the VBS classrooms had their walls covered with a variety of charts andpictures that they referred to frequently during lessons. Because of the smaller classes, childrencould be directed en masse to the right, left or back walls and read or describe what was on them. The walls in government classrooms were generally bare and so did not offer the governmentteachers the same opportunities.
The teachers from VBS schools were more likely to have requested and received helpfrom the SCF supervisor or PEA;. five times more likely than their colleagues in the assistedschools. No teacher in the government schools reported using the PEA as an instructionalresource.
RESPONSIBILITIES VillageBased
SCFAssisted
Government
Average periods per week 30 26 28
% Who develop own teachingmaterials
100 50 29
% Currently studying 91 40 29
INSTRUCTIONAL SUPPORT VillageBased
SCFAssisted
Government
% Have all teachers' guides 100 50 28.6
% Obtained Instructional helpfrom PEA/SCF Supervisor
55 10 0
% Obtained Instructional helpfrom another teacher
9 70 43
% Obtained instructional helpfrom Headteacher
27 20 57
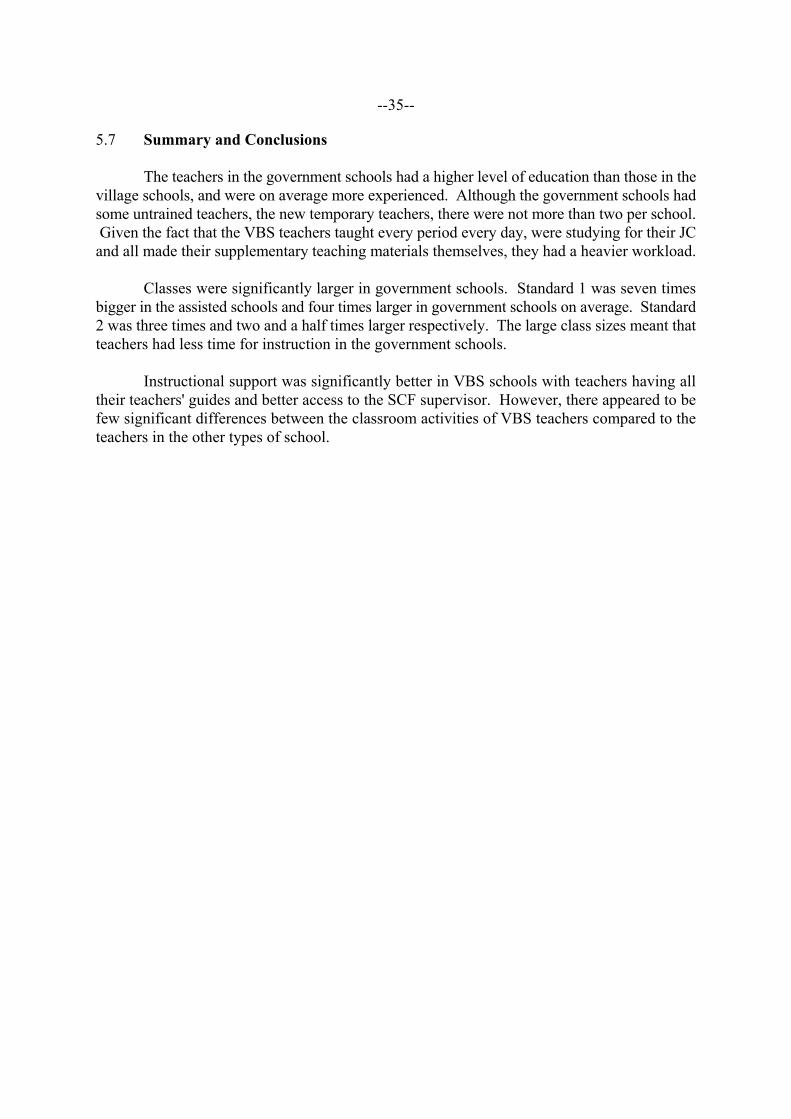
--35--
5.7 Summary and Conclusions
The teachers in the government schools had a higher level of education than those in thevillage schools, and were on average more experienced. Although the government schools hadsome untrained teachers, the new temporary teachers, there were not more than two per school. Given the fact that the VBS teachers taught every period every day, were studying for their JCand all made their supplementary teaching materials themselves, they had a heavier workload.
Classes were significantly larger in government schools. Standard 1 was seven timesbigger in the assisted schools and four times larger in government schools on average. Standard2 was three times and two and a half times larger respectively. The large class sizes meant thatteachers had less time for instruction in the government schools.
Instructional support was significantly better in VBS schools with teachers having alltheir teachers' guides and better access to the SCF supervisor. However, there appeared to befew significant differences between the classroom activities of VBS teachers compared to theteachers in the other types of school.

--36--
6 PUPIL PARTICIPATION
This section is based entirely on records obtained from the schools, from attendanceregisters and headteachers' records of their monthly returns. Where we were unable to getinformation, it was due to unsystematic record keeping -- the headteacher could not find therecords from the previous year or to a change of head ship where a handover of records hadclearly not been done. One headteacher (a very experienced one from a government school) hadprepared much of the information we required as part of a briefing about the school, but severalof the rest found our questions about enrolment, dropout, etc., the previous year very stressful. They are clearly not accustomed to providing this type of information. The headteachers clearlydo not use this information for self monitoring and evaluation of their school's retention ofpupils.
6.1 Absenteeism
While attendance records could not be gathered from all schools, the household surveyasked two questions about absenteeism. The first, referring to the current term, indicates noassociation with school type. However, the second, referring to last term, does indicate somedifference, with parents in VBS and AS schools reporting lower absenteeism than those in theGS schools. There does not appear to be any significant differences in the daily time spent inschool or the time devoted to reading/drawing and school work at home.
We did not systematically collect information on the causes of absenteeism, but thefollowing reasons were volunteered by teachers and school committees in all types of schoolsas to the reasons why children did not attend school:
• lack of suitable clothing• flooding rivers• lack of protection from heavy rains• lack of interest in school
INDICATOR VBS AS GS
% Absent one or more weeks this term 19.6 7.2 20.3
Number of days absent last term Mean Median
2.01.0
2.01.0
2.62.0
Hours per day spent in school Mean Median
4.54.0
4.44.0
4.54.5
Hours per day spent on school work outsideschool Mean Median
0.160.15
0.150.15
0.180.15
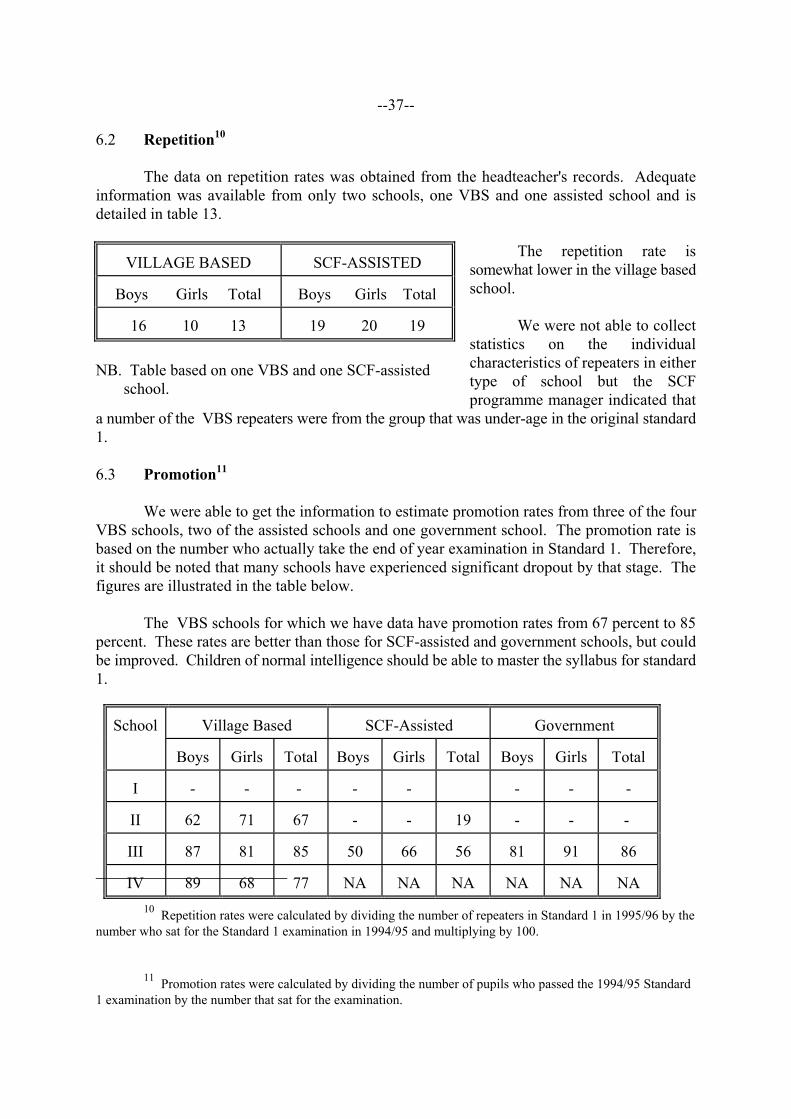
--37--
6.2 Repetition10
The data on repetition rates was obtained from the headteacher's records. Adequateinformation was available from only two schools, one VBS and one assisted school and isdetailed in table 13.
The repetition rate issomewhat lower in the village basedschool.
We were not able to collectstatistics on the individualcharacteristics of repeaters in eithertype of school but the SCFprogramme manager indicated that
a number of the VBS repeaters were from the group that was under-age in the original standard1.
6.3 Promotion11
We were able to get the information to estimate promotion rates from three of the fourVBS schools, two of the assisted schools and one government school. The promotion rate isbased on the number who actually take the end of year examination in Standard 1. Therefore,it should be noted that many schools have experienced significant dropout by that stage. Thefigures are illustrated in the table below.
The VBS schools for which we have data have promotion rates from 67 percent to 85percent. These rates are better than those for SCF-assisted and government schools, but couldbe improved. Children of normal intelligence should be able to master the syllabus for standard1.
10 Repetition rates were calculated by dividing the number of repeaters in Standard 1 in 1995/96 by thenumber who sat for the Standard 1 examination in 1994/95 and multiplying by 100.
11 Promotion rates were calculated by dividing the number of pupils who passed the 1994/95 Standard1 examination by the number that sat for the examination.
VILLAGE BASED SCF-ASSISTED
Boys Girls Total Boys Girls Total
16 10 13 19 20 19
NB. Table based on one VBS and one SCF-assisted school.
Village Based SCF-Assisted GovernmentSchool
Boys Girls Total Boys Girls Total Boys Girls Total
I - - - - - - - -
II 62 71 67 - - 19 - - -
III 87 81 85 50 66 56 81 91 86
IV 89 68 77 NA NA NA NA NA NA

--38--
6.4 Dropout12
The first observation to be made about table 15 is that dropout rates are much lower inthe VBS schools for which we have data. These schools appear to be succeeding in retaining ahigher proportion of their students. We were told that some dropout was due to transfers togovernment schools in order to register for free maize, or to accompany parents who were goingto estates to earn food or money. It would be advisable for the schools or the school committees to try and keep proper statistics on these phenomena to assess what proportion is leaving schoolfor these reasons.
The second observation is that girls' dropout rates appear to be lower in the VBSschools than in the others. In two of the three schools for which there is information, girls'dropout is lower than boys. In addition, in VBS II, the school with the highest proportionof female teachers, the girls' dropout rate is the lowest.
12 Dropout rates were calculated by dividing the number of pupils who dropped out before theStandard 1 examination by the number enrolled at the start of the year - transfers in.
If we compare the VBS and the AS schools which are located in the same geographicarea, and share similar occupational and agricultural patterns, we can see that type of schoolapparently has a greater impact than home factors or economic conditions. The dropout rate in
Village Based Schools SCF-Assisted GovernmentSchool
Boys Girls Total Boys Girls Total Boys Girls Total
I - - - 33 47 39 - - 66
II 8 7 7 - - 23 - - -
III 4 10 7 34 40 36 40 33 37
IV 13 11 12 NA NA NA NA NA NA
- No data could be obtained
--39--
the government schools is at least as high as that in the AS schools. This information is astrong indicator that school factors are at least as important as home factors in dropout atthis level.
6.5 Summary and conclusions
All measures of pupil participation, repetition, promotion and dropout, were better inVBS schools than in either the AS or the GS schools. The characteristics of the VBS schoolsoffer a reasonable explanation for this:
• schools are smaller and less crowded and by virtue of that fact alone, more pleasantplaces for children
• classes are smaller• more instruction is going on and the VBS schools are therefore inherently more
interesting to attend• we observed very little bullying or intimidation in VBS schools unlike in both types
of government schools• VBS schools are closer to children's homes and easier to get to• higher percentage of female teachers appears to have positively impacted girls'
dropout

--40--
7 RESULTS OF ACHIEVEMENT TESTS
7.1 Introduction
Of fundamental concern was whether the pupils in the VBS schools were performing at thesame level or below that of pupils in the AS and GS schools. To compare the achievement levelsof pupils in VBS and AS and GS schools, a test was administered to a sample of standard 1 and2 pupils in the schools, 45.5 percent of whom were girls.
Three hundred and four students in all were interviewed, 269 of them in Standard 2 and35 of them in Standard 1. The design called for randomly selecting 30 standard 2 students fromeach of ten schools; we also selected between four and six standard 1 pupils from seven schools(all the government schools and one VBS school). The test was administered to standard 1pupils in order to obtain a proxy baseline with which to compare the results.
The actual sample selected was as shown in table 10. The sample was selectedsystematically, so the difference in the percentage female between the enrolment and the actualsample is due to a higher rate of absenteeism among the female pupils. The actual percentageof the sample that came from VBS school was lower than expected. This occurred because theVBS schools were visited first and the research assistants were administering the test moreslowly at the beginning.
The ages of the sampled pupils ranged from 6 to 16 years in the VBS schools, 7 to 16years in the AS schools and 6 to 17 years in the GS schools. Thus, the age distribution in thethree school types was similar. The mean age for the VBS schools (10.55 years) was onlyslightly lower than the other two school types (11.51 and 10.83 years in the AS and GS schoolsrespectively).
The test was in three sections, covering English, mathematics and Chichewa, and the 65items were based on the national curriculum in languages and mathematics that the children hadbeen exposed to during the one and a half years they had spent in school. The test took between25 and 40 minutes to administer. The mathematics items covered topics such as counting,
% Female (STD 2) % of Sample AgeSchoolType
BoysN
GirlsN
Enrolled# Sample Expected Actual Mean
SD
VBS 58 48 50.0 45.3 40 36.5 10.6* 1.85
AS 46 37 49.0 44.6 30 32.3 11.5 1.92
GS 42 36 56.7 46.2 30 31.2 10.8* 2.40 * - One VBS and one GS child did not know their age. # - From headteachers' interview

--41--
number recognition, addition, subtraction, multiplication, division and money problems set ineveryday context. In English and Chichewa the items covered the reading of alphabet letters,simple words and sentences, writing and reading comprehension. The pupils were individuallyassessed because the literacy levels of pupils at this stage are still very low.

--42--
7.2 Mathematics Achievement
The overall performance on the mathematics sub-test was satisfactory for all the three schooltypes. As Table 17 illustrates, the mean score for each school type was above 50 percent. Thetest also reveal little differences amongst the school types. The VBS schools registered highermean scores than either AS or the GS schools. However, there were no significant differencesin achievement between the three school types.
7.3 Language
The VBS schools outperformed AS and GS schools in English and Chichewa. InEnglish, the VBS schools performed significantly better than both the SCF assisted andgovernment schools13. The AS schools had a higher mean score in English than governmentschools, but the difference between the two mean scores was not statistically significant. InChichewa a similar trend was observed. The VBS schools performed better than AS schools,who did better than GS schools. The AS performed significantly better than the GS schools inChichewa. The mean Chichewa and English scores of the VBS and AS scores were not,however, statistically different.
13 T-test for difference in mean scores significant at .05 level.
MATHEMATICS (%)TYPE OFSCHOOL
N Mean SD
Village Based 107 69.90 24.72
SCF- Assisted 83 67.38 23.01
Government 79 68.19 25.67 Means not statistically different from each other.
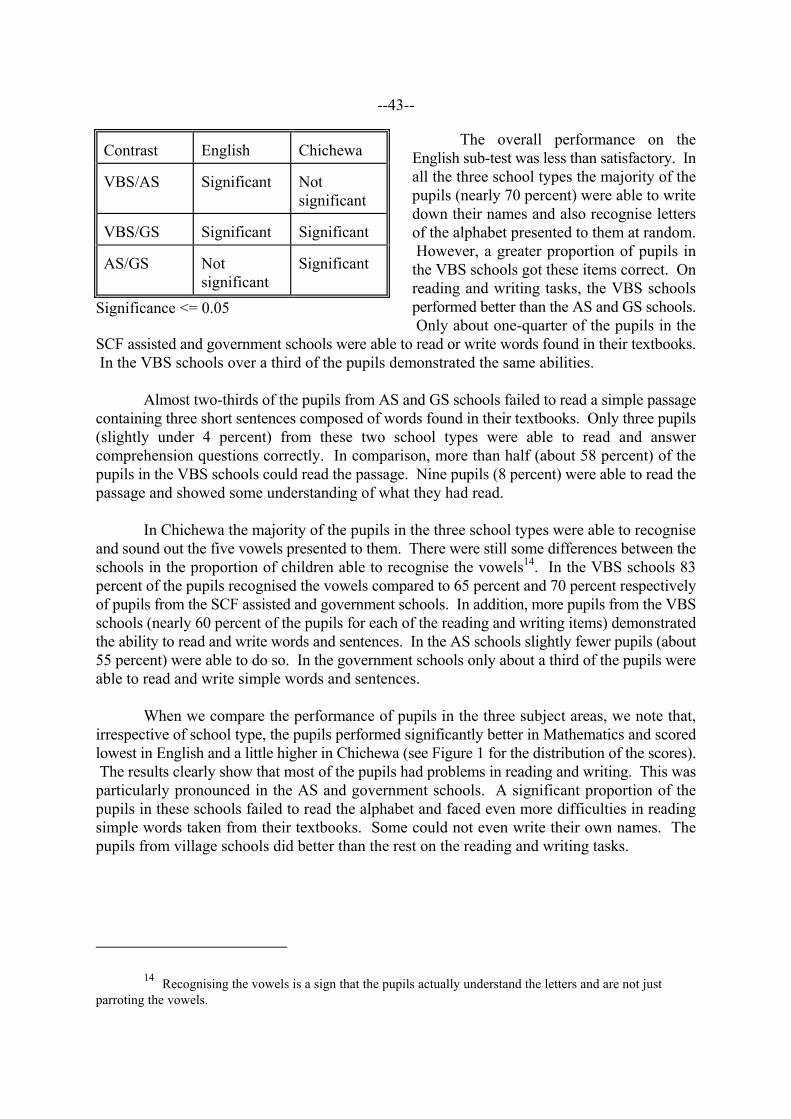
--43--
The overall performance on theEnglish sub-test was less than satisfactory. Inall the three school types the majority of thepupils (nearly 70 percent) were able to writedown their names and also recognise lettersof the alphabet presented to them at random. However, a greater proportion of pupils inthe VBS schools got these items correct. Onreading and writing tasks, the VBS schoolsperformed better than the AS and GS schools. Only about one-quarter of the pupils in the
SCF assisted and government schools were able to read or write words found in their textbooks. In the VBS schools over a third of the pupils demonstrated the same abilities.
Almost two-thirds of the pupils from AS and GS schools failed to read a simple passagecontaining three short sentences composed of words found in their textbooks. Only three pupils(slightly under 4 percent) from these two school types were able to read and answercomprehension questions correctly. In comparison, more than half (about 58 percent) of thepupils in the VBS schools could read the passage. Nine pupils (8 percent) were able to read thepassage and showed some understanding of what they had read.
In Chichewa the majority of the pupils in the three school types were able to recogniseand sound out the five vowels presented to them. There were still some differences between theschools in the proportion of children able to recognise the vowels14. In the VBS schools 83percent of the pupils recognised the vowels compared to 65 percent and 70 percent respectivelyof pupils from the SCF assisted and government schools. In addition, more pupils from the VBSschools (nearly 60 percent of the pupils for each of the reading and writing items) demonstratedthe ability to read and write words and sentences. In the AS schools slightly fewer pupils (about55 percent) were able to do so. In the government schools only about a third of the pupils wereable to read and write simple words and sentences.
When we compare the performance of pupils in the three subject areas, we note that,irrespective of school type, the pupils performed significantly better in Mathematics and scoredlowest in English and a little higher in Chichewa (see Figure 1 for the distribution of the scores). The results clearly show that most of the pupils had problems in reading and writing. This wasparticularly pronounced in the AS and government schools. A significant proportion of thepupils in these schools failed to read the alphabet and faced even more difficulties in readingsimple words taken from their textbooks. Some could not even write their own names. Thepupils from village schools did better than the rest on the reading and writing tasks.
14 Recognising the vowels is a sign that the pupils actually understand the letters and are not justparroting the vowels.
Contrast English Chichewa
VBS/AS Significant Notsignificant
VBS/GS Significant Significant
AS/GS Notsignificant
Significant
Significance <= 0.05

--44--
The fact that the pupils performed better on the mathematics test than in the languagetests is surprising considering that national examination results from the end of the primary cycleshow that the performance of most pupils in mathematics is very poor compared to theirperformance in languages. A possible explanation could be that the mathematics that is beingtaught in the first two years is reinforced by the pupils' daily experiences outside school. Incontrast most of the pupils are not exposed to reading and writing experiences in their homes andhave thus to rely solely on the school to provide these skills. The educational levels of theirparents were low which means that the majority of the pupils come from backgrounds whereliteracy skills are absent.
Given the every day experience that pupils have in dealing with numerical problemsthe present Standard 1 and 2 curriculum might not be challenging enough for them.
Further, during classroom observation we noted that the teachers found it easier toorganise individual learning activities during mathematics lessons whilst for the languages mostof the teachers in AS and GS schools resorted to chorus teaching.
7.4 Gender Differences
As Table 20 shows, boys also outperformed girls in both English and Chichewa in all thethree school types. The differences were not always significant. The results were significant forEnglish scores for the village based schools and Chichewa for the AS schools. The gender gapin achievement for English was greatest in VBS schools and smallest in government schools.
ENGLISH (%) CHICHEWA (%) Type of School
N Mean SD N Mean SD
Village Based 107 35.87 22.3 107 56.88 37.73
SCF-Assisted 83 23.27 20.49 83 46.82 33.67
Government 78 21.20 19.35 78 36.66 33.1
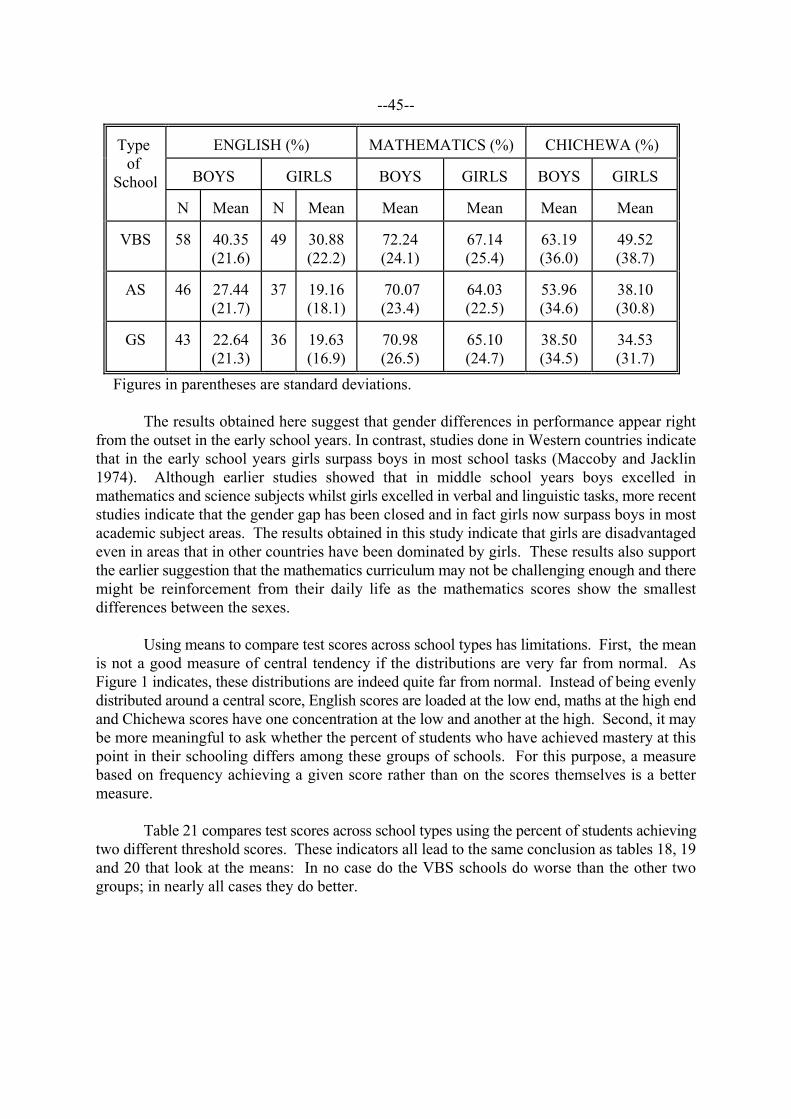
--45--
The results obtained here suggest that gender differences in performance appear rightfrom the outset in the early school years. In contrast, studies done in Western countries indicatethat in the early school years girls surpass boys in most school tasks (Maccoby and Jacklin1974). Although earlier studies showed that in middle school years boys excelled inmathematics and science subjects whilst girls excelled in verbal and linguistic tasks, more recentstudies indicate that the gender gap has been closed and in fact girls now surpass boys in mostacademic subject areas. The results obtained in this study indicate that girls are disadvantagedeven in areas that in other countries have been dominated by girls. These results also supportthe earlier suggestion that the mathematics curriculum may not be challenging enough and theremight be reinforcement from their daily life as the mathematics scores show the smallestdifferences between the sexes.
Using means to compare test scores across school types has limitations. First, the meanis not a good measure of central tendency if the distributions are very far from normal. AsFigure 1 indicates, these distributions are indeed quite far from normal. Instead of being evenlydistributed around a central score, English scores are loaded at the low end, maths at the high endand Chichewa scores have one concentration at the low and another at the high. Second, it maybe more meaningful to ask whether the percent of students who have achieved mastery at thispoint in their schooling differs among these groups of schools. For this purpose, a measurebased on frequency achieving a given score rather than on the scores themselves is a bettermeasure.
Table 21 compares test scores across school types using the percent of students achievingtwo different threshold scores. These indicators all lead to the same conclusion as tables 18, 19and 20 that look at the means: In no case do the VBS schools do worse than the other twogroups; in nearly all cases they do better.
ENGLISH (%) MATHEMATICS (%) CHICHEWA (%)
BOYS GIRLS BOYS GIRLS BOYS GIRLS
Type of
SchoolN Mean N Mean Mean Mean Mean Mean
VBS 58 40.35(21.6)
49 30.88(22.2)
72.24(24.1)
67.14(25.4)
63.19(36.0)
49.52(38.7)
AS 46 27.44(21.7)
37 19.16(18.1)
70.07(23.4)
64.03(22.5)
53.96(34.6)
38.10(30.8)
GS 43 22.64(21.3)
36 19.63(16.9)
70.98(26.5)
65.10(24.7)
38.50(34.5)
34.53(31.7)
Figures in parentheses are standard deviations.
--46--
7.5 Shifts
A unique feature of all the VBS schools was the operation of a double shift system. Thefirst two VBS schools were observed during the afternoon shift and the second two in themorning. The table includes results for both Standard 1 and 2 pupils.
The shift system was necessitated by a lack of teaching space and the need to have small andmanageable class sizes. Each shift had its own set of teachers. It was therefore imperative forthe evaluation to assess the impact of such arrangements on achievement. Of particular interestwas whether pupils attending afternoon classes were learning just as much as those attendingschool in the morning. The main argument against shift systems is that pupils and teachersattending afternoon classes often come to school already tired and in addition it is also usuallytoo hot during this time of day to learn or teach effectively. This, it is argued, impacts negativelyon achievement.
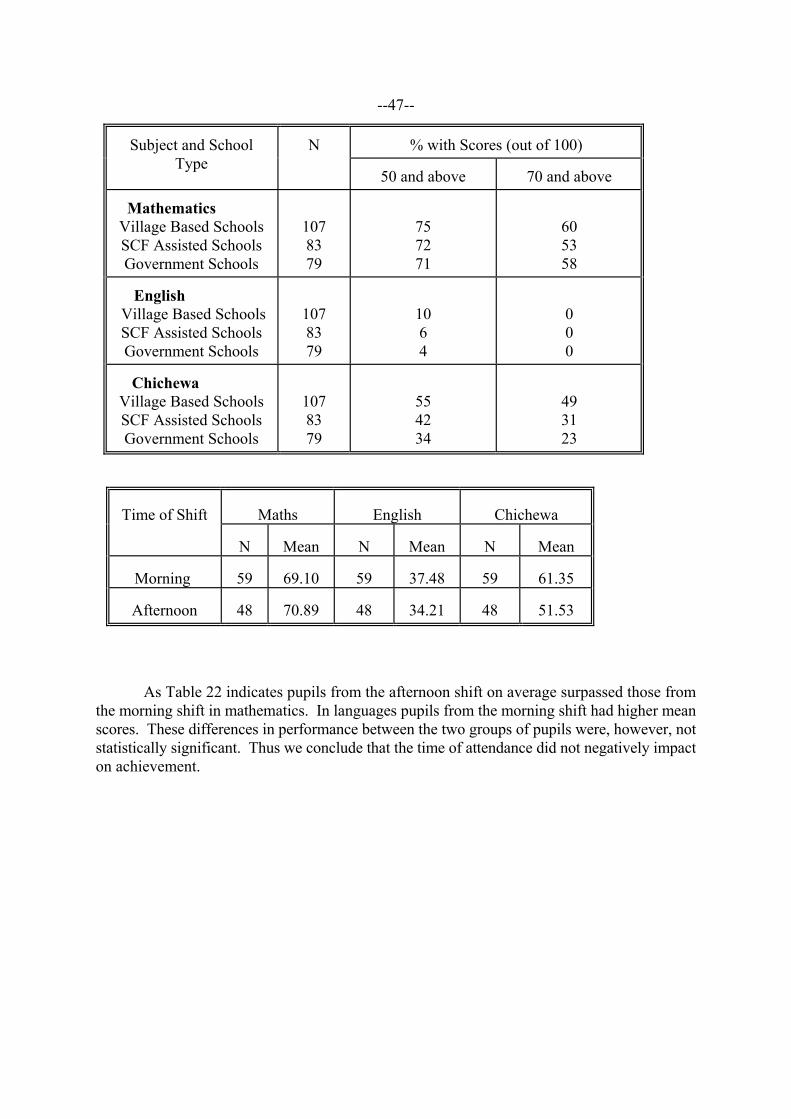
--47--
As Table 22 indicates pupils from the afternoon shift on average surpassed those fromthe morning shift in mathematics. In languages pupils from the morning shift had higher meanscores. These differences in performance between the two groups of pupils were, however, notstatistically significant. Thus we conclude that the time of attendance did not negatively impacton achievement.
% with Scores (out of 100)Subject and SchoolType
N
50 and above 70 and above
Mathematics Village Based SchoolsSCF Assisted SchoolsGovernment Schools
1078379
757271
605358
English Village Based SchoolsSCF Assisted SchoolsGovernment Schools
1078379
1064
000
Chichewa Village Based SchoolsSCF Assisted SchoolsGovernment Schools
1078379
554234
493123
Maths English ChichewaTime of Shift
N Mean N Mean N Mean
Morning 59 69.10 59 37.48 59 61.35
Afternoon 48 70.89 48 34.21 48 51.53

--48--
7.6 Age
The pupils in these schools ranged widely in age, from 6 to 17 and an importantconsideration is whether the age composition of the pupils in the various types of schools biasedthe achievement results. All being equal, the older the child, the better he or she would beexpected to do on these tests of very basic arithmetic and language concepts. The average scoresby age grouping and by school type are shown in table 23.
Although there is an undoubted age effect, with older children doing better no matterwhat type of school they are enrolled in, the VBS children still have higher mean scores in allsubjects. They also show that the age distribution cannot explain the better performance of theVBS schools. They have double the proportion of children in the 6 - 9 age group that the ASschools and half as many in the 13+ grouping than either the AS or the GS schools.
7.7 Summary and Conclusions
The key conclusions to be drawn from the achievement test results are the following:
• Village-based schools perform significantly better than both SCF-assisted andgovernment schools in both Chichewa and English
• SCF-assisted schools also perform better than government schools even though thedifference is not always significant
• Boys perform better than girls in all subjects, but the differences are not significant inmathematics
• There is no significant difference between the schools in mathematics achievement
6 - 9 10 - 12 13 plusSCORES
VBS AS GS VBS AS GS VBS AS GS
English 18.5 4.2 7.9 24.6 13.1 11.9 25.7 17 11
Mathematics 21.5 16.5 19.4 28.8 25 25.5 29.9 28.1 28
Chichewa 29.5 15.4 17.6 26.1 29.1 27.1 41.1 40.5 24
Total Score 69.5 36 44.9 96.9 67.5 64.5 99.3 85.5 63
N 29 13 30 69 57 42 11 28 23
%of test takersin age bracket
27 10 26 64 60 59 9 30 30

--49--
• There is no significant difference in performance between the VBS children who attendthe morning shift and those in the afternoon shift
• The age distribution of the pupils does not explain the performance differences betweenschool types.
--50--
8 EXPLAINING THE DIFFERENCES IN ACHIEVEMENT TEST RESULTS
The results in the previous section indicated that there was a significant amount ofvariation in student performance on the achievement tests, across school types and also variationwithin school types. This variation leads to the obvious conclusion, that there are individualschool characteristics that have an impact on performance which are probably just asimportant as the characteristics of school types. In addition, the uneven distribution of scoresacross the population indicates that we should more carefully examine the scores and ourexplanations for them.
Therefore, we utilize several different measures of central tendency and differentanalytical procedures as seem appropriate to clarify our understanding of what is happening inthese schools.
8.1 The Achievement Test
Figure 1 suggests that the maths test did not include difficult enough questions todistinguish between the better students, that the English test did not include enough easyquestions to distinguish between the poorer students, and that the Chichewa test should haveincluded both harder and easier questions. However, if the tests provide a fair representationof what children in standard 2 are supposed to know, which we believe it does, then theremay be something wrong with the curriculum or the way it is being taught in all schools.
The curriculum assumes that children have had very little exposure to the basic conceptsin any of the three subjects. This is probably an appropriate assumption to make for seven yearolds, the age when children are supposed to enter standard 2. However, the average entering ageis closer to ten, by which time children are likely to have considerable exposure in everyday lifeto numbers and basic arithmetic operations. This could account for the generally high mathsscores (and for the fact that there is no significant difference between maths scores across schooltypes). For English, students at any age have very little daily exposure. The bimodaldistribution for Chichewa is probably explained by there being two groups of villages, one inwhich Chichewa is the language of everyday life and one in which it is not. In the first group,scores could be expected to be high for the same reason they are in maths; in the second group,scores could be expected to be low for the same reason they are in English.
We tested the notion that children pick up many of the basics typically taught in the firstfew standards in the course of everyday life, particularly by age 11, by administering the sametests to Standard 1 children in the last seven schools we visited. The mean scores by standardand age are reported below in table 24. The means were not tested for significance because ofthe small sample sizes for the Standard 1 children, but the differences are large enough to supporta view that attending school does improve performance on these tests. The differences inmathematics at the higher ages are small -- indirect support of our suggestion that themathematics curriculum at this level may not be challenging enough.
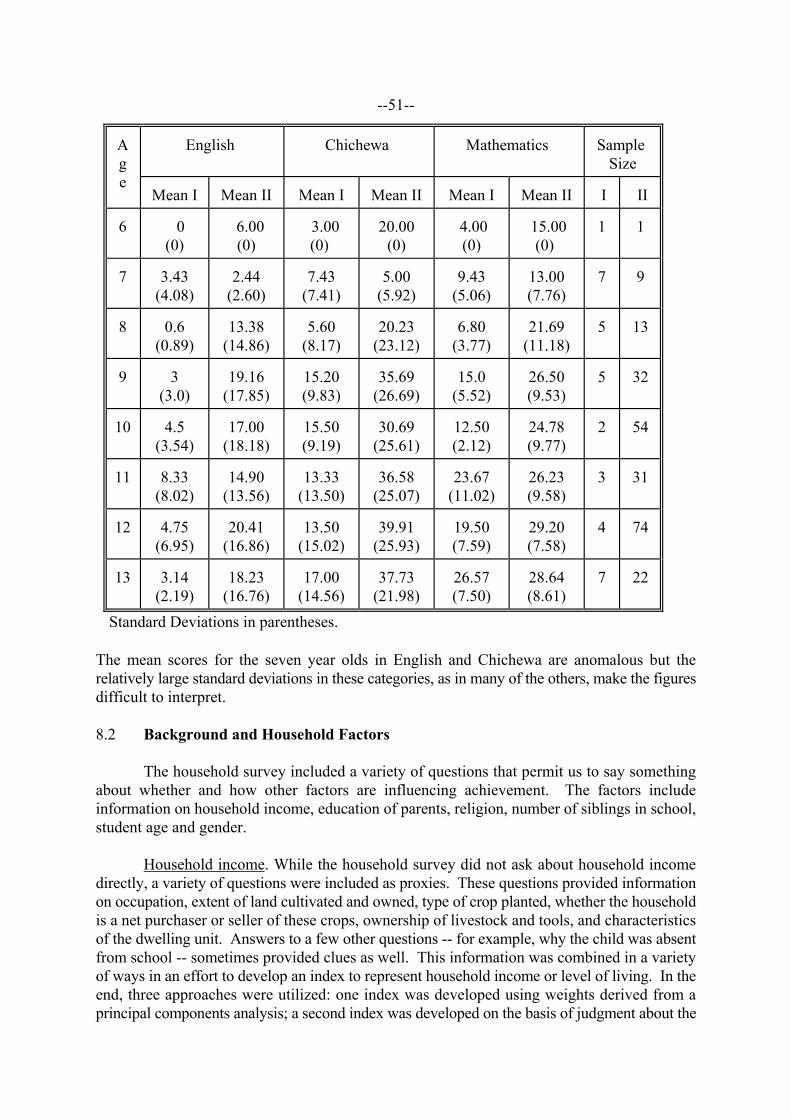
--51--
The mean scores for the seven year olds in English and Chichewa are anomalous but therelatively large standard deviations in these categories, as in many of the others, make the figuresdifficult to interpret.
8.2 Background and Household Factors
The household survey included a variety of questions that permit us to say somethingabout whether and how other factors are influencing achievement. The factors includeinformation on household income, education of parents, religion, number of siblings in school,student age and gender.
Household income. While the household survey did not ask about household incomedirectly, a variety of questions were included as proxies. These questions provided informationon occupation, extent of land cultivated and owned, type of crop planted, whether the householdis a net purchaser or seller of these crops, ownership of livestock and tools, and characteristicsof the dwelling unit. Answers to a few other questions -- for example, why the child was absentfrom school -- sometimes provided clues as well. This information was combined in a varietyof ways in an effort to develop an index to represent household income or level of living. In theend, three approaches were utilized: one index was developed using weights derived from aprincipal components analysis; a second index was developed on the basis of judgment about the
English Chichewa Mathematics Sample Size
Age
Mean I Mean II Mean I Mean II Mean I Mean II I II
6 0(0)
6.00(0)
3.00(0)
20.00(0)
4.00(0)
15.00(0)
1 1
7 3.43(4.08)
2.44(2.60)
7.43(7.41)
5.00(5.92)
9.43(5.06)
13.00(7.76)
7 9
8 0.6(0.89)
13.38(14.86)
5.60(8.17)
20.23(23.12)
6.80(3.77)
21.69(11.18)
5 13
9 3(3.0)
19.16(17.85)
15.20(9.83)
35.69(26.69)
15.0(5.52)
26.50(9.53)
5 32
10 4.5(3.54)
17.00(18.18)
15.50(9.19)
30.69(25.61)
12.50(2.12)
24.78(9.77)
2 54
11 8.33(8.02)
14.90(13.56)
13.33(13.50)
36.58(25.07)
23.67(11.02)
26.23(9.58)
3 31
12 4.75(6.95)
20.41(16.86)
13.50(15.02)
39.91(25.93)
19.50(7.59)
29.20(7.58)
4 74
13 3.14(2.19)
18.23(16.76)
17.00(14.56)
37.73(21.98)
26.57(7.50)
28.64(8.61)
7 22
Standard Deviations in parentheses.
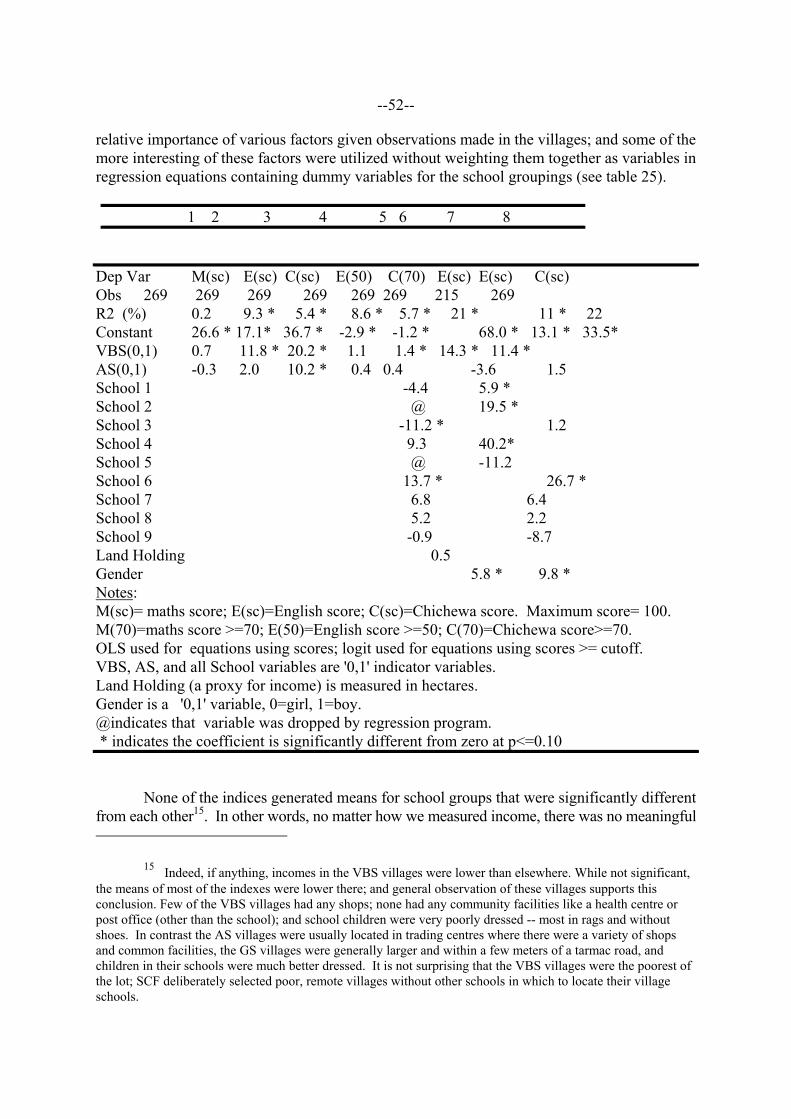
--52--
relative importance of various factors given observations made in the villages; and some of themore interesting of these factors were utilized without weighting them together as variables inregression equations containing dummy variables for the school groupings (see table 25).
None of the indices generated means for school groups that were significantly differentfrom each other15. In other words, no matter how we measured income, there was no meaningful
15 Indeed, if anything, incomes in the VBS villages were lower than elsewhere. While not significant,the means of most of the indexes were lower there; and general observation of these villages supports thisconclusion. Few of the VBS villages had any shops; none had any community facilities like a health centre orpost office (other than the school); and school children were very poorly dressed -- most in rags and withoutshoes. In contrast the AS villages were usually located in trading centres where there were a variety of shopsand common facilities, the GS villages were generally larger and within a few meters of a tarmac road, andchildren in their schools were much better dressed. It is not surprising that the VBS villages were the poorest ofthe lot; SCF deliberately selected poor, remote villages without other schools in which to locate their villageschools.
1 2 3 4 5 6 7 8
Dep Var M(sc) E(sc) C(sc) E(50) C(70) E(sc) E(sc) C(sc)Obs 269 269 269 269 269 269 215 269R2 (%) 0.2 9.3 * 5.4 * 8.6 * 5.7 * 21 * 11 * 22Constant 26.6 * 17.1* 36.7 * -2.9 * -1.2 * 68.0 * 13.1 * 33.5* VBS(0,1) 0.7 11.8 * 20.2 * 1.1 1.4 * 14.3 * 11.4 *AS(0,1) -0.3 2.0 10.2 * 0.4 0.4 -3.6 1.5School 1 -4.4 5.9 *School 2 @ 19.5 *School 3 -11.2 * 1.2School 4 9.3 40.2*School 5 @ -11.2School 6 13.7 * 26.7 *School 7 6.8 6.4School 8 5.2 2.2School 9 -0.9 -8.7Land Holding 0.5Gender 5.8 * 9.8 *Notes: M(sc)= maths score; E(sc)=English score; C(sc)=Chichewa score. Maximum score= 100. M(70)=maths score >=70; E(50)=English score >=50; C(70)=Chichewa score>=70.OLS used for equations using scores; logit used for equations using scores >= cutoff.VBS, AS, and all School variables are '0,1' indicator variables.Land Holding (a proxy for income) is measured in hectares. Gender is a '0,1' variable, 0=girl, 1=boy. @indicates that variable was dropped by regression program. * indicates the coefficient is significantly different from zero at p<=0.10
--53--
difference in the average income of parents from the three school types. The inclusion of oneor another of these indices in regressions added very little to explained variance. The variable,'land cultivated', used by itself, produced means of 2.63, 2.48 and 1.62 hectares for the threeschool groupings, but it had insignificant effects on test scores when used in regression equations(e.g., equation 7 of table 25).
There are three possible explanations for these findings. First, of course, our indices maynot be measuring income accurately; we have no independent way to verify them. Second, theexpected association between our measures of income and test scores may not be present in thisdata set because there is so little variation in income: nearly everyone is close to the subsistencelevel; very few appear to be much above it. Third, the relationship between income and schoolachievement may be present only at higher levels of schooling. Income may affect attendanceand duration of stay in school and hence ultimate school achievement, but as these effects arecumulative, they may not show up in standard 2. If the second or third of these explanations, orsome combination of the two, is correct, we can conclude that income cannot explain the resultsobtained.
Parent education. The better performance of VBS schools is not the result of parents ofchildren in these schools having more education than those in the other groups (see table 4). These parents have less education than the average; and regression equations indicate that yearsof education of head and of spouse have virtually no effect on test scores. As with income, theexplanation may be that the effect of parents' education on children's achievement is cumulativeand only shows up clearly in later years.
Religion. There is no significant association between religious affiliations and schoolgroupings. There is, however, a strong association at the individual school level. At first glance,the school level association does not appear to be related to test scores: Muslims predominatein some of the better and some of the poorer schools, for example. Regressions suggest thatthere is a correlation, with being Muslim tending to raise and CCAP (Church of CentralAfrica, Presbyterian) tending to lower test scores. The reason for this association is not clearand could be explored in later evaluations. A possibility is that Muslim children may bereceiving supplementary literacy and numeracy training in Koranic schools that is bolsteringachievement at this level. However, the addition of explained variance is not large and therelationship between test scores and school groupings is not appreciably affected by includingreligion in the regressions.
Student age. There is no appreciable difference in mean student age of different schoolgroupings, but there are significant difference amongst schools and these do appear to beassociated with test scores. Students in school 4 are 2 years older than the average and those inschools 2 and 6 are one year older. These three schools have the highest average scores on allthe tests. Students in school 3, a mediocre school, are two years younger. Also, schools 2 and4 have a smaller range of ages (9 - 14) whereas school 3 has a larger range (6 - 14) and school9, another mediocre performer, has the largest range of all (6 - 17). Regressions confirm that anincrease in age raises test scores, and the inclusion of this variable raises explained variance from9 to 13 percent.
This is a quite plausible finding. Older students, particularly in the first few grades ofschool, are likely to do better because their environment has exposed them to much of what is
--54--
being taught. This should be especially true for simple arithmetic and local languagecomprehension, but in these remote areas not for English.
Gender. There is no significant difference in the level of female enrolment between thevarious school groups. The grand mean is 55 percent male and 45 percent female; the means forAS and GS schools are the same and those for VBS schools are 54 and 46 percent. There aresignificant differences amongst schools in gender ratios, but they are virtually uncorrelated withtest scores. However, gender has a significant effect on test scores as discussed in section 7.4. Overall, girls scored between 5 (for maths) and 11 (for Chichewa) points lower than boys. Thissame effect can be observed when holding school type and school effects constant (see equations7 and 8 of table 25).
However, the percent of variance in test scores explained by school types is small. UsingOLS regression with test scores as the dependent variable and indicator (0,1) variables for schooltypes yields R2s of virtually zero for mathematics, 9 percent for English and 5 percent forChichewa. Using logit regression with the dependent variable indicating whether a student hasachieved specified thresholds yields pseudo-R2s of approximately the same magnitudes.
In summary, none of the variables discussed above, independently or together, explainthe association found between test scores and school types. A few of them add significantly toexplained variance (if we can trust the significance tests results given the skewed nature of thetest score distributions), but even then, they do not appreciably alter the relationship between testscores and school types.
It appears that the individual school has an effect on achievement is separate from theeffect of school type. In other words, it matters not only what type of school a child attends, butalso which particular school within that type. The impact is consistent across tests: if a schooldid well on one test it is quite likely to have done well on the other two tests. Thus, for example,on all three tests, the best schools are 2, 4 and 6 (2 and 4 are VBS schools; 6 is a AS school). There is less consistency across exams on the poor end of the scale, but school 5 (an AS school)obtained the lowest scores on all three exams while school 3 (a VBS school), 9 and 10 (both GSschools) did poorly on at least two of the exams.

--55--
Regression analysis confirms this finding. It also suggests that the school effect explainsa larger percent of the variance in test scores than does the treatment effect. Adding dummyvariables for individual schools to the basic equation with school type raises R2 for mathematicsfrom 0.2 to 11 percent, that for English from 9 to 21 percent and that for Chichewa from 5 to 21percent. Logit analysis provides similar results.
8.3 Instructional Activity
In order to try to explain more concretely what makes some schools spectacularly moreeffective than others in teaching basic language skills (in English and Chichewa) in particular, we analysed the data slightly differently by contrasting the data on instructional activity fromthe three most successful schools and with those from the seven others. It was considered thatthis perspective would be most likely to highlight the differences in classroom behaviour andteacher attitudes that lead to better performance, and help sharpen our view of the reasons whythe VBS schools were on average more effective than the others.
The three top schools include two VBS schools and one AS school. The others includeall the government schools, two AS and two VBS schools. As we can see from the table above,the three best schools were clearly much better than the others, and the best school was in turnclearly better than the other two in the same category. Attention is focused on Chichewa andEnglish classes only as the greatest differences in performance were identified in these subjectareas.
It is clear from table 27 that there are only a few activities for which there are meaningfuldifferences in incidence between the two types of classrooms. The high performing classroomsare more likely to use group work, and more likely to have a student discussion, more likely touse group response (when children respond in unison to a teacher's question), but less likely to
SCHOOL MATHS ENGLISH CHICHEWA TOTAL SCORE
VBS 4 31.39 33.33 56.39 120.88
AS 2 29.58 20.86 47.79 98.55
VBS 2 29.45 25.86 42.55 96.68
VBS 1 26.00 18.26 32.53 76.54
AS 3 26.14 13.75 32.96 72.46
GS 1 26.25 14.82 28.93 70.00
GS 3 26.4 10.65 28.24 65.28
VBS 3 20.96 15.11 28.42 64.57
GS 2 27.16 10.32 21.72 59.28
AS 1 22.07 8.31 18.81 49.58

--56--
recite from memory as a group (group recitation). These four characteristics together suggesta higher level of pupil participation and engagement in the high performing classrooms than inthe others. They indicate that the teachers in these schools have more active classes and practiseinstructional techniques more likely to promote learning in young children.
The teachers in the low performing classrooms were more likely to spend class timechecking student work.
8.4 Transfers and Repetition
A possible explanation for the difference in test scores is the extent to which the Standard2 classrooms contain either transfers and repeaters. Unfortunately, no direct evidence wascollected on this topic. The indirect evidence consists of the repetition statistics collected whichsuggests that repetition may be lower in VBS schools. The age profile of the tested students(tables 16 & 23) also does not suggest that students in the VBS school are any older thanstudents in the other types of schools.
8.5 Summary
In this section we looked at three possible explanations of the differences in achievementbetween the three school types. First, there is a significant difference between the scores ofStandard 1 and 2 pupils in all subjects. So, the test performance is a result of what has happenedduring the 10 years they have spent in school. Second, apart from gender, backgroundcharacteristics explain only a small amount of the variation in achievement scores and thecommunities from which the various schools draw their students do not appear to be significantlydifferent from each other.
Third, some differences in emphasis in instructional activity were identified between theVBS schools and the others, and also between classrooms in high performing schools and thosein low performing schools. However, the differences were small and subtle, and this findingstrongly suggests that the teachers in the various types of schools are teaching in essentially thesame way. The differences in emphasis may have more to do with differing class sizes,access to supplementary materials and levels of motivation. After all, the training the VBSteachers receive is based on the official teacher training curriculum and is carried out by officialsfrom the Ministry of Education.

--57--
Percentage of Classes Where ActivityOccurred
ACTIVITYHigh Performing Low Performing
Lecture 40 50
Teacher Writing on Board 60 71
Group Work 10 8
Discussion 20 4
Student Doing Exercises 50 42
Students Copying from Board 10 8
Teacher/Student Demonstrating 40 50
Group Recitation 40 63
Teacher Checking Student Work 40 58
Group Response 90 71
Teacher Helping Boy 40 38
Teacher Helping Girl 30 38
N 10 24* = Chichewa and English classes only
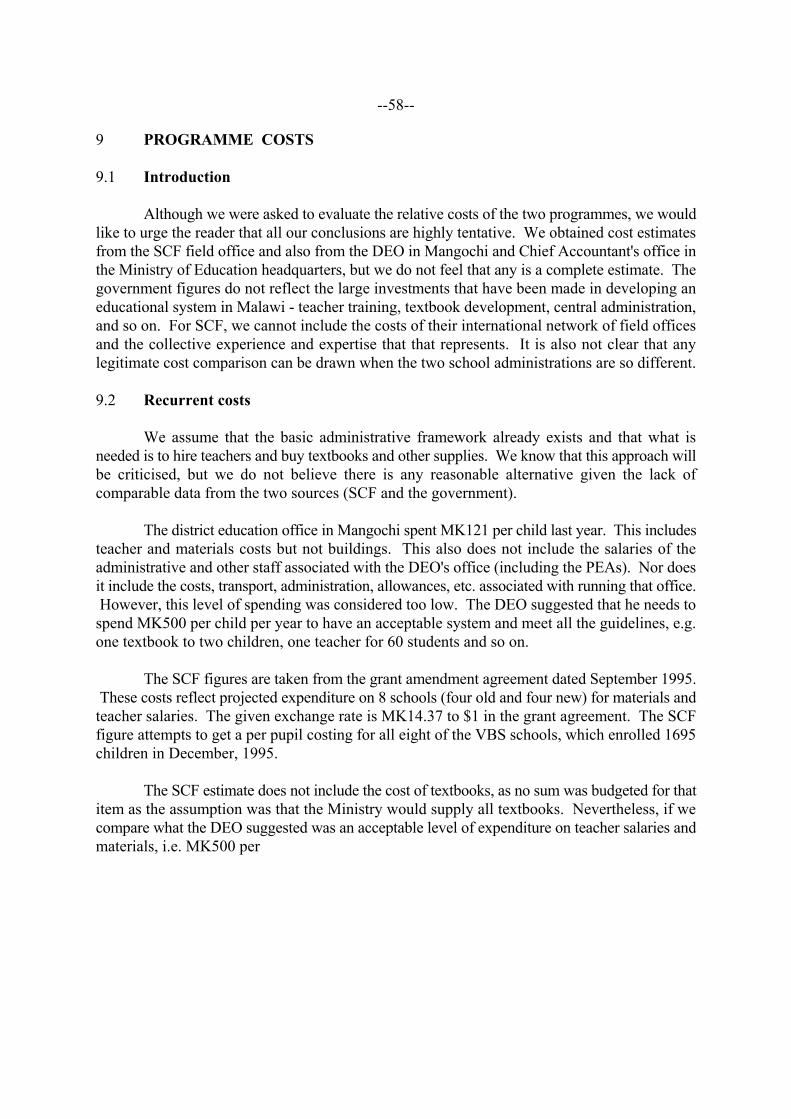
--58--
9 PROGRAMME COSTS
9.1 Introduction
Although we were asked to evaluate the relative costs of the two programmes, we wouldlike to urge the reader that all our conclusions are highly tentative. We obtained cost estimatesfrom the SCF field office and also from the DEO in Mangochi and Chief Accountant's office inthe Ministry of Education headquarters, but we do not feel that any is a complete estimate. Thegovernment figures do not reflect the large investments that have been made in developing aneducational system in Malawi - teacher training, textbook development, central administration,and so on. For SCF, we cannot include the costs of their international network of field officesand the collective experience and expertise that that represents. It is also not clear that anylegitimate cost comparison can be drawn when the two school administrations are so different.
9.2 Recurrent costs
We assume that the basic administrative framework already exists and that what isneeded is to hire teachers and buy textbooks and other supplies. We know that this approach willbe criticised, but we do not believe there is any reasonable alternative given the lack ofcomparable data from the two sources (SCF and the government).
The district education office in Mangochi spent MK121 per child last year. This includesteacher and materials costs but not buildings. This also does not include the salaries of theadministrative and other staff associated with the DEO's office (including the PEAs). Nor doesit include the costs, transport, administration, allowances, etc. associated with running that office. However, this level of spending was considered too low. The DEO suggested that he needs tospend MK500 per child per year to have an acceptable system and meet all the guidelines, e.g.one textbook to two children, one teacher for 60 students and so on.
The SCF figures are taken from the grant amendment agreement dated September 1995. These costs reflect projected expenditure on 8 schools (four old and four new) for materials andteacher salaries. The given exchange rate is MK14.37 to $1 in the grant agreement. The SCFfigure attempts to get a per pupil costing for all eight of the VBS schools, which enrolled 1695children in December, 1995.
The SCF estimate does not include the cost of textbooks, as no sum was budgeted for thatitem as the assumption was that the Ministry would supply all textbooks. Nevertheless, if wecompare what the DEO suggested was an acceptable level of expenditure on teacher salaries andmaterials, i.e. MK500 per
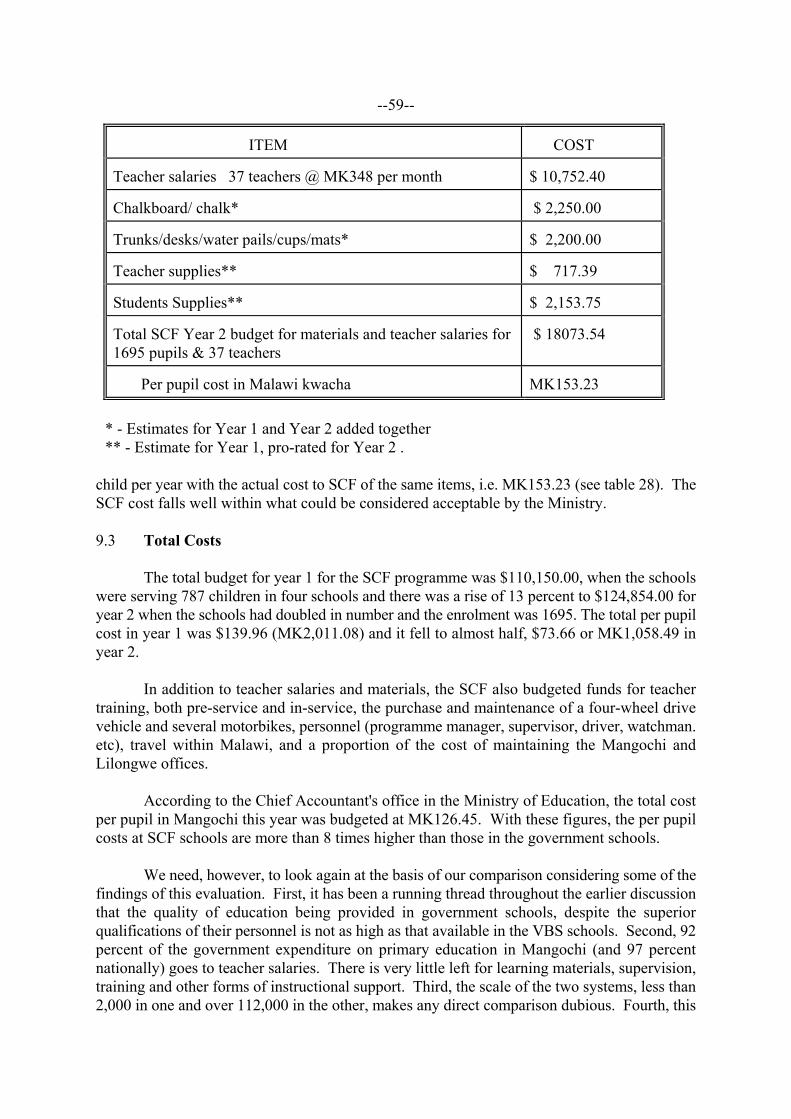
--59--
child per year with the actual cost to SCF of the same items, i.e. MK153.23 (see table 28). TheSCF cost falls well within what could be considered acceptable by the Ministry.
9.3 Total Costs
The total budget for year 1 for the SCF programme was $110,150.00, when the schoolswere serving 787 children in four schools and there was a rise of 13 percent to $124,854.00 foryear 2 when the schools had doubled in number and the enrolment was 1695. The total per pupilcost in year 1 was $139.96 (MK2,011.08) and it fell to almost half, $73.66 or MK1,058.49 inyear 2.
In addition to teacher salaries and materials, the SCF also budgeted funds for teachertraining, both pre-service and in-service, the purchase and maintenance of a four-wheel drivevehicle and several motorbikes, personnel (programme manager, supervisor, driver, watchman.etc), travel within Malawi, and a proportion of the cost of maintaining the Mangochi andLilongwe offices.
According to the Chief Accountant's office in the Ministry of Education, the total costper pupil in Mangochi this year was budgeted at MK126.45. With these figures, the per pupilcosts at SCF schools are more than 8 times higher than those in the government schools.
We need, however, to look again at the basis of our comparison considering some of thefindings of this evaluation. First, it has been a running thread throughout the earlier discussionthat the quality of education being provided in government schools, despite the superiorqualifications of their personnel is not as high as that available in the VBS schools. Second, 92percent of the government expenditure on primary education in Mangochi (and 97 percentnationally) goes to teacher salaries. There is very little left for learning materials, supervision,training and other forms of instructional support. Third, the scale of the two systems, less than2,000 in one and over 112,000 in the other, makes any direct comparison dubious. Fourth, this
ITEM COST
Teacher salaries 37 teachers @ MK348 per month $ 10,752.40
Chalkboard/ chalk* $ 2,250.00
Trunks/desks/water pails/cups/mats* $ 2,200.00
Teacher supplies** $ 717.39
Students Supplies** $ 2,153.75
Total SCF Year 2 budget for materials and teacher salaries for1695 pupils & 37 teachers
$ 18073.54
Per pupil cost in Malawi kwacha MK153.23
* - Estimates for Year 1 and Year 2 added together** - Estimate for Year 1, pro-rated for Year 2 .

--60--
comparison does not factor in the cost implications of the higher wastage rates in the governmentschool, both dropout and repetition. Fifth, the per pupil cost for Mangochi does not reflect thesupport (emoluments, administration, etc.) from the Ministry of Education Headquarters or forthat matter from the Ministry of Finance, Sixth, the costs for the Ministry to either absorb orstart-up VBS schools would be only a fraction of what it has cost the SCF, largely because themarginal costs of adding schools is relatively low. Even SCF experienced a significant drop inper pupil costs in the second year of operation, when they went from four to eight schools.
9.4 Summary
Due to lack of data, we were not able to present a complete picture. However, we haveno clear cut evidence that the VBS schools are significantly more expensive to establish or runthan government schools, if all costs are taken into account and if the systems were of the samemagnitude. We would like to stress that the issue should not be absolute costs but costeffectiveness -- what is being delivered for the money spent.

--61--
10 OPTIONS FOR EXPANSION AND REPLICATION
10.1 Teacher Salaries
Unless teacher salaries in the village based schools are taken over by the government,there is little chance that these village schools will continue to operate. The communitiesindicated that there was little prospect of their being able to provide the minimum ofapproximately MK1300 per month to support teachers (assuming schools have a minimumcomplement of four PSLC holders).
They were almost unanimous in stating that unless they were successful in obtainingreplacement support from the government or another NGO, the school would have to close. Inone community, the villagers had already formed a committee to look into the issue ofreplacement support, but the committee had not yet met. In another, the parents indicated thatthey would attempt to get loans and start a business to keep the school going until such time asthe government can be persuaded to take on the burden of the salaries. The response from thehousehold interviews was more optimistic as 80 percent of the VBS parents indicated that theywould be willing to continue to support the schools were the SCF to withdraw its support.
10.2 Supervision
Effective supervision is presently being provided for the VBS schools by SCF, with someassistance from the MOE PEAs. However, the government schools are not being effectivelysupervised and, in our opinion, this is a key cause for the poor results in the governmentschools. In fact we are fairly certain that without the supervision, the results in the VBS schoolsmight have been even lower than those in the government schools. The VBS teachers were lesseducated, had not received formal teacher training, and yet were able to produce better results. The key lesson in this is that all teachers need regular supervision and guidance, regardlessof their training and education level.
Any plan to expand or develop schooling must therefore include a realistic, viable planfor regular supervision of the schools. The SCF supervisor had both a home and an office in themiddle of the zone in which he worked. He also had transportation, a motorbike, as well as fairlyregular access to other SCF vehicles. He was, therefore, a regular presence in the schools.
The Ministry needs to exert pressure on its PEAs to move into their zones; they are doinglittle good in their present locations.
It appears to us that with training and supervision, the VBS schools are providing aneducational service that is equal in most respects and superior in others to the service beingprovided in nearby full primary schools.

--62--
10.3 Community Self-Help
The community members we talked to showed no reduction in their willingness toengage in self-help to build schools for their children. The only problem arose when their effortsare not reciprocated with matching funds or efforts. So, for example, one government school hadhad piles of bricks for additional classroom blocks for several years because the agency that hadpromised to help them build the classrooms never followed through with its promise.
All communities had been successfully mobilized to build their schools and communitymembers indicated their readiness to contribute in this way again. However, their lack ofconfidence in their own competence, particularly in the government schools where teachers areusually not from the same community, has inhibited their involvement in other areas.
We feel that teachers and headteachers should be encouraged to reach out more toparents through the holding of regular open days. An additional way of supporting community-school communication and interaction is through the holding of literacy classes based in theschool.
10.4 Adapted Curriculum
After two years of use in the VBS schools, the reduced curriculum has shown that it canhave a positive impact on the learning achievement of pupils in Standard 1 and 2. This impactis strongest in English and Chichewa. We suggest that the increased time spent on the coresubjects (25 percent more) makes a significant contribution to the higher learning achievementin the VBS schools.
10.5 Local Recruitment of PSLC Teachers
The results of this evaluation indicate clearly that locally recruited PSLC teachers caneffectively teach the core subjects in Standards 1 and 2, provided they have regular supervision.
Current government policy stipulates the JC as a minimum qualification. While wewould endorse the desire to have teachers be as qualified as possible, we would like to suggestthat many communities, particularly those communities, that lack educational services most,would be unable to attract and retain JC or MSCE teachers. Despite their high unemploymentlevels, only 30 percent of the 19,000 teachers hired in 1994 were MSCE holders -- they do notwant to be primary school teachers, particularly when being a primary school teacher involvesliving in an isolated rural community among 'strangers'.
We would like to suggest the use of individuals with the PSLC qualification to teachjunior grades for the following reasons:
• They have demonstrated their effectiveness in this project• They have shown themselves to be hard working and highly motivated• When locally recruited, they will help to ease the bottleneck of teacher housing that
prevents some schools from being properly staffed

--63--
• They have a lower cost per teacher with respect to salary • Local recruitment is recognized as a reliable strategy for increasing the number and
proportion of female primary teachers
There are a variety of mechanisms that could be used, the creation of a separate categoryof teachers; the issuance of temporary teachers' licences to be confirmed if the holder obtains aJC or MSCE within five years of starting to teach, etc. As their use in higher grades has not beenassessed, this should be considered a temporary strategy to address an emergency situationcaused by the massive influx into schools by the announcement of free education.
A variety of models could also be considered, e.g. locally recruited PSLC teachers couldbe used within full primary schools to reduce class sizes in the junior grades. A similar strategyutilizing untrained school leavers has been used in Kenya by the district that produces the bestresults for rural areas.
11
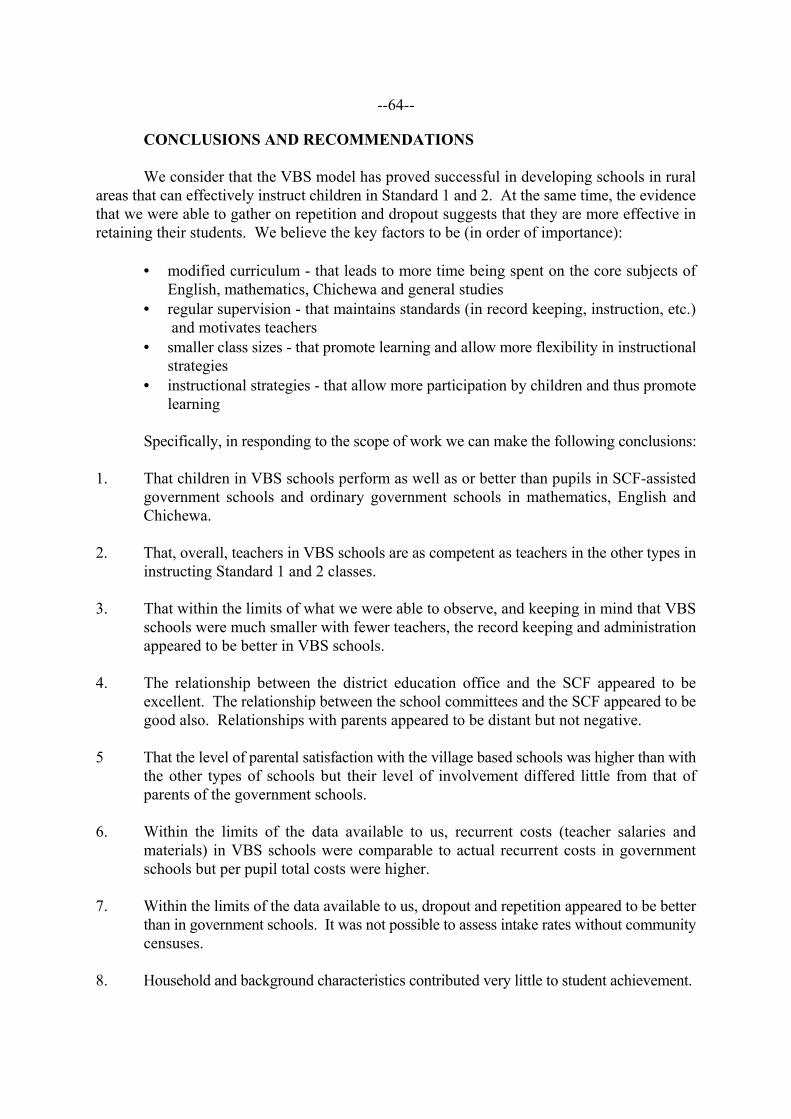
--64--
CONCLUSIONS AND RECOMMENDATIONS
We consider that the VBS model has proved successful in developing schools in ruralareas that can effectively instruct children in Standard 1 and 2. At the same time, the evidencethat we were able to gather on repetition and dropout suggests that they are more effective inretaining their students. We believe the key factors to be (in order of importance):
• modified curriculum - that leads to more time being spent on the core subjects ofEnglish, mathematics, Chichewa and general studies
• regular supervision - that maintains standards (in record keeping, instruction, etc.) and motivates teachers
• smaller class sizes - that promote learning and allow more flexibility in instructionalstrategies
• instructional strategies - that allow more participation by children and thus promotelearning
Specifically, in responding to the scope of work we can make the following conclusions:
1. That children in VBS schools perform as well as or better than pupils in SCF-assistedgovernment schools and ordinary government schools in mathematics, English andChichewa.
2. That, overall, teachers in VBS schools are as competent as teachers in the other types ininstructing Standard 1 and 2 classes.
3. That within the limits of what we were able to observe, and keeping in mind that VBSschools were much smaller with fewer teachers, the record keeping and administrationappeared to be better in VBS schools.
4. The relationship between the district education office and the SCF appeared to beexcellent. The relationship between the school committees and the SCF appeared to begood also. Relationships with parents appeared to be distant but not negative.
5 That the level of parental satisfaction with the village based schools was higher than withthe other types of schools but their level of involvement differed little from that ofparents of the government schools.
6. Within the limits of the data available to us, recurrent costs (teacher salaries andmaterials) in VBS schools were comparable to actual recurrent costs in governmentschools but per pupil total costs were higher.
7. Within the limits of the data available to us, dropout and repetition appeared to be betterthan in government schools. It was not possible to assess intake rates without communitycensuses.
8. Household and background characteristics contributed very little to student achievement.

--65--
Further, the VBS schools enrolled an equal proportion of girls and boys and had a higherpercentage of female teachers than either the SCF-assisted schools or the government schools. However, while girls performed better in the VBS schools on an absolute scale, theirperformance relative to boys was poorer than in both types of government schools.
From our observations, we make two sets of recommendations below, one for theMinistry of Education and the other for the SCF.
11.1 Recommendations for Ministry of Education
We believe that the revolutionary concept of free education requires a major re-thinkingof educational models and strategies within the country. It is not viable to simply considerexpanding the system that has served the country for the past 30 years. The educational systemthat advocates 'free education' should be different not only in degree but in kind, from asystem that passively restricted access to primary school and actively restricted it at thesecondary level. For example, the old system advocated the gradual raising of educationalstandards of teachers, and promoted the idea of certain entitlements, like housing for teachers,that simply cannot be supported within a context of universal (or near universal) primaryschooling.
At the same time some good strategies like the establishment of district level PEAs haveatrophied and the PEAs are therefore not playing the role they could. PEAs could play thesame role as field assistants do in the Ministry of Agriculture or CDAs do in the Ministryof Community Services, i.e. be in regular and meaningful contact with schools, motivatingand supporting teachers. This evaluation has demonstrated that an invaluable contribution canbe made to the quality and effectiveness of teaching when there is regular monitoring of andfeedback to teachers.
The current pupil:teacher ratio in the country is 1:62 (MOE 1995). Even allowing for therelatively small class sizes at the end of primary school, there are enough teachers in Malawi tomake Standard 1 classes of 100 and over unnecessary. A key problem is poor allocation ofteachers to schools particularly in rural areas. A recent study (Kadzamira & Kunje 1995)documented the oversupply of teachers to urban areas.
If Mangochi district is typical, then housing is a constraint for the true decentralizationof the PEAs as well as allocation of teachers to schools. The lack of transport also restricts themovement of PEAs. We would like the government to consider addressing these constraintsurgently and flexibly. For example, there are a small enough number of PEAs that those withisolated rural zones for whom suitable houses cannot be found could have them built. Theycould have bicycles instead of or as well as motor bikes. Bicycles have the virtue of being bothcheaper to obtain and easier to maintain in rural areas.
The issue of textbook and materials distribution also requires a creative and innovativeapproach that is currently lacking. Certain supplies, like soft drinks, beer and examinationpapers are regularly delivered to the most remote areas of the country. We feel that districteducation officers should take advantage of the existing networks, either to learn how it is done

--66--
or to supplement their own systems.
The supervision of schools, class sizes and the efficient distribution of teachers andtextbooks are essential building blocks in the provision of quality education -- a commodity thatministers of education in the region have recently declared a basic human right (EFA Mid-Decade Review regional conference in Johannesburg).
We, therefore, make the following strong recommendations to the government ofMalawi:
A. THE GOVERNMENT SHOULD ENSURE THAT PEAS HAVE THENECESSARY TRANSPORT AND SUPPORT TO CARRY OUT THEIRTRAINING AND SUPERVISION TASKS IN ALL SCHOOLS
B. THE GOVERNMENT SHOULD PERMIT, IN SITUATIONS WHEN JC ANDMSCE HOLDERS ARE NOT AVAILABLE, PSLC HOLDERS TO TEACH INTHE FIRST TWO YEARS OF PRIMARY SCHOOL
C. THE GOVERNMENT SHOULD SERIOUSLY CONSIDER EXPANDING THENUMBER OF VILLAGE SCHOOLS, PROVIDED THAT THERE ISTRAINING AND SUPERVISION SUPPORT
D. THE GOVERNMENT SHOULD APPROACH COMMERCIALDISTRIBUTORS, CHIBUKU, SOUTHERN BOTTLERS, MANEB, ETC TOASSIST IN THE DISTRIBUTION OF TEXTBOOKS AND OTHERMATERIALS.
E. THE GOVERNMENT SHOULD MORE STRENUOUSLY PRACTICE LOCALRECRUITMENT IN CASES WHERE HOUSING IS A PROBLEM
F. CLASS SIZES IN LOWER PRIMARY STANDARDS SHOULD BELOWERED AND URGENT HELP IN CLASS MANAGEMENT AND MULTI-GRADE TEACHING STRATEGIES BE GIVEN TO TEACHERS OF THESECLASSES
11.2 Recommendations for SCF
These recommendations are based partly on the premise that for viability andsustainability, the message of the differences in the VBS model of school development shouldbe spread throughout the community. While SCF have made a good start, we believe they haveunderestimated the amount of time and effort required to build true community involvement --a key requirement for the sustainability of community schools.
A. SCF SHOULD RECRUIT A COMMUNITY WORKER TO HELP MOBILIZECOMMUNITY PARTICIPATION IN THE SCHOOLS
B. SCF SHOULD SPONSOR ANOTHER EVALUATION WITHIN TWO YEARSTO ASSESS:

--67--
(i) WHETHER THE PSLC TEACHERS REMAIN EFFECTIVE INSTANDARDS 3 AND 4,(ii) WHETHER VBS PUPILS CAN TRANSFER SMOOTHLY INTO FULLPRIMARY SCHOOLS AND(iii) THE GENDER DYNAMICS WITHIN THE VBS CLASSROOMS
C. THAT LOCAL BUILDERS BE COMPENSATED FOR THEIR FULL TIMEEFFORT DURING THE CONSTRUCTION OF CLASSROOM BLOCKS
D. THAT SCF PROMOTE STUDY VISITS OF TEACHERS IN NEIGHBOURINGGOVERNMENT SCHOOLS TO SCF VILLAGE SCHOOLS TO OBSERVETHE INSTRUCTIONAL ENVIRONMENT
--68--
REFERENCES
Benavot, A. 1989. Education, Gender and Economic Development: A Cross-National Study. Sociology of Education 62:14-32.
Blatchford, P. & P. Mortimore. 1994. "The Issue of Class Size for Young Children in Schools: what can we learn from research?", Oxford Review of Education. Vol 20:4, pp 411 -428.
Floro, M. & J. M. Wolf. 1990. The Economic and Social Impacts of Girls' Primary Education
in Developing Countries. Creative Associates International Inc. Washington, D.C.
Hyde, K.A. L. 1996. Girls' Education in Eastern and Southern Africa: An Overview. Preparedfor the Regional Mid-Decade Review Conference, Johannesburg, South Africa. Unicef& FAWE: Nairobi, Kenya.
Kadzamira, E.C. & D. Kunje. 1996. Gable Double Shifts Pilot Study. Draft Report. Centre forEducational Research and Training, University of Malawi.
King, E. M. & M. A. Hill. (eds) 1993. Women's Education in Developing Countries: Barriers,Benefits and Policies. Johns Hopkins University Press: Baltimore and London.
Maccoby, E.E. & C.N. Jacklin. 1974. The Psychology of Sex Differences. London: OxfordUniversity Press.
Ministry of Education. 1995. Basic Education Statistics, Malawi 1995 (Draft). Lilongwe.
SCF/US. Mangochi Project Quarterly Reports (1995).

--69--
Appendix 1: GOVERNMENT PROCEDURES
Pupils: There are absolutely no restrictions on enrolment into Standard 1 under the new freeeducation system.
Teachers: Teachers are hired by the Ministry of Education and deployed through districteducation offices without reference to either the community of existing staff. The minimum qualification for a primary school teacher is the JuniorCertificate. All those without teacher training are hired as temporary teachers.
Conditions of Employment:Educational upgrading is not a requirement when one is hired as a governmentteacher.
Curriculum: In government schools, instruction is for 30 half hour periods per weekcovering eight subjects: English, Chichewa, Mathematics, general studies,music, religious instruction, physical education and creative arts. The firstfour take up 24 periods a week.