Pediatric Obesity KAMU Kansas Association for the Medically Underserved OBESITY MODULE 6
Upload
godwin-norrisCategory
view
228download
0
VII. VII. Medically Underserved Areas Medically Underserved Areas (MUA)(MUA)
& & Medically Underserved Populations Medically Underserved Populations
(MUP)(MUP)
VII-1
MUA/MUPMUA/MUP
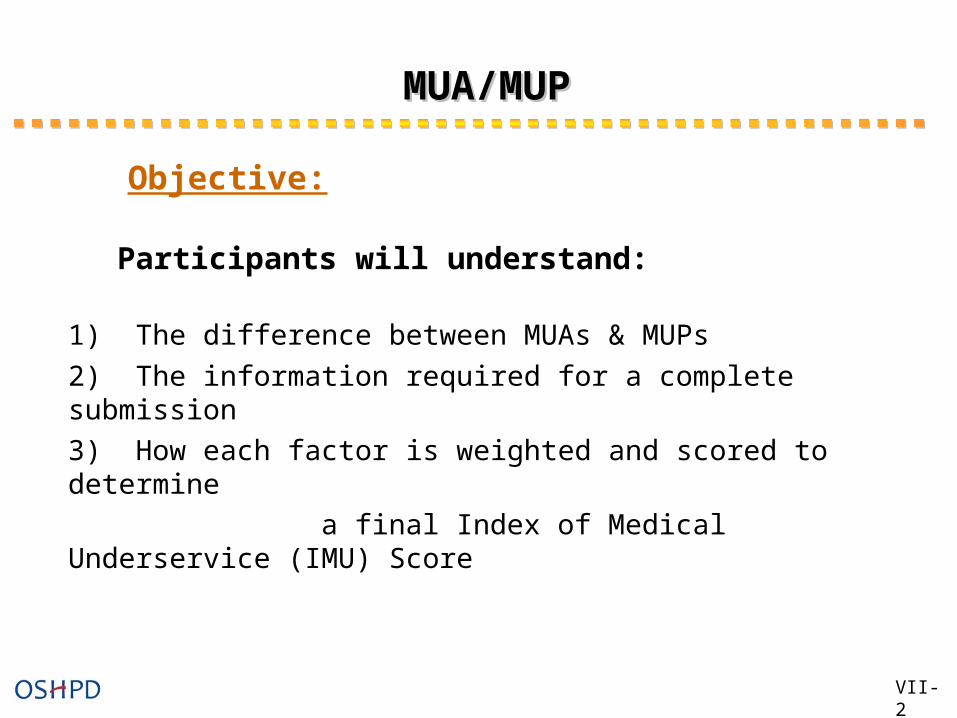
Objective:
Participants will understand:
1) The difference between MUAs & MUPs
2) The information required for a complete submission
3) How each factor is weighted and scored to determine
a final Index of Medical Underservice (IMU) Score
VII-2
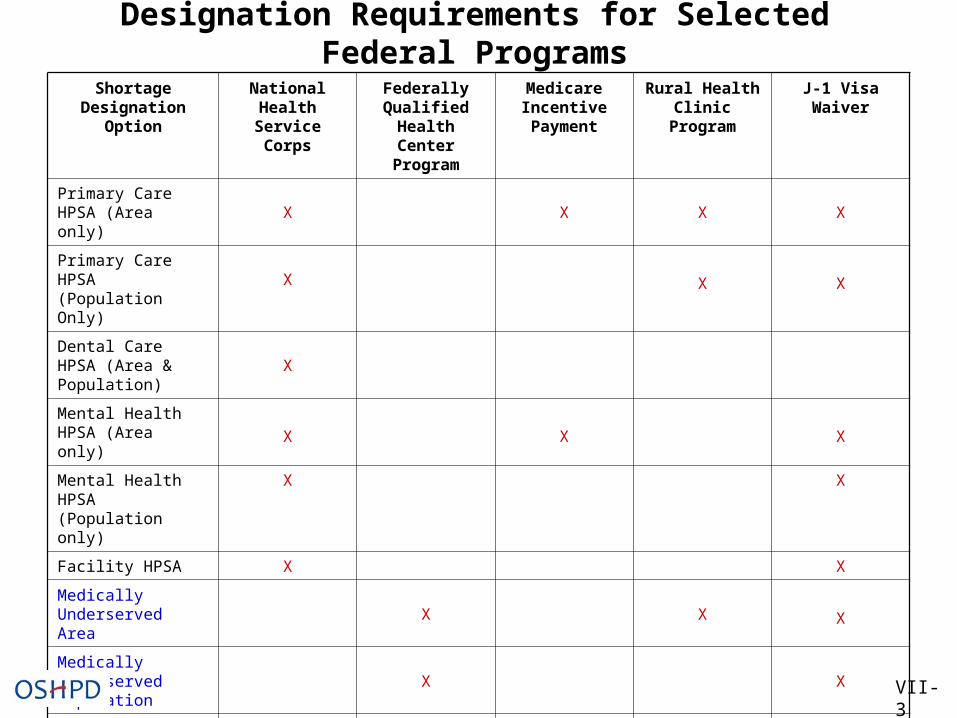
Designation Requirements for Selected Federal Programs
VII-3
Shortage Designation Option
National Health Service Corps
Federally Qualified Health Center Program
Medicare Incentive Payment
Rural Health Clinic Program
J-1 Visa Waiver
Primary Care HPSA (Area only) X X X X
Primary Care HPSA (Population Only) X X X
Dental Care HPSA (Area & Population) X
Mental Health HPSA (Area only) X X X
Mental Health HPSA (Population only)
X X
Facility HPSA X X
Medically Underserved Area X X X
Medically Underserved Population X X
State Governor’s Certified Eligible Area (for RHC purposes only)
X
(Not in CA)
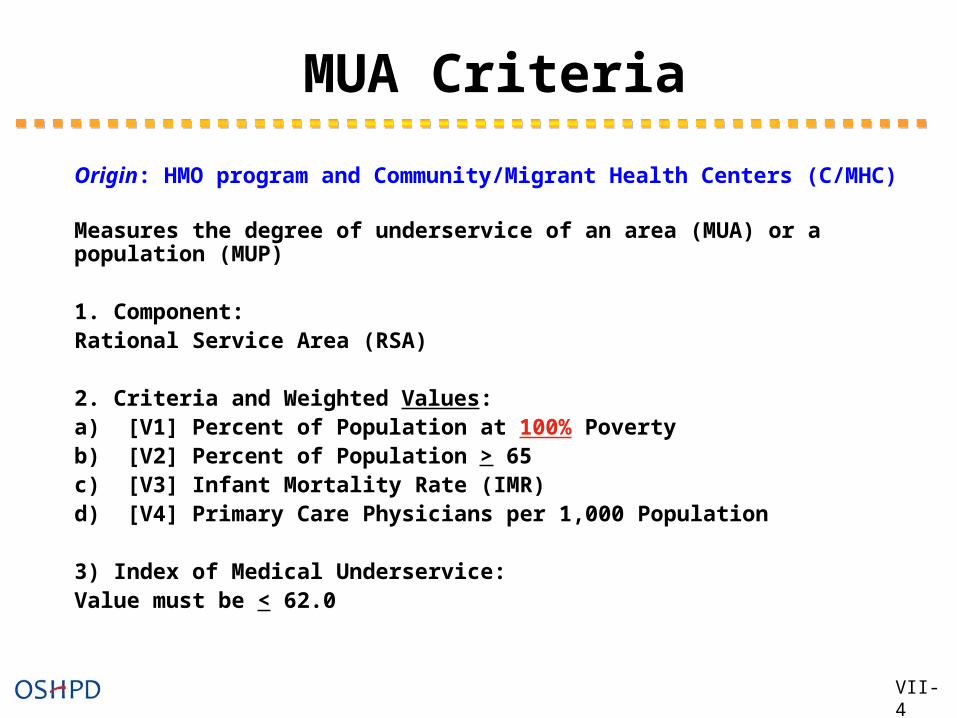
MUA Criteria
Origin: HMO program and Community/Migrant Health Centers (C/MHC)
Measures the degree of underservice of an area (MUA) or a population (MUP)
1. Component:
Rational Service Area (RSA)
2. Criteria and Weighted Values: a) [V1] Percent of Population at 100% Poverty
b) [V2] Percent of Population > 65c) [V3] Infant Mortality Rate (IMR)d) [V4] Primary Care Physicians per 1,000 Population
3) Index of Medical Underservice:
Value must be < 62.0
VII-4
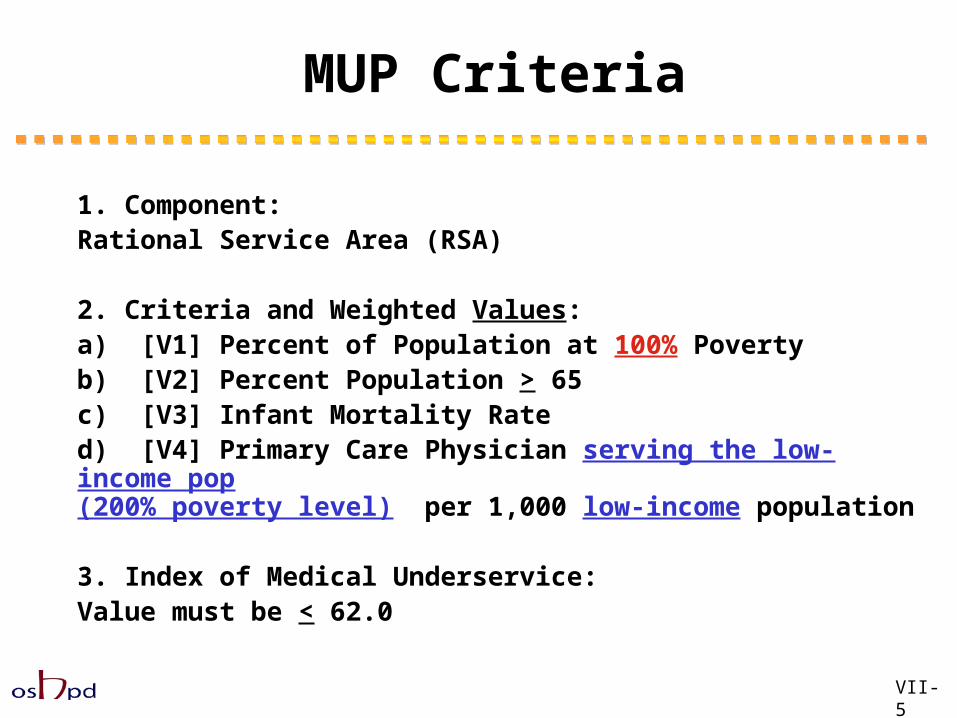
MUP Criteria
1. Component:
Rational Service Area (RSA)
2. Criteria and Weighted Values: a) [V1] Percent of Population at 100% Poverty
b) [V2] Percent Population > 65c) [V3] Infant Mortality Rated) [V4] Primary Care Physician serving the low-income pop
(200% poverty level) per 1,000 low-income population
3. Index of Medical Underservice:
Value must be < 62.0
VII-5
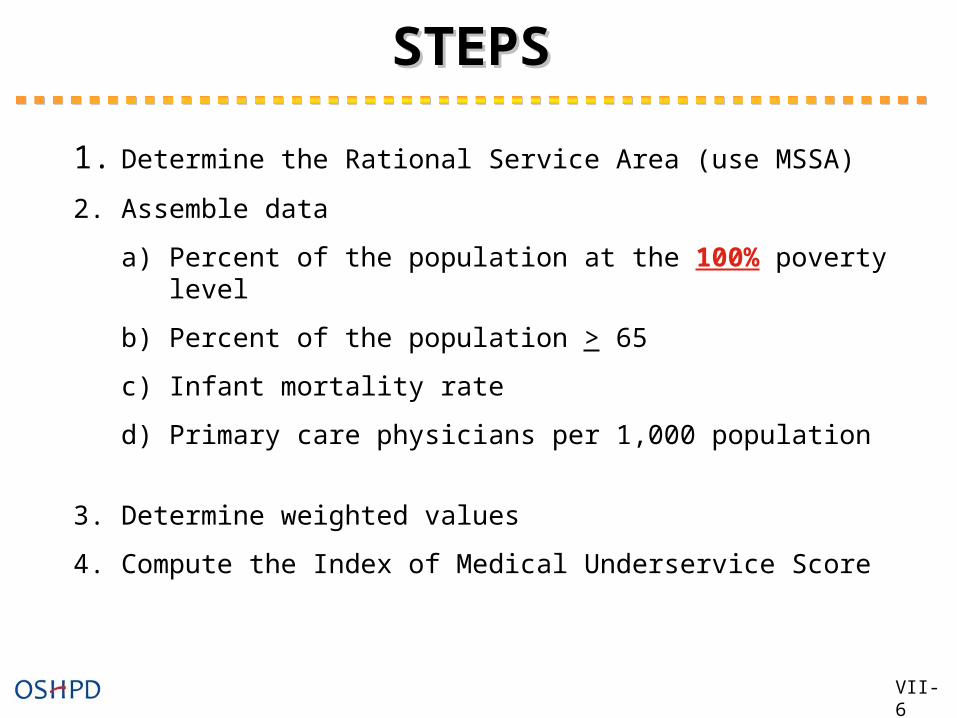
1. Determine the Rational Service Area (use MSSA)
2. Assemble data
a) Percent of the population at the 100% poverty level
b) Percent of the population > 65
c) Infant mortality rate
d) Primary care physicians per 1,000 population
3. Determine weighted values
4. Compute the Index of Medical Underservice Score
STEPSSTEPS
VII-6
Determine the Rational Service Area Determine the Rational Service Area (use MSSA).(use MSSA).
STEP 1
VII-7
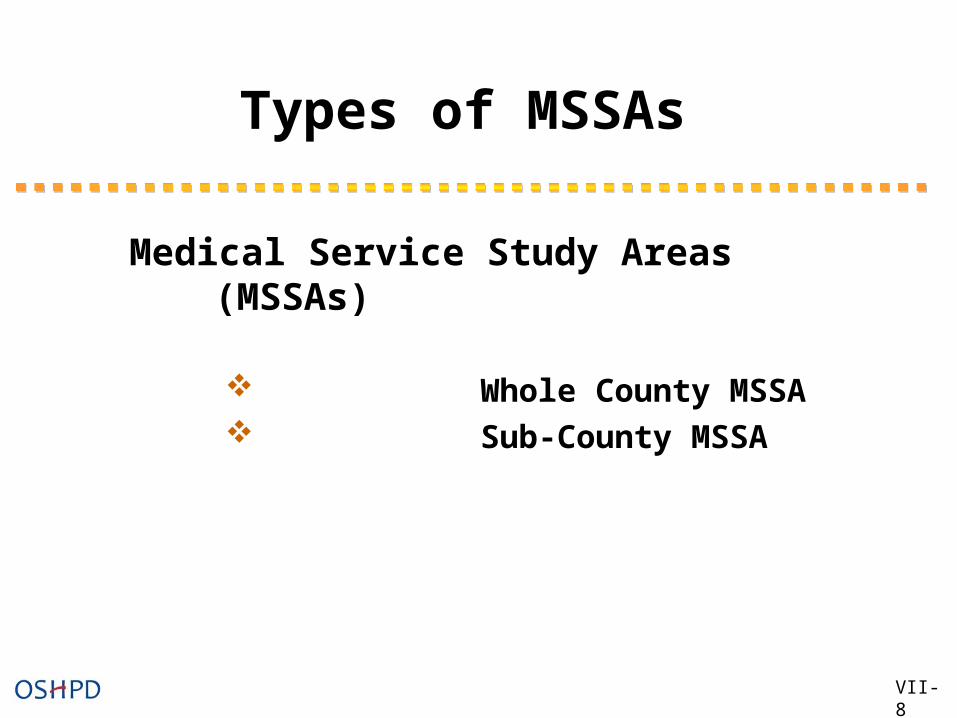
Types of MSSAs
Medical Service Study Areas (MSSAs)
Whole County MSSA Sub-County MSSA
VII-8
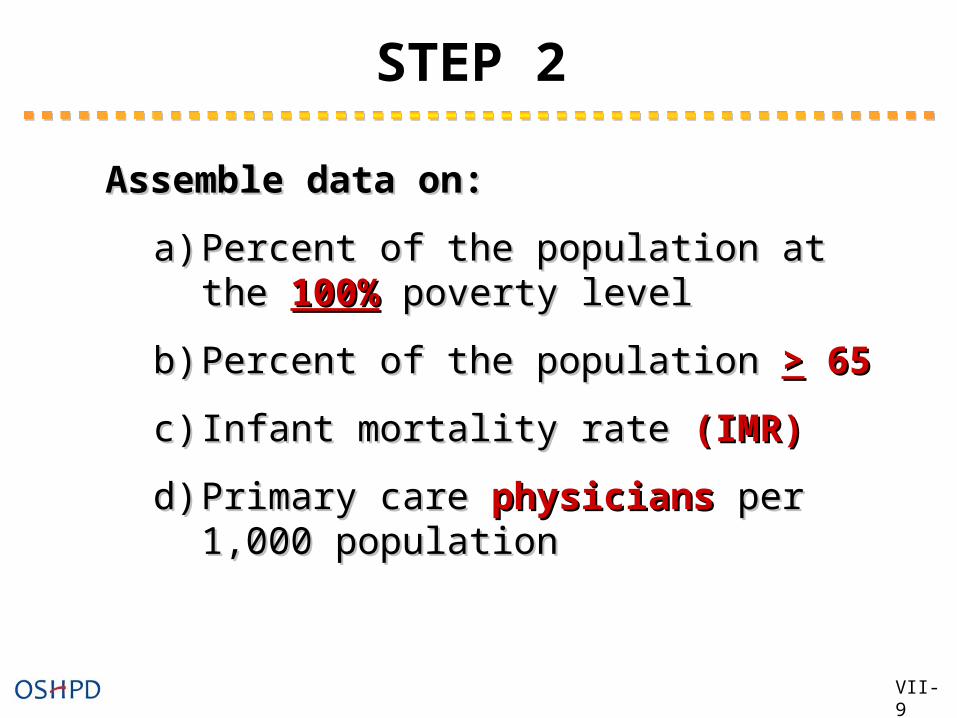
Assemble data on:Assemble data on:
a)a) Percent of the population at the Percent of the population at the 100%100% poverty levelpoverty level
b)b) Percent of the population Percent of the population >> 65 65
c)c) Infant mortality rate Infant mortality rate (IMR)(IMR)
d)d) Primary care Primary care physiciansphysicians per 1,000 per 1,000 populationpopulation
STEP 2
VII-9
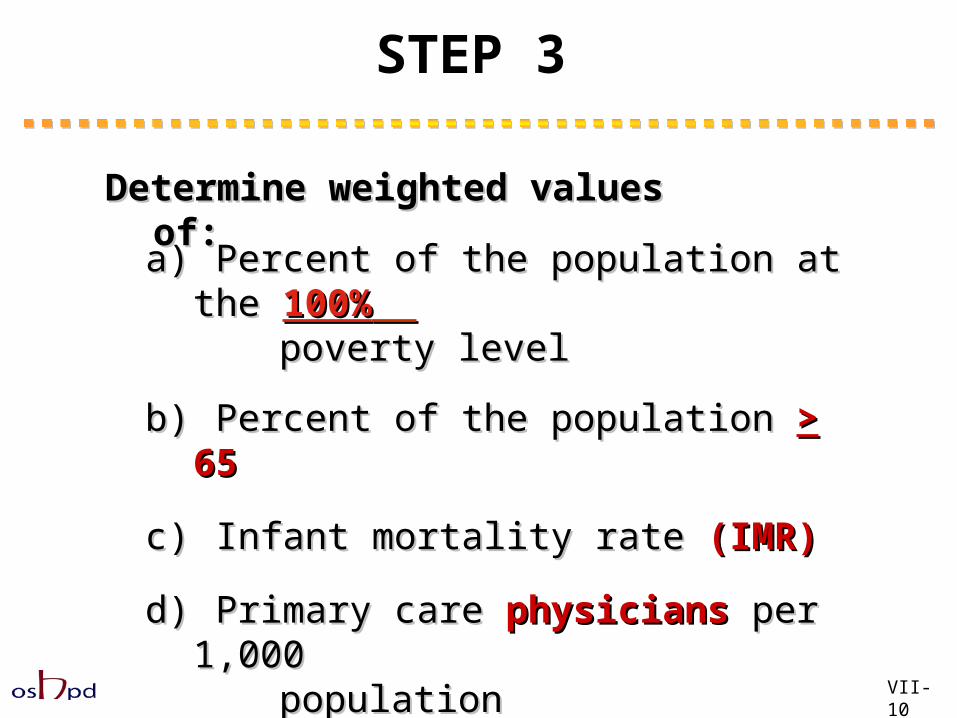
Determine weighted values of:Determine weighted values of:
STEP 3
VII-10
a)a) Percent of the population at the Percent of the population at the 100%100% poverty levelpoverty level
b)b) Percent of the population Percent of the population >> 65 65
c)c) Infant mortality rate Infant mortality rate (IMR)(IMR)
d)d) Primary care Primary care physiciansphysicians per 1,000 per 1,000 populationpopulation
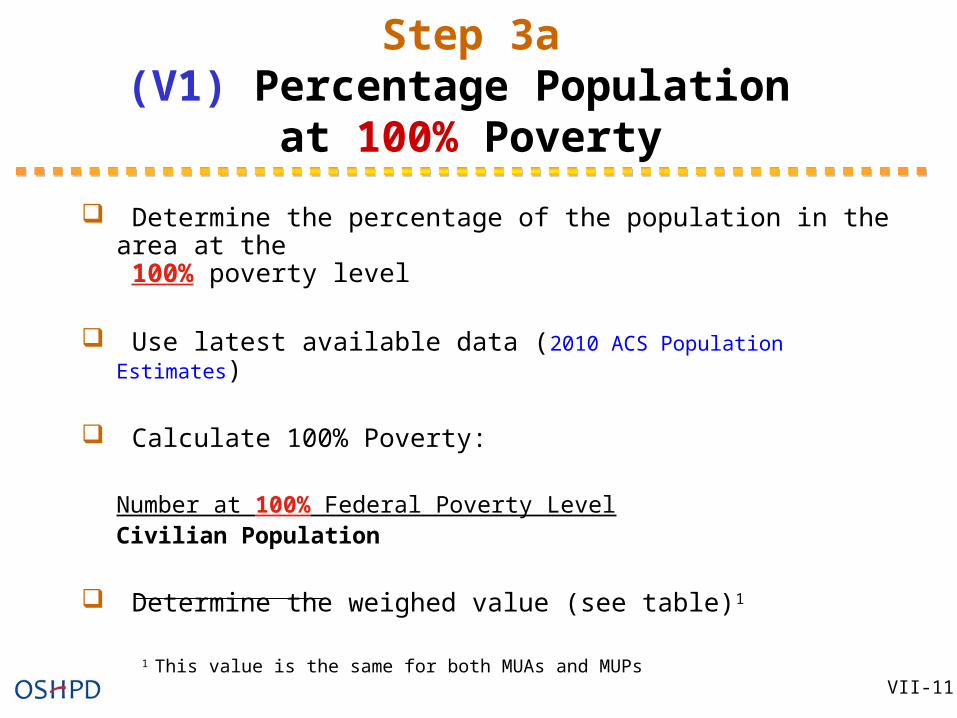
Step 3a(V1) Percentage Population
at 100% Poverty
Determine the percentage of the population in the area at the 100% poverty level
Use latest available data (2010 ACS Population Estimates)
Calculate 100% Poverty:
Number at 100% Federal Poverty LevelCivilian Population
Determine the weighed value (see table)1
1 This value is the same for both MUAs and MUPs
VII-11
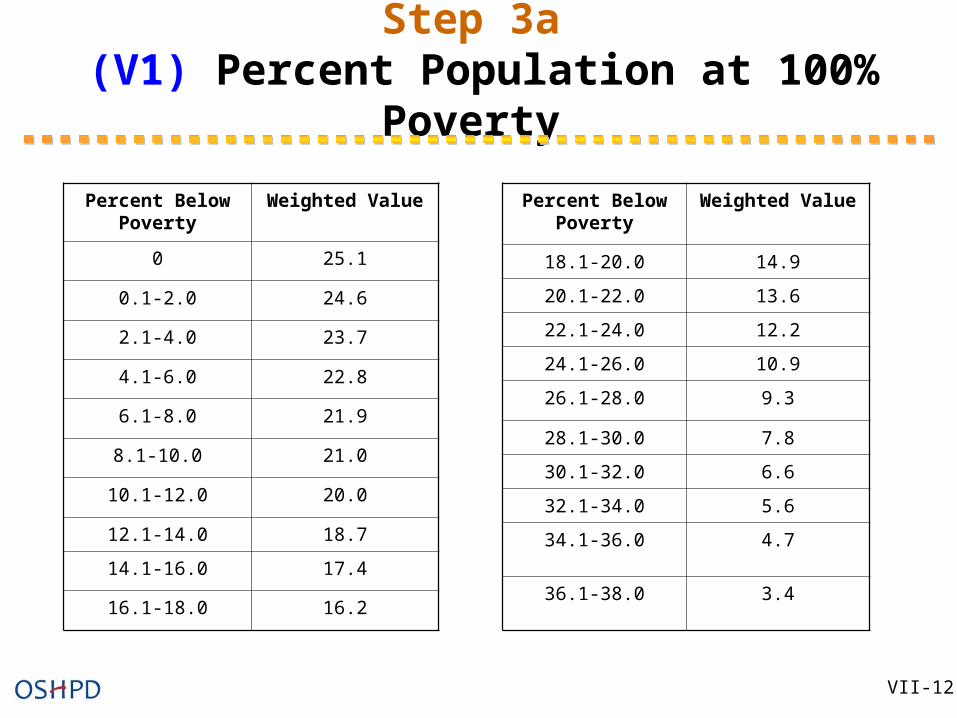
Step 3a (V1) Percent Population at 100% Poverty
Percent Below Poverty
Weighted Value
0 25.1
0.1-2.0 24.6
2.1-4.0 23.7
4.1-6.0 22.8
6.1-8.0 21.9
8.1-10.0 21.0
10.1-12.0 20.0
12.1-14.0 18.7
14.1-16.0 17.4
16.1-18.0 16.2
Percent Below Poverty
Weighted Value
18.1-20.0 14.9
20.1-22.0 13.6
22.1-24.0 12.2
24.1-26.0 10.9
26.1-28.0 9.3
28.1-30.0 7.8
30.1-32.0 6.6
32.1-34.0 5.6
34.1-36.0 4.7
36.1-38.0 3.4
VII-12
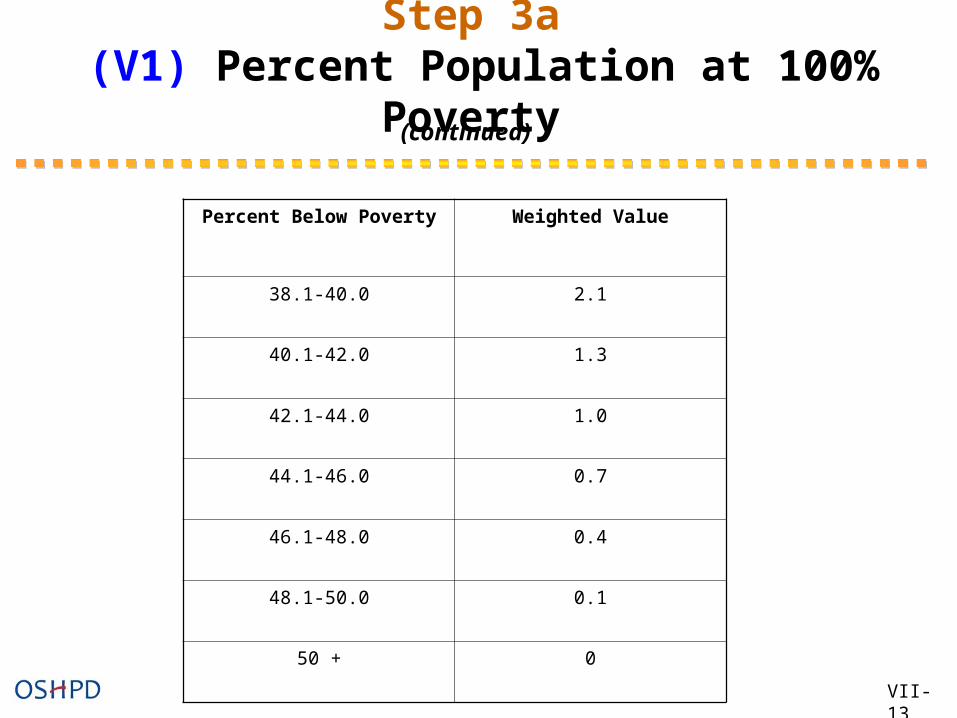
Step 3a (V1) Percent Population at 100% Poverty
Percent Below Poverty Weighted Value
38.1-40.0 2.1
40.1-42.0 1.3
42.1-44.0 1.0
44.1-46.0 0.7
46.1-48.0 0.4
48.1-50.0 0.1
50 + 0
VII-13
(continued)
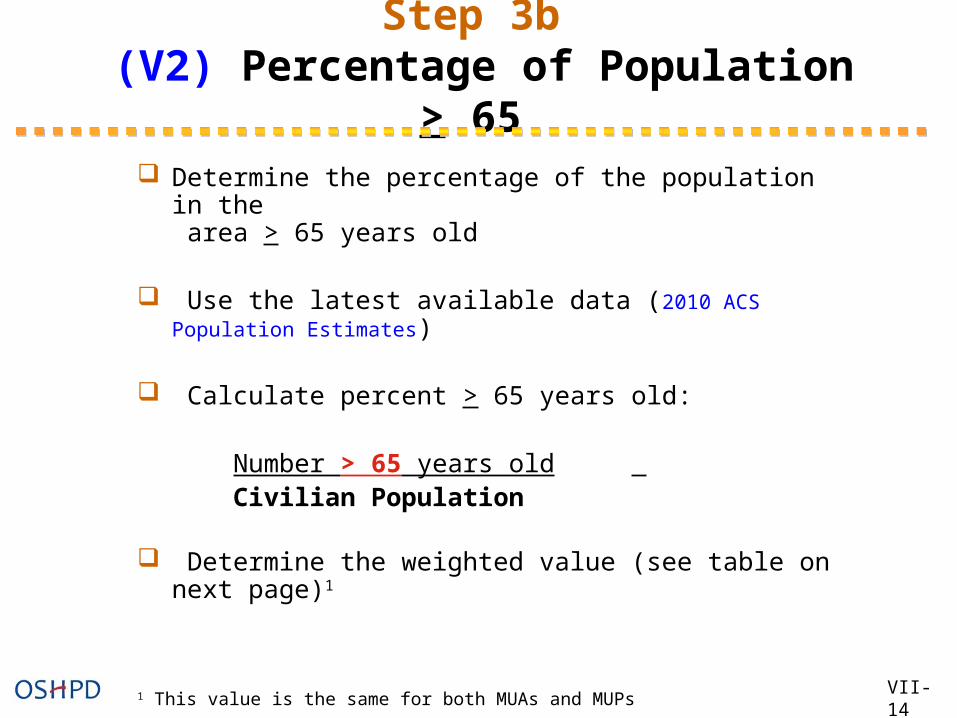
Step 3b (V2) Percentage of Population > 65
Determine the percentage of the population in the area > 65 years old
Use the latest available data (2010 ACS Population Estimates)
Calculate percent > 65 years old:
Number > 65 years old Civilian Population
Determine the weighted value (see table on next page)1
1 This value is the same for both MUAs and MUPsVII-14
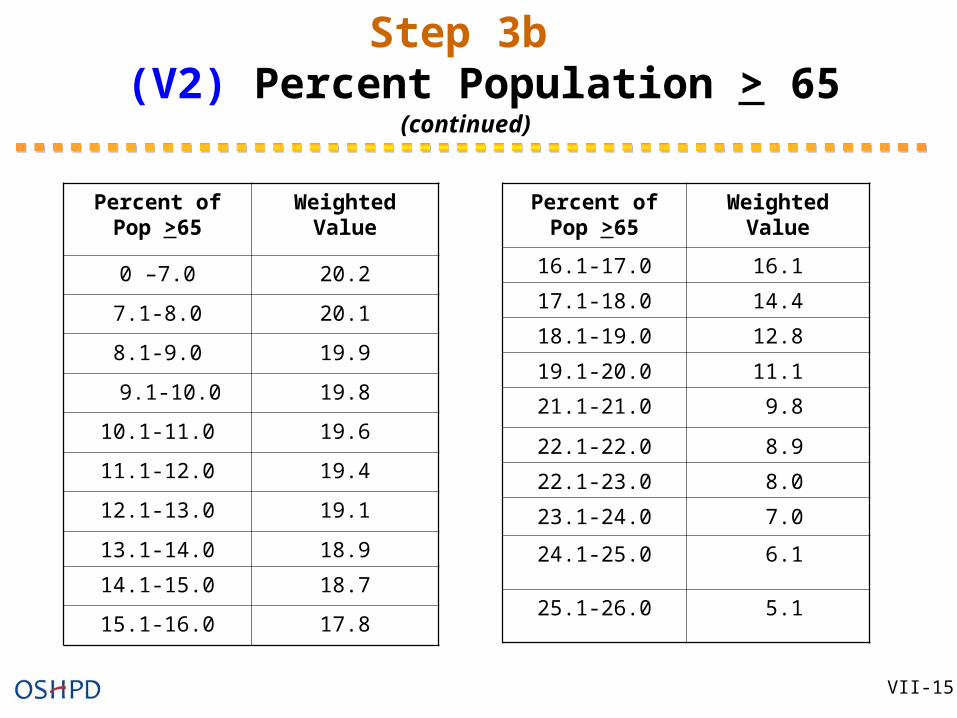
Step 3b (V2) Percent Population > 65
Percent of Pop >65
Weighted Value
0 –7.0 20.2
7.1-8.0 20.1
8.1-9.0 19.9
9.1-10.0 19.8
10.1-11.0 19.6
11.1-12.0 19.4
12.1-13.0 19.1
13.1-14.0 18.9
14.1-15.0 18.7
15.1-16.0 17.8
Percent of Pop >65
Weighted Value
16.1-17.0 16.1
17.1-18.0 14.4
18.1-19.0 12.8
19.1-20.0 11.1
21.1-21.0 9.8
22.1-22.0 8.9
22.1-23.0 8.0
23.1-24.0 7.0
24.1-25.0 6.1
25.1-26.0 5.1
VII-15
(continued)
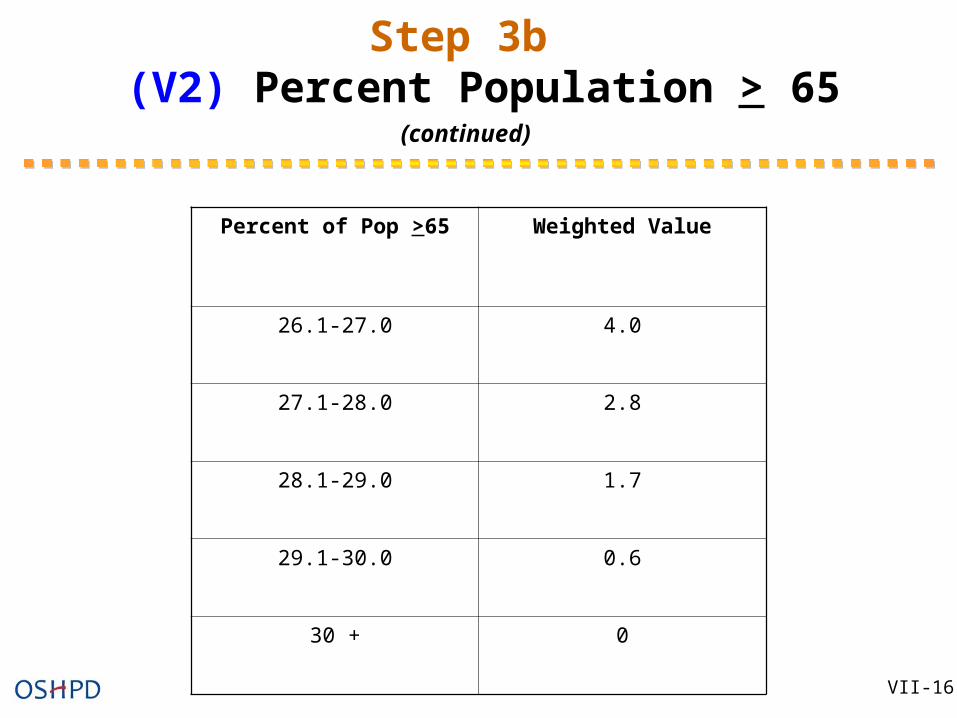
Step 3b (V2) Percent Population > 65
Percent of Pop >65 Weighted Value
26.1-27.0 4.0
27.1-28.0 2.8
28.1-29.0 1.7
29.1-30.0 0.6
30 + 0
VII-16
(continued)
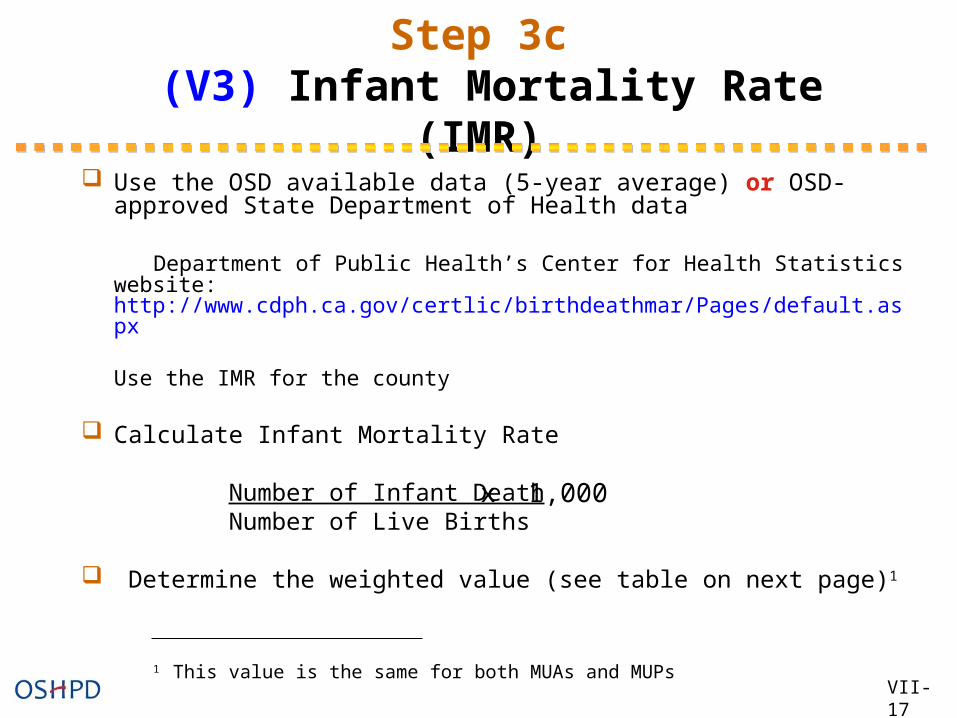
Step 3c (V3) Infant Mortality Rate (IMR)
Use the OSD available data (5-year average) or OSD-approved State Department of Health data
Department of Public Health’s Center for Health Statistics website: http://www.cdph.ca.gov/certlic/birthdeathmar/Pages/default.aspx
Use the IMR for the county
Calculate Infant Mortality Rate
Number of Infant Death Number of Live Births
Determine the weighted value (see table on next page)1
1 This value is the same for both MUAs and MUPsVII-17
x 1,000
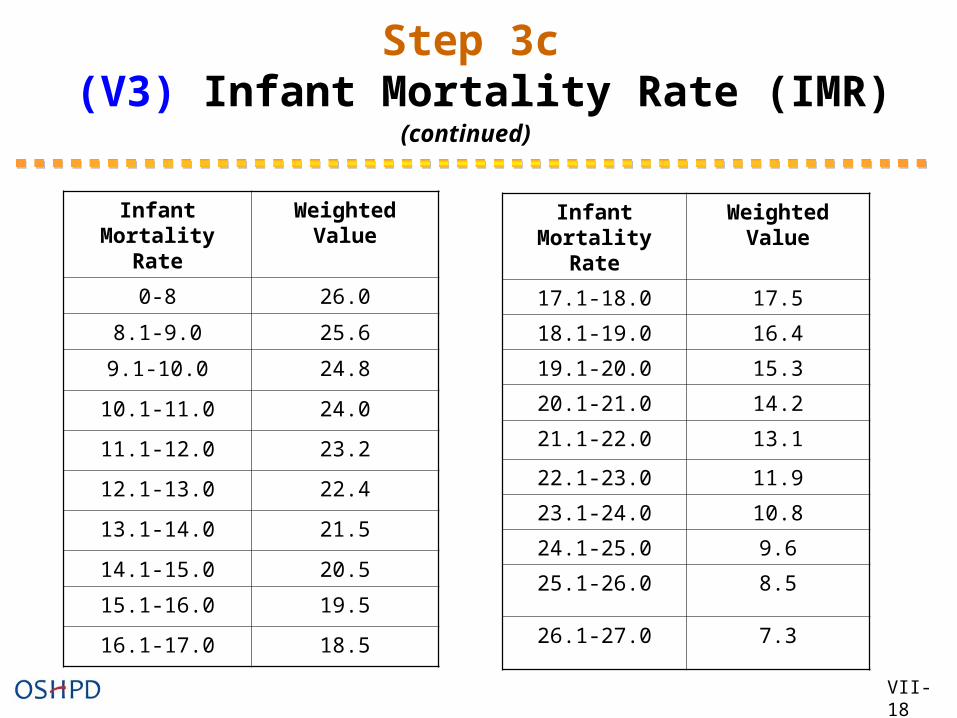
Step 3c (V3) Infant Mortality Rate (IMR)
Infant Mortality Rate
Weighted Value
0-8 26.0
8.1-9.0 25.6
9.1-10.0 24.8
10.1-11.0 24.0
11.1-12.0 23.2
12.1-13.0 22.4
13.1-14.0 21.5
14.1-15.0 20.5
15.1-16.0 19.5
16.1-17.0 18.5
Infant Mortality Rate
Weighted Value
17.1-18.0 17.5
18.1-19.0 16.4
19.1-20.0 15.3
20.1-21.0 14.2
21.1-22.0 13.1
22.1-23.0 11.9
23.1-24.0 10.8
24.1-25.0 9.6
25.1-26.0 8.5
26.1-27.0 7.3
VII-18
(continued)
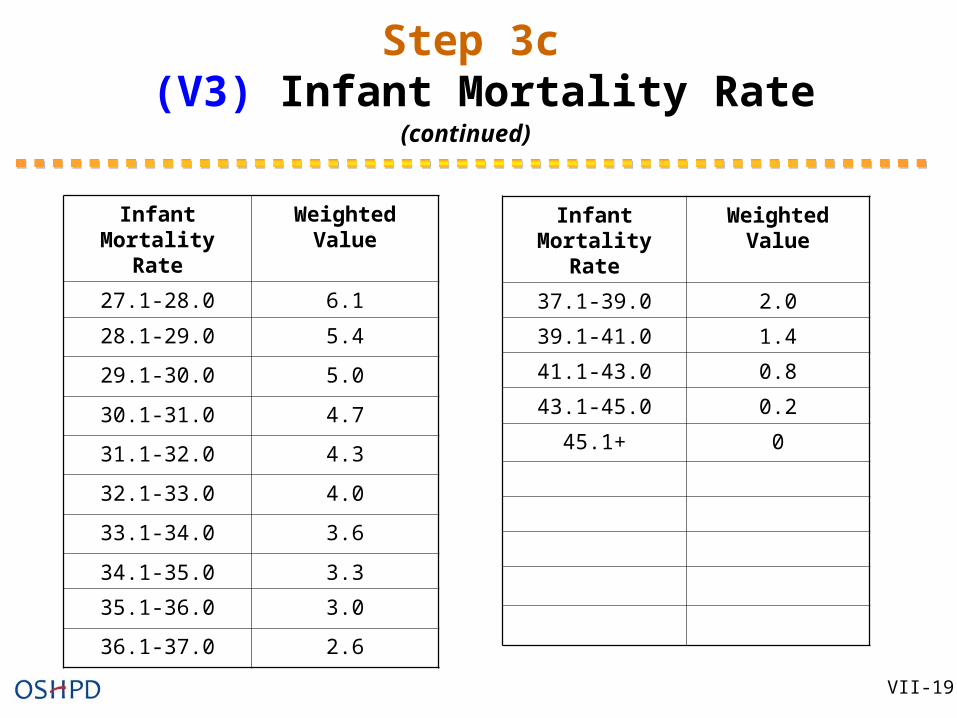
Step 3c (V3) Infant Mortality Rate
Infant Mortality Rate
Weighted Value
27.1-28.0 6.1
28.1-29.0 5.4
29.1-30.0 5.0
30.1-31.0 4.7
31.1-32.0 4.3
32.1-33.0 4.0
33.1-34.0 3.6
34.1-35.0 3.3
35.1-36.0 3.0
36.1-37.0 2.6
Infant Mortality Rate
Weighted Value
37.1-39.0 2.0
39.1-41.0 1.4
41.1-43.0 0.8
43.1-45.0 0.2
45.1+ 0
VII-19
(continued)
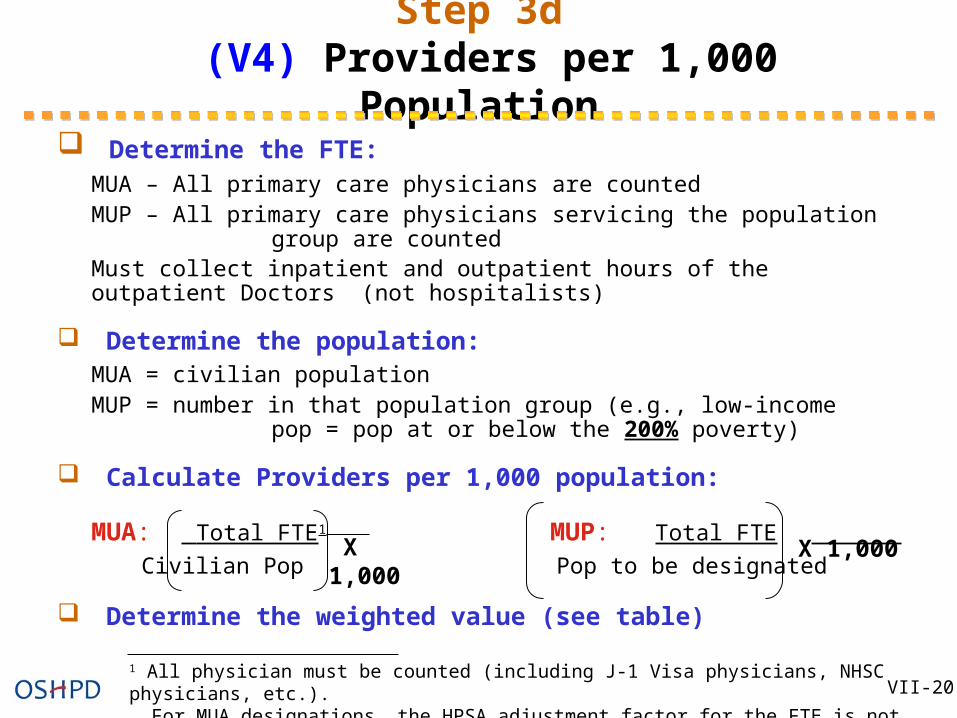
Step 3d (V4) Providers per 1,000 Population
Determine the FTE:MUA – All primary care physicians are countedMUP – All primary care physicians servicing the population
group are countedMust collect inpatient and outpatient hours of the outpatient Doctors (not hospitalists)
Determine the population:MUA = civilian populationMUP = number in that population group (e.g., low-income
pop = pop at or below the 200% poverty)
Calculate Providers per 1,000 population: MUA: Total FTE1 MUP: Total FTE
Civilian Pop Pop to be designated
Determine the weighted value (see table)1 All physician must be counted (including J-1 Visa physicians, NHSC physicians, etc.). For MUA designations, the HPSA adjustment factor for the FTE is not used. VII-20
X 1,000 X 1,000
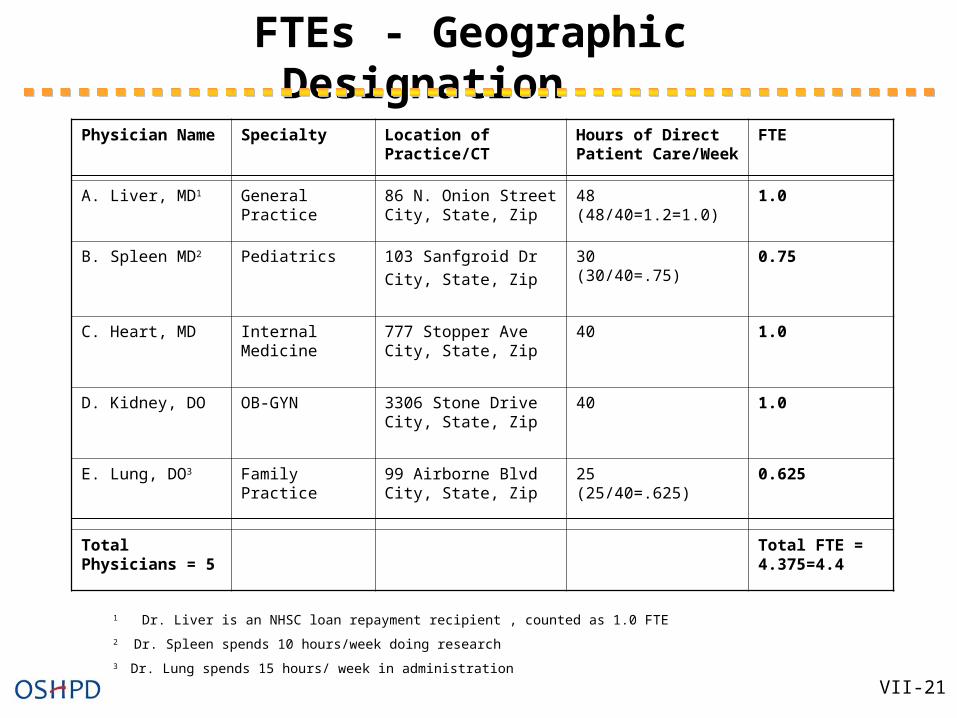
FTEs - Geographic Designation
1 Dr. Liver is an NHSC loan repayment recipient , counted as 1.0 FTE
2 Dr. Spleen spends 10 hours/week doing research
3 Dr. Lung spends 15 hours/ week in administration
Physician Name Specialty Location of Practice/CT
Hours of Direct Patient Care/Week
FTE
A. Liver, MD1 General Practice 86 N. Onion StreetCity, State, Zip
48(48/40=1.2=1.0)
1.0
B. Spleen MD2 Pediatrics 103 Sanfgroid Dr
City, State, Zip
30(30/40=.75)
0.75
C. Heart, MD Internal Medicine 777 Stopper AveCity, State, Zip
40 1.0
D. Kidney, DO OB-GYN 3306 Stone DriveCity, State, Zip
40 1.0
E. Lung, DO3 Family Practice 99 Airborne BlvdCity, State, Zip
25(25/40=.625)
0.625
Total Physicians = 5
Total FTE = 4.375=4.4
VII-21
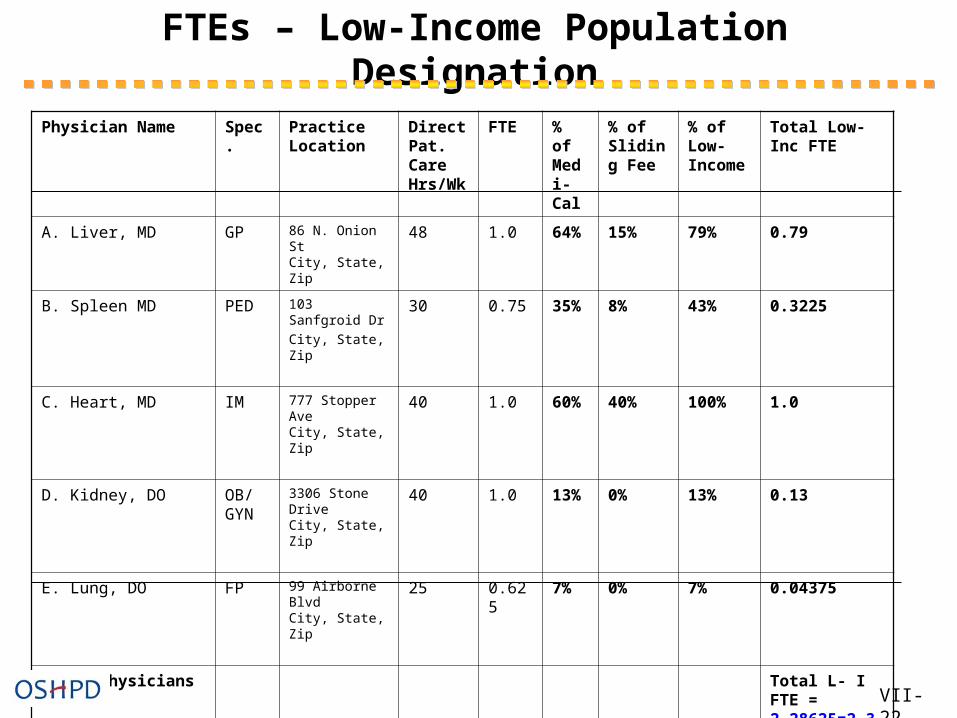
FTEs – Low-Income Population Designation
Physician Name Spec. Practice Location
Direct Pat. Care Hrs/Wk
FTE % of Medi-Cal
% of Sliding Fee
% of Low-Income
Total Low-Inc FTE
A. Liver, MD GP 86 N. Onion StCity, State, Zip
48 1.0 64% 15% 79% 0.79
B. Spleen MD PED 103 Sanfgroid Dr
City, State, Zip30 0.75 35% 8% 43% 0.3225
C. Heart, MD IM 777 Stopper AveCity, State, Zip
40 1.0 60% 40% 100% 1.0
D. Kidney, DO OB/ GYN
3306 Stone DriveCity, State, Zip
40 1.0 13% 0% 13% 0.13
E. Lung, DO FP 99 Airborne BlvdCity, State, Zip
25 0.625 7% 0% 7% 0.04375
Total Physicians = 5 Total L- I FTE = 2.28625=2.3
VII-22
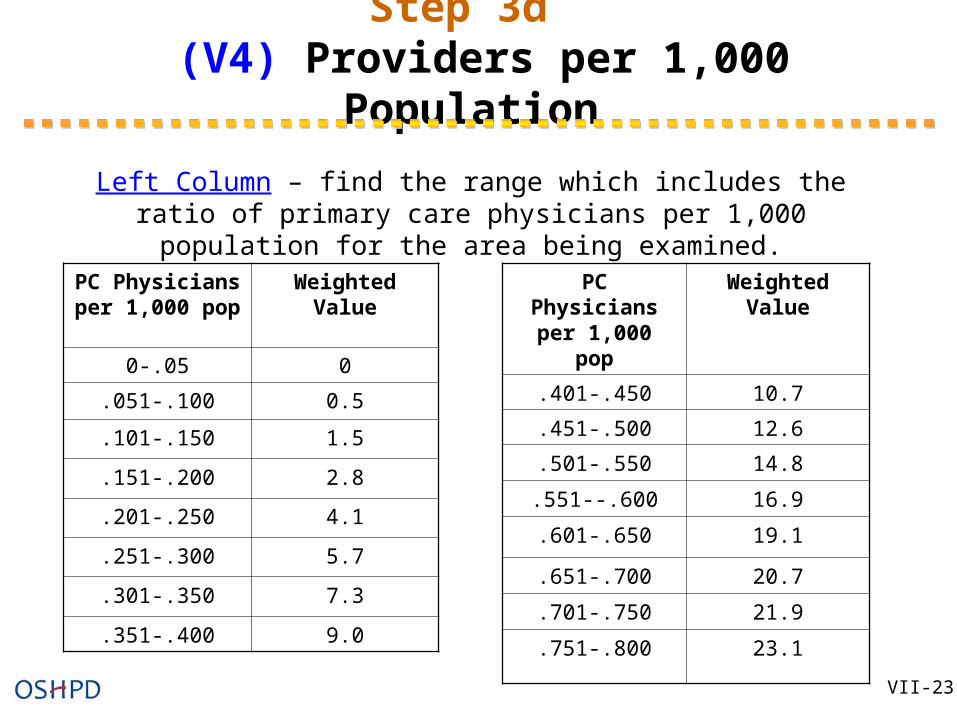
Step 3d (V4) Providers per 1,000 Population
PC Physicians per 1,000 pop
Weighted Value
0-.05 0
.051-.100 0.5
.101-.150 1.5
.151-.200 2.8
.201-.250 4.1
.251-.300 5.7
.301-.350 7.3
.351-.400 9.0
PC Physicians per 1,000 pop
Weighted Value
.401-.450 10.7
.451-.500 12.6
.501-.550 14.8
.551--.600 16.9
.601-.650 19.1
.651-.700 20.7
.701-.750 21.9
.751-.800 23.1
Left Column – find the range which includes the ratio of primary care physicians per 1,000 population for the area being examined.
VII-23
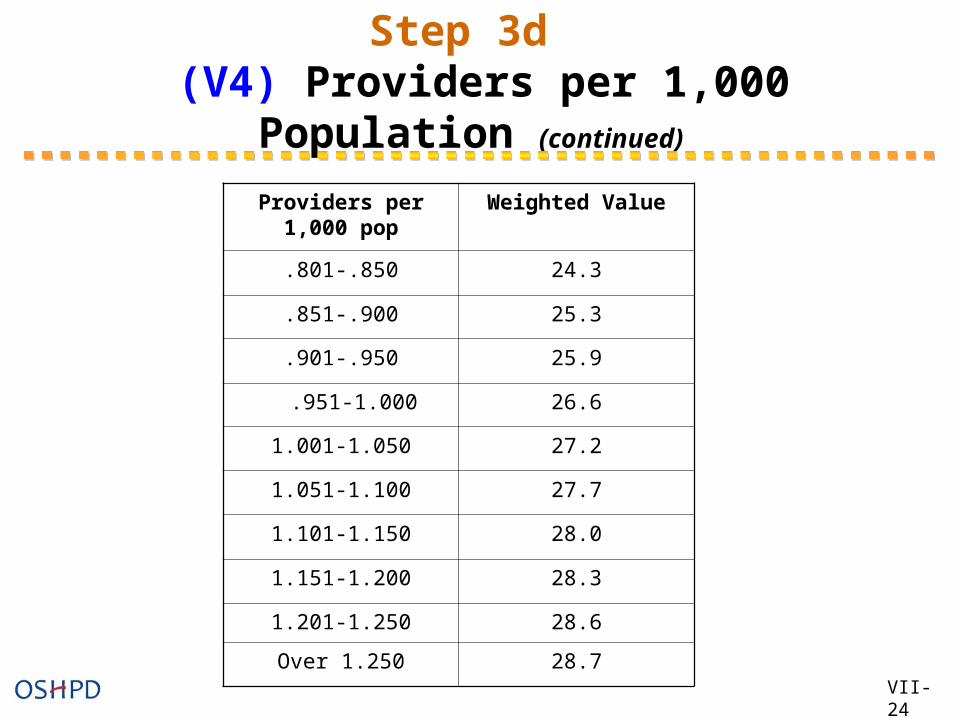
Step 3d (V4) Providers per 1,000 Population
(continued)
Providers per 1,000 pop
Weighted Value
.801-.850 24.3
.851-.900 25.3
.901-.950 25.9
.951-1.000 26.6
1.001-1.050 27.2
1.051-1.100 27.7
1.101-1.150 28.0
1.151-1.200 28.3
1.201-1.250 28.6
Over 1.250 28.7VII-24
STEP 4
Compute the Index of Medical Underservice Compute the Index of Medical Underservice Score (IMU).Score (IMU).
VII-25
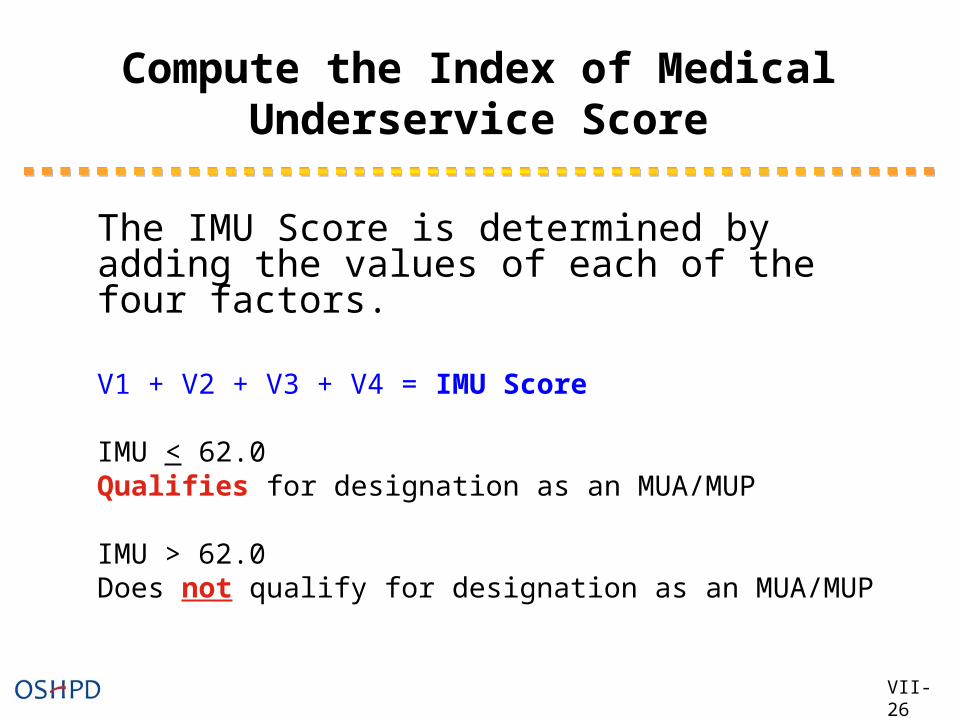
Compute the Index of Medical Underservice Score
The IMU Score is determined by adding the values of each of the four factors.
V1 + V2 + V3 + V4 = IMU Score
IMU < 62.0 Qualifies for designation as an MUA/MUP
IMU > 62.0Does not qualify for designation as an
MUA/MUP
VII-26
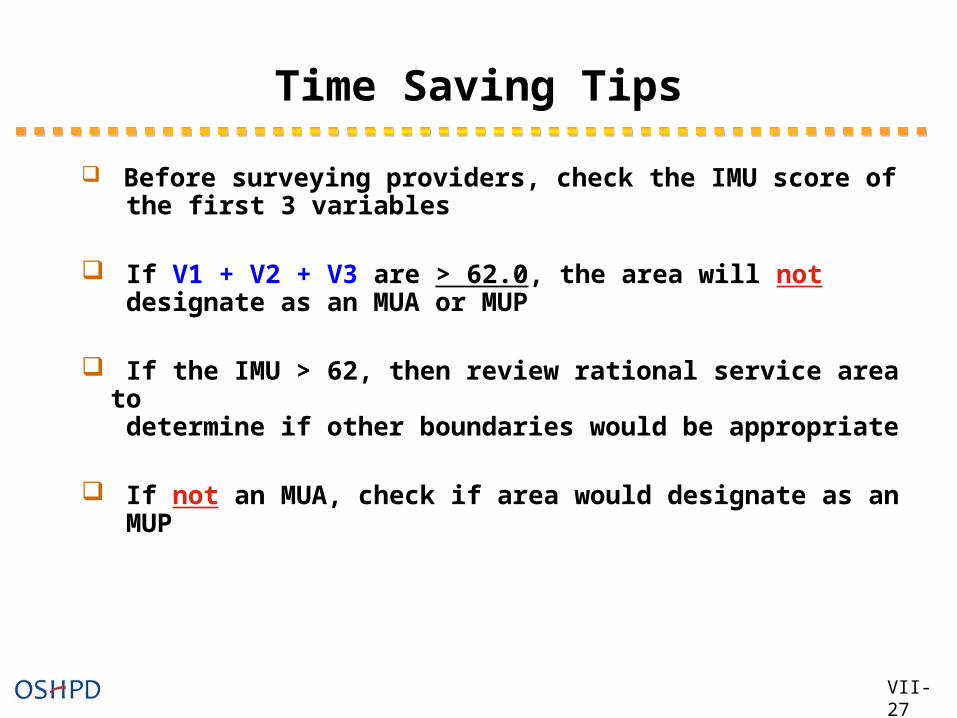
Time Saving Tips
Before surveying providers, check the IMU score of the first 3 variables
If V1 + V2 + V3 are > 62.0, the area will not designate as an MUA or MUP
If the IMU > 62, then review rational service area to determine if other boundaries would be appropriate
If not an MUA, check if area would designate as an MUP
VII-27
MUA/MUP Exercise
(Example)
VII-28
VII-29
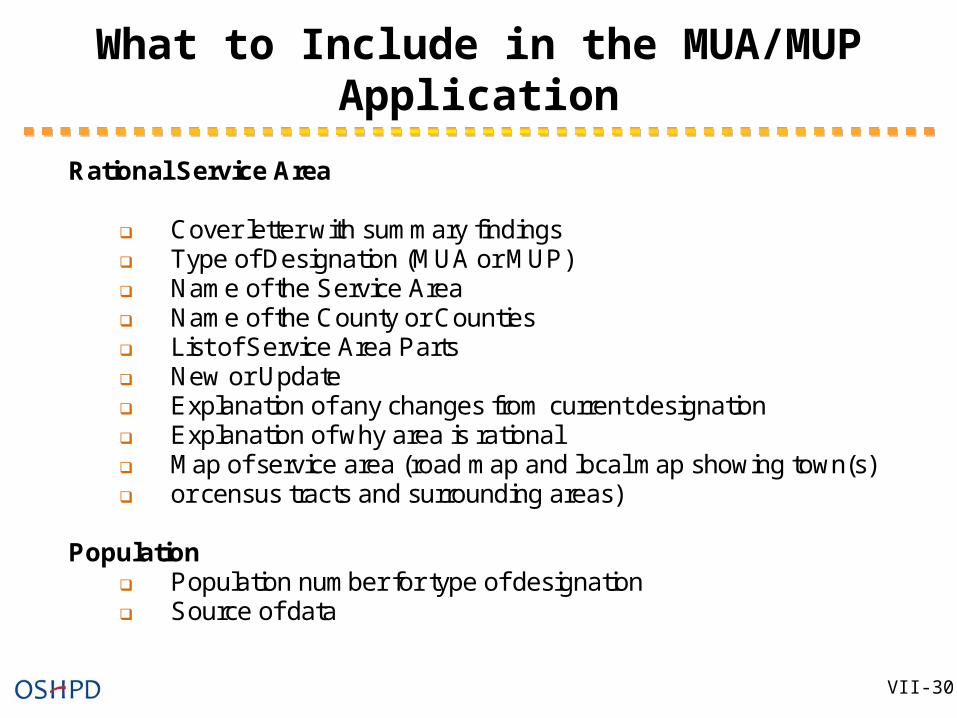
Rational Service Area
Cover letter with summary findings Type of Designation (MUA or MUP) Name of the Service Area Name of the County or Counties List of Service Area Parts New or Update Explanation of any changes from current designation Explanation of why area is rational Map of service area (road map and local map showing town(s) or census tracts and surrounding areas)
Population
Population number for type of designation Source of data
What to Include in the MUA/MUP Application
VII-30
What to Include in the MUA/MUP Application (continued)
VII-31
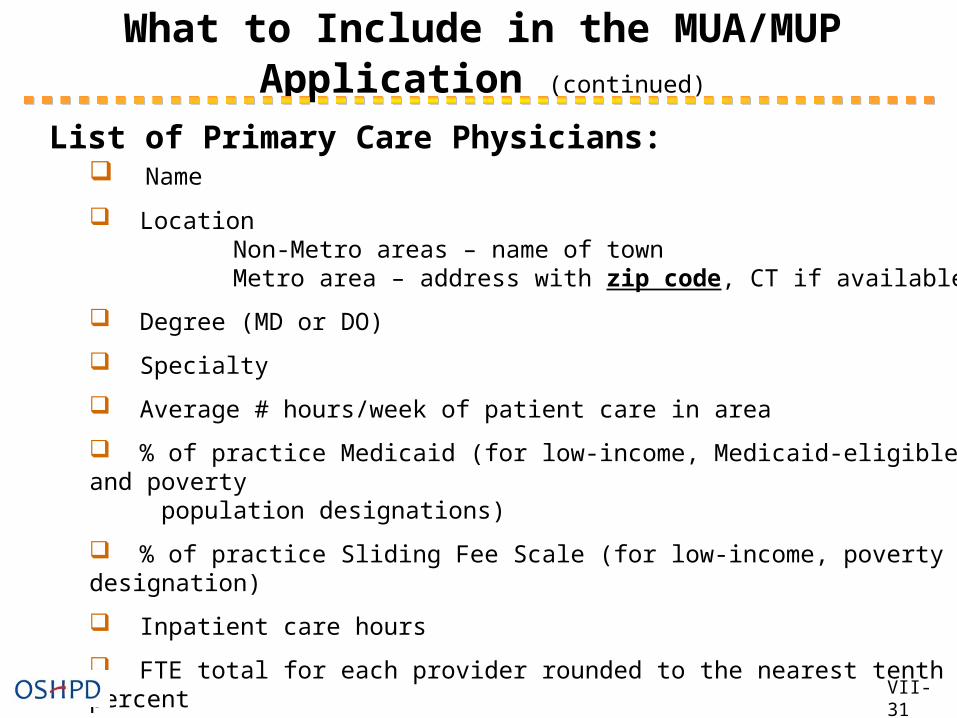
List of Primary Care Physicians: Name
Location Non-Metro areas – name of town Metro area – address with zip code, CT if available
Degree (MD or DO)
Specialty
Average # hours/week of patient care in area
% of practice Medicaid (for low-income, Medicaid-eligible, and poverty population designations)
% of practice Sliding Fee Scale (for low-income, poverty pop designation)
Inpatient care hours
FTE total for each provider rounded to the nearest tenth of a percent
Description of how information obtained (source, method)
What to Include in the MUA/MUP Application (continued)
VII-32
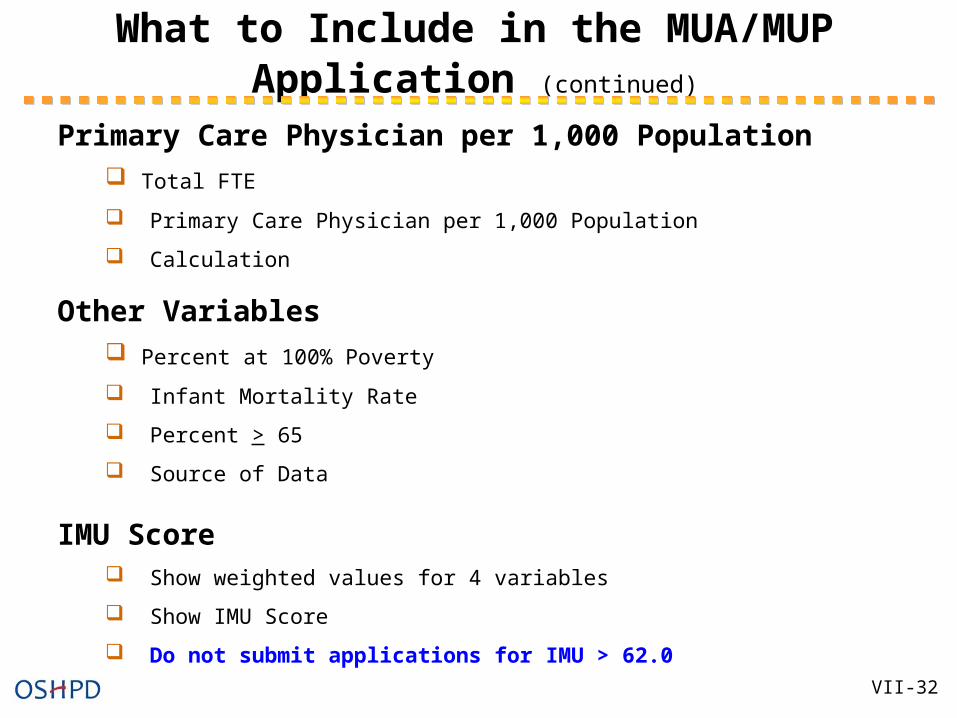
Primary Care Physician per 1,000 Population Total FTE
Primary Care Physician per 1,000 Population
Calculation
Other Variables Percent at 100% Poverty
Infant Mortality Rate
Percent > 65
Source of Data
IMU Score Show weighted values for 4 variables
Show IMU Score
Do not submit applications for IMU > 62.0
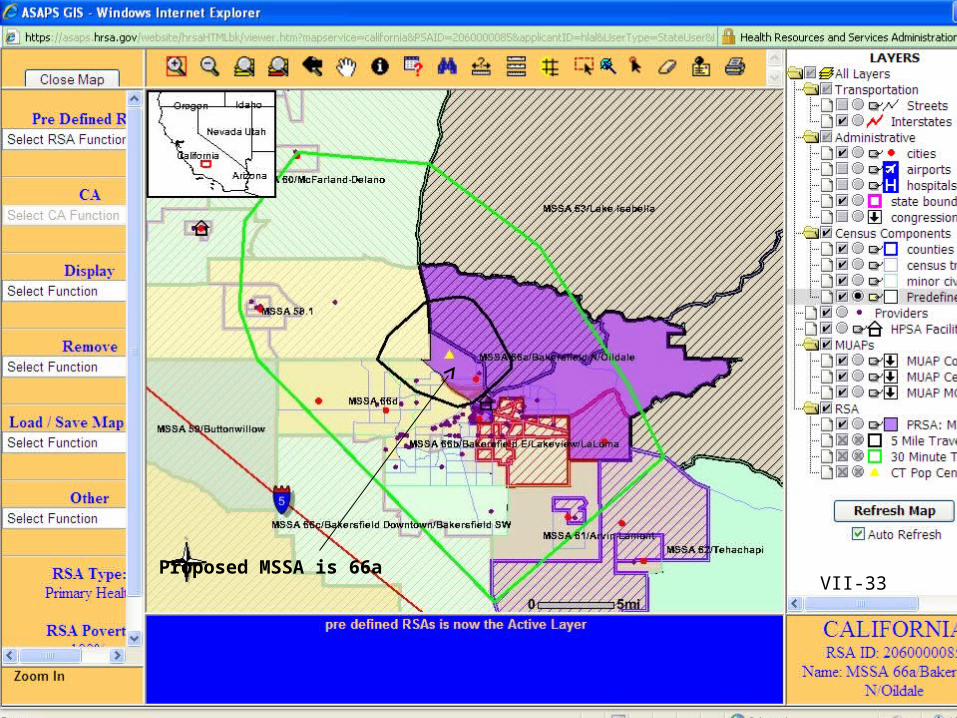
VII-33Proposed MSSA is 66a
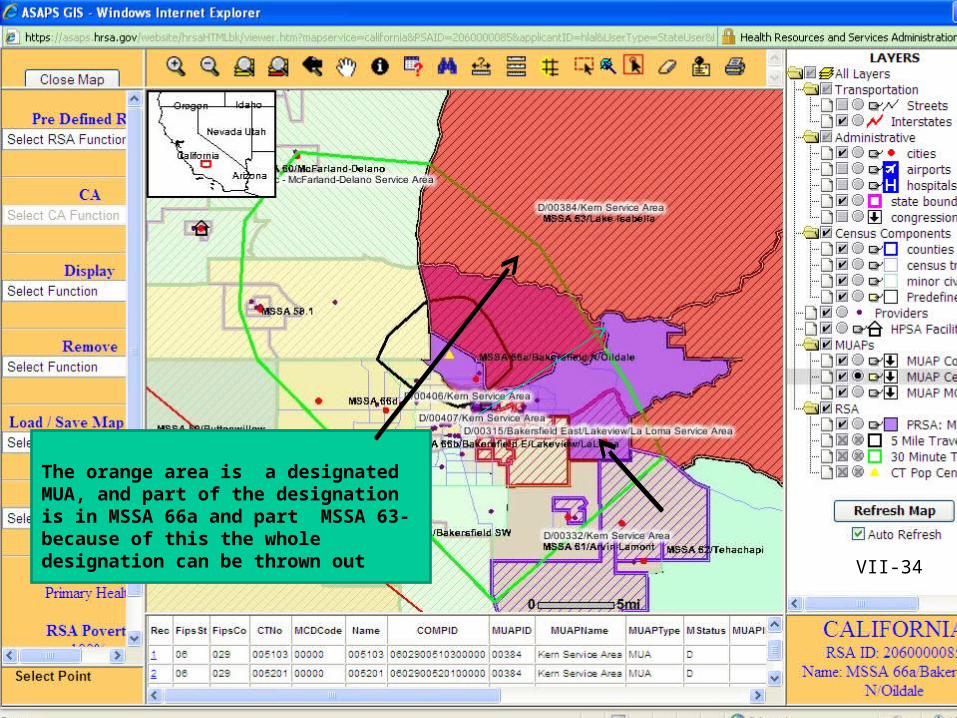
The orange area is a designated MUA, and part of the designation is in MSSA 66a and part MSSA 63- because of this the whole designation can be thrown out
VII-34
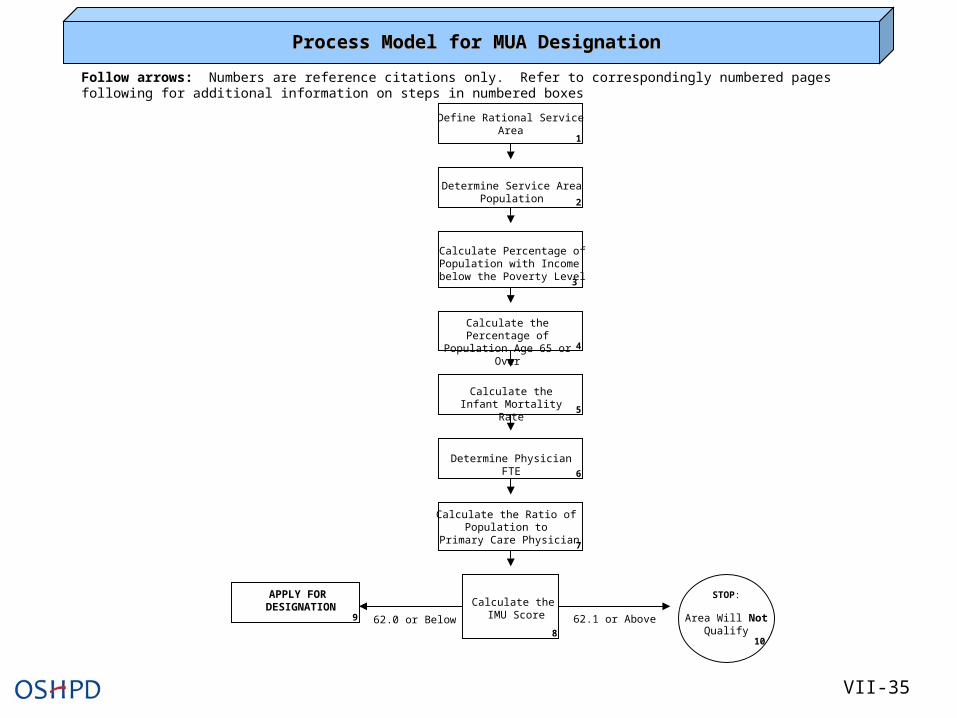
Calculate the IMU Score
Calculate the Ratio of Population to
Primary Care Physician
STOP:
Area Will NotQualify
Calculate the Percentage of Population Age 65 or Over
Define Rational ServiceArea
Calculate Percentage ofPopulation with Income below the Poverty Level
Determine Service AreaPopulation
Process Model for MUA DesignationProcess Model for MUA Designation
Follow arrows: Numbers are reference citations only. Refer to correspondingly numbered pages following for additional information on steps in numbered boxes
2
3
4
1
8
Calculate the Infant Mortality Rate
5
Determine Physician FTE6
7
10
62.1 or Above
APPLY FOR DESIGNATION
9 62.0 or Below
VII-35
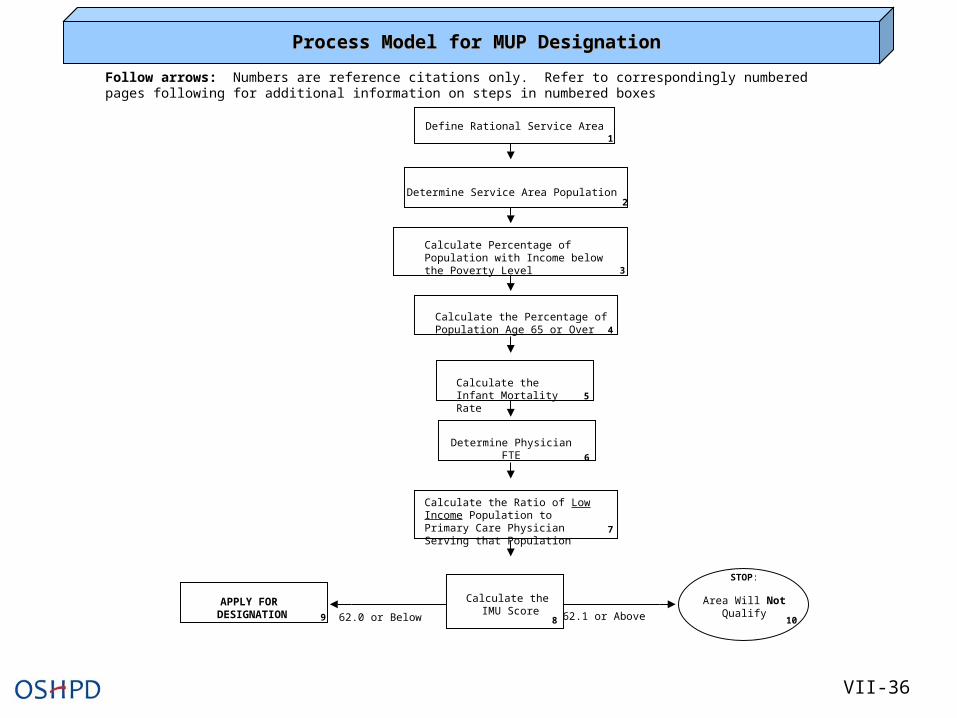
Calculate the IMU Score
Calculate the Ratio of LowIncome Population to Primary Care Physician Serving that Population
STOP:
Area Will NotQualify
Calculate the Percentage of Population Age 65 or Over
Define Rational Service Area
Calculate Percentage of Population with Income below the Poverty Level
Determine Service Area Population
Process Model for MUP DesignationProcess Model for MUP Designation
Follow arrows: Numbers are reference citations only. Refer to correspondingly numbered pages following for additional information on steps in numbered boxes
2
3
4
1
8
Calculate the Infant Mortality Rate 5
Determine Physician FTE6
7
1062.1 or AboveAPPLY FOR
DESIGNATION 9 62.0 or Below
VII-36