VII FINANCIAL INCLUSION
55
FINANCIAL INCLUSION VII 7.1 Access to safe, easy and affordable credit and other financial services by the poor and vulnerable groups, disadvantaged areas and lagging sectors is recognised as a pre-condition for accelerating growth and reducing income disparities and poverty. Access to a well-functioning financial system, by creating equal opportunities, enables economically and socially excluded people to integrate better into the economy and actively contribute to development and protect themselves against economic shocks. Despite the broad international consensus regarding the importance of access to finance as a crucial poverty alleviation tool 1 , it is estimated that globally over two billion people are currently excluded from access to financial services (United Nations, 2006a). In most developing countries, a large segment of society, particularly low-income people, has very little access to financial services, both formal and semi-formal. As a consequence, many of them have to necessarily depend either on their own or informal sources of finance and generally at an unreasonably high cost. The situation is worse in most least developed countries (LDCs), where more than 90 per cent of the population is excluded from access to the formal financial system (United Nations, 2006a). 7.2 Theories of development advocate that financial development creates enabling conditions for growth through either a ‘supply-leading’ (financial development spurs growth) or a ‘demand-following’ (growth generates demand for financial products) channel. Earlier theories of development hypothesised that a rise in inequality was inevitable in the early stages of development. The early literature on the subject focussed on the need to develop an extensive financial system that could tap savings and then channel the funds so generated to a wide spectrum of activities. The modern development theory perceives the lack of access to finance as a critical factor responsible for persistent income inequality as well as slower growth. A large body of empirical literature suggests that developing the financial sector and improving access to finance may accelerate economic growth along with a reduction in income inequality and poverty. Without an inclusive financial system, poor individuals and small enterprises have to rely on their own limited savings and earnings to invest in their education and entrepreneurship to take advantage of growth opportunities (World Bank, 2008). 7.3 In an underdeveloped financial system, certain segments of the population experience difficulties in obtaining appropriate access to financial services. As a result, they have to resort to high cost informal sources such as moneylenders. This is particularly true for the sporadic financing requirements of low income households for non- productive consumption purposes and other emergency requirements such as medical expenditure. Benefits of growth, therefore, tend to concentrate in the hands of those already served by the formal financial system. In mature financial systems on the other hand, financial institutions develop appraisal techniques and information gathering and sharing mechanisms, which then enable them to finance even those activities or firms or individuals that are at the margin, thereby promoting their growth-inducing productive activities. However, developed financial systems also encounter difficulties in serving low income groups for financing their consumption and other needs. The availability of external finance to potential entrepreneurs and small firms enables new entrants leading to increased competition to incumbents. This, in turn, encourages entrepreneurship and productivity. 7.4 Inclusive finance, including safe savings, appropriately designed loans for poor and low-income households and for micro, small and medium-sized enterprises, and appropriate insurance and payments services can help people to enhance incomes, acquire capital, manage risk, and come out of poverty (United Nations, 2006b). It has been well recognised that access to financial services facilitates making and receiving financial payments and reduces transaction costs. Furthermore, access to financial services 1 The critical importance of micro-finance in achieving the Millennium Development Goals was highlighted at the World Summit, 2005, as well as in the endorsement by the Summit for the Monterrey Consensus of the International Conference on Financing for Development. The final declaration of the Monterrey Consensus put particular emphasis on strengthening domestic financial sectors to include underserved segments, such as rural areas and women.
Transcript of VII FINANCIAL INCLUSION

FINANCIAL INCLUSIONVII
7.1 Access to safe, easy and affordable credit andother financial services by the poor and vulnerablegroups, disadvantaged areas and lagging sectors isrecognised as a pre-condition for accelerating growthand reducing income disparities and poverty. Accessto a well-functioning financial system, by creatingequal oppor tunities, enables economically andsocially excluded people to integrate better into theeconomy and actively contribute to development andprotect themselves against economic shocks. Despitethe broad international consensus regarding theimportance of access to finance as a crucial povertyalleviation tool1 , it is estimated that globally over twobillion people are currently excluded from access tofinancial services (United Nations, 2006a). In mostdeveloping countries, a large segment of society,particularly low-income people, has very little accessto financial services, both formal and semi-formal. Asa consequence, many of them have to necessarilydepend either on their own or informal sources offinance and generally at an unreasonably high cost.The situation is worse in most least developedcountries (LDCs), where more than 90 per cent ofthe population is excluded from access to the formalfinancial system (United Nations, 2006a).
7.2 Theories of development advocate thatfinancial development creates enabling conditions forgrowth through either a ‘supply-leading’ (financialdevelopment spurs growth) or a ‘demand-following’(growth generates demand for financial products)channel. Earlier theories of development hypothesisedthat a rise in inequality was inevitable in the earlystages of development. The early literature on thesubject focussed on the need to develop an extensivefinancial system that could tap savings and thenchannel the funds so generated to a wide spectrumof activit ies. The modern development theoryperceives the lack of access to finance as a criticalfactor responsible for persistent income inequality aswell as slower growth. A large body of empiricalliterature suggests that developing the financial sectorand improving access to finance may accelerate
economic growth along with a reduction in incomeinequality and poverty. Without an inclusive financialsystem, poor individuals and small enterprises have torely on their own limited savings and earnings to investin their education and entrepreneurship to takeadvantage of growth opportunities (World Bank, 2008).
7.3 In an underdeveloped financial system,cer tain segments of the population experiencedifficulties in obtaining appropriate access to financialservices. As a result, they have to resort to high costinformal sources such as moneylenders. This ispar t icular ly true for the sporadic f inancingrequirements of low income households for non-productive consumption purposes and otheremergency requirements such as medicalexpenditure. Benefits of growth, therefore, tend toconcentrate in the hands of those already served bythe formal financial system. In mature financialsystems on the other hand, financial institutionsdevelop appraisal techniques and informationgathering and sharing mechanisms, which thenenable them to finance even those activities or firmsor individuals that are at the margin, therebypromoting their growth-inducing productive activities.However, developed financial systems also encounterdifficulties in serving low income groups for financingtheir consumption and other needs. The availabilityof external finance to potential entrepreneurs andsmall firms enables new entrants leading to increasedcompetition to incumbents. This, in turn, encouragesentrepreneurship and productivity.
7.4 Inclusive finance, including safe savings,appropriately designed loans for poor and low-incomehouseholds and for micro, small and medium-sizedenterprises, and appropriate insurance and paymentsservices can help people to enhance incomes, acquirecapital, manage risk, and come out of poverty (UnitedNations, 2006b). It has been well recognised thataccess to financial services facilitates making andreceiving financial payments and reduces transactioncosts. Furthermore, access to financial services
1 The critical importance of micro-finance in achieving the Millennium Development Goals was highlighted at the World Summit, 2005, as wellas in the endorsement by the Summit for the Monterrey Consensus of the International Conference on Financing for Development. The finaldeclaration of the Monterrey Consensus put particular emphasis on strengthening domestic financial sectors to include underserved segments,such as rural areas and women.

contributes to higher production and social protection,as the financial sector – through stored savings, creditand insurance – serves as a measure of crisismitigation. Broader access to financial services has,however, attracted less attention despite the emphasisit has received in the theory.
7.5 In India, growth with equity has been thecentral objective right from the inception of theplanning process. Accordingly, over the years,initiatives have been taken continuously by theGovernment and the Reserve Bank to address theissue of inclusive growth. Notwithstanding the rapidincrease in overall GDP and per capita income inrecent years, a significant proportion of the populationin both rural and urban areas still experiencesdifficulties in accessing the formal financial system.Recent concerns have arisen from an inadequatereduction in poverty levels, sectoral divergences ingrowth and employment opportunities and tardyimprovement in other social indicators, despite highereconomic growth. The Eleventh Five Year Plan,therefore, re-emphasised the need for a moreinclusive growth in order to ensure that the per capitaincome growth is more broad-based. The farming,micro, small and medium enterprises have immensepotential to play a critical role in achieving theobjective of faster and more inclusive growth as thesesectors contr ibute to output and employmentgeneration in a significant way with capacity to expandregionally diversified production and generating widelydispersed off-farm employment.
7.6 Bringing the larger population within thestructured and organised financial system hasexplicitly been on the agenda of the Reserve Banksince 2005 (Mohan, 2006). While several centralbanks focus solely on inflation, many in developedand emerging economies alike, including India, alsofocus on growth. There is currently a perception thatthere are a large number of people, potentialentrepreneurs, small enterprises and others, who maynot have adequate access to the financial sector,which could lead to their marginalisation and denialof opportunity to grow and prosper. The Reserve Bankhas, therefore, introduced various new measures toencourage the expansion of financial coverage in thecountry. Financial inclusion is considered essential forfostering economic growth in a more inclusive fashion.
7.7 In a fast growing economy, an important issueis how to sustain and diversify growth so that the riskto growth process is diversified across sectors. It isin this context that the search for potential sources ofincremental growth, i.e., sectors that have difficulty
in accessing financial services, assumes importance.Therefore, including such segments or sectors would,on the one hand, unleash their productive capacities,and on the other, would augment domestic demandon a sustainable basis dr iven by income andconsumption growth from such sectors. This wouldalso have strong inter-sectoral linkages.
7.8 Against the above backdrop, this chapter,drawing upon the theoretical developments, countryexperiences and empirical findings, seeks to examinekey issues in financial inclusion/exclusion in India.Section II discusses the conceptual framework andmeasurement related issues. The nature, causes andconsequences of financial exclusion are discussedin Section III. Section IV details the policy initiativesundertaken for promoting financial inclusion in India.Section V analyses the nature and extent of financialinclusion/exclusion in India. Operating cost offinancial inclusion and the role of technology infinancial inclusion are discussed in Section VI.Drawing from country experiences and empiricalanalysis in the Indian context, Section VII, as a wayforward, makes some suggestions to promotefinancial inclusion in India. Section VIII concludesthe chapter.
II. ACCESS TO FINANCE: CONCEPTUALFRAMEWORK
Concept and Definition
7.9 Defining financial inclusion is consideredcrucial from the viewpoint of developing a conceptualframework and identifying the underlying factors thatlead to low level of access to the financial system. Areview of l i terature suggests that there is nouniversally accepted definition of financial inclusion.As measuring inclusion is perceived to be difficult,financial inclusion is generally defined in terms ofexclusion from the financial system. Early discussionon financial exclusion was preceded by socialexclusion and focussed predominantly on the issueof geographical access to financial services, inparticular banking outlets (Leyshon and Thrift, 1993).However, financial exclusion is not just about physicalaccess caused by the changing topography offinancial services. Therefore, the debate has nowbroadened to include all types of people who makelittle or no use of financial services and the processesof financial exclusion (Ford and Rowlingson, 1996;Kempson and Whyley, 1998).
7.10 The definit ional emphasis of f inancialinclusion varies across countries and geographies,
295
FINANCIAL INCLUSION

296
REPORT ON CURRENCY AND FINANCE
depending on the level of social, economic andfinancial development; the structure of stake holdingin the financial sector; socio-economic characteristicsof the financially excluded segments; and also theextent of the recognition of the problem by authoritiesor governments. Broadly, financial exclusion isconstrued as the inability to access necessaryfinancial services in an appropriate form due toproblems associated with access, conditions, prices,marketing or self-exclusion in response todiscouraging exper iences or perceptions ofindividuals/entities.
7.11 Definitions of financial exclusion in theliterature vary depending on the dimensions such as‘breadth’, ‘focus’ and ‘degree’ of exclusion. The‘breadth’ dimension is the broadest of all definitionslinking financial exclusion to social exclusion whichdefines financial exclusion as the processes thatprevent poor and disadvantaged social groups fromgaining access to the financial system (Leyshon andThrift, 1995). The ‘focus’ dimension is in the middle ofthe spectrum that links financial exclusion to otherdimensions of exclusion. It defines financial exclusionas the potential difficulties faced by some segmentsof population in accessing mainstream financialservices such as bank accounts/home insurance(Meadows et al ., 2004). The definitions layingemphasis on the ‘focus’ also vary significantly toinclude various segments of population such asindividuals, households, communit ies, andbusinesses. The ‘degree’ dimension, which is thenarrowest of all definitions of financial exclusion,defines financial exclusion as exclusion from particularsources of credit and other financial services includinginsurance, bill-payment services and accessible andappropriate deposit accounts (Rogaly, 1999). Finally,definitions of financial exclusion vary considerablyaccording to the dimensions such as the concept ofrelativity, i.e., financial exclusion defined relative tosome standard (i.e., inclusion). This line of thinkingdefines the problem of financial exclusion as thatemanating from increased inclusion, leaving aminority of individuals and households behind(Kempson et al., 2000). Thus, there exists duality ofhyper inclusion with some having access to a rangeof financial products and at the same time a minoritylacking even the basic banking services. Thisphenomenon is observed mostly in developedcountries with high degree of financial development.
7.12 Over the years, several definitions of financialinclusion/exclusion have evolved (Table 7.1). Theworking or operational definit ions of f inancial
exclusion generally focus on ownership or access toparticular financial products and services. The focusnarrows down mainly to the products and servicesprovided by the mainstream financial serviceproviders (Meadows et al., 2004). Such financialproducts may include money transmission, homeinsurance, short and long-term credit and savings(Bridgeman, 1999). Furthermore, the operationaldefinitions have also evolved from the underlyingpublic policy concerns that many people, particularlythose living on low income, cannot access mainstreamfinancial products such as bank accounts and low costloans, which, in turn, imposes real costs on them -often the most vulnerable people (H.M. Treasury,2004).
7.13 The review of literature suggests that the mostoperational definitions are context-specific, originatingfrom country-specific problems of financial exclusionand socio-economic conditions. Thus, the context-specific dimensions of financial exclusion assumeimportance from the public policy perspective.Furthermore, the definitions have witnessed a shiftin emphasis from the earlier ones, which definedfinancial inclusion and exclusion largely in terms ofphysical access, to a wider definition covering accessto and use and understanding of products andservices.
7.14 The operational definit ion of f inancialinclusion, based on the access to financial productsor services, also underscores the role of financialinstitutions or service providers involved in theprocess. The anatomy of various financial productsor services and the insti tut ional structure isschematically presented in Chart VII.1.
Measurement of Financial Inclusion/Exclusion
7.15 While the importance of financial inclusionhas been widely accepted, much less is known abouthow inclusive the financial systems are and who hasaccess to which financial services. The literature onfinancial inclusion lacks a comprehensive measurethat can be used to indicate the extent of financialinclusion across countries. Though indicators of thedepth of banking system, capital markets, andinsurance sector are widely available, there is lessinformation available about the degree of financialinclusiveness. Lack of information is moreconspicuous in developing countries where there islittle systematic information on who is served by theformal financial sector, which financial institutions orservices are the most effective at supporting accessby poor households and small enterprises, or what

297
FINANCIAL INCLUSION
practical and policy barriers may be hindering theaccessibility. Individual indicators, viz., number ofbank accounts and number of bank branches that aregenerally used as measures of financial inclusion, canprovide only partial information on the level of financialinclusion in an economy. Financial services orproducts rendered by banks, postal savings banks,credit unions, finance companies, micro-financeinstitutions (MFIs), and other formal and quasi-formalnon-bank institutions generally form the basis formeasuring the financial inclusion.
7.16 It is often observed that people may haveaccess to financial services, but may not wish to usethem. Such voluntarily excluded persons, it is argued,should be included in measures of access even if they
do not use financial services. However, even amongthe ‘voluntarily excluded’, this may in reality bebecause such services are unaffordable, unsuited totheir needs, or because the potential users fear thatthey will be declined upon request. Among the‘involuntarily excluded’ from services such as credit,some represent high credit risk that lenders arediscouraged to prudently serve them.
7.17 There are various measures of access tofinance. For instance, access to finance can bemeasured in terms of access to certain institutions(such as banks, insurance companies, and MFIs orin terms of access to the functions that suchinstitutions perform, or the services that they provide(such as payments services, savings or loans and
Table 7.1: Definitional Aspects of Financial Inclusion/Exclusion
Institution/Author Definition Indicators
1 2 3
ADB (2000)
Stephen P. Sinclair (2001)
Chant Link and Associates, Australia (2004)
Treasury Committee, House of Commons,UK (2004)
Scottish Government(2005)
United Nations (2006 b)
Report of the Committee on FinancialInclusion in India (Chairman: C.Rangarajan)(2008)
World Bank (2008)
Provision of a broad range of financial services such asdeposits, loans, payment services, money transfers andinsurance to poor and low-income households and theirmicro-enterprises.
Financial exclusion means the inability to access necessaryfinancial services in an appropriate form. Exclusion cancome about as a result of problems with access, conditions,prices, marketing or self-exclusion in response to negativeexperiences or perceptions.
Financial exclusion is lack of access by certain consumersto appropriate low cost, fair and safe financial products andservices from mainstream providers. Financial exclusionbecomes a concern in the community when it applies tolower income consumers and/or those in financial hardship.
Ability of individuals to access appropriate financial productsand services.
Access for individuals to appropriate financial products andservices. This includes having the capacity, skills, knowledgeand understanding to make the best use of those productsand services. Financial exclusion by contrast, is theconverse of this.
A financial sector that provides ‘access’ to credit for all‘bankable’ people and firms, to insurance for all insurablepeople and firms and to savings and payments servicesfor everyone. Inclusive finance does not require thateveryone who is eligible use each of the services, but theyshould be able to choose to use them if desired.
The process of ensuring access to financial services andtimely and adequate credit where needed by vulnerablegroups such as weaker sections and low income groups atan affordable cost.
Broad access to financial services implies an absence ofprice and non-price barriers in the use of financial services;it is difficult to define and measure because access hasmany dimensions.
Deposits, loans, payment services, moneytransfer and insurance.
Basic banking services for moneytransmission, credit, insurance, debt and debtassistance, long-term savings and financialliteracy.
Deposit accounts, direct investments, homeloans, credit cards, personal loans, buildinginsurance and home insurance.
Affordable credit and savings for all and accessto financial advice.
Access to products and services, and/orcapacity, skills, knowledge and understanding.
Access to credit, insurance, savings, paymentservices.
Access to financial services and timely andadequate credit.
Access to financial services such as deposit,credit, payments, insurance.

298
REPORT ON CURRENCY AND FINANCE
credits). Yet another approach is to look at details onthe uses of specific financial products such as debitcards, credit cards, l i fe insurance and homemortgages, among others. However, these are highlycountry-specific. The core access indicators oftenused are generally based on institutional distinctionsconcerning specifically the degree of formality of thefinancial institutions (World Bank, 2008).
7.18 Access covers a range of institutions from themore formal to less formal. At the one end of thespectrum are banks or near banks which are oftendefined as formal financial institutions which canprovide multiple financial services to their clients,including deposits, payments and credit services. Theattributes of banks and near banks are broadlycomparable across countries. Other formal financialservice providers are all other legal entities licensedto provide financial services. They are registered andsubject to some reporting requirements. Thus, in thecase of credit, this may include consumer financecompanies, credit card companies or credit unions.Informal providers of financial services are otherorganised providers of financial services that are notregistered as financial intermediaries and not subjectto any oversight. Moneylenders and cheque cashing
outlets, which are not regulated financial institutions,belong to this category. Based on the abovecharacteristics of the financial service providers, thefollowing measures/indicators can be summarised asthe basic indicators used to measure the extent/magnitude of financial exclusion in a country.
7.19 Core and headline indicators place a givenpopulation along a continuum of access, dependingon its usage of formal, semi-formal, and informalfinancial services, and those excluded from the useof financial services. The access to finance could bedivided into four segments (i) the proportion of thepopulation that uses a bank or bank like institution;(ii) the population which uses service from non-bank‘other formal’ financial institutions, but does not usebank services; (iii) the population which only usesservices from informal financial service providers; (iv)percentage of population transacting regularly throughformal financial instruments; and (v) the populationwhich uses no financial services.
7.20 The second group of core indicators looks ingreater detail at the kinds of financial services offered.This functional perspective enables a focus on specificservice needs and their gradation in order of priority

299
FINANCIAL INCLUSION
from less to more developed financial environment.These additional core indicators provide augmentedunderstanding of the nature and depth of financialservices. The financial service functions identified tobe used as the basis for indicators are: (i) transactionsor payment services; (ii) savings (deposit) andinvestment services; and (iii) loan or credit services.Risk transformation services such as insurance couldarguably be added. However, it is conceptually similarto a sophisticated savings and credit product.
7.21 To sum up, no universally accepted definitionof financial inclusion is available. Since measuringinclusion is perceived to be difficult, financial inclusionhas generally been defined in terms of exclusion fromthe financial system. The working or operationaldefinitions of financial exclusion generally focus onownership or access to particular financial productsand services.
7.22 There is no single comprehensive measurethat can be used to indicate the extent of financialinclusion across economies. Specific indicators suchas number of bank accounts, number of bankbranches, that are generally used as measures offinancial inclusion, can provide only partial informationon the level of financial inclusion in an economy.Another approach is to look at details on the uses ofspecific financial products such as debit cards, creditcards, life insurance, and home mortgages, but theseare highly country specific.
III. NATURE, CAUSES AND CONSEQUENCES OFFINANCIAL EXCLUSION
Nature and Causes
7.23 The nature and forms of exclusion and thefactors responsible for it are varied and, thus, no singlefactor could explain the phenomenon. The principalbarriers in the expansion of financial services areoften identified as physical access, high charges andpenalties, conditions attached to products which makethem inappropriate or complicated and perceptionsof financial service institutions which are thought tobe unwelcoming to low income people (Sinclair, 2001).These barriers to inclusion have not been constructeddeliberately; they are a result of the structuraloperation of the financial services industry. Kempsonet al. (2000) analyse a range of physical andgeographical barriers to financial inclusion and abroad range of other factors that can contribute tofinancial exclusion for different products andindividuals under certain circumstances. A numberof ‘dimensions’ or ‘forms’ of financial exclusion have
been identified. The critical dimensions of financialexclusion include: (i) access exclusion- restriction ofaccess through the process of risk management (byfinancial services providers); (ii) condition exclusion- conditions attached to financial products which makethem inappropriate for the needs of some segmentsof population; (iii) price exclusion- some people canonly gain access to financial products at prices theycannot afford; (iv) marketing exclusion - some peopleare effectively excluded by targeted marketing andsales; and (v) self-exclusion - people decide not toopt for a financial product because of the fear ofrefusal to access by the service providers (Kempsonand Whyley, 1999; Kempson et al., 2000; Connollyand Hajaj, 2001).
7.24 Measuring an individual’s or household’susage of a particular financial service at a given timemay not reveal whether exclusion is short-term or theresult of a long-term process, nor whether access isdiminishing or improving (Chant Link and Associates,2004). Thus, financial exclusion is perceived as anongoing process in terms of vulnerability to exclusion,rather than simply having access to certain financialservices or not. In particular, financial exclusion maybe a long-term phenomenon for many consumers oreven a life-long process (Connolly and Hajaj, 2001).For families with particular constellations of socio-economic characteristics, it may extend beyond thelifetime of an individual family member and becomeinter-generational. It has generally been recognisedthat it is the poorer sections of the population that donot have access to financial services - formal orinformal. However, in many countries, many non-poorindividuals, micro, small and medium entrepreneursalso have difficulty in accessing financial services. Themost conspicuous dimension is that many of the low-income segments of the population do not haveaccess to even the very basic financial services. Evenamongst those who have access to finance, most areunderserved in terms of quality and quantity ofproducts and services and significant proportion oflow-income households is dependent onunsustainable, subsidy-dependent and poor lyperforming institutions (Chart VII.2).
7.25 Exclusion may also have resulted from avariety of structural factors such as unavailability ofproducts suit ing their requirements, str ingentdocumentation and collateral requirements andincreased competition in financial services. There hasalso been particular emphasis on socio-culturalfactors that matter for an individual to access financialservices (United Nations, 2006b). Substantial

300
REPORT ON CURRENCY AND FINANCE
proportion of households, especially those with lowincome and those living in rural and remote areas, isat present outside the ambit of the formal financialsystem in many countries. Literature on financialinclusion/exclusion has identified a number of factorsthat affect efforts to expand access to financialservices (Box VII.1).
7.26 Apart from the supply side factors, demandside factors also have a significant bearing on theextent of financial inclusion. A higher share ofpopulation below the poverty line results in lowerdemand for financial services as the poor may nothave savings to place as deposit in savings banks.Thus, low income leads to low demand for financialservices, particularly savings products. Likewise, atlow levels of development, investment activity maybe low and hence, may lead to low demand for creditfrom banks and other formal financial institutions.However, as poverty levels decline and householdsmove into higher income brackets, their propensityto save increases, which, in turn, leads to higherdemand for financial services both for saving andinvestment purposes.
7.27 Financial inclusion is also influenced byspecific credit needs of various segments of thesociety. The demand for credit by the people arisesfor a number of activit ies such as housing,microenterpr ises, agr icultural operations andconsumption needs. Owing to difficulties in accessingformal sources of credit, the poor individuals and smalland microenterprises usually rely on their personalsavings or internal resources to invest in housing, healthand education, and entrepreneurial activities to makeuse of growth opportunities (World Bank, 2008).
7.28 In India, the financially excluded sectionscompr ise largely marginal farmers, landlesslabourers, oral lessees, self-employed andunorganised sector enterprises, urban slum dwellers,migrants, ethnic minorities and socially excludedgroups, senior citizens and women. Some of theimportant causes of relatively low extension ofinstitut ional credit in the rural areas are r iskperception, cost of its assessment and management,lack of rural infrastructure, and vast geographicalspread of the rural areas with more than half a millionvillages, some sparsely populated (Mohan, 2006).

301
FINANCIAL INCLUSION
Costs and Consequences of Financial Exclusion
7.29 Broadly, the issue of cost of financial exclusionmay be conceived from two angles, which are inter-twined. First, the exclusion may have cost forindividuals/entities in terms of loss of opportunitiesto grow in the absence of access to finance or credit.Second, from the societal or the national perspective,exclusion may lead to aggregate loss of output orwelfare and the country may not realise its growthpotential. The more tangible outcomes of financialexclusion include cost and secur ity issues inmanaging cash flow and payments, compromisedstandard of living resulting from lack of access toshort-term credit, higher costs associated with usinginformal credit, increased exposure to unethical,predatory and unregulated providers, vulnerability touninsured r isks, and long-term or extendeddependence on welfare as opposed to savings (ChantLink and Associates, 2004).
7.30 Access to a bank account, credit andinsurance are now widely regarded as essentialsupports for personal financial management and forundertaking transactions in modern societies (Speakand Graham, 1999). According to the TreasuryCommittee, UK (2006), financial exclusion can imposesignificant costs on individuals, families and societyas a whole. These include (i) barriers to employmentas employers may require wages to be paid into abank account; (ii) opportunities to save and borrowcan be difficult to access; (iii) owning or obtainingassets can be difficult; (iv) difficulty in smootheningincome to cope with shocks; and (v) exclusion frommainstream society.
7.31 In terms of cost to the individuals, financialexclusion leads to higher charges for basic financialtransactions like money transfer and expensivecredit, besides all round impediments in basic/minimum transactions involved in earning livelihood
A number of factors affecting access to financial serviceshave been identified in many countries. These are:
• Gender issues: Access to credit is often limited forwomen who do not have, or cannot hold title to assetssuch as land and proper ty or must seek maleguarantees to borrow.
• Age factor: Financial service providers usually targetthe middle of the economically active population, oftenoverlooking the design of appropriate products for olderor younger potential customers.
• Legal identity: Lack of legal identities like identity cards,birth certificates or written records often exclude women,ethnic minorities, economic and political refugees andmigrant workers from accessing financial services.
• Limited literacy: Limited literacy, particularly financialliteracy, i.e., basic mathematics, business finance skillsas well as lack of understanding often constrain demandfor financial services.
• Place of living: Although effective distance is as muchabout transportation infrastructure as physical distance,factors like density of population, rural and remoteareas, mobility of the population (i.e., highly mobilepeople with no fixed or formal address), insurgency ina location, etc., also affect access to financial services.
• Psychological and cultural barriers: The feeling thatbanks are not interested to look into their cause hasled to self-exclusion for many of the low income groups.However, cultural and religious barriers to banking havealso been observed in some of the countries.
Box VII.1Factors Affecting Access to Financial Services
• Social security payments: In those countries wherethe social security payment system is not linked to thebanking system, banking exclusion has been higher.
• Bank charges: In most of the countries, transaction isfree as long as the account has sufficient funds to coverthe cost of transactions made. However, there are arange of other charges that have a disproportionateeffect on people with low income.
• Terms and conditions: Terms and conditions attachedto products such as minimum balance requirementsand conditions relating to the use of accounts oftendissuade people from using such products/services.
• Level of income: Financial status of people is alwaysimportant in gaining access to financial services.Extremely poor people find it difficult to access financialservices even when the services are tailored for them.Perception barriers and income discrimination amongpotential members in group-lending programmes mayexclude the poorer members of the community.
• Type of occupation: Many banks have not developedthe capacity to evaluate loan applications of smallborrowers and unorganised enterprises and hence tendto deny such loan requests.
• Attractiveness of the product: Both the financialservices/products (savings accounts, credit products,payment services and insurance) and how theiravailability is marketed are crucial in financial inclusion.
References:
World Bank, 2008; Asian Development Bank, 2007; andKempson et al., 2004.

302
REPORT ON CURRENCY AND FINANCE
and day to day living. It could also lead to denial ofaccess to better products or services that may requirea bank account. It exposes the individual to theinherent risk in holding and storing money – operatingsolely on a cash basis increases vulnerability to lossor theft. Individuals/families could get sucked into acycle of poverty and exclusion and turn to high costcredit from moneylenders, resulting in greaterfinancial strain and unmanageable debt. At the widerlevel of the society and the nation, financial exclusionleads to social exclusion, poverty as well as all theother associated economic and social problems.Thus, financial exclusion is often a symptom as wellas a cause of poverty. Financial exclusion is notevenly distr ibuted throughout society; i t isconcentrated among the most disadvantaged groupsand communities and, as a result, contributes to amuch wider problem of social exclusion.
7.32 A significant portion of demand for credit byrural households arises in order to ease the financialburden of crop failures, illness or death, and healthcare. In the case of microenterprises, credit may beneeded to achieve a reasonable and viable scale ofactivities. The rising entrepreneurship spanning rural,semi-urban and urban areas, particularly in theunorganised and informal sectors may give rise tolarge potential demand for credit. The evidence onthe demand for credit in India suggests that medicaland financial emergencies are the major reasons forhousehold borrowings. Medical emergencies wereparticularly high for the lowest income quartile (IIMS,2007)2 . Thus, the difficulty in obtaining finance fromformal sources has major social implications.
7.33 Another cost of financial exclusion is the lossof business opportunity for banks, particularly in themedium-term. Banks often avoid extending theirservices to lower income groups because of initialcost of expanding the coverage which may sometimesexceed the revenue generated from such operations.These business related concerns of banks were,however, meaningful when technology developmentwas at a nascent stage and expanding the coverageof financial services required substantial initialinvestment. The strides in technology have nowreduced the required initial investment in a significantmanner. What is required is to explore the appropriatetechnology which is suitable to socio-economiccondit ions of the region under consideration.Moreover, availability and usage of financial servicesby the otherwise excluded population groups would
lead to increase in their income levels and savings.This, in turn, would have the potential to increasesavings deposits as well as credit demand, implyingprofitable business for banks in the medium-term.
7.34 Two other factors have often been cited asthe consequences of financial exclusion. First, itcomplicates day-to-day cash flow management -being financially excluded means households, andmicro and small enterprises deal entirely in cash andare susceptible to irregular cash flows. Second, lackof financial planning and security in the absence ofaccess to bank accounts and other savingopportunities for people in the unorganised sectorlimits their options to make provisions for their oldage. From the macroeconomic standpoint, beingwithout formal savings can be problematic in tworespects. First, people who save by informal meansrarely benefit from the interest rate and taxadvantages that people using formal methods ofsavings enjoy. Second, informal saving channels aremuch less secure than formal saving facilities. Thosewho can afford it least, suffer the highest risk. Theresultant lack of savings and saving avenues meansrecourse to non-formal lenders such asmoneylenders. This, in turn, could lead to two adverseconsequences – (a) exposure to higher interest ratescharged by informal lenders; and (b) the inability ofcustomers to service the loans or to repay them. As loansfrom non-formal lenders are often secured against theborrower’s property, this raises the problem of inter-linkage between two apparently separate markets.Judged in this specific context, financial exclusion is aserious concern among low-income households, mainlylocated in rural areas (Mohan, 2006).
7.35 To sum up, the nature and forms of exclusionand the factors responsible for it are varied and, thus,no single factor could explain the phenomenon. Theprincipal barriers in the expansion of financial servicesare often identified as physical access, high chargesand penalties, conditions attached to products whichmake them inappropr iate or complicated andperceptions of financial service institutions which arethought to be unwelcoming to low income people.There has also been particular emphasis on socio-cultural factors that matter for an individual to accessfinancial service. The most conspicuous dimensionof exclusion is that a majority of the low-incomepopulation do not have access to the very basicfinancial services. Even amongst those who haveaccess to finance, most of them are underserved in
2 Invest India Incomes and Savings Survey undertaken by Invest India Market Solutions (IIMS).

303
FINANCIAL INCLUSION
terms of quality and quantity of products and services.The critical dimensions of financial exclusion includeaccess exclusion, condition exclusion (conditionsattached to financial products), price exclusion, andself exclusion because of the fear of refusal to accessby the service providers. The financial exclusionprocess becomes self-reinforcing and can often bean important factor in social exclusion, especially forcommunities with limited access to financial products,particularly in rural areas. Apart from the abovementioned supply side factors, demand side factorsmay also significantly affect the extent of financialinclusion. For instance, low level of income and hencelow savings would result in lower deposits. Similarly,at low level of income, the ability to borrow is affectedbecause of low repayment capacity and inability toprovide collateral. In the Indian context, both demandand supply side factors have an important bearingon the usage of financial/banking services.
7.36 The issue of cost has been conceived fromtwo angles, which are inter-twined. First, the exclusionmay have cost on the individuals/entities in terms ofloss of opportunities to grow in the absence of accessto finance or credit. Second, from the societal or thenational perspective, exclusion may lead to aggregateloss of output or welfare and the country may not realiseits growth potential. Recognising the implicit and explicitcost of financial exclusion across the globe, manycountries have initiated measures to deal with the same.
IV. INITIATIVES FOR FINANCIAL INCLUSION IN INDIA
7.37 As discussed in Chapter III, India has a longhistory of banking development. After Independence,the major focus of the Government and the ReserveBank was to develop a sound banking system whichcould suppor t planned economic developmentthrough mobilisation of resources/deposits andchannel them into productive sectors. Accordingly, theGovernment’s desire to use the banking system asan important agent of change was at the core of mostpolicies that were formulated after Independence. Theplanning strategy recognised the critical role of theavailability of credit and financial services to the publicat large in the holistic development of the country withthe benefits of economic growth being distributed ina democratic manner. In recognition of this role, theauthorities modified the policy framework from time totime to ensure that the financial services needs ofvarious segments of the society were met satisfactorily.
7.38 In order to expand the credit and financialservices to the wider sections of the population, awide network of financial institutions has been
established over the years. The organised financialsystem comprising commercial banks, regional ruralbanks (RRBs), urban co-operative banks (UCBs),primary agricultural credit societies (PACS) and postoffices caters to the needs of financial services ofthe people. Besides, MFIs, self-help groups (SHGs)also meet the financial service requirements of thepoorer segments. Furthermore, development of theinstitutional framework in recent years has focussedon new models of expanding financial servicesinvolving credit dispensation using multiple channelssuch as civil society organisations (CSOs), non-government organisations (NGOs), post offices,farmers’ clubs, and panchayats as businessfaci l i tators/correspondents. Specif ic f inancialinstruments/products were also developed in orderto promote financial inclusion.
Overall Approach
7.39 Financial inclusion in the Indian contextimplies the provision of affordable financial services,viz., access to payments and remittance facilities,savings, loans and insurance services by the formalfinancial system to those who tend to be excluded.Besides access, emphasis is also placed onaffordability (low cost) of financial services such assavings, loan, and remittance to the underprivilegedsegments of the population. Although the term‘financial inclusion’ was not in vogue in India then,since the late 1960s both the Government and theReserve Bank have been concerned about the non-availability of banking facilities to the under-privilegedand weaker sections of the society. Accordingly,several initiatives have been taken over time such asnationalisation of banks, prescription of priority sectortargets, lending to weaker sections at concessionalrates, and initiation of the lead bank scheme. Theseinitiatives were undertaken at different points in timeto expand the outreach of banking facilities andincrease the flow of credit to the rural areas. However,the broad approach towards financial inclusionfollowed in India in the 1970s and the 1980s was moreoriented towards credit requirements of specificsectors/segments and there was relatively lowemphasis on individual/household level inclusion. TheIndian financial system essentially catered to theneeds of planned development in a mixed-economyframework, where the Government sector had apredominant role in economic activity. The focus ofbanking policy during the 1990s and up to the early2000s was more on creating a strong and efficientbanking system. However, once the financial healthof the banking system was restored, focussed

304
REPORT ON CURRENCY AND FINANCE
attention was again paid towards promotion offinancial inclusion.
7.40 The recent approach focuses on financialinclusion on the individual and household level (BoxVII.2). The important difference in the recent focuson financial inclusion is the adoption of marketoriented approach that recognises the importance ofbusiness consideration of banks and other financialinstitutions for the long-term sustainability of theprocess. The Annual Policy Statement for the Year2005-06 of the Reserve Bank observed that althoughthere had been expansion, greater competition anddiversification of ownership of banks leading to bothenhanced efficiency and systemic resilience, therewere legitimate concerns with regard to the bankingpractices that tended to exclude vast sections ofpopulation, in particular pensioners, self-employedand those employed in the unorganised sector. TheStatement further observed that while commercialconsiderations were important, the banks had beenbestowed with several privileges, especially of seekingpublic deposits on a highly leveraged basis, andtherefore, should be obliged to provide bankingservices to all segments of the population on anequitable basis.
7.41 The broad strategy for financial inclusion inIndia in recent years comprises the following elements:(i) encouraging penetration into unbanked andbackward areas and encouraging agents andintermediaries such as NGOs, MFIs, CSOs andbusiness correspondents (BCs); (ii) focussing on a
decentralised strategy by using existing arrangementssuch as State Level Bankers’ Committee (SLBC) anddistr ict consultative committee (DCC) andstrengthening local institutions such as co-operativesand RRBs; (iii) using technology for furthering financialinclusion; (iv) advising banks to open a basic banking‘no frills’ account; (vi) emphasis on financial literacy andcredit counselling; and (vii) creating synergies betweenthe formal and informal segments (Thorat, 2008).
7.42 Various initiatives undertaken could broadlybe categorised into three phases. In the first phasestarting in the late 1960s through the 1980s, the focuswas on channelling of credit to the neglected sectorsof the economy. Special emphasis was also laid onweaker sections of the society. In the second phasespanning the early 1990s through March 2005, thefocus was mainly on strengthening the financialinstitutions as par t of financial sector reforms.Financial inclusion in this phase was encouragedmainly by the introduction of SHG-bank linkageprogramme in the early 1990s and Kisan Credit Cards(KCCs) for providing credit to farmers. In the thirdphase, beginning in April 2005, ‘financial inclusion’was explicitly made as a major policy objective andthrust was on providing safe facility of savingsdeposits through ‘no frills’ accounts.
Progress till 1990
7.43 Before 1990, several in i t iat ives wereundertaken for enhancing the use of the bankingsystem for sustainable and equitable growth. These
(i) Financial inclusion is delivery of banking services atan affordable cost to the vast sect ions ofdisadvantaged and low income groups. Unrestrainedaccess to public goods and services is the sine quanon of an open and efficient society. As bankingservices are in the nature of public good, it isessential that availability of banking and paymentservices to the ent ire populat ion withoutdiscrimination is the prime objective of the publicpolicy (Leeladhar, 2006).
(ii) Financial exclusion signifies lack of access bycertain segments of the society to appropriate, low-cost, fair and safe financial products and servicesfrom mainstream providers. Financial exclusion isthus a key policy concern, because the options foroperating a household budget, or a micro/smallenterprise, without mainstream financial servicescan often be expensive. This process becomes self-
Box VII.2Financial Inclusion in India – Key Elements
reinforcing and can often be an important factor insocial exclusion, especially for communities withlimited access to financial products, particularly in ruralareas (Mohan, 2006).
(iii) Financial inclusion means the provision of affordablefinancial services, viz., access to payments andremittance facilities, savings, loans and insuranceservices by the formal financial system to those whotend to be excluded (Thorat, 2006).
(iv) The process of financial inclusion consists of seekingeach household and offering their inclusion in thebanking system (Reddy, 2007).
(v) The process of ensuring access to financial services andtimely and adequate credit where needed by vulnerablegroups such as weaker sections and low income groupsat an affordable cost (The Committee on FinancialInclusion, Chairman: Dr. C. Rangarajan, 2008).

305
FINANCIAL INCLUSION
included nationalisation of private sector banks,introduction of priority sector lending norms, theLead Bank Scheme, branch licensing norms withfocus on rural/semi-urban branches, interest rateceilings for credit to the weaker sections and creationof specialised financial institutions to cater to therequirement of the agriculture and the rural sectorshaving bulk of the poor population. The announcementof the policy of social control over banks was made inDecember 1967 with a view to securing a betteralignment of the banking system with the needs ofeconomic policy. The National Credit Council was setup in February 1968 mainly to assess periodically thedemand for bank credit from various sectors of theeconomy and to determine the priorities for grant ofloans and advances. Social control of banking policywas soon followed by the nationalisation of majorIndian banks in 1969. The immediate tasks set forthe nationalised banks were mobilisation of depositson a massive scale and lending of funds for allproductive activities. A special emphasis was laidon providing credit facilities to the weaker sectionsof the economy.
7.44 The administrative framework for rurallending in India was provided by the Lead BankScheme introduced in 1969, which was an importantstep towards implementat ion of the two-foldobjectives of deposit mobilisation on an extensivescale and stepping up of lending to weaker sectionsof the economy. Realising that the flow of credit toemployment oriented sectors was inadequate, thepriority sector guidelines were issued to the banksby the Reserve Bank in the late 1960s to step upthe flow of bank credit to agriculture, small-scaleindustry, self-employed, small business and theweaker sections within these sectors. The target forpriority sector lending was gradually increased to 40per cent of advances in the case of domestic banks(32 per cent, inclusive of export credit, in the caseof foreign banks) for specified priority sectors. Sub-targets under the priority sector, along with otherguidelines including those relating to Governmentsponsored programmes, were used to encourage theflow of credit to the identified vulnerable sections ofthe population such as scheduled castes, religiousminorities and scheduled tribes. The Differential Rateof Interest (DRI) Scheme was instituted in 1972 toprovide credit at concessional rate to low incomegroups in the country (see Chapter III for details).
7.45 Since the 1970s, the promotional aspects ofbanking policy have come into greater prominence.The major emphasis of the branch licensing policy
during the 1970s and the 1980s was on expansion ofcommercial bank branches in rural areas, resultingin a significant expansion of bank branches anddecline in population per branch. The branchexpansion policy was designed, inter alia, as a toolfor reducing inter-regional disparities in bankingdevelopment, deployment of credit and urban-ruralpattern of credit distribution. In order to encouragecommercial banks and other institutions to grant loansto various categories of small borrowers, the ReserveBank promoted the establishment of the CreditGuarantee Corporation of India in 1971 for providingguarantees against the risk of default in repayment.The scheme, however, was subsequentlydiscontinued.
7.46 The National Bank for Agriculture and RuralDevelopment (NABARD) was set up in 1982 mainlyto provide refinance to the banks extending credit toagriculture. RRBs, which were set up in 1975 to cater,inter alia, to the credit requirements of the rural poor,have recently been restructured.
Recent Initiatives
7.47 With the onset of economic reforms in thebeginning of the 1990s, a strong and resilientfinancial sector was considered necessary foraccelerating the growth momentum in the countryand also for expanding the coverage of financialservices in a sustainable manner. Accordingly, thef inancial sector reform process placed moreemphasis on creat ing a strong, v ibrant andcompetitive banking system. An important step tobring financially excluded people within the fold offormal financial sector was the promotion of micro-finance in India. The SHG-bank linkage programmewas launched by NABARD in 1992, with policysupport from the Reserve Bank, to facilitate collectivedecision making by the poor and provide ‘door step’banking. Banks, as wholesalers of credit, were toprovide the resources, while the NGOs were to actas agencies to organise the poor, build theircapacities and facilitate the process of empoweringthem (Box VII.3).
7.48 To further promote the SHG-bank linkageprogramme in the country, banks were advised in1998 that SHGs that were engaged in promoting thesaving habits among their members would be eligibleto open savings bank accounts and that such SHGsneed not necessarily have availed of credit facilitiesfrom banks before opening savings bank accounts.Subsequent to the Monetary and Credit Policyannouncement for the year 1999-2000, banks were

306
REPORT ON CURRENCY AND FINANCE
An SHG is a group of about 15 to 20 people from ahomogenous class who join together to address commonissues. They involve voluntary thrift activities on a regularbasis, and use of the pooled resource to make interest-bearing loans to the members of the group. In the courseof this process, they imbibe the essentials of financialintermediation and also the basics of account keeping.The members also learn to handle resources of size, muchbeyond their individual capacities. They begin to appreciatethe fact that the resources are limited and have a cost.Once the group is stabilised, and shows mature financialbehaviour, which generally takes up to six months, it isconsidered for linking to banks. Banks are encouraged toprovide loans to SHGs in cer tain multiples of theaccumulated savings of the SHGs. Loans are given withoutany collateral and at interest rates as decided by banks.Banks find it comfortable to lend money to the groups as themembers have already achieved some financial disciplinethrough their thrift and internal lending activities. The groupsdecide the terms and conditions of loan to their own members.The peer pressure in the group ensures timely repaymentand becomes social collateral for the bank loans.
Box VII.3Self-Help Group – Bank Linkage Programme
Generally, the SHGs need self-help promoting institutions(SHPIs) to promote and nurture them. These SHPIs includevar ious NGOs, banks, farmers’ clubs, governmentagencies, self-employed individuals and federations ofSHGs. However, some SHGs have also been formedwithout any assistance from such SHPIs.
There are three different models that have emerged underthe linkage programme:
• Model I: This involves lending by banks directly to SHGswithout intervention/facilitation by any NGO.
• Model II: This envisages lending by banks directly toSHGs with facilitation by NGOs and other agencies.
• Model III: This involves lending, with an NGO acting asa facilitator and financing agency.
Model II accounted for around 74 per cent of the totallinkage at end-March 2007, while Models I and IIIaccounted for around 20 per cent and 6 per cent,respectively.
advised that interest rates applicable to loans givenby them to micro credit organisations or by the microcredit organisations to SHGs/member beneficiarieswould be left to their discretion. Subsequently, bankswere advised that they should provide adequateincentives to their branches for financing the SHGsand that the group dynamics of working of the SHGsmay be left to themselves.
7.49 The objective of bringing financially excludedpeople within the fold of the banking sector receivedrenewed emphasis in 2005-06 as the term ‘financialinclusion’ was explicitly used for the first time in theAnnual Policy Statement for 2005-06. It observed thatthere were legitimate concerns in regard to thebanking practices that tended to exclude rather thanattract vast sections of population, in particularpensioners, self-employed and those employed in theunorganised sector. It also indicated that the ReserveBank would (i) implement policies to encourage bankswhich provide extensive services, whiledisincentivising those which were not responsive tothe banking needs of the community, including theunderprivileged; (ii) the nature, scope and cost ofservices would be monitored to assess whether therewas any denial, implicit or explicit, of basic bankingservices to the common person; and (iii) banks urgedto review their existing practices to align them withthe objective of financial inclusion.
7.50 The process of financial inclusion receivedfurther impetus in November 2005, when bankswere advised to make available a basic banking ‘no-frills’ account with low or nil minimum balances aswell as charges to expand the outreach of suchaccounts to vast sections of the population. The lowcost or free of cost account is internationallyconsidered to be helpful in expanding the access ofbanking services, particularly to the low incomegroups. Similar types of accounts, though withdifferent names, have also been extended by banksin various other countries with a view to makingfinancial services accessible to the common maneither at the behest of banks themselves or therespective Governments (Table 7.2).
7.51 In order to ensure that persons belonging tolow income groups, both in urban and rural areas donot encounter difficulties in opening bank accounts,the know your customer (KYC) procedure for openingaccounts was simplified for those accounts withbalances not exceeding Rs.50,000 and credit limitsnot exceeding Rs.100,000 in a year. The simplifiedprocedure allowed introduction by a customer onwhom the full KYC drill had already been done.
7.52 Besides the KCCs, which were introduced in1998, banks were advised in 2005 to considerintroduction of a General Credit Card (GCC) facility

307
FINANCIAL INCLUSION
Table 7.2: Basic/‘No-Frills’ Accounts - Salient Features in Select Countries
Country Name of the Account and Main FeaturesYear of Introduction
1 2 3
1. Very low or no minimum balance2. 5-10 free transactions per month3. ATM facility
1. Affordable2. Free face-to-face money advice
1. International debit–cum-ATM cards2. Shopping online, over the phone in the UK and abroad3. Instrument of flexible savings account4. Low costs international money transfer5. Multi-lingual relocation advice6. SIM (subscriber identity module) card
1. Very low or minimum balance2. Low fees3. For people without deposit accounts
1. Universal savings account2. Savings by the poor, matched by the Government3. Use of savings is restricted for investments in homes, education, business
capitalisation or other development purposes4. Over 44 States have adopted it
1. No minimum balance requirement2. ATM facility provided3. Government pays the obliging bank a one-time subsidy of $12.60 for every
account it opens4. No cheque book or direct debit payments
1. Euro 12 a year ceiling on charges2. 36 free face-to-face transactions with a debit card3. Compensation for banks that open more account4. Independent dedicated extra-judiciary litigation service in case of dispute5. Banks to give reasons for refusal in writing
1. No management fees2. One free cash deposit per month3. Only valid ID as identity proof4. Limited to deposits, withdrawals, transfers (anywhere in the country)5. Debit card payments
1. No keeping fees2. No minimum balance3. Unlimited deposits free of charge4. Six non-deposit transactions (including three over-the-counter cash
withdrawals) free of charge each month
1. Savings bank accounts and banking services2. Used extensively by people with low income3. A proposal to create full-fledged postal bank/credit institution was with
the Parliament
1. No limit on over-the-counter withdrawals2. Tax-free
1. Card based2. Simplified application procedures3. Accessible through point-of-sale terminals at correspondents4. Accepts regular payments of social benefits and cash deposits5. Electronic version e-Account Caixa for Brazilians abroad for remittances
at just 2.5 per cent as compared with 8-15 per cent by traditional channels
India
United Kingdom
United States of America
Belgium
South Africa
Australia
France
Brazil
No-frills Account, 2005
Basic Bank Account
Passport Account (PA)
First Account, 2002
Individual DevelopmentAccount (IDA), 1991
Electronic Transfer Account,1999
Basic Bank Account
Mzansi Account, 2004
Generic Account, 2002
La Poste Account
Livret A Account
Caixa Aqui Account

308
REPORT ON CURRENCY AND FINANCE
up to Rs.25,000 at their rural and semi-urbanbranches. Under GCC, based on the assessment ofhousehold cash flows, the limits are sanctionedwithout insistence on security or purpose. The creditfacility is in the nature of revolving credit entitling theholder to withdraw up to the limit sanctioned. Basedon assessment of household cash flows, the limitsare sanctioned. Interest rate on the facil ity iscompletely deregulated. Fifty per cent of GCC loansare treated as priority sector lending.
7.53 The SLBC identifies one or more districts for100 per cent financial inclusion.3 The responsibilityis given to the banks in the area for ensuring that allthose who want to have a bank account are providedwith one by allocating the villages to the differentbanks. In April 2008, SLBCs reported achieving 100per cent financial inclusion in 134 districts in 18 Statesand 6 Union Territories (UTs) of the country. TheReserve Bank is undertaking an evaluation of theprogress made in these districts by independentexternal agencies to draw lessons for further actionin this regard.
7.54 In Januar y 2006, the Reser ve Bank,permitted banks to utilise the services of NGOs/SHGs, MFIs (other than NBFCs) and other civilsociety organisat ions as inter mediar ies forproviding financial and banking services through theuse of business faci l i tator (BF) and businesscorrespondent (BC) models. In April 2008, bankswere permitted to engage retired bank employees,ex-servicemen and government employees as BCs,subject to appropriate due diligence. The BC modelallows banks to do ‘cash in - cash out’ transactionsat a location much closer to the rural population,thus, addressing the last mile problem. Banks arealso entering into agreements with Indian Postalauthorities for using the enormous network of postoffices as BCs, thereby increasing their outreach.In order to provide social security to vulnerablegroups, in some cases banks have provided, inassociation with insurance companies, innovativeinsurance products at affordable cost, covering lifedisability and health cover. SHGs and MFIs are alsobeing used extensively for financial inclusion on thecredit side.
7.55 The list of eligible sectors for treatment as‘priority sector’ was expanded in the post-reform
period to include investments in specified bonds andalso activities such as venture capital. As a result,there was a growing perception of inadequate flowof credit to the traditionally preferred sub-sectors ofthe priority sector such as agriculture and smallindustries. In order to address these concerns,revised guidelines on the priority sector were issuedin April 2007. Consequently, the priority sector is nowrestr icted to advances to highly employmentintensive sectors such as agr icul ture, smal lenterprises, retail trade, educational loans, micro-finance and low cost housing.
7.56 Given the low credit-deposit ratios in someStates, it became necessary to identify uniqueproblems in such lagging States for expandingbanking facilities and formulating area-specific actionplans for accelerated financial deepening. Such planswere drawn up with full participation of the StateGovernments, banks and other local developmentalagencies in States such as Uttarakhand, HimachalPradesh, Jharkhand, Bihar, Andaman & NicobarIslands and the North-Eastern States.
7.57 A growing component of inclusive bankingis the lending by MFIs that are societies, trusts, co-operatives or ‘not for profit’ companies or non-banking financial companies registered with theReserve Bank. The MFIs currently cover 8.3 millionborrowers. The NBFC segment within this sectoraccounts for 42.8 per cent of the borrowers and isthe fastest growing segment. Interest rates onlending to MFIs/NBFCs have been completelyderegulated. Bank lending to such entities for micro-finance is treated as priority sector lending. Privatesector and foreign banks are observed to be activelysupporting this sector, which is also attracting privateequity funding and philanthropy funding from outsidethe country (Thorat, 2008).
7.58 In India, there have been several innovativeexperiments with various variants of micro-financetaking into account the highly localised needs. Aninteresting example in this regard has been the effortsby Aryavart Gramin Bank which embarked upon anovel idea of financial inclusion in remote villages andhamlets of Uttar Pradesh (Box VII.4).
7.59 Another innovative micro-finance experimentwas undertaken by the Mann Deshi Mahila Bank inthe Satara District of Maharashtra which works
3 In order to identify households without bank account, surveys are conducted using various databases such as electoral rolls, public distributionsystem, or other household data.

309
FINANCIAL INCLUSION
towards the holist ic development of womenentrepreneurs into women business owners and bankcustomers (Box VII.5).
7.60 Micro-finance has emerged as a major modeof expanding outreach of the formal financial sectorin a number of countries. The experiences of these
The Aryavart Gramin Bank embarked on a novel idea offinancial inclusion in remote villages and hamlets of UttarPradesh where electricity supply was not available or ifavailable was erratic. The villagers were dependent onlyon kerosene lamps for their lighting needs and oftenkerosene had to be bought from black markets, which wasaffecting their incomes. The bank embarked upon the novelidea of providing solar energy lights to the villages andidentified a solar company in India, Tata BP Solar, forproviding ‘Solar Home Lighting System’ for the villagehomes. The company and the dealer were ready tosacrifice their margins as the bank was agreeing to financethe system on a large scale. The system cost Rs.13,000and consisted of a ready-to-use kit containing a 35 wattsolar panel, low maintenance battery, MCR chargecontroller and two luminaries. The system could light twoCFLs of 14 watt for more than 7 hours and could alsosupport one mobile charger, one table fan and a television.The bank extended finance of around Rs.10,000 with
Box VII.4Financial Inclusion: Novel Method of Financing
Rs.3,000 as margin money to be contributed by thebeneficiary. The amount together with interest was to berepaid in 60 equated monthly instalments of approximatelyRs.222 per month. This was much less than the amountthat the vil lagers had to spend for their kerosenerequirements per month.
The bank had identified literate village youths as businessfacilitators who were trained by the company for maintenanceof the systems. The bank is paying an honorarium ofRs.10,000 per annum to the business facilitators formaintaining 100 such systems. More than 1,300 householdsin Unnao District and about 500 houses in Barabanki District,were provided with Solar Home Lighting Systems by thebank as at end-December 2007. The bank aims to cover25,000 households by October 2008.
Source: Website of Aryavart Grameen Bank; http://aryavart-rrb.com.
The Mann Deshi Mahila Bank, based in Mhaswad, in SataraDistrict, Maharashtra, is an organisation that works towardsthe holistic development of women entrepreneurs intowomen business owners’ and bank customers. Founded in1997, by Chetna Vijay Sinha, the Mann Deshi Mahila Bankhas created 17,000 women entrepreneurs. The regulatedco-operative that received an “A” grade from District Co-operative Department in 2000, equips its clients with liquidassets which help financial empowerment that, in turn,enables women to become entrepreneurs and plan a stablefuture for their families. Services which the bank offers includesavings, loans, insurance and pensions. A partnership withUTI Mutual Fund had enabled the bank to be the first to offerpension schemes to its clients in Maharashtra.
The bank’s success led to the creation of several sub-organisations, one of which is the Mann Deshi BusinessSchool for Rural Women. Set up in partnership with HSBCBank, the school primarily aims at making its range ofcourses accessible to women who, due to financial andcultural constraints, would be unable to access suchtraining in neighbouring urban hubs. Unlike traditionalbusiness schools that delve into the theor y ofmicroeconomics, accounting, organisational behaviourand so on, this business school focusses on impartingsimple business skills. The school’s courses can becategorised into basic business-oriented courses, such asfinancial literacy, marketing and product development and
Box VII.5Financial Inclusion: Women Empowerment
entrepreneurial or skill-based courses. The business schoolin Vaduj, Mhaswad attracts women from the surroundingvillages as well as larger towns. As most of the women whoattend the school are part of larger joint families, the school’scourses are designed so as to enable them to attend theschool after completing their household chores andsupplement their household income with their earnings.
In 2007, in partnership with the Deshpande Foundation,which supports innovation and entrepreneurship in India,Mann Deshi and Mann Vikas (the NGO wings of the bank)established the Business School on Wheels for RuralWomen. This currently operates in the Hubli-Dharwaddistrict in the neighbouring State of Karnataka. A speciallydesigned bus travels the district and offers courses similarto those of the business school. What is striking about theMann Deshi Business School and the Business Schoolon Wheels is that all their courses are designed not just toteach skills, but also at a larger level, to cater to the needsof the society. By enforcing a str ict no educationalqualification, no age bar policy, and with fees ranging fromRs.180 to Rs.1,800, the school has been able to attract,dur ing the last year, 650 women from all socialbackgrounds and capacities, and provide them with skillsthey otherwise would never have been able to acquire.
Reference:
Creado, J. and R. Koshi. 2008. Creating Leaders at theBottom of Pyramid, Microfinance Insight, March.

310
REPORT ON CURRENCY AND FINANCE
The Grameen Bank (GB) was launched as a project in avillage of Bangladesh in 1976 to assist the poor familiesby providing credit to help them overcome poverty. In 1983,it was transformed into a formal bank under a special lawpassed for its creation. It is owned by the poor borrowersof the bank who are mostly women. GB has reversedconventional banking practice by obviating the need forcollateral. It has created a banking system based on mutualtrust, accountability, par ticipation and creativity. GBprovides credit to the poorest of the poor in ruralBangladesh, without any collateral.
As GB was initiated as a challenge to the conventionalbanking, it rejected the basic methodology of theconventional banking and created its own methodology.The most distinctive feature of Grameen credit is that it isnot based on any collateral, or legally enforceablecontracts. It is based on ‘trust’ and not on legal proceduresand system. It offers credit for creating self-employment,income-generating activities and housing for the poor, asopposed to consumption. It provides service at the door-step of the poor based on the principle that the peopleshould not go to the bank, bank should go to the people.In order to obtain loans, a borrower must join a group ofborrowers. Although each borrower must belong to a five-member group, the group is not required to give anyguarantee for a loan to its member. The repaymentresponsibility solely rests on the individual borrower, whilethe group and the centre/branch oversee that everyonebehaves in a responsible way and none gets intorepayment problem. There is no form of joint liability, i.e.,group members are not responsible to pay on behalf of adefaulting member. Loans can be received in a continuoussequence. New loan becomes available to a borrower ifher previous loan is repaid. All loans are to be paid backin instalments (weekly or bi-weekly).
The GB initially focussed on providing credit facilities andpaid little attention to voluntary deposit mobilisation. Thispolicy was changed in 2000, with increased emphasis ondeposit mobilisation. GB currently offers four kinds of
Box VII.6 Grameen Bank in Bangladesh
savings, namely personal savings account, special savingsaccount, Grameen Pension Savings and credit-life insurancesavings fund. After operating group lending for 25 years,the GB switched to individual lending recognising that withrepeated loan cycles and greater credit exposure,homogeneity of the group would weaken as loanrequirements vary with variation in the levels of upliftmentattained. Thus, the more flexible Grameen II is moreappropriate for reaching the poor because its products canbe conveniently used for everyday money management aswell as for microenterprises. GB II dispensed with the generalloans, seasonal loans, family loans, and more than a dozenother types of loans. It also gave up the group fund; thebranch-wise and zone-wise loan ceiling; fixed size weeklyinstalment; the rule to borrow for one whole year, even whenthe borrower needed the loan only for three months.
The Government of Bangladesh has fixed interest rate forgovernment-run microcredit programmes at 11 per cent atflat rate, which amounts to about 22 per cent on a decliningbasis. The interest rate charged by the Grameen Bank islower than that fixed by the Government of Bangladesh.There are four interest rates for loans from Grameen Bank:20 per cent (declining basis) for income generating loans, 8per cent for housing loans, 5 per cent for student loans, and0 per cent (interest-free) loans for struggling members(beggars). All interests are simple interest, calculated ondeclining balance method. This implies an annual interestrate of 10 per cent for income-generating loan which is lessthan that (11 per cent) fixed by the Government ofBangladesh. GB offers attractive rates for deposits rangingfrom 8.5 per cent to 12 per cent.
As of March, 2008, it had 7.46 million borrowers, 97 percent of whom were women. With 2,504 branches, GBprovides services in 81,574 villages, covering more than97 per cent of the total villages in Bangladesh.
Source: Website of Grameen Bank; www.grameen-info.org.
countr ies provide useful inputs regarding themethodology and model of finance to be emulated inother counties (Box VII.6).
7.61 The Grameen system has been widelyreplicated by micro-finance organisations in several othercountries, including some institutions in India. Forinstance, Activists for Social Alternatives (ASA),Tiruchirapalli (Tamil Nadu) provides a range ofintegrated financial and non-financial services throughits Gram Vidiyal (GV) programme. The GV consists of afederated structure built upon Grameen style small groupsthrough which financial and non-financial services areprovided by ASA, a NGO/MFI (Tankha, 2002).
7.62 Though a variety of micro-finance models arefollowed in India, SHG-bank linkage programme is thepredominant one. The model has broad similaritieswith the Grameen Bank model such as formation ofgroups, extending credit to poor people, and focuson capacity building. There are, however, certaindifferences in the methodology followed by SHG-banklinkages programme in India and that by GrameenBank in Bangladesh (Table 7.3).
7.63 The Reserve Bank has been encouraging theuse of IT solutions by banks for enhancing theiroutreach with the help of their BCs or otherwise.Certain banks have adopted technological solution

311
FINANCIAL INCLUSION
(Box VII.7). Pilot studies have also been carried outin a few States. One of the technological solutionsused is hand-held devices, which are essentiallysmart card readers. These devices are used formaking payments to rural customers and receivingcash from them at their doorsteps. Mobile phoneshave also been developed to serve as card readers.Account holders are issued smart cards, which havetheir photographs and finger impressions.
7.64 Recognising the potential of emergingbusiness oppor tunities, some banks have alsoadopted innovative methods and appropr iatetechnology to provide banking services to financiallyexcluded people by enabling them to overcomeobstacles such as procedural problems and difficultiesin physical access. For instance, Corporation Bankhas implemented the branchless banking model inthe States of Goa, Karnataka, Tamil Nadu and AndhraPradesh (Box VII.8).
7.65 To overcome financial exclusion which iswidespread in urban areas, Indian Bank successfullyexperimented with an innovative model of providingaccess to slum dwellers in Mumbai (Box VII.9).
7.66 Housing to people with moderate income levelsis internationally considered to promote financialinclusion (Box VII.10). In India, housing for the pooris one of the six elements of Bharat Nirman programme(announced in the Union Budget 2005-06) and is
implemented through the Indira Awas Yojana (IAY).Against a target of 6.0 million houses, 4.11 millionhouses were constructed up to December 2007 andthe cumulative number was expected to go up to 5.18million houses by end-March 2008.4 Recognising thehigh cost of construction, the Union Budget 2008-09proposed to enhance the subsidy per unit in respectof new houses sanctioned after April 1, 2008 fromRs.25,000 to Rs.35,000 in plain areas and fromRs.27,500 to Rs.38,500 in hill/difficult areas. Thesubsidy for upgradation of houses would be increasedfrom Rs.12,500 per unit to Rs.15,000. In the UnionBudget 2008-09, it was also indicated that financialinclusion can be taken forward by expanding thereach, inter alia, of the National Housing Bank (NHB).In order to increase the resource base of NHB, it wasproposed to tap the resources of scheduledcommercial banks (SCBs) to the extent that they fallshort of their obligation to lend to the priority sector.It was also proposed to create a fund of Rs.1,200crore with NHB to enhance its refinance operationsin the rural housing sector. The fund would begoverned by the general guidelines that are nowapplicable to the Rural Infrastructure DevelopmentFund (RIDF) with some modifications. The ReserveBank, in February 2008, advised banks that themembers of SC/STs satisfying the income criteriaof the DRI scheme for weaker sections of thecommunity can also avail of housing loan up to
Table 7.3: India's SHG-bank Linkage Programme and Bangladesh's Grameen Bank Model :Major Features
4 The housing loans outstanding as per cent of GDP increased from 3.4 per cent in 2001 to 8.5 per cent in 2006. The NHB estimated that thehousing loans outstanding to GDP ratio would be about 9 per cent by the end of 2007. Reflecting these developments, housing stock in thecountry also increased from 148 million units in 1991 to 187 million units in 2001 and was estimated at 218 million units in 2007 (NHB, 2006).
Grameen Bank (GB) – Bangladesh
2
1. Members of the group are also owners of the bank.
2. Group normally consists of 5 members.
3. Liability to repay loan lies with the individual, though he/she hasto be a member of a group to take loan.
4. No agreement or document is required, loan is given on the basisof trust.
5. GB directly lends to members.
6. Major focus is on women borrowers.
7. Government of Bangladesh stipulated a ceiling of 11 per cent.
SHG-bank Linkage Programme – India
1
1. Group independent of the bank.
2. Group normally consists of about 15 members.
3. Group is jointly liable to repay the loans.
4. Members of group or group leader has to sign an agreement fortaking loan from bank.
5. There is normally an additional layer of NGOs or MFIs betweenthe bank and the SHG.
6. Both men and women are covered.
7. No interest rate ceiling.

312
REPORT ON CURRENCY AND FINANCE
The Rural Development Department of Government ofAndhra Pradesh launched a pilot project in six Mandals ofWarangal District for payment of Social Security Pensions(SSP) and National Rural Employment Guarantee Scheme(NREGS) benefits to the beneficiaries. The pilot programmeinvolved six banks viz., State Bank of India, Union Bank ofIndia, State Bank of Hyderabad, Andhra Bank,A.P.Grameena Vikas Bank and Axis Bank. The benefits arepaid to the villagers by the business correspondents of banksat the habitation level in the villages. The Rural DevelopmentDepartment, Government of Andhra Pradesh, played a veryactive role in the project and has financed a major portionof the cost of the cards and the devices. The project was co-ordinated by the Reserve Bank with the Regional Director,Hyderabad being the Convenor of the Steering Group forthe project. The Institute for Development and Research inBanking Technology (IDRBT) was given the role of providingthe management information systems (MIS) to theGovernment in the required format. In the second phase,the project will be scaled up to 50,000 villagers. The Stateproposes to scale up the efforts to the entire State in duecourse. The Andhra Pradesh Government also proposes toissue smart cards to all the SHG members in the State.
The project involves payment of SSP and NREGS benefitsthrough BCs with the use of smart card and mobiletechnology. The BC uses a fingerprint scanner cumidentifier, a mobile and a printer to process the payments.The beneficiaries hold smart cards with their photographsand images of their fingerprints pre-loaded at the time oftheir enrolment. The photograph and fingerprint are usedfor identification and authentication of the beneficiary.Once authenticated, the radio frequency identificationdevice (RFID) chip embedded in the card gets charged.When the card with charged chip is brought close to themobile phone, message templates for deposit, withdrawaland balance enquiry are generated in the mobile. The BCneeds to select the relevant option and feed the amountof transaction through the mobile keypads and send themessage to the back-end server. The server authenticatesthe message, processes the transaction and sends anupdate back to the mobile, which, in turn, writes back tothe card. When the card is brought close to the printer,transaction report is printed in triplicate. The BC carriescash physically for making payments to the beneficiary.Thus, in effect, each BC carries a pocket ATM to the villagein which it operates. The technology holds potential for
Box VII.7Successful Model for Financial Inclusion: A Case Study of Andhra Pradesh
whole range of activities that banks can conduct through BCsand this includes other products like fixed deposits, variousloans, insurance, among others. The mobiles connect to acentral data base server of the banks. The application has anoff-line model also, which enables its operation in remoteareas where there is no connectivity. Presently, the SSP andNREGS benefits are being paid through post offices whichare given a commission of 2 per cent.
The State Government, for the initial pilot covering sixmandals, agreed to pay Rs.90 per smart card, Rs.10,000 perhand held device and 2 per cent commission on transactions.The Government agreed to meet a part of the infrastructurecosts to kick start the project. For the scaled up project, it isexpected that the 2 per cent commission on turnover will bemaintained and banks will fund the infrastructure. However,the model may have to be different in States with lesserturnover, as fixed cost per village is almost the same. Thebanks pay Rs.1,000 to the village organisation member inthe village who is the representative of the BC of the bank.The cost of cards is a one-time exercise and enrolment ofbeneficiaries also involves an expense of Rs.50 per personin addition to the card cost.
The advantages to the bank are that the cost of transactionsis reduced and there is scope for other services like croploans, access to cheap savings in villages and micro-insurance, among others. The State Government can makeall its payments through this mechanism. This would includesalaries, pensions and contractor payments. The modelensures cost savings in the payment delivery mechanism andpayments can be made centrally from the district or the Stateheadquarters. An added benefit is that several bogusbeneficiaries have been weeded out because of bio-metricidentification and the State Government is expecting to savesubstantial amount on that account.
The model adopted for the project involves selection oftechnology and technology vendor by the bank; appointmentof a BC; finalising the operating procedures with respect totransactions entered between bank and BCs such asmovement of cash, crediting beneficiary accounts, paymentof fee/commission and control mechanism. Other aspects ofthe model are enrolment and collection of critical data aboutthe beneficiaries and issue of cards to them, training andsensitising the beneficiaries and meeting operational needsthrough ongoing support in servicing of instruments, constantmonitoring and periodic evaluation of the project forimprovement.
Rs.20,000 per beneficiary at a concessional interestrate of 4 per cent.5 Following the announcementmade in the Union Budget 2008-09, the Reserve Bankin July 2008, advised public sector banks (PSBs) that
the Government would provide interest subvention of2 per cent to PSBs in respect of short-term productioncredit up to Rs.3 lakh extended to farmers at 7 percent per annum.
5 This is over and above the individual loan of Rs.15,000 available under the DRI scheme at a concessional interest rate of 4 per cent forengaging in productive and gainful activities.

313
FINANCIAL INCLUSION
Corporation Bank has taken up an outreach programmethrough the use of technology in order to provide verysimple and basic financial services to the poor and thedisadvantaged in the rural areas. To accomplish the task,the bank conducted a survey in the identified villages togather information regarding the structure and size ofvillage, family/household details such as occupation, assetownership and the use of financial services. The automationof the survey facilitated generation of Corp Pragathi SavingsBank (CPSB) Account opening forms along with thephotograph of the user at the site for the family memberswho expressed their desire to open an account with the bank.
The survey, inter alia, indicated that the villagers weregenerally reluctant to approach the bank as the brancheswere far off from their residence or workplace and hencethey needed to spend money on commuting and time tocarry out normal banking activities. Further, being semi-literate or illiterate, they found the procedures difficult tocomprehend and follow. They were also not sure of thetreatment that would be meted out to them when theyapproached the bank for remitting or withdrawing smallsums of money. To mitigate these hardships faced by thevillagers, the Corporation Bank adopted a branchlessbanking model in August 2007. After evaluation of different
Box VII.8Branchless Banking through Business Correspondents
technologies ranging from palm-tops, simputers, hand heldstorage devices and diverse communication channels, thebank opted for a branchless banking model based onbusiness correspondents (BCs) and use of a small handheld device. This model is more or less similar to thatfollowed in pilot project in Andhra Pradesh (see Box VII.7).The branchless banking model has enabled the bank toreach out to the villagers by offering them savings and loanproducts at their doorsteps. The information collected throughsurvey has enabled to meet the KYC requirements also.
The benefits of the model to the customers include saving oftheir time and cost of travel to the branch, comfort in dealingwith BC as he is a familiar face, and convenience of transactingbusiness practically at any time of the day. The advantage forthe BC is that it is an alternative source of income. The benefitsfor the bank are that they are able to reach out to the hithertounreached segments and mop up rural savings at lowertransaction costs.
Reference:
Kamath, Raghav. 2007. Branchless Banking: Corp Bank’sAnswer for Financial Inclusion; CAB Call ing July-September; Vol. 31, No. 3.
7.67 To strengthen the rural credit delivery system,a revival package for the short-term rural co-operativecredit structure was announced recently. Based on therecommendations of the Task Force on Revival of RuralCo-operative Credit Institutions (Chairman: A.Vaidyanathan) and in consultation with State
Governments, the Government of India approved apackage for revival of the short-term rural co-operativecredit structure. So far, 20 States have executedMemoranda of Understanding (MoUs) with theGovernment of India and the NABARD, as envisagedunder the package. Seven States have made
There is generally a feeling that financial exclusion is aproblem only in rural areas. However, in reality, a largenumber of people in urban centres also do not have easyaccess to banking facilities and financial exclusion is verycommon even in urban areas, particularly in the case ofinformal sector workers who do not have regular jobs.Moreover, many migrants who do not have bank accountsand knowledge of banking facilities send money to their familymembers through informal sources such as friends, relativesor carry cash whenever they visit their native place.
The situation is not too different in Dharavi, Asia’s largestslum, in the country’s commercial capital, Mumbai. Dharaviis inhabited by about 300,000 to 350,000 workers many ofwhom do not have bank accounts. After the KYC normswere rationalised to enable opening of ‘no frills’ accounts,Indian Bank opened a core banking branch and ATM facilityin Dharavi in February 2007. The bank introduced smart
Box VII.9Urban Financial Inclusion – Dharavi (Mumbai) Model
card based banking which has enabled doorstep bankingtransactions for the slum dwellers. The facility has enabledthe workers to save and migrants are able to utilise theservices of easy and reliable remittance of money to theirfamily members at their places of origin. Life and healthinsurance products are also offered to the residents.
Thus, some financially excluded people in urban areashave been provided banking access. Indian Bank has nowalso extended the Dharavi model to Guntur town of AndhraPradesh and Tharamani, Chennai where the urban poordid not have bank accounts.
References:
1. Rajan, M.S.S. 2007. Replication of Financial Inclusion:Oppor tunit ies and Challenges – Indian BankExperience; CAB Calling July-September, Vol.31, No.3.
2. Indian Bank Website, www.indianbank.in

314
REPORT ON CURRENCY AND FINANCE
In developed countries, mortgage lending to people living indeprived parts of the country has been recognised as a keyinstrument of financial inclusion and is considered to act as acatalyst for economic and social development. Expansion ofmortgage finance to low income groups by mortgagecompanies, non-bank finance companies and banks seemsto have helped in bringing a large part of the financiallyexcluded population under the fold of the formal financialsystem in the developed countries. Housing associations indeveloped countries have taken a lead in combating financialexclusion amongst their tenants and residents and alsosupporting community financial institutions such as creditinstitutions through partnership and investment. Housingfinance is generally availed to invest in new houses or homeimprovements. There is also great diversity in the sources ofmortgage funding, including retail deposits, mortgage backedsecurities and covered bonds. In some countries such as theUK, alongside the competitive mainstream mortgage lending,there is access to mortgage credit for buyers with low housingequity, or uncertain incomes (HM Treasury, 2007). First timehousing buyers in particular, face difficulties in getting housingfinance. In order to provide affordable housing in the UK andScotland, mortgage lenders are working on the Government’sOpen Market Home Buy Scheme, a shared equity schemedesigned to finance first time buyers, workers and socialtenants. Furthermore, customers who are shared owners alsoget access to the other financial products and services offeredby the financial entity. Under this scheme both the Governmentand the lenders take responsibility for sharing equity inproperties to allow people to enter the housing market. Therehave also been innovations in the methods of delivery andoutreach work employed, for example, by entering intopartnerships with local housing associations. In the UK, theGovernment target is to deliver more than 70,000 newaffordable homes a year by 2010-11. In order to provide creditfacility to tenants who otherwise cannot obtain loans fromthe main financial institutions, the Royal Bank of Scotlandhas reached an agreement with the Grampian HousingAssociation to devise a new savings and loans scheme.
In the United States, the federal government introduced theCommunity Reinvestment Act in 1997, under which federalbank regulatory agencies rate banks on their efforts andeffectiveness at serving low-income communities. The maincriterion is mortgage loans but regulators also consider theextent to which banks make retail banking services availableto low and moderate income communities. The sub-prime
Box VII.10Housing and Financial Inclusion
mortgage or refinance loans are also recognised to haveled to spread of credit among the Black and Hispaniccommunities, who generally lack easy access to credit. TheLow-Income Housing Tax Credit (LIHTC) programme hasalso helped finance developments with units set aside forlow or moderate income households. The intent of theprogramme was to provide enough incentives to ensure anadequate supply of low-income housing by granting taxcredits to the owners of selected rental housing developedfor occupancy by low or moderate income households.Although the subsidy is provided entirely through the federaltax code, it is administered through state governmentagencies, generally the state housing finance agency. TheLIHTC programme has emerged as a primary mechanismfor encouraging the production of housing to be occupiedby low or moderate income households (Wallace 1995).
In the context of developed countries, it is argued that accessto mortgage finance could be enhanced if lenders restructuredand optimised the structure and processes associated withthe existing mortgage products to align more closely with theneeds and characteristics of the target market. Measures suchas improved loan servicing processes, redefined borrower,property or area criteria, loan level product features such asinsurance or collateral requirements, as well as portfoliointerventions such as guarantees are all mechanisms thatcould be considered. However, it is also contended that thereis a limit to the extent that mortgage products can facilitateaccess to housing finance across the target market. The natureof the housing needs and the financial and risk profile ofhouseholds in the target market underlines the need fordiversified housing finance products.
References:
1. Bank of Scotland. 2007. Delivering our FinancialInclusion Agenda in Scotland, March.
2. H.M. Treasury. 2007. Financial Inclusion: the WayForward, HM Treasury, UK, March.
3. Kempson, E. 2006. Policy Level Response to FinancialExclusion in Developed Economies: Lessons forDeveloping Countries, Paper for Access to Finance:Building Inclusive Financial Systems, World Bank,Washington, May.
4. Wallace, James E. 1995. Financing Affordable Housingin the United States, Housing Policy Debate 6(4).
necessary amendments in their Co-operativeSocieties Acts. The revival package for long-term ruralco-operative credit structure is also being worked out.The Union Budget 2008-09 announced that the CentralGovernment and the State Governments have reachedan agreement on the content of the package for revivalof the long-term co-operative credit structure. Asrecommended by the Committee on Financial
Inclusion in its interim Report, the Government hadannounced in the Union Budget 2007-08 the creationof two funds - Financial Inclusion Fund and FinancialInclusion Technology Fund with an overall corpus ofRs.500 crore each with NABARD - for meeting thecosts of development, as also promotional andtechnology interventions as recommended. TheGovernment indicated that for 2007-08, the initial

315
FINANCIAL INCLUSION
The Committee on Financial Inclusion was constituted bythe Government of India (Chairman Dr. C. Rangarajan) onJune 26, 2006 to prepare a strategy of financial inclusion.The Committee submitted its final Report on January 4,2008. The Repor t viewed financial inclusion as acomprehensive and holistic process of ensuring accessto financial services and timely and adequate credit,particularly by vulnerable groups such as weaker sectionsand low income groups at an affordable cost. Financialinclusion, therefore, according to the Committee, shouldinclude access to mainstream financial products such asbank accounts, credit, remittances and payment services,financial advisory services and insurance facilities.
The Report observed that in India 51.4 per cent of farmerhouseholds are financially excluded from both formal/informalsources and 73 per cent of farmer households do not accessformal sources of credit. Exclusion is most acute in Central,Eastern and North-Eastern regions with 64 per cent of allfinancially excluded farmer households. According to theReport, the overall strategy for building an inclusive financialsector should be based on (i) effecting improvements withinthe existing formal credit delivery mechanism; (ii) suggestingmeasures for improving credit absorption capacity especiallyamongst marginal and sub-marginal farmers and poor non-cultivator households; (iii) evolving new models for effectiveoutreach; and (iv) leveraging on technology based solutions.
Keeping in view the enormity of the task involved, theCommittee recommended the setting up of a mission modeNational Rural Financial Inclusion Plan (NRFIP) with a targetof providing access to comprehensive financial services toat least 50 per cent (55.77 million) of the excluded ruralhouseholds by 2012 and the remaining by 2015. This wouldrequire semi-urban and rural branches of commercial banksand RRBs to cover a minimum of 250 new cultivator andnon-cultivator households per branch per annum. The
Box VII.11Report of the Committee on Financial Inclusion
Committee has also recommended that the Governmentshould constitute a National Mission on Financial Inclusion(NaMFI) comprising representatives of all stakeholders forsuggesting the overall policy changes required, andsupporting stakeholders in the domain of public, privateand NGO sectors in undertaking promotional initiatives.
The major recommendations relating to commercial banksincluded target for providing access to credit to at least 250excluded rural households per annum in each rural/semi-urban branches; targeted branch expansion in identifieddistricts in the next three years; provision of customisedsavings, credit and insurance products; incentivising humanresources for providing inclusive financial services andsimplification of procedures for agricultural loans.
The major recommendations relating to RRBs areextending their services to unbanked areas and increasingtheir credit-deposit ratios; no further merger of RRBs;widening of network and expanding coverage in a timebound manner; separate credit plans for excluded regionsto be drawn up by RRBs and strengthening of their boards.
In the case of co-operative banks, the majorrecommendations were early implementation of VaidyanathanCommittee Revival Package; use of PACS and other primaryco-operatives as BCs and co-operatives to adopt groupapproach for financing excluded groups.
Other important recommendations of the Committee areencouraging SHGs in excluded regions; legal status forSHGs; measures for urban micro-finance and separatecategory of MFIs.
Reference:Government of India. 2008. Report of the Committee onFinancial Inclusion in India (Chairman Dr. C. Rangarajan).January.
contribution would be Rs.25 crore each in the twofunds by the Central Government, Reserve Bank andNABARD in the ratio 40:40:20. The Reserve Bank’sinitial contribution to the funds would come to Rs.10crore each. The Committee submitted its final report inJanuary 2008 (Box VII.11). The Committee on FinancialInclusion had also recommended that the StateGovernments should make payments under NationalRural Employment Guarantee Scheme and SocialSecurity Payments through such technology basedsolutions. The Reserve Bank has already requestedState Governments to explore the possibility of routingGovernment payments through banks with the help ofinformation and communication technology (ICT)(Government of India, 2008a and 2008b).
7.68 The Union Budget 2008-09 announced thatbanks would be encouraged to embrace the concept of
total financial inclusion. Subsequently, the Reserve Bankin April 2008 advised all SCBs to meet the entire creditrequirements of SHG members, viz., (a) incomegeneration activities; (b) social needs like housing,education, marriage; and (c) debt swapping. TheGovernment introduced a new Self-EmploymentScheme for rehabilitation of all the remaining scavengersand their dependents by March 2009. Scavengers andtheir dependents, irrespective of their income, who areyet to be provided assistance for rehabilitation, underany scheme of the Government of India/StateGovernments, are eligible for assistance. The identifiedscavengers would be provided training, loan and subsidy.Accordingly, the Reserve Bank, in April 2008, issuedbroad guidelines to be followed by the banks inimplementing the Scheme. Banks would provide loansto candidates sponsored only by State Channelising

316
REPORT ON CURRENCY AND FINANCE
Agencies of National Safai Karmacharis Finance andDevelopment Corporation (NSKFDC) and claim theadmissible capital subsidy from them for disbursementto the beneficiary. After disbursement of loan to thebeneficiaries, the concerned branch of the bank claimsinterest subsidy from the State Channelising Agency ona quarterly basis.
7.69 Recognising that lack of awareness is a majorfactor for financial exclusion, the Reserve Bank is takinga number of measures towards financial literacy andcredit counselling. The Reserve Bank has undertakena project titled “Project Financial Literacy”. The objectiveof the project is to disseminate information regardingthe central bank and general banking concepts tovarious target groups, including, school and collegegoing children, women, rural and urban poor, defencepersonnel and senior citizens. It would be disseminatedto the target audience with the help, among others, ofbanks, local government machinery, schools andcolleges through presentations, pamphlets, brochures,films, as also through the Reserve Bank’s website.
7.70 Furthermore, to promote financial literacy, amultilingual website in 13 Indian languages on all mattersconcerning banking and the common person waslaunched by the Reserve Bank on June 18, 2007. Comictype books introducing banking to school children werealso put on the Reserve Bank’s website on November14, 2007. Similar books would be prepared for different
target groups such as rural households, urban poor,defence personnel, women and small entrepreneurs.Financial literacy programmes are being launched ineach State with the active involvement of the StateGovernments and the SLBC. The Reserve Bank has alsobeen initiating measures for providing credit counselling.Each SLBC convenor has been asked to set up a credit-counselling centre in one district as a pilot and extend itto all other districts in due course. A concept paper onfinancial literacy and credit counselling has beenprepared and placed on the Reserve Bank’s website forpublic comments and the responses are being examined.
7.71 India has followed a multi-pronged strategyto promote financial inclusion. The global experiencealso suggests that countries that allow diversity inapproaches are more likely to achieve better results.Diversity in approaches not only serves better thediverse demand for financial services, but alsoreduces systemic risks, increases competition, andimproves efficiency. Many other countr ies alsofollowed more or less a similar approach (Box VII.12).
7.72 The problem of financial exclusion is found evenin several advanced countries. These countries havealso initiated specific measures to bring financiallyexcluded people within the fold of the banking system.The measures initiated, among others, include voluntarycode of practices, legislation-backed norms, basic bankaccounts and subsidised accounts (Box VII.13).
Historically, Governments in many countries intervened on thesupply side to address access to financial services in variousways. Religious and other civil society organisations have alsosought to broaden access to formal financial services for thepoor and low-income people. These measures include (i)nationalising private banks; (ii) branch regulations; (iii) promotingspecialised banks including national savings banks; (iv) directiveson portfolio composition; (v) interest rate ceilings on credit tolow-income households, and provision of credit at subsidisedrates to priority sectors; (vi) voluntary charter or codes developedby banks themselves; (vii) enactment of legislations defining theright of access to formal banking services; (viii) setting up ofempowered and dedicated agencies by Governments; (ix)running specialised and sponsored schemes including thosesponsored by Governments and banks themselves using a blendof innovations, reforms in the existing structures of credit deliveryand the existing infrastructure like post offices and passportaccounts; (x) countering the operations of moneylenders, and(xi) community-based savings and credit societies and mutualsavings banks, which in a way can be seen as precursors of themodern micro-finance movement.
For instance, in Bangladesh, the Government while providingnecessary space for NGOs to play the lead role in pushing
Box VII.12Financial Inclusion Strategy in Select Countries
the frontier of finance for the poor and by facilitating theestablishment of the Grameen Bank, continued using thestate-owned Krishi Bank (agriculture bank) and BuildingResources Across Community (BRAC) extensively to provideaccess to credit and deposit services for low-incomehouseholds. Most Asian countries, including Sri Lanka andPakistan also resorted to nationalisation of private banks toexpand banking services to the excluded and establishednew state-owned banks to serve low-income segments. Thestrategy, inter alia, includes micro-finance development plans,expansion of branch networks, promotion of Islamic banking,and promotion of application of new information andcommunication technology to reach rural people.
References:
1. Kempson E, A. Atkinson and O. Pilley. 2004. “Policy LevelResponse to Financial Exclusion in DevelopedEconomies: Lessons for Developing Countries.” Universityof Bristol.
2. World Bank. 2008. Finance for All – Policy and Pitfalls inExpanding Access. The World Bank, Washington, D.C.

317
FINANCIAL INCLUSION
Box VII.13Financial Inclusion Initiatives in Different Countries
Objectives
To reduce social exclusion, of which financial inclusion is an integral part
To look in an integrated way at the problems of poor neighbourhoods
1. To enforce consumer protection law and competition law
2. To review proposed mergers and conduct market studies
1. Access to banking, access to affordable credit
2. Access to free face-to-face money advice
1. Access to banking services
2. Access to affordable credit
3. Access to money advice
1. Prohibits discrimination by banks against low and moderate income neighbourhoods
2. To make mortgage loans to lower-income households
3. Banks are rated every three years on their efforts in meeting community credit needs
1. Personal savings in Individual Development Accounts (IDAs) are matched by local and national funds
2. Matching money has to be spent on one of a range of prescribed uses such as education, businessor home purchase
1. Any person with French nationality has the right to open an account with any bank
2. If refused, the aggrieved person can apply to the Banque de France to designate a bank thatshould open an account
Committed to providing
• Affordable account
• Cash card
• Free access to a cash machine• Distance payment facilities
• Bank statement
• Negotiable number of cheques
1. Reiterated the Banking Act of 1984
2. Extended right to transaction account to those banned due to bad credit history
3. Allowed bounced cheque, an extra month, for correction
1. Generic Account was introduced in 2002
2. Staff to give information about suitable accounts to low-income customers
3. Face-to-face banking services even after branch closure through alternative means such asfranchising
4. Three months written notice to customers before closing any branch
1. To provide banking and other transaction services to communities without banking facilities2. Using existing stores and post offices or stand–alone centres
3. Install Electronic Point of Sale (EPOS) equipment in post offices
1. Provide a basic bank account with no minimum balance and without overdraft facilities
2. Credit transfers, direct debits, and deposit and withdrawal facilities
3. If refused, customer must be informed the reasons, i.e., laundering, bad credit history, etc.
Sanctions if principles of Charter on Basic Banking Services, 1996 are not applied
1. Personal bank accounts to all Canadians regardless of employment or credit history and withminimum identification requirements
2. Banks/FIs to encash government cheques at no charge
1. Supervising provisions on consumers under Canada’s Bank Act2. Access to basic banking
3. Consumer protection measures and expanding consumer education
4. Rural banking, i.e., it requires bank to give four months notice of branch closures and six monthsnotice if it is the only branch in a range of 10 km
Country
United Kingdom
Legislation/Instrument/Policy Scheme
Social Exclusion Unit(SEU), 1997
Policy Action Teams (PATs)
Office of Fair Trading
Financial Inclusion TaskForce
Financial Inclusion Fund
The CommunityReinvestmentAct, 1977
Matched Savings Scheme(MSS) 1997
Banking Act, 1984
French Bankers’Association (Basic BankingServices Charter of 1992)
Law on Exclusion, 1998
Australian Bankers’Association (ABA) Code ofPractice, 1995
Rural TransformationCentre Programme (RTCP)
Charter on Basic BankingServices, 1996
Basic Banking Act, 2003
Access to Basic BankingServices Regulations, 2003
Financial Consumer Agencyof Canada (FCAC), 2001
United Statesof America
France
Australia
Belgium
Canada

318
REPORT ON CURRENCY AND FINANCE
7.73 To sum up, a wide paraphernalia ofinstitutional framework has been established by theReserve Bank and the Government to ensure betterbanking penetration and outreach so that the creditneeds of agriculture and small enterprises are metwhile allowing sufficient flexibility to banks to evolvetheir own policies and strategies for the purpose. Whilethe policy initiatives towards financial inclusion in Indiastarted in the late 1960s, the focus through the 1970sand the 1980s was on channelling credit to ensureequitable growth. In the 1990s and the 2000s, micro-credit emerged as the main instrument for financialinclusion.
V. AN ASSESSMENT OF FINANCIAL INCLUSION/EXCLUSION IN INDIA
7.74 As discussed in the previous section,widening of access to financial services has been oneof the prime objectives of financial sector policies ingeneral and banking sector policies in particular. Theinitiatives towards broadening the access of thebanking sector in India began in the late 1960s. Asdetailed in Chapter III, banking sector policies wereshaped by the continuous concern regarding a largesegment of population left out of the fold of the formalfinancial system, especially in rural areas. Theinitiatives taken by the Reserve Bank and theGovernment of India towards promoting financialinclusion since the late 1960s have considerablyimproved the access to the formal f inancialinstitutions. Apart from SCBs, RRBs, co-operativebanks and societies, post offices and insurancecompanies have played an important role in meetingthe f inancial needs of people. However,comprehensive data on the progress of variousaspects of financial inclusion are not available readily.The analysis in this section, therefore, is based onpieces of partial information from various sourcessuch as All India Debt and Investment Survey (AIDIS)released once in a decade by the National SampleSurvey Organisation (NSSO)
6 and various banking
data brought out by the Reserve Bank from time totime. The analysis is also supplemented by the databased on the surveys conducted by NCAER-Max NewYork Life and India Invest Market Solutions (IIMS).The latest survey released by the NSSO related tothe reference year 2002, with a sample size of143,285 households (91,192 in the rural sector and52,093 in the urban sector), which constituted 0.07per cent of the total number of households (203.4
million) in the country. The NCAER-Max New York Lifesurvey was conducted for the year 2004-05 with asample size of 63,016 households, which were usedto project estimates for 205.9 million households. TheIIMS survey was carried out for the year 2006-07,providing estimates for 321 million earners in thecountry based on a sample of 100,000 respondents.An earner was defined as a person who was in theage of 18-59 years and getting some cash income.
7.75 Apart from survey data conducted by theNSSO and other agencies, and the banking dataobtained through Basic Statistical Returns (BSR) ofSCBs, data relating to PACS, UCBs, post offices,insurance companies and SHGs/MFIs are alsoanalysed. Since different data sets are based ondifferent methodologies and definitions, one needsto exercise caution while interpreting different datasets and comparing them. The latest NSSO datarelate to the decade ended 2002. In recent years,several initiatives have been taken to increase the flowof credit to the agricultural sector and provide accessto banking services, especially to the lower incomesegments. There is, therefore, also a need to takeinto account the data beyond 2002 for assessing thecurrent status of financial inclusion. For this purpose,BSR data have been used. The AIDIS survey of NSSOprovides information only on household indebtedness;it does not provide information on savings deposits.The major limitation of BSR data, on the other hand,is the multiple accounts held by a single person whichmakes it difficult to draw firm conclusions about theextent of financial inclusion/exclusion. An assessmentof the progress of financial inclusion in India attemptedin this section is, thus, subject to certain limitationsand non-availability of relevant data.
Financial Inclusion: Credit side (Analysis Basedon Surveys)
7.76 The AIDIS of NSSO, which was first institutedby the Reserve Bank in 1951 as All India Rural CreditSurvey, provides information on the pattern ofhouseholds’ indebtedness. The survey is conductedon a decadal basis. The first three surveys, however,collected information in respect of rural householdsonly. Beginning from the fourth survey in 1981,information on indebtedness of urban households hasalso been provided.
7.77 The number of indebted households, inabsolute terms as also as percentage of total
6 First two rounds of AIDIS were brought out by the Reserve Bank.

319
FINANCIAL INCLUSION
Table 7.4: Number of Indebted Households(Million)
End-June Rural Urban Total
1 2 3 4
1961 43.1 @ 43.1@(62.8) (62.8)
1971 31.8 @ 31.8@(41.3) (41.3)
1981 18.2 5.0 23.2(19.4) (17.2) (18.9)
1991 27.2 8.1 35.3(23.4) (19.3) (22.3)
2002 39.2 9.9 49.1(26.5) (17.8) (24.1)
@: Surveys of 1961 and 1971 collected information on ruralhouseholds only.
Note : Figures in parentheses indicate number of indebtedhouseholds as percentage of total households.
Source : AIDIS survey; various rounds.
Table 7.5: Outstanding Households' Debt(Amount in Rupees crore)
End-June Rural Urban Total
1 2 3 4
1961 2,789 @ 2,789 @(21.4) (21.4)
1971 3,752 @ 3,752 @(12.2) (12.2)
1981 6,193 3,023 9,216(6.2) (4.3) (5.4)
1991 22,211 15,232 37,443(6.3) (5.1) (5.7)
2002 1,11,468 65,327 1,76,795 (9.4) (5.1) (7.2)
Compound Annual Growth Rate in Nominal Terms (per cent)
1961-71 3.0 @ 3.0 @
1971-81 5.1 @ 5.1 *
1981-91 13.6 17.6 15.0
1991-2002 15.8 14.2 15.2
Compound Annual Growth Rate at 1999-2000 Prices (per cent)
1961-71 -3.2 @ -3.2 @
1971-81 -3.7 @ -3.7 *
1981-91 4.3 7.9 5.6
1991-2002 8.5 7.0 7.9
@: Surveys of 1961 and 1971 collected information on ruralhouseholds only.
* : Pertains to rural households.Note : Figures in parentheses are per cent of GDP at current
market prices. Rural/urban GDP at current market pricesis arrived at by applying the share of rural/urban NDP intotal NDP published in National Accounts Statistics, CentralStatistical Organisation (CSO).
Source : AIDIS survey; various rounds.
households, declined sharply during the periodbetween 1961 and 1981. Thereafter, however,household indebtedness, both in terms of number ofindebted households and households with debt aspercentage of total households, increasedsignificantly both in rural and urban areas, barringmarginal decline in number of indebted householdsin relation to total households in urban areas. Overall,nearly 24 per cent of the total households in Indiawere indebted in 2002 as compared with around 22per cent in 1991. The share of rural indebtedhouseholds in the total indebted householdsincreased from around 77 per cent in 1991 to around80 per cent in 2002. Indebtedness (households withdebt as percentage of total households) was largerin rural areas than that in urban areas. Furthermore,the gap between rural/urban indebtedness widenedin 2002 as compared with 1991 (Table 7.4). Accordingto another survey released by the NCAER in 2008, atend-June 2005, 23.9 per cent (49.2 million) of allIndian households had loans outstanding with the ratiobeing 20.9 per cent (12.8 million) in urban and 25.2per cent (36.4 million) in rural areas (NCAER, 2008).
7.78 According to the various rounds of surveys,the aggregate amount of outstanding debt of ruralhouseholds, in nominal terms, increased significantlyduring all the previous four decades (1960s, 1970s,1980s and 1990s). The outstanding debt of urbanhouseholds also increased in the 1980s and the1990s. The increase in debt of rural households, bothin nominal and real terms, in the 1990s was thelargest in any decade. The outstanding debt, innominal terms, in rural areas during 1991-2002 grew
at an annual compound rate of 15.8 per cent, whilein real terms it grew by 8.5 per cent (4.3 per cent inthe 1980s). In urban areas, the outstanding debt, bothin nominal and real terms, between 1991 and 2002grew at a somewhat lower rate than in rural areas(Table 7.5).
7.79 Outstanding debt per indebted household inreal terms both in rural and urban areas increasedsharply between 1991 and 2002 (Table 7.6).
7.80 Both in rural and urban areas, theindebtedness generally increased with the increasein income levels [represented by asset holding classes(AHCs)]. The pattern of indebtedness across differentAHCs in rural and urban households remained broadlyunchanged between 1991 and 2002 (Table 7.7). Theincrease in indebtedness in higher AHCs was, interalia, on account of their enhanced capacity to borrowby providing collateral, increased level of confidence

320
REPORT ON CURRENCY AND FINANCE
Table 7.6: Outstanding Debt perIndebted Household
(Rupees)
End-June Rural Urban Total
1 2 3 4
Nominal Terms1961 647 @ 647@1971 1,180 @ 1,180@1981 3,411 5,996 3,9721991 8,166 18,805 10,6072002 28,443 65,983 36,006
At 1999-00 Prices1961 12,629 @ 12,629@1971 12,356 @ 12,356@1981 14,904 26,200 17,3591991 15,105 34,785 19,6212002 25,711 59,645 32,548
@: Surveys of 1961 and 1971 collected information on ruralhouseholds only.
Source : AIDIS survey; various rounds.
Table 7.7: Indebtedness of Households –Asset Holding-wise*
(Per cent)
Asset Holding End-June 1991 Asset Holding End-June 2002(Rs.’000)
Rural Urban(Rs.’000)
Rural Urban
1 2 3 4 5 6
Less than 5 11.8 9.6 Less than 15 15.0 10.75-10 19.9 13.8 15-30 19.0 14.810-20 20.3 18.1 30-60 25.2 14.820-30 24.1 17.2 60-100 26.5 18.330-50 24.5 19.6 100-150 28.9 19.750-70 23.9 20.1 150-200 28.7 20.070-100 24.0 22.6 200-300 28.7 19.9100-150 26.9 24.7 300-450 28.7 18.7150-250 25.6 25.8 450-800 31.0 22.5More than 250 29.7 25.2 More than 800 32.9 21.4
All 23.4 19.3 All 26.5 17.8
*: Indicates the number of indebted households as percentage oftotal households under each asset holding class (AHC).
Source: NSSO 48th and 59th round surveys.
of lenders, higher financing requirements of suchhouseholds and their awareness about availability ofdifferent sources of finance.
7.81 Institutional (Government, co-operativesocieties and banks) and non-institutional (landlordsand moneylenders) sources are broadly the two mainsources from which households borrow. Between1981 and 1991, the share of number of householdsindebted to institutional sources increased sharply,while that of indebted to non-institutional sourcesdeclined correspondingly. Between 1991 and 2002,the number of households indebted to institutionalsources in absolute terms, both in rural and urbanareas, continued to increase. However, reversing thetrend of previous three decades, the share ofhouseholds indebted to institutional sources in thetotal indebted households declined, while that ofhouseholds indebted to non-institutional sourcesincreased. The decline was relatively morepronounced among rural households and was due todecline in recourse to all the three major institutionalagencies, viz . , Government depar tments, co-operative societies and commercial banks (Table 7.8).According to the Report of the Committee on FinancialInclusion (Government of India, 2008), as per NSSOdata, 45.9 million farmer households in the countryout of a total of 89.3 million households do not accesscredit, either from institutional or non-institutionalsources. A more or less similar trend was observed
in the pattern of outstanding household debt. Theshare of institutional sources, which had increasedsharply between 1981 and 1991, declined between1991 and 2002 (Table 7.9).
7.82 The pattern of indebtedness of thehouseholds across different AHCs, representing theincome levels, shows that the recourse to non-institutional sources is relatively high, both in ruraland urban areas, by lower income groups. In otherwords, as the income levels go up, the proportion ofpeople borrowing from non-institutional sources tendsto decrease (Table 7.10).
7.83 This is corroborated by Invest India Incomes andSavings Survey (2007)7 conducted by IIMS which alsosuggests that the earners at higher income level borrowmore from institutional sources than non-institutionalsources. The survey found that 70 per cent earners inthe annual income bracket of more than Rs.400,000borrowed from institutional sources as compared withonly 27.5 per cent in the case of earners in the incomebracket of less than Rs.50,000 (Table 7.11).
7.84 The relatively increased rel iance ofhouseholds with low income on non-institutionalsources could be due to several factors. At low incomelevels, requirements generally include borrowings forpurposes for which loans are not readily available frominstitutional sources. The inability to provide collateral
7 The survey provided estimates for 321 million earners in the country based on a sample of 100 thousand respondents.

321
FINANCIAL INCLUSION
to take recourse to the formal financial system couldbe another significant factor. On the other hand, thegreater indebtedness of the higher AHCs toinstitutional sources, amongst both the rural and urbanhouseholds, could be on account of their enhancedcapacity to borrow, increased level of confidence oflenders in them, higher financing requirements of suchhouseholds and their greater awareness aboutavailability of different sources of finance.
7.85 According to the NSSO’s 59th round survey,the share of non-insti tut ional sources in the
outstanding household debt increased sharply in 2002as compared with 1991. A major reason for increasein the overall household debt and the increase in theshare of households indebted to non-institutionalsources between 1991 and 2002 was a significantincrease in current farm expenditure and householdexpenditure, especially in rural areas (Table 7.12). The‘household expenditure’ includes expenditure incurredon purchase of residential plot; purchase,construction, addition/alteration of building forresidential purposes; purchase of durable household
Table 7.8: Number of Indebted Households - Institutional versus Non-institutional Sources
(End-June)
Credit Agency Rural Urban Total
1961 1971 1981 1991 2002 1981 1991 2002 1981 1991 2002
1 2 3 4 5 6 7 8 9 10 11 12
Million
I. Institutional Agencies 7.5 7.6 8.9 18.2 19.8 2.3 4.9 5.2 11.2 23.1 25.0 – (0.2) (1.5) (7.4) (0.8) – (7.9) (0.4) – (7.5) (0.7)
Of which:(i) Government 3.7 2.6 1.0 2.0 1.2 0.5 1.0 0.6 1.4 2.9 1.7(ii) Co-operative societies 6.9 5.9 6.1 7.8 10.2 1.1 2.0 2.0 7.1 9.8 12.2
– (-1.5) (0.3) (2.6) (2.5) – (6.9) (-0.2) – (3.3) (2.0)(iii) Commercial banks 0.3 0.3 2.9 8.7 8.4 0.7 1.5 1.8 3.6 10.3 10.2
– (2.1) (24.0) (11.6) (-0.3) – (8.2) (1.3) – (11.0) (-0.1)
II. All Non-institutional Agencies 35.6 24.2 9.3 11.4 22.9 2.7 3.9 5.2 12.0 15.3 28.1– (-3.8) (-9.1) (2.1) (6.5) – (3.7) (2.6) – (2.5) (5.7)
Of which:(i) Landlords 0.6 3.6 1.1 1.3 0.6 0.1 0.1 0.1 1.2 1.4 0.6(ii) Agricultural moneylenders 22.0 8.2 2.4 2.7 4.9 0.1 0.2 0.1 2.5 2.8 5.0(iii) Professional moneylenders 7.6 5.0 1.9 3.6 10.2 0.8 1.4 2.7 2.7 5.0 12.9
III. All Agencies 43.1 31.8 18.2 27.2 39.2 5.0 8.1 9.9 23.2 35.3 49.1 – (-3.0) (-5.5) (4.1) (3.4) – (4.8) (1.9) – (4.3) (3.0)
Per cent to Total Indebted Households
I. Institutional Agencies 17.3 24.0 48.8 66.7 50.6 46.0 61.1 52.2 48.2 65.4 50.9
Of which:(i) Government 8.6 8.3 5.4 7.3 3.0 9.0 11.9 5.6 6.2 8.3 3.5(ii) Co-operative societies 15.9 18.5 33.4 28.6 26.0 20.9 25.4 20.2 30.7 27.9 24.9(iii) Commercial banks 0.6 1.1 16.0 32.1 21.5 14.0 19.2 18.0 15.5 29.1 20.8
II. All Non-institutional Agencies 82.7 76.0 51.2 41.9 58.5 54.0 48.7 52.8 51.8 43.4 57.3
Of which:(i) Landlords 1.4 11.2 6.2 4.7 1.5 1.4 1.0 0.6 5.1 3.9 1.3(ii) Agricultural moneylenders 51.0 25.8 13.2 9.8 12.5 2.2 2.1 1.1 10.8 8.1 10.2(iii) Professional moneylenders 17.7 15.7 10.5 13.2 26.0 16.4 17.6 27.5 11.8 14.2 26.3
III. All Agencies 100.0 100.0 100.0 100.0 100.0 100.0 100.0 100.0 100.0 100.0 100.0
– : Not available.
Note : 1. Figures in parentheses are compound annual growth rates.2. Sub-components may not add to total due to borrowings from multiple agencies.
Source : All India Debt and Investment Survey (AIDIS), various rounds.

322
REPORT ON CURRENCY AND FINANCE
assets, clothes, among others and expenditure onmedical treatment, education, marr iages, andceremonies (Annex VII.1). Thus, the ‘householdexpenditure’ includes many items for whichhouseholds may find it difficult to obtain loans frominstitutional sources.
7.86 The Invest India Incomes and Savings Surveyfor the recent period (IIMS, 2007) also suggests thata large portion of loan is taken by the households formeeting financial emergency, medical emergency and
social obligations. These three purposes accountedfor about 53 per cent of the loans availed of byindebted earners. Furthermore, more than 60 per centearners, indebted to non-institutional sources, tookloans for the aforesaid three purposes (Table 7.13). Inthe case of emergencies, people may find it convenientto approach non-institutional sources for their creditneeds. Financial emergencies, for instance, includeunplanned expenditure on business, consumption andmarriage, among others, which may not be financedby banks and other institutional agencies.
Table 7.9: Outstanding Households Debt - Institutional versus Non-institutional Sources
(End-June)
Credit Agency Rural Urban Total
1951 1961 1971 1981 1991 2002 1981 1991 2002 1981 1991 2002
1 2 3 4 5 6 7 8 9 10 11 12 13
Amount in Rs. crore
I. Institutional Agencies – 413 1,094 3,794 14,215 63,648 1,813 10,662 49,060 5,606 24,878 1,12,708 – – (10.2) (13.2) (14.1) (14.6) – (19.4) (14.9) – (16.1) (14.7)
Of which:
(i) Government – 147 250 247 1,355 2,564 443 1,691 4,965 689 3,046 7,529
(ii) Co-operative societies – 255 753 1,773 4,798 30,431 528 2,620 13,392 2,302 7,417 43,823 – – (11.4) (8.9) (10.5) (18.3) – (17.4) (16.0) – (12.4) (17.5)
(iii) Commercial banks – 12 82 1,736 7,485 27,310 679 3,290 19,402 2,415 10,775 46,712 – – (21.6) (35.7) (15.7) (12.5) – (17.1) (17.5) – (16.1) (14.3)
II. All Non-institutional Agencies – 2,376 2,658 2,399 7,996 47,820 1,210 4,570 16,266 3,610 12,566 64,086– – (1.1) (-1.0) (12.8) (17.7) – (14.2) (12.2) – (13.3) (16.0)
Of which:
(i) Landlords – 25 324 247 888 1,115 30 91 131 276 980 1,245
(ii) Agricultural moneylenders – 1,281 867 531 1,577 11,147 109 152 588 640 1,729 11,735
(iii) Professional moneylenders – 416 517 512 2,332 21,848 269 1,401 8,623 781 3,734 30,471
III. All Agencies – 2,789 3,752 6,193 22,211 1,11,468 3,023 15,232 65,327 9,216 37,443 1,76,795 – – (3.0) (5.1) (13.6) (15.8) – (17.6) (14.2) – (15.0) (15.2)
Per cent to Total Outstanding Debt
I. Institutional Agencies 7.2 14.8 29.2 61.3 64.0 57.1 60.0 70.0 75.1 60.8 66.4 63.8
Of which:
(i) Government 3.7 5.3 6.7 4.0 6.1 2.3 14.6 11.1 7.6 7.5 8.1 4.3
(ii) Co-operative societies 3.5 9.1 20.1 28.6 21.6 27.3 17.5 17.2 20.5 25.0 19.8 24.8
(iii) Commercial banks * 0.4 2.2 28.0 33.7 24.5 22.5 21.6 29.7 26.2 28.8 26.4
II. All Non-institutional Agencies 92.8 85.2 70.8 38.7 36.0 42.9 40.0 30.0 24.9 39.2 33.6 36.2
Of which:
(i) Landlords 3.5 0.9 8.6 4.0 4.0 1.0 1.0 0.6 0.2 3.0 2.6 0.7
(ii) Agricultural moneylenders 25.2 45.9 23.1 8.6 7.1 10.0 3.6 1.0 0.9 6.9 4.6 6.6
(iii) Professional moneylenders 46.4 14.9 13.8 8.3 10.5 19.6 8.9 9.2 13.2 8.5 10.0 17.2
III. All Agencies 100.0 100.0 100.0 100.0 100.0 100.0 100.0 100.0 100.0 100.0 100.0 100.0
– : . Not available. * : Included under co-operative societies.Note : Figures in parentheses are compound annual growth rates.Source : All India Rural Credit Survey, 1951-52, and various rounds of AIDIS.

323
FINANCIAL INCLUSION
Table 7.10: Distribution of Indebted Households to Institutional and Non-Institutional Credit Agencies*
(Per cent)
Asset Holding End-June 1991 Asset Holding End-June 2002 (Rs.’000) Institutional Non- All (Rs.’000) Institutional Non- All
Institutional Institutional
1 2 3 4 5 6 7 8
Rural Households
Less than 5 44.9 62.7 107.6 Less than 15 24.0 80.0 104.05-10 49.2 51.8 101.0 15-30 32.6 73.2 105.810-20 52.7 53.2 105.9 30-60 34.5 70.2 104.820-30 64.3 39.4 103.7 60-100 41.1 66.8 107.930-50 62.4 44.9 107.3 100-150 47.1 61.9 109.050-70 66.1 42.3 108.4 150-200 50.9 59.6 110.570-100 70.0 40.0 110.0 200-300 56.4 54.7 111.1100-150 72.1 41.6 113.8 300-450 65.2 46.0 111.1150-250 78.9 34.4 113.3 450-800 71.0 41.9 112.9More than 250 85.9 26.6 112.5 More than 800 81.2 31.3 112.5All 66.7 41.9 108.5 All 50.6 58.5 109.1
Urban Households
Less than 5 30.2 75.0 105.2 Less than 15 13.1 88.8 101.95-10 35.5 73.2 108.7 15-30 16.2 86.5 102.710-20 48.6 59.1 107.7 30-60 30.4 74.3 104.720-30 47.1 53.5 100.6 60-100 39.3 65.0 104.430-50 57.1 54.6 111.7 100-150 42.1 61.9 104.150-70 59.7 52.2 111.9 150-200 44.5 60.0 104.570-100 54.9 51.8 106.6 200-300 55.8 50.8 106.5100-150 76.9 40.9 117.8 300-450 64.7 43.9 108.6150-250 67.8 43.0 110.9 450-800 75.1 32.0 107.1More than 250 84.1 27.4 111.5 More than 800 86.4 19.6 106.1All 61.1 48.7 109.8 All 52.2 52.8 105.1
* : Percentage distribution of indebted households between institutional and non-institutional sources under each AHC.Note : Total exceeds 100 as some households borrowed from both sources.Source : NSSO, 48th and 59th round surveys.
7.87 The AIDIS is the single most important sourceof data for assessing financial inclusion, at least forassessing the availability of credit. According to thisdata source, as alluded to earlier, the share ofinstitutional sources in household debt declinedbetween 1991 and 2002, while that of non-institutionalsources increased. However, a detailed analysissuggests that institutional sources continued toprovide credit in the 1990s broadly at the same paceas in the 1980s as is borne out by the following points.First, the total number of indebted households andthe number of indebted households as percentage oftotal households in rural areas, which had declinedsignificantly between 1961 and 1981, increasedsharply between 1981 and 1991 and between 1991and 2002. Outstanding debt of rural households,which had declined in relation to GDP between 1961and 1981, increased marginally between 1981 and1991, but significantly between 1991 and 2002. As a
result, the debt to asset ratio in rural areas increasedsignificantly from 19.9 per cent in 1981 to 23.4 percent in 1991 and further to 26.5 per cent in 2002.However, a major reason for increased indebtednessbetween 1991 and 2002 was the sharp increase innumber of indebted rural households, who borrowedfor current farm expenditure, productivity of which,inter alia, depends on monsoon and other factors, andfor household expenditure. As a result, in relativeterms, the share of institutional sources declinedsignificantly between 1991 and 2002. In absoluteterms, the number of households indebted to banksremained more or less at the same level between1991 and 2002, while those indebted to co-operativesocieties increased (refer Table 7.8). Outstandinghousehold debt from institutional agencies grew at acompound annual rate of 14.7 per cent between 1991and 2002, more or less comparable to the growth rateof 16.1 per cent between 1981 and 1991. Outstanding

324
REPORT ON CURRENCY AND FINANCE
Table 7.11: Sources of Loans by Income Groups – IIMS Survey*
(Per cent of Indebted Earners@)
Loan Agencies/ Annual Less than Rs.50,000 to Rs.100,000 to Rs.200,000 to More than TotalIncome Range Rs.50,000 Rs.100,000 Rs.200,000 Rs.400,000 Rs. 400,000
1 2 3 4 5 6 7
I. Institutional Sources 27.5 46.0 59.4 60.2 70.5 32.8(i) Banks 13.0 34.5 49.3 51.6 62.8 19.1 #(ii) Co-operative societies 4.9 6.7 8.6 3.6 4.1 5.3(iii) Micro-finance institutions 1.1 1.0 0.7 0.5 2.4 1.1(iv) Self-help groups 8.5 3.9 0.8 4.5 1.2 7.3
II. Non-institutional Sources 72.5 54.0 40.6 39.8 29.5 67.2(i) Relatives / friends 35.1 32.1 26.5 22.2 22.1 33.9(ii) Moneylenders 34.9 19.6 12.0 11.8 5.5 30.8(iii) Others 2.5 2.3 2.1 5.8 1.9 2.5
III. Total 100.0 100.0 100.0 100.0 100.0 100.0
* : Respondents reported to have taken loans from various agencies during the preceding two years of the survey date. The survey was com-pleted in July 2007.
@ : An earner is defined as a person who is in the age of 18-59 years and getting some cash income.# : As per the survey, around 15 million earners took loans from banks which are comparable with around 17 million additional credit accounts
opened by banks during 2005-07, as per BSR data.Note : There may be an overestimation in the percentage of respondents reporting to have taken loans due to loans from multiple agencies.Source : Invest India Market Solutions (IIMS), 2007.
households’ debt from banks grew at a compound rateof 14.3 per cent between 1991 and 2002, which wasmoderately lower than the annual compound growth
rate of 16.1 per cent between 1981 and 1991.Outstanding debt from co-operative societies,however, grew at a higher annual compound rate of
Table 7.12: Purpose of Loans Taken by Households – NSSO Survey(End-June)
1991 2002 1991 2002
Purpose of Loan Rural Urban Rural Urban Rural Urban Rural Urban
1 2 3 4 5 6 7 8 9
Number of Indebted Households (million) Outstanding Debt (Rs. crore)
I. Farm Business 6.3 0.3 15.1 0.5 5,442 545 45,702 3,397(i) Current Expenditure 1.3 0.0 7.5 0.2 600 15 15,828 1,241(ii) Capital Expenditure 3.0 0.2 8.1 0.3 2,665 378 29,873 2,156
II. Non-Farm Business 3.3 1.2 4.3 1.5 2,865 3,163 13,376 12,869(i) Current Expenditure 0.9 0.3 1.2 0.5 444 605 3,121 2,090(ii) Capital Expenditure 1.7 0.6 3.1 1.1 1,288 1,634 10,255 10,779
III. Household Expenditure 12.4 6.3 22.9 8.2 8,840 11,152 52,390 49,060IV. Unspecified 6.3 0.4 – – 5,064 372 – –V. Total 27.2 8.1 39.2 9.9 22,211 15,232 1,11,468 65,327
Per cent to Total
I. Farm Business 23.2 3.6 38.5 5.1 24.5 3.6 41.0 5.2(i) Current Expenditure 4.7 0.5 19.2 2.2 2.7 0.1 14.2 1.9(ii) Capital Expenditure 11.1 2.1 20.8 2.8 12.0 2.5 26.8 3.3
II. Non-Farm Business 12.0 14.9 10.9 15.2 12.9 20.8 12.0 19.7(i) Current Expenditure 3.4 4.1 3.0 5.1 2.0 4.0 2.8 3.2(ii) Capital Expenditure 6.4 7.8 7.9 10.7 5.8 10.7 9.2 16.5
III. Household Expenditure 45.6 77.5 58.5 82.6 39.8 73.2 47.0 75.1IV. Unspecified 23.1 4.7 – – 22.8 2.4 – –V. Total @ @ @ @ 100.0 100.0 100.0 100.0
@ : The sum of sub-totals in respect of number of indebted households may exceed 100 as loans may have been taken for more than onepurpose by a single household.
Note : For 1991, farm and non-farm business also includes other expenditure.Source : NSSO, 48th and 59th Round Surveys.

325
FINANCIAL INCLUSION
17.5 per cent between 1991 and 2002 than 12.4 percent between 1981 and 1991 (refer Table 7.9). It isalso significant to note that these growth rates wereachieved on a large base as the growth rate between1981 and 1991 was significantly high.
7.88 Second, some deceleration in bank credit tohouseholds needs to be seen in the context of change
in banks’ behaviour in the 1990s due to their impairedbalance sheets. During the 1990s, banks’ healthbecame a major concern, as a result of which theirfocus shifted from expanding credit por tfolio tostrengthening balance sheets by investing ingovernment securities in which the risk-adjustedreturns were perceived to be higher. Banks also
Table 7.13: Purpose of Loans Taken by Earners – IIMS Survey 2007
Purpose of Loan Number of Loan Taking Earners (million) Per cent to Loan Taking Earners
Rural Urban Total Rural Urban Total
1 2 3 4 5 6 7
From All Sources
1. Purchase of house/land/real estate 6.8 2.1 8.9 8.9 13.9 9.72. Purchase of vehicle 1.9 1.0 2.9 2.5 6.3 3.13. Purchase of consumer durables 3.1 0.8 3.9 4.1 5.1 4.34. Meeting a financial emergency 20.2 4.7 24.9 26.3 31.0 27.15. For business requirements 7.1 2.1 9.2 9.3 14.0 10.06. Medical emergency 12.5 1.8 14.3 16.3 11.7 15.57. Farm/crop loan 11.2 0.2 11.4 14.6 1.2 12.48. For meeting social obligations 7.1 1.1 8.2 9.2 7.5 8.99. For other consumption purposes 3.3 0.7 4.0 4.3 4.5 4.310. Education loan 1.9 0.4 2.3 2.4 2.9 2.511. Others 1.6 0.3 1.9 2.1 2.0 2.0Total (1 to 11) 76.6 15.1 91.8 100.0 100.0 100.0
From Institutional Sources
1. Purchase of house/land/real estate 2.8 1.1 3.8 11.4 20.1 13.02. Purchase of vehicle 1.1 0.6 1.6 4.4 10.9 5.53. Purchase of consumer durables 1.1 0.3 1.3 4.4 5.2 4.54. Meeting a financial emergency 4.8 1.3 6.1 19.6 24.9 20.65. For business requirements 3.2 0.9 4.1 13.0 17.1 13.86. Medical emergency 2.0 0.3 2.3 8.1 6.0 7.77. Farm/crop loan 6.6 0.1 6.7 27.2 2.3 22.78. For meeting social obligations 1.2 0.3 1.5 5.1 4.8 5.09. For other consumption purposes 0.7 0.2 0.9 2.8 3.5 2.910. Education loan 0.5 0.2 0.7 2.2 3.3 2.411. Others 0.4 0.1 0.5 1.8 1.9 1.8Total (1 to 11) 24.2 5.3 29.5 100.0 100.0 100.0
From Non-institutional Sources
1. Purchase of house/land/real estate 4.1 1.0 5.1 7.7 10.5 8.22. Purchase of vehicle 0.8 0.4 1.2 1.6 3.8 2.03. Purchase of consumer durables 2.1 0.5 2.6 4.0 5.0 4.14. Meeting a financial emergency 15.4 3.4 18.8 29.4 34.3 30.25. For business requirements 3.9 1.2 5.2 7.5 12.3 8.36. Medical emergency 10.5 1.5 12.0 20.1 14.8 19.27. Farm/crop loan 4.6 0.1 4.7 8.8 0.6 7.58. For meeting social obligations 5.8 0.9 6.7 11.1 9.0 10.89. For other consumption purposes 2.6 0.5 3.1 5.0 5.0 5.010. Education loan 1.3 0.3 1.6 2.5 2.7 2.611. Others 1.1 0.2 1.3 2.2 2.0 2.1Total (1 to 11) 52.4 9.9 62.3 100.0 100.0 100.0
Source : Invest India Incomes and Savings Survey, 2007.

326
REPORT ON CURRENCY AND FINANCE
became somewhat risk averse after prudential normswere tightened during the early 1990s. As a result,overall credit growth by the banking sector to all thesectors, including agr iculture, slowed downsignificantly in the 1990s in comparison with the 1980sas detailed in Chapter VI. The slowdown in credit tohouseholds was, thus, in l ine with the overallslowdown in bank credit.
7.89 Third, the slowdown in credit to householdsalso needs to be seen in the context of the slowdownin agriculture and allied activities. The index ofagricultural production showed a low annual growthof 0.6 per cent during the NSSO survey period(between the 48th and 59th round) as compared with3.5 per cent during the 1980s (Table 7.14). This mayhave led to reduced credit demand for agriculturalinvestment purposes from the banking system. Aslower income households generally take higherrecourse to non-institutional sources to meet theirhousehold consumption requirements, slower growthin the rural incomes may have induced suchhouseholds to approach non-institutional sources tomeet their credit requirements. As alluded to earlier,according to the NSSO data, between 1991 and 2002,the increase in the indebtedness to the non-institutional sources was more pronounced in the caseof lower AHCs. Fourth, the loan waiver of the 1990scould also have affected the overall credit culture andthe attitude of banks to agricultural loans.
7.90 Fifth, the last round of NSSO survey relatedto the year 2002. Subsequently, several policyinitiatives have been taken by the Government/Reserve Bank to improve the credit flow to the needysectors. These measures had a significant positiveimpact on financial inclusion as revealed by theanalysis in the following section based on the BSRand other sources of data.
Analysis Based on Banks/Other Institutions Data
7.91 While the existing surveys such as NSSO,IIMS and NCAER/Max New York Life provideinformation from the household side, BSR and otherinstitutional sources provide data from institutions’side not only on credit but also on deposit growth. Inview of various limitations of surveys, and also tohave an updated picture of financial inclusion, it isuseful to examine the data available from otherinstitutional sources such as commercial banks,RRBs, UCBs, PACS, and post offices. Thus, theanalysis in the fol lowing sect ion makes anassessment of financial inclusion from variousperspectives, including availability of institutionalnetwork, instruments and infrastructure for financialservices. As detailed in the previous section, severalinitiatives were taken in recent years to promotefinancial inclusion. In June 2004, the CentralGovernment had announced the ‘ farm creditpackage’ which, among others, stipulated doublingthe flow of institutional credit to agriculture in theensuing three years. The flow of credit to the farmsector, in fact, doubled after two years, ahead of thestipulated time period. The Union Budget 2008-09has set a target of Rs.280,000 crore for agriculturalcredit during 2008-09. The RRBs, which were setup to pay focussed attention to the rural sector,suffered from poor health. However, the recentrestructuring has had a positive impact as a resultof which there is an evidence of increased creditflow to agriculture/rural sector by RRBs (refer Table7.24). The share of RRBs in total institutional creditflows to agriculture improved in recent years. Therehave also been several innovative micro-financebased experiments catering to highly localisedneeds. Incentives have been provided for penetrationof banking into unbanked areas and encouragingintermediaries such as NGOs, MFIs and CSOs. Thedefinition of the priority sector has been modified toencourage the flow of credit to employment intensivesectors. Another major initiative relates to ‘no frills’accounts, which have made significant progress ina short period.
Population per Branch
7.92 One of the indicators for measuring bankingaccess is the population per branch. Following thenationalisation of banks in 1969, branch network ofSCBs expanded rapidly. As a result, the populationper branch declined significantly between 1969 and1991. The population per branch in the rural segmentincreased after 1991. The population per branch,
Table 7.14: Annual Average Growth Rates inAgriculture and in Bank Credit
(Per cent)
Period* Agriculture Index of Non-food Bankand Agricultural Bank Credit to
Allied Production Credit AgricultureActivities #
1 2 3 4 5
1981-82 to 1991-92 3.0 3.5 16.4 16.11991-92 to 2002-03 2.3 0.6 15.4 13.2
* : Represents period between successive rounds of NSSO surveys.# : Based on GDP data released by the CSO.Source : Handbook of Statistics on the Indian Economy, 2006-07;
Reserve Bank of India.

327
FINANCIAL INCLUSION
Table 7.16: Credit Accounts with Scheduled Commercial Banks(End-March)
Year 1971* 1981 1991 2001 2006 2007
1 2 3 4 5 6 7 8
Rural No. of accounts (Million) – 16.4 49.9 36.6 50.5 53.1Accounts per 100 Persons – 3.1 7.9 4.9 6.3 6.5Accounts per 100 Adults – 5.2 12.7 7.5 9.3 9.6
Urban No. of accounts (Million) – 4.4 12.1 15.8 34.9 41.3Accounts per 100 Persons – 2.7 5.5 5.5 11.3 13.1Accounts per 100 Adults – 4.5 8.9 8.4 16.7 19.5
Total No. of accounts (Million) 4.3 20.7 61.9 52.4 85.4 94.4Accounts per 100 Persons 0.8 3.0 7.3 5.1 7.7 8.3Accounts per 100 Adults 1.3 5.0 11.7 7.9 11.6 12.4
* : As at end-June.Source: Basic Statistical Returns of SCBs in India.
however, continued to decline in the urban areas(Table 7.15)8. One of factors responsible for increasein population per branch in rural areas between 1991and 2007 was the reclassification of 953 rural centres,classified as rural as per 1991 census, which movedto higher population centres on account of increasein population. Besides reclassification, there were alsoinstances where certain centres, which were earlierclassified as rural, were brought into the jurisdiction ofthe adjoining municipality/municipal corporations and,thus, classified as urban/metropolitan depending on thepopulation of municipality/municipal corporation.
Credit Accounts
7.93 The number of total credit accounts per 100persons/adults, which is one of the indicators of theexpansion of credit delivery services, after decliningbetween 1991 and 2001, increased significantlythereafter. At the disaggregated level also, credit
accounts per 100 persons/adults in both the ruraland urban areas improved between 2001 and 2007(Table 7.16). The significant increase in creditaccounts, particularly in the urban areas, in recentyears was on account of robust growth in retail,housing and consumer finance. This was mainly dueto rise in the purchasing power, changing consumerdemographics and high potential for growth inconsumption, technological innovations in delivery offinancial services/products, and recognition of retailbusiness by the financial entities as an important partof their business activities. At present, the retailbanking sector is characterised by three basicelements: multiple products (deposits, credit cards,insurance, investments and securities); multiplechannels of distribution (call centre, branch, internetand kiosk); and multiple customer groups (consumers,small businesses, and corporates). The typical productsoffered in the Indian retail banking segment are housingloans, consumption loans for purchase of durables, autoloans, credit cards and educational loans. Within the retailsegment, housing credit increased significantly over thelast few years (refer Chapter VI for details).
7.94 Credit account penetration (credit accountsper 100 persons) declined both in the rural and urbanareas in all the regions between 1991 and 2001,barring the urban areas in the Northern and EasternRegions where they increased moderately and theWestern Region where they remained unchanged.Credit accounts penetration, however, increasedsignificantly in both the rural and urban areas in allthe regions between 2001 and 2007 (Table 7.17).
8 The census population groups are 'rural' and 'urban', whereas the population groups used in BSR data are 'rural', 'semi-urban', 'urban' and'metropolitan'. There is no unique relationship between the two. For comparison purpose and simplicity, therefore, 'rural' and 'semi-urban' aretaken as 'rural', and 'urban' and 'metropolitan' are combined as 'urban'. Adult population in this section refers to the population in the age groupof 15 years and above. Rural/Urban population for 2007 is estimated on the basis of rural/urban share in 2001 population. SCBs include RRBsunless stated otherwise/given separately.
Table 7.15: Population Per Bank Branch
(Thousand)
End-March Rural Urban Total
1 2 3 4
1969* 82 33 631981 20 17 191991 14 16 142001 16 15 162007 17 13 16
* : As at end-June.Source: Basic Statistical Returns of SCBs in India.

328
REPORT ON CURRENCY AND FINANCE
7.95 For the purpose of financial inclusion, progressin the small accounts is particularly relevant. The break-up of credit accounts suggests that the share of numberof credit accounts with credit limit up to Rs.25,000 intotal credit accounts and the amount outstanding in suchaccounts in total credit outstanding declined between1991 and 2002 and further by 2007. The credit accountswith credit limit of Rs.25,000-Rs.2,00,000 and theamount outstanding in these accounts showed aconsistent increase during 1991-2007 (Table 7.18).However, this pattern to a large extent, might have beenon account of migration of some loans (which are innominal terms) with credit limit up to Rs.25,000 to thehigher categories due to the impact of inflation.
7.96 Adjusted for inflation, the share of loans withless than Rs.25,000 credit limit continued to declinebetween 2001 and 2006. However, the decline wasmuch smaller in the case of credit limit adjusted forinflation than unadjusted (Table 7.19). The share ofnumber of accounts in credit limit of Rs.25,000-Rs.200,000, increased between 1991 and 2000 asalso thereafter through 2006. However, the increasewas relatively lower in the case of credit limit adjustedfor inflation than unadjusted. This pattern, inter alia,reflected the impact of improvement in real income,resulting in higher amount of credit demand and highgrowth in retail credit.
7.97 The number of credit accounts with theRRBs also declined somewhat in the late 1990s,but increased sharply during the current decade(Table 7.20).
Co-operative Credit
7.98 Rural credit co-operatives in India wereenvisaged as a mechanism for pooling the resourcesof people with small means and providing them withaccess to different financial services. The short-termrural co-operative credit structure (STCCS) providesmainly short-term credit and other financial services,which are of particular relevance from the point ofview of financial inclusion. At end-March 2006, the
Table 7.18: Number of Credit Accounts and Outstanding Credit as per Size of Credit Limit – All SCBs
(Amount in Rupees crore)
End-March Credit Limit up to Rs. 25,000 Credit Limit between Rs.25,000 and Rs.2,00,000 Total
Accounts Per cent Amount Per cent Accounts Per cent Amount Per cent Accounts Amount(Million) to Total to Total (Million) to Total to Total (Million)
1 2 3 4 5 6 7 8 9 10 11
1990 51.2 95.0 24,147 23.1 2.3 4.2 14,351 13.8 53.9 104,3121991 58.8 94.9 27,323 22.0 2.7 4.4 17,267 13.9 61.9 124,2031992 62.5 95.0 29,945 21.9 2.8 4.3 18,393 13.5 65.9 136,7061993 58.5 94.2 32,091 19.8 3.1 5.0 20,217 12.4 62.1 162,4671994 55.8 93.6 32,188 18.3 3.3 5.5 21,547 12.3 59.7 175,8911995 53.9 92.8 34,060 16.1 3.5 6.1 23,882 11.3 58.1 210,9391996 51.9 91.6 36,253 14.2 4.0 7.0 28,085 11.0 56.7 254,6921997 50.1 90.1 37,446 13.2 4.6 8.3 32,227 11.3 55.6 284,3731998 46.8 87.4 41,095 12.5 5.7 10.7 39,457 12.0 53.6 329,9441999 42.7 81.7 38,285 10.0 8.2 15.8 49,997 13.1 52.3 382,4252000 39.3 72.2 36,409 7.9 13.6 25.0 66,336 14.4 54.4 460,0812001 37.3 71.1 37,816 7.0 13.2 25.2 68,478 12.7 52.4 538,4342002 37.3 66.2 38,501 5.9 16.8 29.8 87,148 13.3 56.4 655,9932003 36.9 62.0 41,038 5.4 19.7 33.0 104,019 13.8 59.5 755,9692004 36.8 55.4 38,555 4.4 25.1 37.9 124,144 14.1 66.4 880,3122005 38.7 50.2 42,992 3.7 32.4 42.0 156,888 13.6 77.2 1,152,4682006 38.4 45.0 45,217 3.0 38.7 45.3 203,281 13.4 85.4 1,513,8422007 38.6 40.9 45,903 2.4 45.7 48.4 232,992 12.0 94.4 1,947,100
Source: Basic Statistical Returns of SCBs in India.
Table 7.17: Credit Accounts with ScheduledCommercial Banks - Region-wise
(Per 100 persons)
Region/ Rural Urban TotalEnd-March 1991 2001 2007 1991 2001 2007 1991 2001 2007
1 2 3 4 5 6 7 8 9 10
Northern 6.6 4.7 5.6 5.9 7.4 10.0 6.4 5.6 7.1North-Eastern 4.4 2.6 4.1 4.4 3.7 5.5 4.4 2.8 4.3Eastern 7.2 3.5 4.5 4.3 4.6 6.2 6.6 3.7 4.8Central 5.8 3.6 4.3 4.4 3.4 5.0 5.5 3.6 4.4Western 6.2 4.1 4.8 4.8 4.8 18.9 5.7 4.4 10.5Southern 13.6 9.6 14.4 7.6 7.2 21.6 11.8 8.8 16.8All-India 7.9 4.9 6.5 5.5 5.5 13.1 7.3 5.1 8.3
Source: Basic Statistical Returns of SCBs in India.

329
FINANCIAL INCLUSION
Table 7.20: Regional Rural Banks in India – Credit Accounts/Amounts
(No. of Accounts in ’000, Amount in Rupees crore)
End-March Credit Accounts Small Borrowal Accounts Col 4 as Col 5 as
Accounts Amount Accounts Amount % of Col. 2 % of Col. 3
1 2 3 4 5 6 7
1996 13,056 7,344 12,902 6,120 98.8 83.3
1997 12,102 8,655 11,885 6,845 98.2 79.1
1998 12,293 10,200 12,001 7,797 97.6 76.4
1999 11,138 11,279 11,098 10,194 99.6 90.4
2000 11,868 13,126 11,801 11,561 99.4 88.1
2001 12,203 16,352 12,132 14,360 99.4 87.8
2002 12,627 18,869 12,543 16,435 99.3 87.1
2003 12,873 22,623 12,776 19,757 99.2 87.3
2004 12,715 26,020 12,593 22,310 99.0 85.7
2005 14,167 32,689 14,014 27,878 98.9 85.3
2006 13,394 36,644 13,195 30,163 98.5 82.3
2007 14,958 47,855 14,666 37,330 98.0 78.0
Source: Basic Statistical Returns of SCBs in India.
three-tier STCCS consisted of nearly 106,400 PACSat the village level, 370 district central co-operativebanks (DCCBs) at the district level with 12,991branches and 30 state co-operative banks at the Statelevel with 962 branches. One PACS on an average,serves 6 villages. With a total membership of morethan 125 million rural people, PACS is possibly oneof the largest rural financial systems in the world. Thenumber of borrowing members increased significantlybetween 1994 and 2003, before declining thereafter(Table 7.21).
7.99 UCBs play an important role in meeting thegrowing credit needs of urban and semi-urban areasof the country. They mobilise savings from the middleand lower income groups and purvey credit to smallborrowers, including weaker sections of the society.These banks in India are financial co-operatives akinto credit unions found abroad, except that they canalso accept deposits from non-members. UCBs alsoform a part of the payment system.
7.100 In view of the special thrust on financialinclusion in recent years, co-operative banking hasacquired renewed significance in the Indian financialsystem. Being member-driven institutions working ona collective principle, they facilitate the pooling ofresources for the purpose of lending to their memberswho are also the banks’ shareholders and, therefore,have a crucial stake in the affairs of the bank. In someparts of the country such as Maharashtra, Gujaratand Karnataka, UCBs play a significant role inextending banking services in the urban areas. As atend-March 2007, there were 7,670 branches(including extension counters) of 1,813 UCBs in India.Provisional estimates indicate that at end-March2007, UCBs provided credit to around 7 millionborrowers aggregating Rs.78,660 crore.
Micro-finance
7.101 In the recent period, micro-finance hasemerged as an important semi-formal mode ofcredit delivery to the people, particularly to thosewho are excluded from the formal financial system.There are two broad models of micro-finance in
Table 7.19: Number of Credit Accounts of All SCBs- Inflation Adjusted Credit Limit
End-March Credit limit Credit limit betweenup to Rs.25,000 Rs.25,000 and Rs.2,00,000(at 1990 prices) (at 1990 prices)
Number of Share in Number of Share inAccounts Total Accounts Total
(Million) (Per cent) (Million) (Per cent)
1 2 3 4 5
1990 51.2 95.0 2.3 4.21993 59.2 95.3 2.4 3.91997 52.3 94.1 2.7 4.92001 43.9 83.5 7.7 14.72004 48.9 73.7 16.1 24.22006 57.8 67.6 25.0 29.2
Note : The credit limits for the year 1993 onwards equivalent to1990 limits have been worked out by applying the GDPdeflator to the credit limits of 1990.
Source : Worked out on the basis of Survey of Small BorrowalAccounts, Reserve Bank of India Bulletin (various issues).

330
REPORT ON CURRENCY AND FINANCE
Table 7.21: Progress of Primary Agricultural Credit Societies
(End-March)
Particulars 1994 1995 2000 2002 2003 2004 2005 2006 2007
1 2 3 4 5 6 7 8 9 10
1. No. of PACS (thousand) 91.6 91.1 101.5 98.2 112.3 105.7 108.8 106.4 97.2
2. Members (million) 89.0 90.6 108.6 102.1 123.6 135.4 127.4 125.2 125.8
3. Borrowers (million) 50.5 38.0 43.0 55.5 63.9 51.3 45.1 46.1 47.9
4. Owned funds (Rs. crore) 2,694 3,412 5,338 6,855 8,198 8,397 9,197 9,292 11,039
5. Deposits (Rs. crore) 2,102 2,962 12,459 14,846 19,120 18,143 18,976 19,561 23,484
6. Borrowings (Rs. crore) 9,117 10,176 22,350 29,475 30,278 34,257 40,249 41,018 43,714
7. Total Resources (4+5+6) 13,913 16,550 40,147 51,176 57,596 60,797 68,422 69,871 78,237
8. Loans Outstanding (Rs. crore) 10,534 12,141 28,546 40,779 42,411 43,873 48,785 51,779 58,620
Source : Performance of Primary Agricultural Credit Societies (various issues); NAFSCOB.
India, viz., SHG-bank linkage model and MFI model.Of these two models, the SHG-bank linkage has maderapid strides since its inception in the early 1990s.Commercial banks, co-operative banks and RRBs areactively engaged in the programme. As on March 31,2007, 50 commercial banks, 96 RRBs and 352 co-operative banks were participating in the programme.The number of bank branches lending to SHGs was35,294 at end-March 2006 and the number ofparticipating NGOs and other agencies was 3,024.The programme is being implemented in 31 States/UTs and 587 districts.
Table 7.22: SHG-Bank Linkage Programme
Year Cumulative Number of Bank loanSHGs Financed (Rs. crore)
(’000) (cumulative)
1 2 3
1992-99 33 57
1999-00 115 193
2000-01 264 481
2001-02 461 1,026
2002-03 717 2,049
2003-04 1,079 3,904
2004-05 1,618 6,898
2005-06 2,239 11,398
2006-07 2,925 18,047
2006-07* 2,895* 12,366 *
*: Represents outstanding number and amount. The comparablefigures for earlier years are not available.
Source: Progress of SHG–Bank Linkage in India 2005-06;NABARD.
Table 7.23: Regional Pattern of SHGsLinked to Banks
(Per cent to total )
Region/End-March 2001 2002 2003 2004 2005 2006
1 2 3 4 5 6 7
Northern 3.4 4.2 4.9 4.9 5.3 5.9
North-Eastern 0.2 0.3 0.6 1.1 2.1 2.8
Eastern 8.4 9.9 12.7 14.7 16.4 17.6
Central 10.9 10.4 11.4 11.8 12.2 12.0
Western 5.9 6.4 5.9 5.1 5.9 7.4
Southern 71.1 68.8 64.6 62.5 58.0 54.3
All India 100.0 100.0 100.0 100.0 100.0 100.0
Source : Progress of SHG-Bank Linkage in India 2005-06; NABARD.
7.102 The number of bank linked SHGs increasedsharply, especially from 1999-2000. By 2006-07,about three million SHGs were bank-linked (Table 7.22).Assuming that, on an average, each SHG finances14 members, the cumulative number of householdsserved by SHGs-bank linkage programme wouldamount to about 41 million at end-March 2007. Theestimated number of poor people assisted would,thus, be about 205 mill ion, assuming averagehousehold size of 5 persons.
7.103 The region-wise pattern of SHGs linked tobanks showed a greater concentration in the Southernregion, although the spatial disparity declined over theyears with the significant increase in the share of otherregions, particularly the Eastern region (Table 7.23).
7.104 The average loan amount per SHG wasRs.61,648. A significant feature of the programme wasthe active participation of women (90 per cent) andtimely loan repayment (over 90 per cent). The high

331
FINANCIAL INCLUSION
A few assessment studies have been carried out on the impactof the SHG-bank linkage programme in India at the grassroot level. Puhazhendi and Satyasai (2000) observed thatthere was a shift in the income slabs of households towardshigher income slabs between pre and post-SHG situation.About 74 per cent of the sample households were below anannual income level of Rs.22,500 during pre-SHG situation.The proportion declined to 57 per cent in the post–SHGsituation due to increased income levels. Further, involvementin the group significantly contributed to improving the self-confidence of the members. The feeling of self-worth andcommunication with other group members improved afterassociation with the SHGs. The members were relatively moreassertive in confronting with social evils and problematicsituations.
In another assessment, Puhazhendi and Badatya (2002)found that availing loans from moneylenders and otherinformal sources with higher interest rates was significantlyreduced due to SHG intervention. It was also observed thatconsumption oriented loans were replaced by productionoriented loans during post-SHG situation.
Another study (APMAS and EDA Rural Systems, 2006)observed that 30 per cent of SHGs in the sample were involvedin community actions. These involved improving communityservices (43 per cent of the total actions, including watersupply, education, health care, veterinary care, village road),
Box VII.14SHG-Bank Linkage Programme : An Assessment
trying to stop alcohol sale and consumption (31 per cent),contributing finance and labour to new infrastructure (12 percent), protecting natural resources and acts of charity (to non-members). The most common single type of action taken upby SHGs was the attempt to close down local liquor outlets.
The study also pointed out that such community actionsinvolved a new boldness and confidence for women, ofteninvolving putting pressure on the authorities (panchayat,district officers and police) to do their jobs, whether throughpetitions or by staging rallies and blockades; and varyingdegrees of skill in negotiation with SHG leaders.
Some of the States like Andhra Pradesh are trying toimplement various developmental and poverty alleviationschemes through SHGs.
References:
1. Puhazhendi, V. and Satyasai, K.J.S. 2000. Micro-financefor Rural People: An Impact Evaluation; NABARD.
2. Puhazhendi, V. and Badatya, K.C. 2002. SHG-bankLinkage Programme for Rural Poor - an ImpactAssessment; www.microfinancegateway.org
3. APMAS and EDA Rural Systems. 2006. Self-Help Groupsin India: A Study of the Lights and Shades; Study byAndhra Pradesh Mahila Abhivruddhi Society (APMAS)and EDA Rural Systems Private Ltd; www.apmas.org
repayment rates of the SHGs provided comfort to thebanks for lending to the SHGs (Box VII.14).
7.105 From the above analysis, it is evident thatcredit delivery from formal financial institutions tothe relatively excluded segments has improvedsignificantly in recent years due to various initiativesby the Reserve Bank and the Government. As aresult, overall credit to agriculture by all creditinstitutions grew at an annual compound rate of 26.5per cent between 2002-03 and 2007-08 as comparedwith 16.8 per cent between 1991-92 and 2001-02(Table 7.24).
7.106 To sum up, there has been a dist inctimprovement in credit penetration (credit accountsper 100 persons) and credit flow to the rural sectorin general and to agriculture since the early 2000s,that is, during the period subsequent to the referenceyear of AIDIS by the NSSO. Taking together allsources of formal credit, the number of creditaccounts per 100 adults, which had declined from20 in 1993 to 18 in 2002, improved to 25 in 2007(Table 7.25).
Table 7.24: Institutional Credit Flow to theAgriculture Sector in India
(Rupees crore)
Year Co-operatives RRBs Commercial Banks Total
1 2 3 4 51991-92 5,797 596 4,806 11,199
(45.9) (78.2) (2.8) (24.7)2001-02 23,604 4,854 33,587 62,045
(13.5) (15.0) (20.8) (17.4)2002-03 23,716 6,070 39,774 69,560
(0.5) (25.1) (18.4) (12.1)2003-04 26,959 7,581 52,441 86,981
(13.7) (24.9) (31.8) (25.0)2004-05 31,424 12,404 81,481 125,309
(16.6) (63.6) (55.4) (44.1)2005-06 39,404 15,223 125,859 180,486
(25.4) (22.7) (54.5) (44.0)2006-07 42,480 20,435 140,382 203,297
(7.8) (34.2) (11.5) (12.6)2007-08 43,684 24,814 156,850 225,348
(2.8) (21.4) (11.7) (10.8)
Memo: Compound Annual Growth Rates
1991-92 to 2001-02 13.6 21.0 19.3 16.82002-03 to 2007-08 13.0 32.5 31.6 26.5
Note : Figures in parentheses are percentage change overprevious year.
Source : Reserve Bank of India and NABARD.

332
REPORT ON CURRENCY AND FINANCE
Financial Inclusion: Deposit Side
7.107 Apart from the availability of credit, the facilityof deposits is another key element of financialinclusion. This is particularly important for the peoplewith low and irregular income. Access to facility ofsafe deposits enables such people to plan theirexpenditure with convenience. This also promotesthrift and develops the culture of saving. In theabsence of such facility, people may keep their savingsin various informal forms such as cash at home ordeposit with relatives/moneylenders. The possibility
of losing money in such cases is very high whichinflicts hardships to people and also discourage themto save more. A key to safe deposits is the ability towithdraw money from accounts as and when required.Thus, the nature of products available in this regardcould play an important role in promoting financialinclusion.
7.108 In the Indian context, savings deposit accountsare provided by banks and post offices. Accordingly,this section examines the progress made by thebanking system and post offices in terms of providingsavings accounts based on the BSR data for banksand the data obtained from the Postal Department. Alimitation of this analysis is the multiple accounts heldby one individual and the dormant accounts that maynot have been operated for a long time. Nevertheless,per capita deposit accounts can provide someimpor tant insights into the progress made inpromoting financial inclusion.
Savings Bank Accounts
7.109 The number of savings accounts opened bySCBs expanded signif icant ly over the years,especially between the early 1970s and the early1990s. The expansion in savings accounts was muchfaster than the population growth, resulting in asubstant ial improvement in savings accountpenetration (savings accounts per 100 persons)(Table 7.26). The improvement was observed bothin the urban and rural areas. The number of savingsaccounts per 100 persons/adults, which declinedbetween 1991 and 2002, increased sharply thereafter.As a result, the number of savings accounts per 100persons/adults at end-March 2007 was larger thanthat at end-March 1991. This reflects rise in theincome levels and the various initiatives taken by the
Table 7.25: Number of Credit Accountswith Institutions
(Million)
Institution/End-March 1993 2002 2007
1 2 3 4
Scheduled Commercial Banks 46.4 43.3 76.6
Regional Rural Banks 13.0 12.6 15.0
Primary Agricultural Credit Societies 50.5 55.5 47.9
Urban Co-operative Banks 4.7 4.4 7.1
Self-Help Groups 0.0 7.4 40.5
Total 114.6 123.3 187.1
Total Accounts per 100 Persons 13 12 17
Total Accounts per 100 Adults 20 18 25
Note: 1. Data on UCBs for 1993 and 2002 are estimated assumingthe same growth as observed in the case of SCBs.
2. Accounts with SHGs are estimated assuming on an aver-age 16 accounts per SHG in 1993 and 2002 and 14 in2007(obtained on request from NABARD). The averagesize of SHGs has declined in recent years due to forma-tion of several new SHGs with smaller size.
3. Number of SHGs is adjusted against the credit accountswith SCBs to avoid double counting.
Table 7.26: Savings Accounts with Scheduled Commercial Banks(End-March)
Year 1971* 1981 1991 2001 2006 2007
1 2 3 4 5 6 7 8
Rural No. of accounts (Million) – 56.9 153.8 169.8 194.4 213.8Accounts per 100 Persons – 10.9 24.5 22.9 24.2 26.2Accounts per 100 Adults – 17.9 39.2 35.0 35.8 38.8
Urban No. of accounts (Million) – 40.9 99.2 110.2 149.1 159.7Accounts per 100 Persons – 25.7 45.6 38.5 48.1 50.7Accounts per 100 Adults – 42.3 73.1 58.9 71.4 75.2
Total No. of accounts (Million) 23.6 97.8 253.0 280.0 343.4 373.5Accounts per 100 Persons 4.3 14.3 29.9 27.2 30.8 33.0
Accounts per 100 Adults 7.1 22.9 46.8 41.5 45.9 48.9
* : As at end-June.Source: Basic Statistical Returns of SCBs in India.

333
FINANCIAL INCLUSION
Reserve Bank such as urging banks to open ‘no frills’accounts with ‘nil’ or low minimum balances.
7.110 The region-wise pattern indicates that savingsaccounts per 100 persons declined between 1991 and2001 in all the regions, barring North-Eastern andCentral regions in which the number of savingsaccounts per 100 persons increased. This pattern wasobserved broadly in both the rural and urban areas.However, savings account penetration increasedsharply between 2001 and 2007 in both the rural andurban areas in all the regions (Table 7.27). The accessto savings accounts was more evenly spread incomparison with credit accounts. Credit accountsshowed a greater concentration in the Southernregion, while savings accounts were more or lessevenly spread in the Northern, Southern and Westernregions. However, penetration of both savingsaccounts and credit accounts was low in the North-Eastern, Eastern and Central regions.
7.111 The number of savings accounts with RRBs,which are included in scheduled commercial banks datain Table 7.27, increased significantly between 1991and 2006. In tandem with the growth in the number ofaccounts, the deposits with RRBs also increased(Table 7.28).
7.112 With a view to providing financial inclusion,the Reserve Bank had advised all banks to makeavailable a basic banking ‘no-frills’ account either with‘nil’ or low minimum balances as well as charges, asalluded to earlier. There has been a significantprogress in the number of ‘no frills’ accounts openedby banks in India (Table 7.29).
7.113 According to the Invest India Incomes andSavings Survey 2007, the proportion of respondentshaving savings accounts was significantly lower inthe low income groups, than in the higher incomegroups. The proportion of population having a bank
account increased with the increase in the level ofincome. The survey also indicated that around 45 percent of respondents had a savings account with abank. Furthermore, the number of savings accountsheld in urban areas was higher than that in ruralareas (Table 7.30).
7.114 Another survey, conducted by Max New YorkLife and NCAER, found that at the all-India level, 66per cent of households own accounts in a financialinstitution (commercial bank, post office, regional ruralbanks and registered societies). This percentage waslower in rural areas at 59 per cent as compared with82 per cent in the urban areas (NCAER, 2008). Thesurvey also indicated that 36 per cent of totalhouseholds in India preferred to keep savings at
Table 7.28: Savings Accounts withRegional Rural Banks
Year No. of Accounts Deposits Outstanding(million) (Rs. crore)
1 2 3
1991 26.5 2,5521992 28.5 2,8991993 29.7 3,0591994 30.5 4,0161995 31.2 5,2461996 31.4 6,0061997 32.7 7,3541998 34.4 9,2421999 34.4 10,9022000 35.4 12,7772001 36.7 14,7322002 36.7 17,5072003 40.1 20,8032004 42.9 25,6702005 44.9 30,3902006 47.5 37,5592007 52.7 45,014
Source: Basic Statistical Returns of SCBs in India.
Table 7.27: Savings Accounts of Scheduled Commercial Banks (Per 100 persons)
Region/End-March Rural Urban Total
1991 2001 2007 1991 2001 2007 1991 2001 2007
1 2 3 4 5 6 7 8 9 10
Northern 30.1 27.3 29.9 62.6 50.3 64.1 40.0 35.0 41.5
North-Eastern 16.1 16.9 18.9 28.4 25.6 33.6 17.8 18.3 21.2
Eastern 17.7 16.2 18.4 40.0 37.4 44.4 21.8 20.2 23.3Central 21.0 21.8 23.7 34.7 31.1 40.2 23.8 23.9 27.4
Western 24.7 21.9 26.4 53.8 42.0 53.6 35.5 30.1 37.5
Southern 34.6 31.9 38.7 42.7 35.9 53.8 37.0 33.2 43.8All-India 24.5 22.9 26.2 45.6 38.5 50.8 29.9 27.2 33.0
Source: Basic Statistical Returns of SCBs in India.

334
REPORT ON CURRENCY AND FINANCE
home, while more than half of the Indian householdspreferred to keep their savings in bank deposits. Inrural areas, the preference for keeping savings athome (41.7 per cent) was significantly higher thanthat in urban areas (23.4 per cent). On the other hand,significantly higher number of households (62.6 per cent)in urban areas preferred to keep savings in bank depositsas compared with those in rural areas (45.3 per cent).
Postal Savings and Remittance
7.115 Apart from the banking system, the postoff ices in India also provide the services ofmaintaining deposits and remittances. The IndianPostal Service with 155,516 post offices at end-March2005 is the most widely spread post office system inthe world. The numbers of post offices were more thantwice the number of bank branches in the country witha large presence in remote areas. A post office inIndia, on an average, served 7,046 persons at end-March 2005. Indian post offices offer various types ofsmall savings schemes and also provide otherbanking and financial services. Small savingsschemes include deposits of various maturities andpublic provident funds. Other financial services
include money order, international remittance, mutualfund and postal life insurance.
7.116 The number of savings bank accounts with thepost offices, which provide cheque facility, was 60.3million, i.e., about 19 per cent of the savings accountswith banks (about 320 million). The amount of savingsdeposits per account in post offices was aroundRs.2,500 at end-March 2005 as compared with aroundRs.15,000 with banks. This was because post officeslargely cater to the banking needs of the low incomegroups. Apart from the savings bank accounts, postoffices also offer several other products (Chart VII.3).
7.117 The aggregate picture of savings accountswith different institutions (SCBs, RRBs, UCBs, PACSand post offices) showed a steady improvement inabsolute terms from 1993 to 2002 and further in 2007.However, savings accounts per 100 persons/adultsdeclined in 2002 as compared with 1993. The positionimproved significantly thereafter. As a result, savingsaccounts per 100 persons/adults in 2007 were morethan those in 1993 (Table 7.31).
Insurance Services
7.118 In most countries, a large segment of thepopulation does not have access to formal insuranceservices. Micro-insurance services in a number ofcountries have begun to expand only in recent years.The Insurance Regulatory and Development Authority(IRDA) has been actively encouraging insuranceservices for low-income households. In 2002, theIRDA established rural and social sector targets for
Table 7.29: Number of ‘No-Frills’ AccountsOpened in India
(Number of Accounts)
Category End-March End-March End-December2006 2007 2007
1 2 3 4
Public Sector Banks 332,878 5,865,419 11,026,619Private Sector Banks 156,388 856,495 1,560,518Foreign banks 231 2,753 30,260Total 489,497 6,724,667 12,617,397
Source : Reserve Bank of India.
Table 7.30: Earners Having a Bank Account – 2007
(Per cent of Total Earners*)
Range of Annual Income (Rs.) Urban Rural Total
1 2 3 4
Less than 50,000 34.1 26.8 28.3
50,000 to 100,000 75.5 71.2 73.0
100,000 to 200,000 91.8 87.4 89.9
200,000 to 400,000 95.5 93.6 94.9
More than 400,000 98.0 96.3 97.6
All 61.7 38.0 44.9
* : An earner is defined as a person who is in the age of 18-59years and earning some cash income.
Source: IIMS, 2007

335
FINANCIAL INCLUSION
Table 7.32: Insurance Penetration Ratio - SelectCountries – 2005
Country Insurance Penetration
1 2
Developing Countries
Bangladesh 0.61People’s Republic of China 2.70India 3.14Indonesia 1.52Pakistan 0.67Philippines 1.48Sri Lanka 1.46
Developed Countries
Japan 10.54United Kingdom 12.45United States of America 9.15
Republic of Korea 10.25
Note : Insurance penetration is gross insurance premium as apercentage of gross domestic product.
Source : Asian Development Bank. 2007.
9 The Reserve Bank collects information about the credit outstanding as on March 31 from the scheduled commercial banks (includingRRBs) in an annual return, namely, BSR-1. Part A of BSR-1 provides detailed account-wise information on credit outstanding of allaccounts with credit limit of more than Rs.200,000 and in Part B for advances up to Rs.200,000, termed as Small Borrowal Accounts. Onlyoccupation-wise consolidated information on number of accounts, amount outstanding and credit limits are obtained. The detailed account-wise information on credit-outstanding of small borrowal accounts according to type of account holders, like, individuals, proprietary andpartnership firms, co-operative societies, corporate bodies and other such groups is obtained by conducting a separate survey of SmallBorrowal Accounts. For obtaining the information of total amount outstanding to individual account holders as on March 2002 the resultsof Small Borrowal Accounts Survey 2001 were utilised, which is the nearest survey pertaining to BSR-1 for March 31, 2002.
10 The IIMS, 2007 survey indicated that around 45 per cent of respondents (earners) had an account with a bank. The findings of the survey,which are applicable for earners, are not comparable with other data discussed in this chapter.
Table 7.31: Number of Savings Accountswith Institutions
(Million)
Institution/End-March 1993 2002 2007
1 2 3 4
Scheduled Commercial Banks 246.0 246.5 320.9Regional Rural Banks 30.5 36.7 52.7Primary Agricultural Credit Societies 89.0 102.1 125.8Urban Co-operative Banks 41.6 41.6 50.0Post Offices 47.5 60.2 60.8
Total 454.6 487.1 610.3
Total Accounts per 100 Persons 51 46 54
Total Accounts per 100 Adults 80 72 82
Note : 1. Data on UCBs for 1993 and 2002 are estimated assumingthe same growth as observed in the case of SCBs.
2. The number of accounts in the case of PACS representtotal membership.
3. Data on savings accounts with post offices for 2007 areestimated on the basis of compound annual growth ratebetween 1999-2000 and 2004-05.
insurance companies. All insurers entering thebusiness after the start of the IRDA Act, 1999 arerequired to comply with the obligations towards therural and social sectors in a phased manner. In India,the total number of life insurance policies (individualsingle premium) was about 3.41 million in November2007 (IRDA, 2008). This implies that there are onlyaround 3.1 policies per thousand persons. Theinsurance penetration (insurance premium aspercentage of GDP) in India was relatively higher ascompared with several emerging market economies,but signif icantly lower than that in advancedeconomies (Table 7.32).
An Assessment of Financial Inclusion by VariousAgencies: A Comparison
7.119 A comparison of the NSSO’s All-India Debtand Investment Survey and the BSR data brought outby the Reserve Bank9 suggests that there aresignificant differences in the credit to householdsextended by banks (Table 7.33). The extent ofhousehold indebtedness to the banking system
appears to be grossly underestimated by the NSSOdata, both in terms of households/accounts and creditoutstanding. Furthermore, number of credit accountsand amount outstanding in such accounts, as revealedby the BSR data, increased sharply between 2002and 2007.
7.120 A comparison of the consolidated BSR dataon savings accounts and other institutions (accountswith UCBs, post offices and PACS) with NCAER/MaxNew York Life survey also indicates significantdifferences in the extent of financial inclusion.According to data from banks and various otherfinancial institutions, 54 persons out of 100 held asavings account with one or the other formal financialinstitution in 2007 as compared with 50 accounts per100 persons in 2005. Assuming 5 persons as theaverage size of households, this works out to about250 accounts per 100 households (2.5 accounts perhousehold). NCAER/Max New York Life survey, on theother hand, found that 66 per cent households heldaccount with a financial institution, which worked outto 13 accounts per 100 persons10 (Chart VII.4). The
1

336
REPORT ON CURRENCY AND FINANCE
Table 7.33: Comparison of AIDIS and BSR Data - Household Indebtedness to Commercial Banks
Item AIDIS 1991 BSR 1991 AIDIS 2002 BSR 2002 BSR 2007
1 2 3 4 5 6
No. of households/accounts in ’000 10,277 60,911 10,189 53,918 83,016(16.9) (19.9)
Amount of debt outstanding (Rs. crore) 10,775 43,171 46,712 175,659 654,392(24.9) (27.8)
Amount outstanding per household/account (Rs.) 10,464 7,088 45,846 32,579 78,827
Share in credit outstanding under various interest rate buckets
Less than 12.0 per cent – – 27.6 16.9 64.2
12.0-15.0 per cent – – 40.9 57.2 18.5
15.0 per cent and above – – 31.5 25.0 17.3
Note: Figures in parentheses in columns 2 and 4 indicate AIDIS data as percentage of BSR data in columns 3 and 5, respectively.
differences in the magnitude of financial inclusion/exclusion of the various studies may, inter alia, be onaccount of data problems and differences in themethodologies, definitions and other factors discussedabove. There is, therefore, a need to interpret the resultsbased on the data from various sources carefully.
7.121 While assessing savings accountspenetration, it is pertinent to exclude people who havevery little or no capacity to save. About 22 per centpeople below the poverty line would not have savingsto put in bank deposits or other alternative avenues.This is also corroborated by the Max New York Life-
NCAER Study (2008) which found that about 20 percent of the total households did not have savings.Thus, a section of the households would beconstrained to access the banking services due tolack of savings rather than the lack of banking servicesavailable to them. After excluding the people belowpoverty line, it is estimated that in India there are 105accounts per 100 adults11.
7.122 An empirical analysis suggests that economicdevelopment and infrastructure (demand side factors),and branch network (supply side factor) were the maindeterminants of financial inclusion. Simultaneously,financial inclusion, among others, also affectseconomic development (Box VII.15).
7.123 To sum up, according to the All India Debtand Investment Survey of the NSSO, the householdindebtedness increased sharply between 1991 and2002. This was mainly on account of sharp increasein consumption and other expenditure, which couldnot be easily financed from institutional sources. Dataalso suggest that in absolute terms, the number ofhouseholds indebted to institutional sources, both inrural and urban areas, increased between 1991 and2002. However, the proportion of households indebtedto institutional sources and the share of institutionalsources in households’ outstanding debt declinedsharply between 1991 and 2002. A detailed analysissuggests that institutional agencies continued toincrease credit to households between 1991 and 2002more or less at the same rate as between 1981 and1991. However, sharp increase in credit for consumptionand other unproductive purposes from non-institutionalsources resulted in a significant decline in the share
11 82 savings accounts per 100 adults imply approximately 82 accounts per 78 adults above poverty line (after excluding 22 per cent peoplebelow the poverty line).
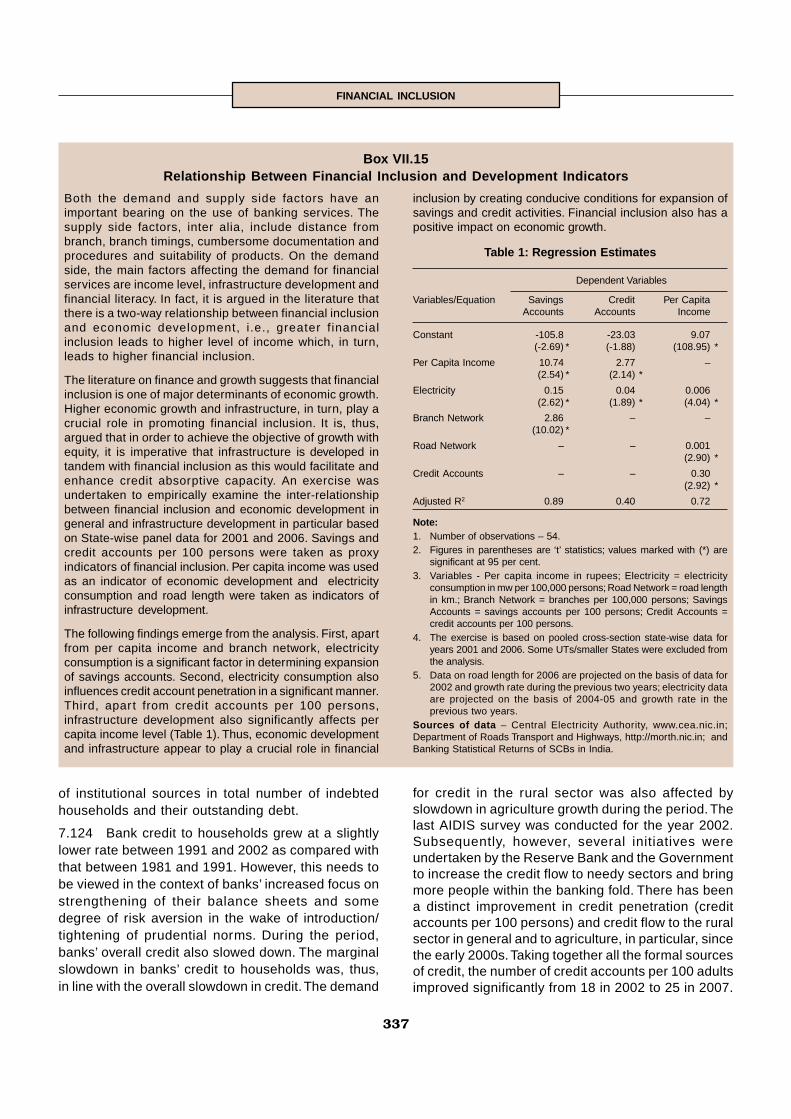
337
FINANCIAL INCLUSION
of institutional sources in total number of indebtedhouseholds and their outstanding debt.
7.124 Bank credit to households grew at a slightlylower rate between 1991 and 2002 as compared withthat between 1981 and 1991. However, this needs tobe viewed in the context of banks’ increased focus onstrengthening of their balance sheets and somedegree of risk aversion in the wake of introduction/tightening of prudential norms. During the period,banks’ overall credit also slowed down. The marginalslowdown in banks’ credit to households was, thus,in line with the overall slowdown in credit. The demand
for credit in the rural sector was also affected byslowdown in agriculture growth during the period. Thelast AIDIS survey was conducted for the year 2002.Subsequently, however, several initiatives wereundertaken by the Reserve Bank and the Governmentto increase the credit flow to needy sectors and bringmore people within the banking fold. There has beena distinct improvement in credit penetration (creditaccounts per 100 persons) and credit flow to the ruralsector in general and to agriculture, in particular, sincethe early 2000s. Taking together all the formal sourcesof credit, the number of credit accounts per 100 adultsimproved significantly from 18 in 2002 to 25 in 2007.
Both the demand and supply side factors have animportant bearing on the use of banking services. Thesupply side factors, inter alia, include distance frombranch, branch timings, cumbersome documentation andprocedures and suitability of products. On the demandside, the main factors affecting the demand for financialservices are income level, infrastructure development andfinancial literacy. In fact, it is argued in the literature thatthere is a two-way relationship between financial inclusionand economic development, i .e., greater f inancialinclusion leads to higher level of income which, in turn,leads to higher financial inclusion.
The literature on finance and growth suggests that financialinclusion is one of major determinants of economic growth.Higher economic growth and infrastructure, in turn, play acrucial role in promoting financial inclusion. It is, thus,argued that in order to achieve the objective of growth withequity, it is imperative that infrastructure is developed intandem with financial inclusion as this would facilitate andenhance credit absorptive capacity. An exercise wasundertaken to empirically examine the inter-relationshipbetween financial inclusion and economic development ingeneral and infrastructure development in particular basedon State-wise panel data for 2001 and 2006. Savings andcredit accounts per 100 persons were taken as proxyindicators of financial inclusion. Per capita income was usedas an indicator of economic development and electricityconsumption and road length were taken as indicators ofinfrastructure development.
The following findings emerge from the analysis. First, apartfrom per capita income and branch network, electricityconsumption is a significant factor in determining expansionof savings accounts. Second, electricity consumption alsoinfluences credit account penetration in a significant manner.Third, apar t from credit accounts per 100 persons,infrastructure development also significantly affects percapita income level (Table 1). Thus, economic developmentand infrastructure appear to play a crucial role in financial
Box VII.15Relationship Between Financial Inclusion and Development Indicators
Table 1: Regression Estimates
Dependent Variables
Variables/Equation Savings Credit Per CapitaAccounts Accounts Income
Constant -105.8 -23.03 9.07(-2.69) * (-1.88) (108.95) *
Per Capita Income 10.74 2.77 –(2.54) * (2.14) *
Electricity 0.15 0.04 0.006(2.62) * (1.89) * (4.04) *
Branch Network 2.86 – –(10.02) *
Road Network – – 0.001(2.90) *
Credit Accounts – – 0.30(2.92) *
Adjusted R2 0.89 0.40 0.72
Note:1. Number of observations – 54.2. Figures in parentheses are ‘t’ statistics; values marked with (*) are
significant at 95 per cent.3. Variables - Per capita income in rupees; Electricity = electricity
consumption in mw per 100,000 persons; Road Network = road lengthin km.; Branch Network = branches per 100,000 persons; SavingsAccounts = savings accounts per 100 persons; Credit Accounts =credit accounts per 100 persons.
4. The exercise is based on pooled cross-section state-wise data foryears 2001 and 2006. Some UTs/smaller States were excluded fromthe analysis.
5. Data on road length for 2006 are projected on the basis of data for2002 and growth rate during the previous two years; electricity dataare projected on the basis of 2004-05 and growth rate in theprevious two years.
Sources of data – Central Electricity Authority, www.cea.nic.in;Department of Roads Transport and Highways, http://morth.nic.in; andBanking Statistical Returns of SCBs in India.
inclusion by creating conducive conditions for expansion ofsavings and credit activities. Financial inclusion also has apositive impact on economic growth.

338
REPORT ON CURRENCY AND FINANCE
such operations. As a result, banks either becomecautious in providing such services or charge higherlevies from the users of such services. In both thecases, the operating cost is considered as one of themajor obstacles in promoting financial inclusion. Thissection, therefore, focusses on the operating cost offinancial inclusion and examines as to how it couldbe minimised.
Lender’s Perspective
7.128 Banks often tend to adopt a cautiousapproach while extending services to lower incomegroups due to fear of loan losses or inability to recoverthe loans, especially when the poor have hardly anyasset to pledge as ‘collateral’. In the case of depositfacility, the operating cost of maintaining an account,particularly when the average deposit in the accountis low, may make it an economically unviableproposition for banks to extend banking services tolow income groups.
7.129 In general, there are three kinds of costsincurred by the formal financial sector while extendingcredit, viz., (a) cost of funds, (b) operating cost, and(c) cost of loan losses. One would expect the cost ofraising funds to be same for all kinds of credit. Theoperating cost and cost of loan losses may, however,differ across different segments of borrowers. Theoperating cost of extending small loans is generallyperceived to be higher. According to the PlanningCommission (2007), the operating cost of servicingmicro-credit is significantly higher than the normalfinance. Salar ies to staff, travelling expenses,commissions not classified under financial costs,expenses on promotion of groups, staff welfareexpenses, amortisation and depreciation, rent onhired buildings and other overheads - all constitutethe operating cost. These costs are critical to theoperations of the formal banking sector. Thedifferential cost of extending small loans to low incomegroups, particularly in the unbanked areas, is reflectedin high rates of interest charged by co-operative creditinstitutions and MFIs. As these institutions often haveless than sufficient deposits, they depend on refinancefacilities from other agencies such as NABARD, SIDBIand commercial banks. The Planning Commissionobserved that the average cost of refinance variesfrom 8 to 14 per cent. The operationally reasonableinterest rate that an efficient MFI should charge fromborrowers, however, works out to 22-26 per cent. Thisdifference is largely due to operating cost which isaround 10-14 per cent for MFIs as compared with 3-4per cent incurred by the banks servicing their averageborrowers (Planning Commission, 2007).
A comparison of NSSO and BSR data suggests thatthe extent of household indebtedness to the bankingsystem is grossly underestimated by the NSSO databoth in terms of households/accounts and creditoutstanding, which could be on account of differencesin methodology, among others.
7.125 On the deposit side, savings accounts per100 persons/adults declined marginally in 2002 ascompared with 1993 for the reasons as indicatedabove. The position, however, improved significantlythereafter and savings accounts per 100 persons/adults in 2007 were more than those in 1993.According to the consolidated data on savingsaccounts with banks and other institutions (UCBs,post offices and PACS), 54 persons out of 100 heldsavings accounts in 2007. Assuming five personsas the average size of households, about 250accounts were held per 100 households or 2.5accounts per households. The NCAER/Max NewYork Life survey on households conducted in 2005suggests that 66 per cent of households heldaccounts with financial institutions, which work outto 13 accounts per 100 persons. This suggests thatthere are significant differences in the various datasets/sources and that there is need for an extremecaution while drawing any conclusions about theextent of financial inclusion/exclusion.
7.126 Much more detailed work needs to be doneto assess the progress of financial inclusion in thecountry and to then devise further strategies forpromoting it. Reliance on a single source of data canlead to erroneous conclusions and incompleteassessment of the real situation. Significant progresshas been made in various directions in the currentdecade after public sector banks were strengthenedfinancially over the 1990s. Finally, the data suggest avery significant strengthening of the micro-financemovement. Its spread in regions other than the Southnow needs to be pursued vigorously. The empiricalevidence in the Indian context suggests that economicdevelopment and infrastructure (demand side factors),and branch network (supply side factor) were the mainfactors affecting financial inclusion. Financial inclusion,among others, also affects economic development.
VI. OPERATING COST AND LEVERAGING OFTECHNOLOGY FOR FINANCIAL INCLUSION
7.127 Operating cost of providing financial servicesand the charges levied on the users are importantdimensions of the process of financial inclusion. It isargued that the operating cost of small accounts orlow value transactions often exceeds the revenue from

339
FINANCIAL INCLUSION
Table 7.34: Return on Assets and ‘No-Frills’ Accounts – Select Banks
Bank Returns as per cent of Assets Number of ‘No Frills’ Accounts
End-March End-March2003-04 2004-05 2005-06 2006-07 2006 2007
1 2 3 4 5 6 7
Canara Bank 1.34 1.01 1.01 0.98 13,429 305,972Syndicate Bank 1.67 0.82 0.91 0.91 41,329 1,290,898State Bank of India 0.94 0.99 0.89 0.84 0 585,720HDFC Bank 1.45 1.47 1.38 1.33 2,055 26,644ICICI 1.31 1.59 1.30 1.09 112,075 193,989SCBs 1.10 0.9 0.88 0.9 489,497 6,732,335
Source: Report on Trend and Progress of Banking in India (various issues) and the Reserve Bank of India.
12 Calculations are based on a sample study of Cansaral operative accounts. Interest cost for the account was taken at 2.35 per cent asobserved in the sample. Other costs include staff cost and overhead cost. Staff cost is worked out on the basis of time taken in transactionsand staff cost per minute (Rs.2 per minute per staff). Overhead cost is taken as 58 per cent of the staff cost.
7.130 Higher perceived operating costs may deterbanks from extending even simple banking servicessuch as savings account to low income groups. Someestimates indicate that even the ‘no-frills’ accountsrequire, on an average, a balance of around Rs.2,000to be an economically viable activity (Rao, 2007). Forinstance, in the case of Canara Bank the cost ofopening a new (no-frills) account was Rs.48 and costof each transaction (deposit/remittance) was Rs.1012 .To reach break even, the average amount of depositrequired depends on the number of transactions. Thebreak even average deposit level required wasRs.1,911 (for 12 transactions a year) and Rs.11,465(for 72 transactions a year). The average balance forthe Canara Bank was estimated at Rs.528, which wasless than half the break even level for 12 transactionsin a year (Rao, 2007). A survey of two other banksrevealed that the cost structure of operating ‘no-frills’account was more or less similar to that of CanaraBank. Given that the fixed costs often constitute alarge part of operating cost of bank branches and thatthe number of personnel is generally fixed, calculationof the marginal cost of opening small accounts needsto be examined more carefully and the use oftechnology to reduce costs in opening and maintainingsuch accounts needs to be explored further.
7.131 While operating costs of ‘no-frills’ accountscould appear to be high, an analysis of operations intotality for some banks suggests that they can opena large number of ‘no frills’ accounts and still maintaintheir performance level. For instance, Syndicate Bankopened the largest number of ‘no frills’ accounts (1.25million) in 2006-07 - the largest by any single bank in
a single year. As a result, Syndicate Bank constitutedthe largest share in ‘no frills’ accounts by the bankingindustry at end-March 2007. The opening of a largenumber of ‘no-frills’ accounts in a single year, however,did not appear to have affected the financials of theSyndicate Bank as it was able to maintain its returnon assets (RoA) (Table 7.34). It is true that RoA isinfluenced by several factors, nevertheless, theSyndicate Bank case suggests that the opening of‘no-fr i l ls’ accounts may not be a loss-makingproposition. In this context, it may also be noted thatthe average deposit size in the ‘no frills’ accountsincreased in recent years. This trend of increase inaverage deposit size is expected to gain furthermomentum in view of high economic growth.Furthermore, extending banking services to lowerincome groups would trigger a virtuous cycle wherebyaccess to banking services would enable moreequitable distribution of the benefits of high economicgrowth, resulting in improvement in the level of incomeof the lower income groups. This will lead to increasein average deposit size in the accounts opened bythe lower income groups, thereby making financialinclusion an operationally profitable and sustainablebusiness proposition for banks. Moreover, as theeconomy grows and income growth takes place,today’s ‘no frills’ accounts can be expected to assumethe normal account status over the years.
Borrower’s Perspective
7.132 People in India avail credit from a number ofagencies such as banks, MFIs and pr ivatemoneylenders. The cost of borrowing from informal/

340
REPORT ON CURRENCY AND FINANCE
semi-formal sources is significantly higher than theborrowings from banks (Table 7.35). The high cost ofborrowings may be attributed to two factors, viz.,operating cost and risk perception. The operating costof extending credit through MFIs and SHGs modelsincreases because these models involve an additionallayer of intermediation between lenders and ultimateborrowers. As regards risk perception, the higherrecovery rate in the case of SHGs, however, indicatesthat the risk perception about small borrowers shouldbe low. Hence, the high rate charged by MFIs orinformal agencies is either due to high operating costor due to high interest margins charged. As is evidentfrom the experience of several pilot projects in Indiaas well as other countries, the operating cost ofproviding credit to small borrowers could be reducedsignificantly, implying that there is a large scope forreducing interest rates on small loans.
7.133 According to the Report on Costs and Marginof MFIs in India (CAB, 2007), the cost to the borrowerof an MFI generally comprises interest rate and othercharges such as processing/ administrative chargesand upfront levies. The study shows that the all-in-costto a borrower of an MFI varies widely across Stateswith a median value of about 24 per cent (Table 7.36).
Role of Technology
7.134 Technology can play an important role inreducing operating cost of providing banking services,particularly in the rural and low income groupssegments. The technology, if blended appropriatelywith the right business model and policy, holds thekey to extending affordable, viable and sustainableaccess to finance for the population at large. Thereare three broad types of technologies that have beenidentified to drive the growth of financial services.These are (i) pro-poor new information andcommunication technology, primarily low-cost cellphones; (ii) ATMs and other point of sales devices;and (iii) smart plastic card.
7.135 The centralised data processing system andthe non-conventional methods based on computersystems, which do not require uninterrupted electricsupply and radio frequency network, can significantlyreduce the cost of extending financial services. Thereare a number of cases where banks have expandedthe coverage of banking services to remote and un-banked areas with affordable infrastructure, whilekeeping operating costs low with the use ofappropriate technology. Technology has the potentialto lead to new delivery mechanisms and businessmodels. For instance, technology will allow branchlessbanking and establishment of new par tnershipsbetween financial service providers and a range ofother service providers that was not feasible beforeto provide services to clients in remote areas andlow-population density areas.
7.136 Mobile phone-based services arerevolutionising micro-finance services in a number ofcountries (Asian Development Bank, 2007). Mobilebanking (or mobile payment) is a term used forperforming balance checks, account transactions,payments, etc. via a mobile device such as a mobilephone, PDA or other such device. Most of the mobilepayment platforms fall into four categories: (i) mobilebanking enabling users to perform bankingtransactions using mobile phone like, balance checks,fund transfers, bill payments; (ii) remote purchase;(iii) person to person transfers; and (iv) point of sale,i.e., using phones to pay for goods at merchantlocation. These services can be provided using variousavailable connectivity technologies, each one of whichhas its own pros and cons (Table 7.37). However, theextent to which technology will be integrated into thefinancial service industry at the low end will depend onsupportive government policies and the quality of theinfrastructure, particularly in rural areas.
Table 7.35: Cost of Credit from Various Agenciesin India
Lender Category Interest Rate(Per cent per annum)
1 2
SHGs 18-24MFIs 20-24Informal credit providers 18-36Banks (small borrowal accounts) 6-20
Source: 1. Report for the Technical Group to Review of Legislationon Money Lending.
2. Survey of Small Borrowal Accounts, 2004, RBI Bulletin,July 2006.
Table 7.36: Charges of Micro-Finance Institutions(March 2006)
State Range of Cost to theBorrower (per cent)
1 2
Andhra Pradesh 17.0 to 32.5Karnataka 12.0 to 40.0Orissa 14.0 to 24.5Rajasthan 16.0Uttar Pradesh 13.0 to 26.0
Source: CAB. 2007. Report on Costs and Margin of Micro FinanceInstitutions. College of Agricultural Banking (CAB), ReserveBank of India.

341
FINANCIAL INCLUSION
7.137 Different technologies have been successfullyadopted in many countries to promote financialinclusion (Box VII.16).
7.138 Banks in India have initiated pilot projectsutilising smart cards/mobile technology to increasetheir outreach. Biometric methods for uniquelyidentifying customers are also being increasinglyadopted. Banks are also increasingly adoptingtechnological solutions for delivery of credit ataffordable pr ice and to a wider section of thepopulation. State Bank of India (SBI) initiated a project
called the SBI Tiny Card Accounts (SBITCAs) recentlyin Aizwal. The project is a combination of ‘no-frills’account and BCs/BFs model. The SBITCAs areoperated through new generation mobile phonesbased on near-field communication (NFC) technology,enhanced with fingerprint recognition software andattached to receipt printer. The card allows activationof transaction of funds for the purpose of micro-savings (SBI-tiny no-frills pre-paid account), cashdeposits and withdrawal, micro-credit (includingKCCs, GCCs), money transfer (account-to-accountwithin the system), micro-insurance, cashless
Table 7.37: Pros and Cons of Various Technologies
Connectivity Pros Cons
1 2 3
1. Still unreliable – delivery of message is not guaranteed
2. Requires user to remember codes/ keywords
3. Data size per message is restricted to 160 characters
4. Multiple SMS based transactions can cause userresistance
1. GPRS / CDMA still not popular
2. GPRS in particular requires separate hardware and isnot present wherever GSM connectivity is available
3. Both in turn do not have a pan India presence
4. CDMA requires specialised skillset which is not widelyavailable
1. Requires operator’s assistance in replacing existingSIM cards
2. Operator lock-in for banks
3. Technology may not be inter-operable in multipleoperator scenarios
1. Development skillset is rare for CDMA
2. Data security is a concern
1. Still in nascent stages, various pilots being conductedacross the world
2. Mobile phones still costly
1. Not built for mobile transactions
2. Compared to Point of Sale (PoS)/Automated TellerMachine (ATM) devices which are built and certified forbanking activities
3. Primarily Personal Identification Number (PIN) basedauthentication, concerns on ability to remember pinnumbers (Efforts are on to integrate biometric scannerswith phones)
Short MessageService (SMS)
General Packet RadioService (GPRS)/CodeDivision MultipleAccess (CDMA)
Subscriber IdentityModule (SIM) Toolkit
Mobile ApplicationDevelopment
Near FieldCommunication(NFC)
Mobile Phone as adevice
1. Easier to build applications
2. Already a popular medium to communicate
3. Billing activities can be automated by tight integrationwith operator’s systems
1. Provides ability to build advanced features
2. User interacts with a well designed user interface (UI)and does not require training
3. Can integrate seamlessly with e-commerce scenarios
4. Development skillset for GPRS are widely available
1. Ensure availability of application as and when customerbuys a new SIM card
2. Operator is closely associated with the mobile bankingproject and hence the task of delivery of service iseasy
1. Operator independent
2. Development skillset is widely present for GPRS
3. Ability to design and deliver better features and userinterface
1. Ease of use
2. Experience similar to credit card usage
1. Round the clock availability with customer
2. Always on and always connected
3. More handsets, than bank accounts
4. Telecom operators already have sophisticated billingsystems and can deliver banking services independentof banks.
Handset Technologies
Emerging Technology
Source: Agarwal, Gaurav. 2007. “Financial Inclusion through Mobile Phone Banking: Issues and Challenges.” CAB Calling, July-September, 2007.

342
REPORT ON CURRENCY AND FINANCE
In the Philippines, two cell phone companies – Smart andGlobe Telecoms – offer innovative cell phone basedfacilities, also called electronic wallet, to transfer money,pay bills, and make payments for purchases from stores,among other things, called Smart Money and G-Cash,respectively. In February 2005, the Rural BankersAssociation of the Philippines Microenterprise Access toBanking Services (RBAP-MABS) launched a project calledText-A-Payment (TAP). TAP is an innovative mobiletechnology product that uses the SMS technology of GlobeTelecom (powered by G-Cash) to pay for micro financeloan payments of borrowers. TAP seeks to bring in newand low cost technology tools to improve efficiency andoutreach. Small borrowers can utilise the service forpayments of their micro-f inance loans. The otherapplications of TAP are remote deposit taking, cashwithdrawal, international and domestic remittances,purchases and bills payment.
In South Africa, banking institutions, together with mobilephone companies, have begun to expand access tofinancial services targeting low-income customers with an
Box VII.16Technology and Financial Inclusion
interest-bearing bank account accessible through mobilephones, and debit card with which they can makepurchases at retail outlets and deposit or withdraw moneyat ATMs. Customers can use their mobile phones to makeperson-to-person payments and transfer money.
Prodem, the first micro-finance organisation to create achartered bank, BancoSol, in Bolivia started Prodem SmartATM, a smart card cum ATM recently. The smart card storescustomer’s account balance every time the transaction ismade using the card. This enables Prodem Smart ATM tooperate even in the absence of internet connectivity, thereby,making it an ideal instrument to extend financial services inmany rural parts of Bolivia that lack the technologicalinfrastructure for a wide-reaching, online network.
Reference:
Asian Development Bank. 2007. “Low Income Households’Access to Financial Services – International Experience,Measures for Improvement, and the Future.” EARD SpecialStudies, October.
payments to merchants, SHG savings-cum-creditaccounts and attendance systems, disbursements ofGovernment benefits l ike the national ruralemployment guarantee scheme, for equated monthlyinstalments (EMIs), util ity payments, coupons,vouchers and tickets, loyalty points, automatic farecollection systems, portable and fixed positions forfront-end devices (fully inter-operable).
VII. THE WAY FORWARD
7.139 The Government and the Reserve Bank havetaken several initiatives to bring the underprivilegedand weaker sections of the society within the bankingfold, which have had a favourable impact. However,the magnitude of the problem is enormous and still asizeable portion of the rural and urban low incomepopulation (mainly the immigrant labour) has verylittle access to financial services. These groups paya high premium for accessing credit f rommoneylenders and other informal sources. There is,thus, a need to expand the outreach of the formalfinancial system to include rural and urban poor.
Measurement of Financial Exclusion
7.140 The most crucial issue in the context offinancial inclusion is to know the extent to which lowincome households are excluded from the formalfinancial system. Most of the headline indicators such
as bank branch density or bank accounts are onlyproxies for financial inclusion/exclusion. For a moreaccurate assessment of financial inclusion/exclusion,there is a need to have census data on the numberand characteristics of households that have a bankaccount or an account with an institution like bank.Even in the case of census data on the usage ofbanking services, there is a need to distinguishbetween individuals who have voluntarily chosen notto make use of financial services, because of low orno money income, or low money savings, and thosewho need banking services but have been excludedfrom financial services due to several barriers suchas lack of access to financial services, low level ofliteracy, high prices of financial services and complexprocedure of documentation, among others. Such anexercise would involve undertaking specialised anddetailed household surveys. In India, at present, theNSSO conducts several surveys, including urban/ruralindebtedness. It is, therefore, felt that either separatesurveys relating to financial inclusion/exclusion maybe conducted or the scope of the indebtedness surveyby the NSSO could be expanded to include variousaspects of financial inclusion/exclusion. Besides theperiodic surveys, the decadal census may also coverinformation relevant to financial inclusion/exclusion.Such specialised surveys would enable appreciationof the extent of the problem and would help designappropriate policies to close the gap.
343
FINANCIAL INCLUSION
7.141 NABARD presently collects data relating toSHG-bank linkage programme. Such data are alsowidely disseminated. At present, there are also a largenumber of MFIs/NGOs operating in the country.However, there is no comprehensive system forcollecting data/information on various aspects ofthese institutions, which hampers appropriate policyformulation. It is, therefore, felt that a comprehensivesystem of data collection on MFIs/NGOs be put in place.Besides, there is also a need to have information on thenumber of households being financed by MFIs/NGOs.This work could be undertaken by NABARD.
Operating Cost of Financial Inclusion
7.142 One of the most challenging issues in thecase of financial inclusion is the operational viabilityand sustainability of the process of providing financialservices. Several countries have attempted to expandfinancial services coverage through control overfinancial institutions and by providing subsidies. Thishas, however, resulted in mounting fiscal costs makingit fiscally unsustainable (World Bank, 2008). Anotherapproach is to assign the responsibility of financialinclusion to financial institutions. Though financialinclusion provides an oppor tunity to f inancialinstitutions to expand their business by enlarging theircustomer base, the operating cost of expanding thecoverage of financial services could be a major factorinhibiting banks and other financial institutions fromextending various services to the public at large,particularly to low income groups living in rural andremote areas. Credit delivery in rural areas is oftenbelieved to be expensive for banks on account of alarge number of small loan accounts to be serviced.
7.143 The experience of many banks in India as wellas in other countries, however, suggests that theappropriate use of information technology can helpin reducing the cost of providing financial servicesand make it operationally viable to expand thecoverage of financial services. The appropriatetechnology combined with an effective use of bankingcorrespondents has the potential of creating a bankingoutpost/ATM in every village, as has been observedin the case of Andhra Pradesh, which has successfullyimplemented mobile phone technology for providingbanking services in remote areas in coordination withthe Reserve Bank and IDRBT. There are several otherinstances, both within and outside the country, whereit has been observed that technology has the potentialto overcome the problem of high operating cost. Theneed, therefore, is to increase the use of technologyto expand the outreach in the hitherto untapped areas.A wide range of technologies is available. However,
while selecting a technology, banks need to ensurethat the solutions are highly secure, amenable toaudit, and follow widely accepted open standards toensure eventual inter-operability among the differentsystems as was highlighted in the Reserve Bank’sAnnual Policy Statement for the year 2007-08.
Financial Inclusion as an Opportunity
7.144 The operating cost of financial inclusion isperceived to be high as compared with returns fromthe services extended to low income groups. Banks,therefore, are generally averse to voluntar i lyextending financial services to such segments.Several pilot projects and experience of SHGs have,however, proved that such a perception is unfounded.There is a need is to perceive financial inclusion asan opportunity for expanding business in the medium-term, notwithstanding some initial costs. There is alsoa need to recognise the vast potential for investmentin agriculture and allied activities and the entire supplychain. Given the market imperfections in variousaspects of the rural economy, the return oninvestments could be significant. Large local industrialcorporates are already engaging in contract farmingand direct marketing of rural products. Moreover,services and manufacturing activities have also beengrowing faster in rural areas. There is also growth innewer activities such as horticulture, floriculture,organic farming, genetic engineering, besides a rangeof supply chain activities like sorting, grading, storage,transportation, processing, and packaging. All theseemerging activities are credit intensive and haveenormous f inancing potential (Mohan, 2006).Besides, the potential of the rural markets of itemsfor mass consumption is immense as population ismoving laterally in the higher income brackets. In viewof the evidence of a pick-up in consumer financing inrural areas, there is also a need to streamline thesupply chain to deliver credit at the lowest cost to theultimate user in the rural areas, to the benefit of boththe bank and the borrower. Furthermore, there arehuge opportunities in the area of farmer’s insuranceas farmers adopt new and untried technology andincrease input intensities, they face larger risks. All thesepoint to the vast scope for enhancing businessopportunities for banks and financial institutions in therural areas. Banks also need to explore and exploit theavenues in the urban areas.
Multiple-lending by Banks
7.145 As a result of accelerated growth of the MFIssector in the last few years, a few issues have cropped

344
REPORT ON CURRENCY AND FINANCE
up. A joint fact-finding study by the Reserve Bank witha few major banks revealed several cases of multiplelending, and that MFIs were not engaging in capacitybuilding to the desired extent. In order to avoid casesof multiple financing, there is a need to put in place asystem of credit registries (through which lendersshare information about their clients’ repaymentrecords) through credit information bureaus similarto that for the large corporates. Credit registries canincrease access by establishing credit record ofborrowers. This could, to start with, be done by oneof the credit rating agencies for MFIs such as CRISIL,M-CRIL, ICRA or CARE which have been allowed tobe used by banks for rating MFIs. In this context, theCredit Information Companies Act has been notifiedand soon new credit information companies will beauthorised to commence business.
Availability of Suitable Financial Products
7.146 Lack of suitable services/products leaves therural poor with little option than to transact with theinformal sector which accepts small amounts,provide doorstep service, make available funds forall purposes (productive and non-productive suchas consumption needs, festivals, marriages, medicaland emergencies) and ensure ease of operations.Banks and other financial institutions, therefore, alsoneed to design tailor-made thrift, credit, insuranceand remittance products for the poor and weakersections taking into consideration their requirementsand repayment capacity. Apart from savings and loanproducts, poor people also need insurance products.Health related expenditure at times far exceeds theincome levels of many households, which leads themto a situation of debt trap. The insurance companies,therefore, also need to design low cost healthinsurance products for the rural poor. The need isalso felt for weather insurance products to providerelief to farmers in cases of losses due to excess/deficient rainfall.
Financial Literacy and Technology
7.147 Lack of literacy in general and financialliteracy in particular, are considered as the mainhurdles in expanding the coverage of financialservices to the poorer segments of society.Notwithstanding the initiatives taken so far, given thelarge magnitude of the problem, concerted effortsneed to be made in this direction. It is, therefore, feltthat banks should come forward to set up counsellingcentres and guide their clients about the features,benefits and risk of various financial products.
Financial literacy and awareness about financialproducts in rural areas also need to be taken up in abig way. It can be effectively promoted by utilising theservices of postmen and school teachers. The relevantinformation in the form of brochures/pamphlets couldalso be disseminated to people in the rural areas inan organised manner. There is also a need to widelydisseminate the information relating to variouscustomer protection mechanisms, which have beenput in place.
7.148 In some parts of the country, the use of ruralinformation e-kiosks and mobile vans has shownimmense potential in providing information on variousproducts and services in rural areas. The need is toincrease the use of information kiosks to disseminateinformation not only about banking products, but alsoabout input/output prices, insurance products andhealth services. Banks should come forward to setup such kiosks jointly and share the running costsamongst them. It may be mentioned that similar model(e-choupal) has already been implemented by theprivate sector for providing ready information in locallanguage on weather, market prices, scientific farmpractices and risk management. This model presentlycovers more than 31,000 villages and could be utilisedfor promoting financial literacy in association withprivate agencies.
Legislation for Moneylenders
7.149 At present, moneylenders are covered underState-specific legislations which have becomeoutdated in many of the States. The model legislationsuggested by the Technical Group to ReviewLegislation on Money Lending (2007) needs to beexamined further and consideration be given to itspossible implementation with the objective ofmainstreaming the activity of money lending as alsofor strengthening the synergies between the formaland the informal segments, while eliminating itsnegative characteristics and usurious interest rates.
Strengthening the Institutional Structure
7.150 In order to build inclusive financial systems,globally, the focus is not only on specialised micro-credit institutions, but on an array of other financialinstitutions such as postal savings banks, consumercredit institutions, and, most importantly, the bankingsystem. This broader approach is expected to expandthe outreach of the financial services industry.
7.151 India also has a well-diversified structureof financial institutions such as commercial banks,

345
FINANCIAL INCLUSION
co-operative banks at different levels, pr imaryagricultural credit societies, insurance companies andpost-off ices. The need is to involve not onlycommercial banks but also other f inancialintermediaries such as insurance companies andpost-offices for promoting the cause of financialinclusion. The RRBs and co-operative banks, inparticular, can play an important role. However,because of their fragile financial health, they havelagged behind in furthering the cause of financialinclusion. As alluded to earlier, the number of creditaccounts held by RRBs in relation to those held bySCBs declined significantly between 2001 and 2007.The Government has already restructured RRBs andapproved revival package of short-term rural co-operative credit structure. The revival package of long-term rural co-operative credit structure is also beingworked out. It is expected that in future these institutionswould play a far greater role in promoting financialinclusion. Apart from RRBs and other co-operativeinstitutions, joint liability groups and SHGs model couldalso be used to extend credit to small and marginalfarmers, oral lessees and sharecroppers.
Role of the Government
7.152 Credit alone may not help in improving theincome and productive capacities of the rural poor asthe credit absorptive capacity would depend uponvarious other factors such as appropriate policyenvironment, coupled with infrastructure and supplychain facility. The Government has an important rolein building adequate infrastructure such as roads,electricity, public transport and marketing facilitieswhich would facilitate production and distribution ofoutput by the people residing in rural and remoteareas. Government expenditure on social servicessuch as health, education, water and sanitation wouldalso enhance credit absorptive capacity of theborrowers. Fur thermore, a large propor tion ofborrowings by low income households takes placefor medical and other emergencies. Thus, borrowingsfrom non-institutional sources to a significant extentcould be reduced if health care, education and otherservices are provided to rural households atreasonable cost, including appropriate medicalinsurance at a reasonable premium. The results ofempirical exercise discussed earlier in this chapterconfirmed that infrastructure plays a significant rolein promoting financial inclusion as well as economicgrowth. The Government, therefore, has a crucial rolein facilitating financial inclusion by strengthening therural infrastructure and providing enabling conditionsas alluded to in Chapter VI also.
Evaluation of Banks’ Performance for PromotingFinancial Inclusion
7.153 In order to promote financial inclusion, it isnecessary to monitor the performance of banks. Insome countries such as US, there is a system ofevaluation of banks’ performance. A system ofevaluation of banks’ performance in India may,therefore, also be put in place. Under this system,Indian banks may be rated, say every two to threeyears, on their performance relating to financialinclusion and such assessment could also be put inthe public domain. Such a system, through peerpressure, would help encourage financial inclusionefforts of banks.
VIII. SUMMING UP
7.154 Notwithstanding the widely recognisedimportance of financial inclusion, it has no universallyaccepted definition. The working or operationaldefinitions of financial inclusion generally focus onownership or access to particular financial productsand services such as deposits, credit, long-termsavings, money transfer and insurance provided bythe mainstream financial service providers. Basedon this definit ion, f inancial inclusion is oftenmeasured in terms of indicators such as number ofbank accounts. There is, however, broad agreementthat the financial exclusion cannot be measured bya single indicator. Therefore, multiple indicators havebeen used which include proportion of populationwith a bank account, population which uses theservices of any formal financial institution, peoplereceiving money regularly through formal financialinstruments, people keeping money in formalfinancial institutions, and persons who have obtainedor have loan or credit facility outstanding from aformal financial institution.
7.155 In the Indian context, financial inclusion hasbeen described as the provision of affordable financialservices, viz., access to payments and remittancefacilities, savings, loans and insurance services bythe formal financial system to those who are excluded.Deepening the financial system and widening its reachis crucial for both accelerating growth and for equitabledistribution. The major causes of financial exclusionoften cited include relatively low extension ofinstitutional credit in rural areas due to perception ofhigh r isk, high operating costs, lack of ruralinfrastructure, and vast geographical spread of thecountry with more than half a million villages, somesparsely populated. The micro factors, which areperceived to inhibit credit flow to disadvantaged

346
REPORT ON CURRENCY AND FINANCE
groups, mainly include factors such as lack ofawareness of financial products and services, theprocedures for obtaining agricultural non-farm loans,staffing and human resources, and lack of effectivelegislation for regulating money lending. From thedemand perspective, low income and savings levelcould lead to lower demand for financial services,particularly the deposit facilities.
7.156 India has adopted a multi-pronged approachtowards financial inclusion as has been the case inseveral other countries. Though the term financialinclusion is of recent origin, the efforts to bring thepoorer and weaker segments of the society within thefold of the formal banking system were initiated bothby the Reserve Bank and the Government beginningas back as the late 1960s. The specific policyinitiatives towards financial inclusion in India broadlyfall under three phases with the first one starting inthe late 1960s through the 1980s with the focus oncredit channelling to ensure equitable growth. Thenationalisation of banks, directed lending to prioritysectors, suitable changes in the branch licensingpolicy, introduction of specific schemes, establishmentof specialised institutions and interest rate regulationwere some of the major policy initiatives undertakenby the Government and the Reserve Bank to bringthe weaker sections within the fold of the bankingsystem. The second phase of financial inclusionspanning the early 1990s to early 2005 focussed onstrengthening the financial institutions. The majorfinancial inclusion initiatives taken in this phase wereintroduction of SHG-bank linkage programme in theearly 1990s and introduction of KCCs. Efforts to bringfinancially excluded people within the banking foldreceived a major boost in April 2005, when financialinclusion was explicitly made a major policy objective.Introduction of ‘no-frills’ accounts in November 2005was another major step for providing safe savingsdeposit facility to the rural and urban poor. Thus, a widenetwork of institutions has been established in order toexpand the outreach of financial services to people.
7.157 Formal financial services have expandedrapidly in recent years. The question, therefore, arisesas to what has been the impact of various measureson financial inclusion. Arriving at firm conclusions onthe extent of financial inclusion or its obverse, i.e.,exclusion, is not easy from the existing data sources.There are differences in the data available fromvarious sources and much more work needs to bedone to reconcile these data. Nevertheless, theavailable information suggests that beginning fromthe late 1960s, significant progress has been made
to bring more and more people within the fold of formalfinancial institutions. This trend continued even in the1990s. Data on the household surveys by the NSSOsuggest that the share of number of householdsaccessing credit from non-institutional sourcesdeclined significantly from the late 1960s through1980s. The share, however, increased in the 1990s.A detailed analysis of various aspects, however,suggests that number of indebted households andtheir outstanding debt increased sharply between1991 and 2002. The increased debt was mainly forconsumption and similar other purposes for which thefinance could not be easily availed of from formalsources. As a result, the share of householdindebtedness to non-institutional sources increasedbetween 1991 and 2002 even as credit to householdsby various institutional sources grew broadly at thesame rate between 1991 and 2002 as between 1981and 1991. Within institutional sources, credit by banksgrew at a marginally lower rate between 1991 and2002 compared with that between 1981 and 1991.However, it needs to be viewed in the context of banks’increased focus in the 1990s on strengthening of theirbalance sheets and some risk aversion developed bybanks on account of application/tightening of prudentialnorms, as a result of which banks’ overall credit portfolioalso slowed down.
7.158 The reference year for the latest NSSO datawas 2002. An analysis of more recent BSR datareveals that there has been a distinct improvement incredit penetration (credit accounts per 100 persons)and credit flow to the rural sector in general and toagriculture, in particular, since the early 2000s, thatis, after the release of the NSSO data. Respondingto the initiatives taken in recent years, the number ofcredit accounts with all organised financial institutions(commercial banks, RRBs, UCBs, PACS, MFIs andSHGs) per 100 adults improved from 18 in 2002 to25 in 2007.
7.159 On the deposit side also, the outreach oforganised financial institutions expanded over theyears. The number of savings accounts with all formalinstitutions increased to 54 per 100 persons (82 per100 adults) in 2007 from 51 in 1993. However, afterfactoring in people below poverty line, who have littleor no capacity to save, there are a little more than100 savings accounts per 100 adults above povertyline. With faster growth in income, people may moveinto higher income brackets. As poverty levels declineand households income levels rise, their propensityto save would also go up. Such people would needeasy access to the formal financial system to develop

347
FINANCIAL INCLUSION
the banking habits. Banks, therefore, would need toinnovate and devise newer methods of bringing suchcustomers into their fold.
7.160 Through housing and retail credit, banks havebeen able to br ing an increasing number ofhouseholds into the fold of formal credit. However,most of the expansion has taken place in cities andlarge towns. There is an enormous potential forexpanding financial services in semi-urban and ruralareas. With increasing urbanisation on the one hand,and spread of non-farm based activities in rural areason the other, credit demand is expected to increase.Agricultural activity is also getting increasinglycommercialised which would generate new businessopportunities for banks. Banks, therefore, would alsoneed to carefully examine the benefits of increasingpenetration in rural areas. These developmentssuggest that the demand for financial services, bothfor savings and production purposes, would be greaterthan that has been in the past. To meet the growingcredit demand, banks would need to mobiliseresources on a larger scale than hitherto. This wouldpromote financial inclusion and strengthen financialdeepening. Along with extending credit to a variety ofenterprises in both organised and unorganisedsectors, the f inancial system would have tosimultaneously enhance the risk assessment and riskmanagement capacities in order to maintain creditquality and sustain the credit growth.
7.161 The key to enhanced financial inclusion isreduction in transaction costs. The operating cost ofproviding small accounts at times is a hindrance tothe expansion of banking services to low incomegroups. The experience of some institutions in thecountry as well as in other countries, however,suggests that an appropriate use of technology couldsignificantly reduce the operating cost of financialinclusion and make it a viable and sustainable activity.
The availability of new information technology,expansion of credit information services, innovationsin micro-finance and the non-conventional modes ofdelivery of f inancial products offer fur theropportunities for reducing transaction costs in dealingwith small savers and borrowers. The challenge, thus,is to increase the scope and coverage of financialinclusion by addressing deficiencies such as lack ofadequate infrastructure, higher transaction costs andlow volumes of transactions.
7.162 From the perspective of insti tut ionaldevelopment, the role of RRBs and co-operativebanks, which were established to expand the deliveryof financial services in the unbanked sectors/segments, suffered a setback due to their poorfinancial health. With the recent init iatives tostrengthen them, it is expected that they would play agreater role in promoting financial inclusion. Consideringthe significance of moneylenders, especially in the ruralcredit delivery system, there is also a need forexpeditious implementation of the model money lendinglegislation by the State Governments.
7.163 Sustainable financial inclusion processdepends on several factors. Credit counselling canplay a crucial role in improving the prospects ofrepayment of loans. Though a beginning has beenmade in India to provide credit counselling, there is aneed to step up effor ts in this direct ion. TheGovernment can help in improving the absorptivecapacity of financial services by creating an enablingenvironment by strengthening the basic infrastructure.Investment in human development such as health,water and sanitation, and education would alsoimprove the credit absorptive capacity of borrowers.Apart from this, efforts to promote financial literacycan go a long way in improving the use of variousfinancial services, particularly by the weaker andpoorer sections of the society.

348
REPORT ON CURRENCY AND FINANCE
(i) Farm business: Farm business comprisedhousehold economic activities like cultivation,including cultivation of plantation and orchardcrops, and processing of produce on the farm,e.g., paddy hulling and gur making. Although gurmaking is a manufacturing activity, this wascovered under farm business only when suchactivity was carried out in the farm by indigenousmethod.
(ii) Non-farm business: Non-farm business wasdefined as all household economic activitiesother than those covered in the farm business.This cover manufacturing, mining and quarrying,trade, hotel and restaurant, transpor t,construction, repairing and other services. Forthe purpose of this survey, non-farm businessshall exclude such activities when they arecarried out in non-household enterprises. Non-farm business enterpr ises, which wereregistered under section 2m(i) or 2m(ii) andsection 85 of Factories Act, 1948 and Bidi andcigar manufacturing establishments registeredunder Bidi and Cigar Workers (condition ofemployment) Act, 1966 were kept outside thecoverage of the survey.
(iii) Capital expenditure in farm business: Theexpenditure incurred in farm business onaccount of purchase, own construction, majorrepairs, bunding and other land improvementincluding reclamation of land, alterations andimprovement of buildings and otherconstructions constituted the capital expenditurein farm business.
(iv) Current expenditure in farm business: Thiscomprised the current expenditure in the farm
Annex VII.1: Definitions of Various Types of Expenditure Used in the NSSO Survey
business for purchases of seeds, manure,fodder, payment of wages, rent, land revenueetc. and that for normal repairs and maintenanceof buildings, constructions, machinery andequipment including transpor t equipment,furniture & fixtures and household durablesmeant for the farm business.
(v) Capital expenditure in non-farm business: Itconsisted of the expenditure in non-farmbusiness incurred on account of purchase, ownconstruction, additions, alternations, majorrepairs and improvements of buildings, otherconstructions and machinery and equipmentincluding transport equipment, furniture andfixture. It also included bunding and other landimprovement, including reclamation of land,pertaining to non-farm business.
(vi) Current expenditure in non-farm business:This was made up of the current expenditure innon-farm business for raw materials, fuel andlubricants, payment of rent, salaries and wages,hire charge of machinery and equipment etc.and normal repairs and maintenance ofbuildings, construction, machinery andequipment including transpor t equipment,furniture and fixtures and household durablesmeant for the non-farm business.
(vii) Household expenditure: The expenditureincurred on account of purchase of residentialplot, purchase, construction, addition/ alterationof building for residential purposes, purchaseof durable household assets, cloths etc. andexpenditure for medical treatment, education,marriages, ceremonies etc. constituted thehousehold expenditure.