safetydata.fra.dot.govsafetydata.fra.dot.gov/OfficeofSafety/Documents/... · Web viewType in the...
56
Searching the Contents of the FRA Safety Data Web Site ***IMPORTANT*** To figure out which FRA Safety Data Query you’ll need to use, it can help to know what you are looking for. The easiest way to find what you want is to search by keyword. To find what you want, you’ll be doing a keyword search for specific terms by using Control F feature (i.e. find) in Adobe PDF or MS Word. The OUTPUT TABLE COLUMNS is where you’ll want to look first. 1) Hold down CRTL key, while tapping “F” 2) A SEARCH (or NAVIGATE) box will pop up. 3) Type in the key word you want…. i.e. “collisions”, or “passengers” 4) The search feature will find all occurrences of that word. 5) Hints: Use the basic form of the word. If you can’t find the phrase, choose the most descriptive word from the phrase and try that. 1.02 Operational Data Tables The Operational Data Tables report is based on the regulation- required monthly reporting of operational railroads. The form used to populate the output is the 6180.55, or the “55”. Counts displayed are per month, with a separate table for each calendar year. SELECTION PARAMETERS: Reporting Level, Railroad, Sort, Start Year, End Year Title of Output Table(s): Operational Data, By Month
Transcript of safetydata.fra.dot.govsafetydata.fra.dot.gov/OfficeofSafety/Documents/... · Web viewType in the...

Searching the Contents of the FRA Safety Data Web Site
***IMPORTANT***
To figure out which FRA Safety Data Query you’ll need to use, it can help to know what you are looking for. The easiest way to find what you want is to search by keyword. To find what you want, you’ll be doing a keyword search for specific terms by using Control F feature (i.e. find) in Adobe PDF or MS Word. The OUTPUT TABLE COLUMNS is where you’ll want to look first.
1) Hold down CRTL key, while tapping “F” 2) A SEARCH (or NAVIGATE) box will pop up. 3) Type in the key word you want…. i.e. “collisions”, or “passengers”4) The search feature will find all occurrences of that word. 5) Hints: Use the basic form of the word. If you can’t find the phrase, choose the most descriptive word from the phrase and try
that.
1.02 Operational Data Tables
The Operational Data Tables report is based on the regulation- required monthly reporting of operational railroads. The form used to populate the output is the 6180.55, or the “55”. Counts displayed are per month, with a separate table for each calendar year.
SELECTION PARAMETERS: Reporting Level, Railroad, Sort, Start Year, End Year
Title of Output Table(s): Operational Data, By Month
OUTPUT TABLE COLUMNS:
Total Train Miles
Employee Hours Worked
Yard Switching Miles
Number of Passengers Transported
Passenger Miles*
Reports*

Footnotes:
* The movement of a passenger for a distance of one mile.
Total train miles includes yard switching miles.
1.11 One Year Accident/Incident Overview – Combined
The One Year Accident / Incident Overview report displays about 70 measures in a more readable text report format. Optional date ranges are by fiscal or calendar year, one year at a time only. Incidents, accidents, other incidents, grade crossing counts, trespasser data, employee on duty data and highway – rail accident counts are all displayed. Note: Incident and Accident rates, and the counts that go into them (Train Miles, Yard Switching Miles, Other Miles, Employee Hours), are automatically set to 0 on REGION, STATE and COUNTY geography levels. This is due to the way the data is reported by railroads: national level only, and therefore the counts are not valid for a railroad below that level.
SELECTION PARAMETERS: Reporting Level, Railroad, Sort, Region, State, County, Type of Report Requested, Start Month for Report, End Month for Report
OUTPUT TABLE COLUMNS:
Total accidents/incidents count
Total # Accident/Incidents with fatalities
Total Rate Accident/Incidents with fatalities
Total accident/Incident Rate
Total Train Miles
Total Fatality count
Total Switching Miles
Total nonfatal conditions (injuries)
Employee Hours
Total Train
Accidents
Rate fatal Train accidents
Number fatalities per million train miles
Number Collisions
Total Fatalities(?)
Number Derailments
Total Injuries
Other accidents
Primary Cause Human Factor - percent
Primary Cause Human Factor - Count
Primary Cause Track - percent
Primary Cause Primary Cause Primary Cause Primary Primary Primary Count Percent Rate Rate

Equipment - percent
Equipment - Count
Signal - percent
Cause Signal - Count
Cause Miscellaneous - percent
Cause Miscellaneous - count
Accidents Yard Track
Accidents Yard Track
Accidents per million yard trrain miles
Accidents per million miles - other
Overall percentage of train accidents per all incidents
Number of train accidents involving passenger trains
Percentage of train accidents involving passenger trains
Number of train accidents resulting in HAZMAT release
Percentage of train accidents resulting in HAZMAT release
Number of persons evacuated in HAZMAT release
Number of railcars releasing HAZMAT
Number of Highway Rail Crossings
Number of Highway Rail Incidents
Grade Crossing Incidents per million train miles
Trespasser Incident Frequency per million train miles
Total Grade Crossing Fatalities
Total Trespasser Fatalities
Total Grade Crossing Injuries
Total Trespasser Incidents
Number of Public Crossngs
Number Public Crossings with Gates
Other activated Crossings
Number Crossings with Passive Warnings
Number Private Crossings
Highway Rail and Trespasser Fatalities as percent of all fatalities
Highway Rail and Trespasser Incidents as percent of all incidents
Number Other Incidents
Number of fatalities other incidents
Percent of fatalities other incidents
Percent of other incidents versus all incidents
Total fatalities
Total fatalities EOD
Total fatalities trespassers
Total non-fatal conditions - injuries
Total non-fatalities EOD
Employee on Duty (EOD) cases
Frequency EOD per 200K hours worked
Total EOD fatalities
% EOD fatalities versus all fatalities
Total EOD injuries
% EOD injuries versus all
Number passengers carried
Number of passenger miles
Number passenger

injuries deaths
Number passenger injuries
rate passenger cases per 100,000,000 miles
1.12 Ten Year Accident / Incident Overview
The Ten Year Accident / Incident Overview report displays almost 60 measures within Table 1. Optional date ranges are by fiscal or calendar year: nine years plus one partial year or a full 10 years. The limited nine – plus display is in cases where the most current data available does not complete the year. Table 1 concentrates on the most commonly asked for measures of the Safety Data Information Management staff. Incidents, accidents, other incidents, grade crossing counts, trespasser data, employee on duty data and highway – rail accident counts are all displayed.
Table 2 displays the same date ranges as Table 1. Date ranges are by fiscal or calendar year: nine years plus one partial year or a full 10 years. There are nine measures giving general counts about the railroad, accident form counts, and whether the railroad is counted as an “Individual” “System” or “Consolidated railroad. Since for any particular incident multiple forms could be required to fully describe what happened, statistics are given about record counts of each major form for each railroad examined:
Form 54 – Reportable accidents Form 55A – Injuries and fatalities Form 57 – Grade Crossing specific incidents
Individual Reporting Level – counts displayed are for the chosen railroad code only – no aggregation takes place.

System reporting Level – Larger railroads (Class 1, Larger Class 2’s mostly) are often made up of a few, or many, smaller railroads. This reporting aggregates all of the railroads in a “system” together.
Consolidated Level – this is a special case reporting aggregation, allowed only for a few specific railroads who requested special consideration.
SELECTION PARAMETERS: Reporting Level, Railroad, Sort, Railroad Group, Region, State, County, Type of Report Requested, Start Month for Report, End Month for Report
OUTPUT TABLE COLUMNS:
1.12 - TEN YEAR ACCIDENT / INCIDENT OVERVIEW
Number of railroads
included in analysis
TOTAL ACCIDENTS/INCIDENTS 1/
..... RATE of Total Accidents / Incidents per million train miles
Total fatalities
Total nonfatal conditions - injuries
Employee on duty deaths
Nonfatal Employee On Duty injuries
Nonfatal Employee On Duty illnesses
Total employee on duty cases
Employee hours worked
Cases with days absent from work
Trespasser deaths, not at HRC
Trespasser injuries, not at HRC
Passengers kld in train accs or crossing incidents
Passengers inj in train accs or crossing incidents
Passengers kld in other incidents
Passengers inj in other incidents
Passengers transported
Total train miles
Yard switching miles
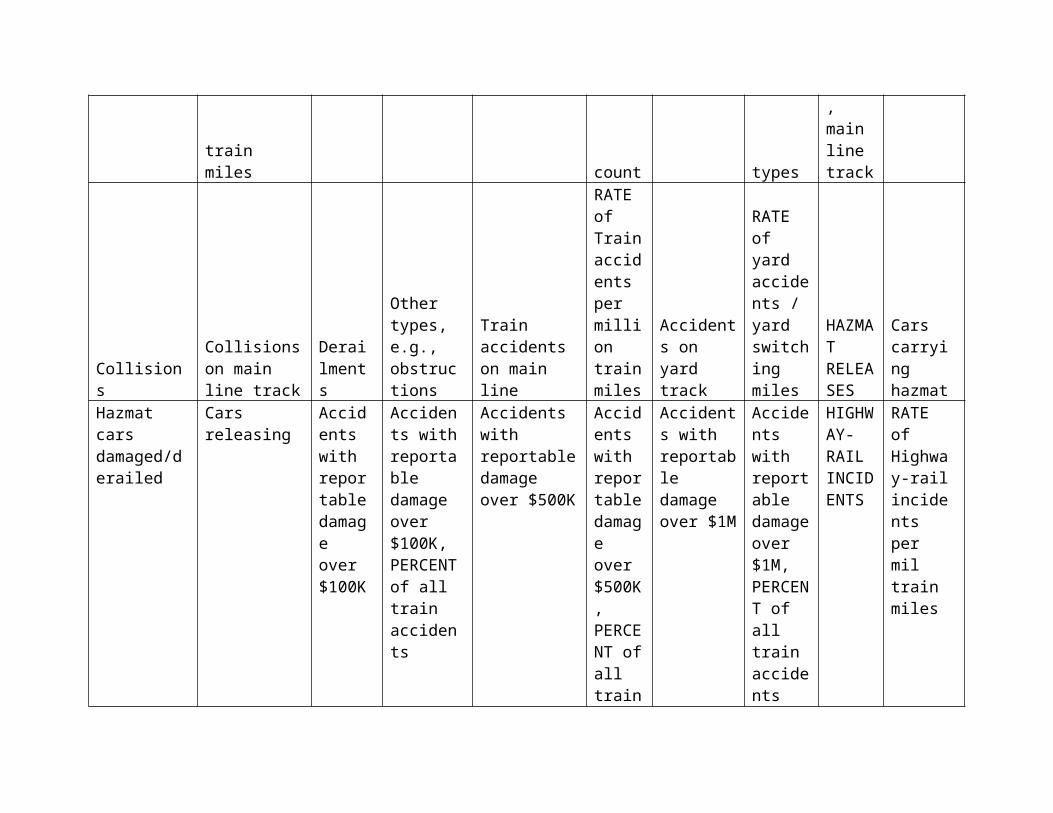
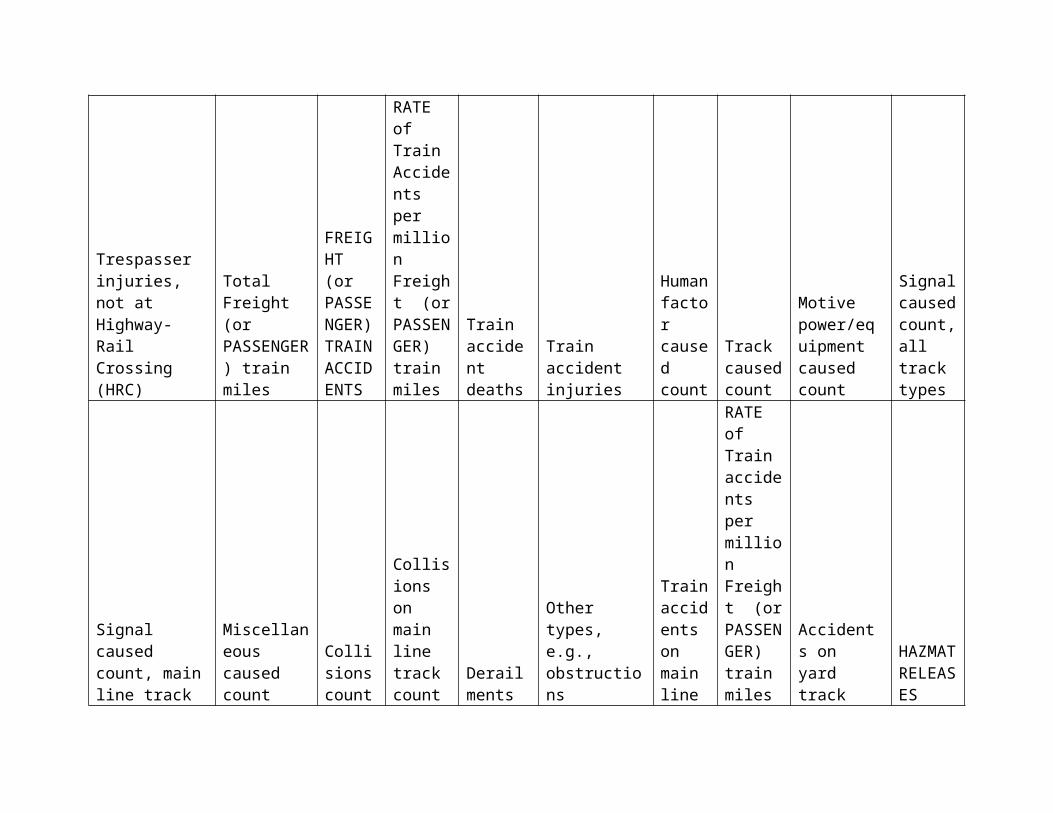
TRAIN ACCIDENTS
RATE of Train Accidents per million train
Train accident deaths
Train accident injuries
Human factor caused count
Track caused acciden
Motive power/equipment
Signal caused count, all
Signal caused count,
Miscellaneous caused

miles t countcaused count
track types
main line track
CollisionsCollisions on main line track
Derailments
Other types, e.g., obstructions
Train accidents on main line
RATE of Train accidents per million train miles
Accidents on yard track
RATE of yard accidents / yard switching miles
HAZMAT RELEASES
Cars carrying hazmat
Hazmat cars damaged/derailed Cars releasing
Accidents with reportable damage over $100K
Accidents with reportable damage over $100K, PERCENT of all train accidents
Accidents with reportable damage over $500K
Accidents with reportable damage over $500K, PERCENT of all train accidents
Accidents with reportable damage over $1M
Accidents with reportable damage over $1M, PERCENT of all train accidents
HIGHWAY-RAIL INCIDENTS
RATE of Highway-rail incidents per mil train miles
Highway-rail incidents deaths
Highway-rail incidents injuries
Incidents at public xings
PERCENT of total Highway-rail incidents
OTHER ACCIDENTS/INCIDENTS counts
Other incidents deaths counts
Other incidents injuries counts
OUTPUT TABLE COLUMNS:
Railroad Total Percent of Form 57 Form 57 Form 55A Form 55A System Consolidated

Accident / Incident Records Count
Total Accident / Incident
(Grade Crossing Incidents) Count
Percent of Accident / Incident Railroad Total
(Casualties) Count
Percent of Accident / Incident Railroad Total
Railroad Code
Railroad Code
FOOTNOTE 1. Form 55a used for reporting deaths and injuries. Form 54 for train accidents, and Form 57 for highway-rail crossing incidents
1.13 - Freight/Passenger Operations Ten Year Overview
The Freight – Passenger Operations Ten Year Overview report is specific to Freight or Passenger railroads. It will display only one or the other. The report displays 48 measures, the same in many cases to the counts and rates in the standard Overview from 1.12. It is also a “ten year” report, Fiscal or Calendar year - nine years plus one partial year or a full 10 years. The limited nine – plus display is in cases where the most current data available does not complete the year.
There is a special case note displayed on this report: Freight and Passenger Operational data cannot be combined for comparison with the results of other accident/incident reports due to the fact that these operational reports are based on type of equipment reported to FRA and the fact that both freight and passenger equipment may be involved in a single accident/incident.
SELECTION PARAMETERS: Freight or Passenger Button, Region, State, County, Type of Report Requested, Start Month for Report, End Month for Report
OUTPUT TABLE COLUMNS:
TOTAL FREIGHT (or PASSENGER) ACCIDENTS/INCI
DENTS
RATE of Total Acc/Incs per mil Freight (or PASSENGER) train miles
Total fatalities
Total nonfatal conditions
Employee On Duty (EOD) deaths
Nonfatal Employee On Duty (EOD) injuries
Nonfatal Employee On Duty (EOD)
Total Employee On Duty (EOD) cases
Cases with days absent from work
Trespasser deaths, not at Highway-Rail
illnesses
Crossing (HRC)
Trespasser injuries, not at Highway-Rail Crossing (HRC)
Total Freight (or PASSENGER) train miles
FREIGHT (or PASSENGER) TRAIN ACCIDENTS
RATE of Train Accidents per million Freight (or PASSENGER) train miles
Train accident deaths
Train accident injuries
Human factor caused count
Track caused count
Motive power/equipment caused count
Signal caused count, all track types
Signal caused count, main line track
Miscellaneous caused count
Collisions count
Collisions on main line track count
Derailments
Other types, e.g., obstructions
Train accidents on main line
RATE of Train accidents per million Freight (or PASSENGER) train miles
Accidents on yard track
HAZMAT RELEASES
Cars carrying hazmat
Hazmat cars damaged/derailed
Cars releasing
Accidents with reportable damage over $100K
Accidents with reportable damage over $100K, PERCENT
Accidents with reportable damage over $500K
Accidents with reportable damage over
Accidents with reportable damage over $1M
Accidents with reportable damage over $1M, PERCENT of all train
FREIGHT (or PASSENGER) HIGHWAY-RAIL INCIDEN

of all train accidents
$500K, PERCENT of all train accidents accidents TS
RATE of Highway-rail incidents per mil Freight (or PASSENGER) train miles
Highway-rail incidents deaths
Highway-rail incidents injuries
Incidents at public xings
PERCENT of total Highway-rail incidents
OTHER FREIGHT (or PASSENGER) ACCIDENTS/INCIDENTS
Other incidents deaths
Other incidents injuries
1.14 Graphic Ten Year Accident/Incident Overview
The Graphical Ten Year Accident / Incident Overview displays a large number of graphs, based on SELECTION PARAMETERS chosen. It displays graphical representations of many of the most important data measures found in Query 1.12. It is also a “ten year” report, Fiscal or Calendar year - nine years plus one partial year or a full 10 years. The limited nine – plus display is in cases where the most current data available does not complete the year. The 1.14 query also replaces the old 1.03 and 1.04 queries (which will be retired), since the same measures are displayed.
SELECTION PARAMETERS: Reporting Level, Railroad, Sort, Railroad Group, Region, State, County, Type of Report Requested, Start Month for Report, End Month for Report
OUTPUT TABLE COLUMNS:
Tran Accidents and
Incidents
Human Factor Rate
Track – Cause Rate
Equipment Defect
Total Signal and Miscellaneous Cause Rate
High – Rail Incident Rate
Total Train Miles
Train Accident Rate
Total Fatalities
Total Non – Fatal Conditions - Injuries

Rate
Trespasser Fatalities
Trespasser Injuries
Employee on Duty Fatalities
Employee On Duty Injuries
Employee Hours Worked
Employee On Duty Cases
2.03 Train Accidents by Railroad Groups
Train Accident by Railroad Groups emphasizes the role that railroad groups play in the accident data. ‘Group’ is FRA distinction determined by the number of Employee Hours Worked.
Group 1 = Class 1 railroads Group 2 = railroads with > 400,000 employee hours worked that year Group 3 = railroads with < 400,000 employee hours
There are five tables on the output, with all columns labeled essentially the same - column labels varying only by date range and whether “Year” = Calendar Year (CY) or “Year” = Fiscal Year (FY). Accident counts displayed are for the last three full years plus the fourth partial to full year. Table classes are by
railroad state track class (main, siding, etc.) primary location of the accident site type of railroad equipment involved what the employee was doing (physical activity) primary location of the accident site and the immediate area description
SELECTION PARAMETERS: Railroad Group, Region, State, County, Type of Accident, Type of Track, Primary Cause of Accident, End Month, Last Year of 3 Year Comparison
Output Tables
ACCIDENTS IN DESCENDING FREQUENCY BY RAILROAD ACCIDENTS IN DESCENDING FREQUENCY BY STATE ACCIDENTS IN DESCENDING FREQUENCY BY TRACK CLASS ACCIDENTS IN DESCENDING FREQUENCY BY CAUSE ACCIDENTS IN DESCENDING FREQUENCY BY TYPE
OUTPUT TABLE COLUMNS:
Total Accidents
Percent of All Accidents
Total Year Counts Year 1
Total Year Counts Year 2
Total Year Counts Year 3
Year Total Counts (start month to end month) Year 3
Year Total Counts (start month to end month) Year 4
Percent Change Over Time, Year 1 to Year 3
Percent Change Over Time, Year 2 to Year 3
Percent Change Over Time, Year 3 to Year 4
2.04 Employee on Duty Casualties
Employee on Duty Casualties displays injury and fatality count statistics for employees on the job while working with rail equipment. There are seven tables on the output, with all columns labeled essentially the same - column labels varying only by date range and whether “Year” = Calendar Year (CY) or “Year” = Fiscal Year (FY). Accident counts displayed are for the last three full years plus the fourth partial to full year. Table classes are by
state railroad employee job primary location of the accident site type of railroad equipment involved

what the employee was doing (physical activity) primary location of the accident site and the immediate area description
SELECTION PARAMETERS: Reporting Level, Railroad, Sort, Region, State, County, Casualty Subsets, Location, Job Code Categories, Type of Report Requested, Start Month for Report, End Month for Report
Output Tables CASUALTIES (DEATHS AND INJURIES TO EMPLOYEES ON DUTY - (By State) CASUALTIES (DEATHS AND INJURIES TO EMPLOYEES ON DUTY - (By Railroad) CASUALTIES (DEATHS AND INJURIES TO EMPLOYEES ON DUTY -(By Job Type) CASUALTIES (DEATHS AND INJURIES TO EMPLOYEES ON DUTY -(By Primary Location) CASUALTIES (DEATHS AND INJURIES TO EMPLOYEES ON DUTY -(By Equipment Involved) CASUALTIES (DEATHS AND INJURIES TO EMPLOYEES ON DUTY -(By Physical Activity) CASUALTIES (DEATHS AND INJURIES TO EMPLOYEES ON DUTY -(By Type of Equipment and Location)
OUTPUT TABLE COLUMNS:
Total Cases Percent of All Cases
Total Year Counts Year 1
Total Year Counts Year 2
Total Year Counts Year 3
Year Total Counts (start month to end month) Year 3
Year Total Counts (start month to end month) Year 4
Percent Change Over Time, Year 1 to Year 3
Percent Change Over Time, Year 2 to Year 3
Percent Change Over Time, Year 3 to Year 4

2.05 Employee on Duty Casualties – Rates
Employee on Duty Casualties displays injury and fatality rates for employees on the job while working with rail equipment. Rates are calculated by: Injury or Fatality Count/200K Employee Hours. Accident counts displayed are for the last three full years plus the fourth partial to full year.
There are seven tables on the output, with all columns labeled essentially the same - column labels varying only by date range and whether “Year” = Calendar Year (CY) or “Year” = Fiscal Year (FY).
SELECTION PARAMETERS: Reporting Level, Railroad, Sort, Casualty Subsets, End Month for Report, Last Year of 3 Year Comparison
Output Tables
CASUALTIES (DEATHS AND NONFATAL INJURIES AND ILLNESSES), EVENTS (what happened) DISPLAYED IN DESCENDING FREQUENCY
CASUALTIES (DEATHS AND NONFATAL INJURIES AND ILLNESSES), DISPLAYED IN DESCENDING FREQUENCY
OUTPUT TABLE COLUMNS:
Total Cases Percent of All Cases
Total Year Counts Year 1
Total Year Counts Year 2
Total Year Counts Year 3
Year Total Counts (start month to end month) Year 3
Year Total Counts (start month to end month) Year 4
Percent Change Over Time, Year 1 to Year 3
Percent Change Over Time, Year 2 to Year 3
Percent Change Over Time, Year 3 to Year 4

2.07 Trespasser Casualties
Trespasser Casualties displays injury and fatality count statistics for railroad trespassers. Trespasser casualty counts displayed are for the last three full years plus the fourth partial to full year. There are five tables on the output, with all columns labeled essentially the same - column labels varying only by date range and whether “Year” = Calendar Year (CY) or “Year” = Fiscal Year (FY). Table classes are by
state railroad age how the trespasser casualty was caused (event) what the employee was doing (physical activity)
SELECTION PARAMETERS: Reporting Level, Railroad, Sort, Region, State, County, Casualty Subsets, Type of Report Requested, Start Month for Report, End Month for Report
Output Tables
TRESPASSER CASUALTIES (DEATHS AND INJURIES) (BY …) (EXCLUDES HIGHWAY-RAIL INCIDENTS) -- By State TRESPASSER CASUALTIES (DEATHS AND INJURIES) (BY …) (EXCLUDES HIGHWAY-RAIL INCIDENTS) -- By Railroad TRESPASSER CASUALTIES (DEATHS AND INJURIES) (BY …) (EXCLUDES HIGHWAY-RAIL INCIDENTS) -- By Age TRESPASSER CASUALTIES (DEATHS AND INJURIES) (BY …) (EXCLUDES HIGHWAY-RAIL INCIDENTS) -- By Event TRESPASSER CASUALTIES (DEATHS AND INJURIES) (BY …) (EXCLUDES HIGHWAY-RAIL INCIDENTS) -- By Physical Activity and
Event
OUTPUT TABLE COLUMNS:
Total Cases Percent of All Cases
Total Year Counts Year 1
Total Year Counts Year 2
Total Year Counts Year 3
Year Total Counts (start month to
Year Total Counts (start month to
Percent Change Over Time, Year 1 to
Percent Change Over Time, Year 2 to
Percent Change Over Time, Year 3 to

end month) Year 3
end month) Year 4
Year 3 Year 3 Year 4
2.08 Highway-Rail Crossings
Highway –Rail Crossings displays statistics for incidents involving rail equipment at grade crossings (the standard at-grade railroad crossing). Crossing incident counts reported are for the last three full years plus the fourth partial to full year. There are five tables on the output, with all columns labeled essentially the same - column labels varying only by date range and whether “Year” = Calendar Year (CY) or “Year” = Fiscal Year (FY). Table classes are by
Type of vehicle involved, stuck by train or that stuck the train Number of incidents by state Number of incidents by railroad Number of casualties (fatalities and injuries) by state Number of casualties (fatalities and injuries) by railroad
SELECTION PARAMETERS: Reporting Level, Railroad, Sort, Region, State, County, Road Types, Type of Report Requested, Start Month for Report, End Month for Report
Output Tables
HIGHWAY-RAIL INCIDENTS (BY…) AT PUBLIC AND PRIVATE CROSSINGS -- by vehicle type HIGHWAY-RAIL INCIDENTS (BY…) AT PUBLIC AND PRIVATE CROSSINGS -- by state HIGHWAY-RAIL INCIDENTS (BY…) AT PUBLIC AND PRIVATE CROSSINGS -- by railroad HIGHWAY-RAIL CASUALTIES (BY…) AT PUBLIC AND PRIVATE CROSSINGS -- by state HIGHWAY-RAIL CASUALTIES – UP TO FIFTY RAILROADS SHOWN, IN DESCENDING ORDER BY TOTAL CASES
OUTPUT TABLE COLUMNS:

Total Accidents
Percent of All Accidents
Total Year Counts Year 1
Total Year Counts Year 2
Total Year Counts Year 3
Year Total Counts (start month to end month) Year 3
Year Total Counts (start month to end month) Year 4
Percent Change Over Time, Year 1 to Year 3
Percent Change Over Time, Year 2 to Year 3
Percent Change Over Time, Year 3 to Year 4
2.09 Train Accidents and Rates
Train Accidents and Rates displays statistics for reportable train accidents (damage over the set threshold). There are three tables on the output, with all columns labeled essentially the same. Column labels varying only by date range and whether “Year” = Calendar Year (CY) or “Year” = Fiscal Year (FY).
Accident counts reported are for the last three full years plus the fourth partial to full year, based on whether partial year data is used or not. Table classes are by
Number of accidents by accident cause Number of accidents by state Number of accidents by track class (main, siding, etc. )
Tables displayed are:
ACCIDENTS IN DESCENDING FREQUENCY -- by cause ACCIDENTS IN DESCENDING FREQUENCY ---by railroad ACCIDENTS IN DESCENDING FREQUENCY ---by state ACCIDENTS IN DESCENDING FREQUENCY --- by track class
SELECTION PARAMETERS: Reporting Level, Railroad, Sort, Region, State, County, Type of Accident, type of Track, Primary Cause of Accident, Track Class, Type of Report Requested, Start Month for Report, End Month for Report

OUTPUT TABLE COLUMNS:
Total Accidents
Percent of All Accidents
Total Year Counts Year 1
Total Year Counts Year 2
Total Year Counts Year 3
Year Total Counts (start month to end month) Year 3
Year Total Counts (start month to end month) Year 4
Percent Change Over Time, Year 1 to Year 3
Percent Change Over Time, Year 2 to Year 3
Percent Change Over Time, Year 3 to Year 4
3.08 Accident Map with Table
Accident Map with Table displays a map of counties within a state, with accident counts on the county level. There is also an accompanying table of counts, damage totals, count of derailments and other accidents, all by accident cause.
SELECTION PARAMETERS: Reporting Level, Railroad, Sort, State, Type of Track, Start Date, End Date
MAP - Train Accidents for XX (State) By Data Range Accompanying Data TABLE
OUTPUT TABLE COLUMNS:
Accidents Total Count
Fatality (Kld) Total Count
Injury (Inj) Total Count
Reportable Damage ($$)
Count By Type of Accident (Collisions)
Count By Type of Accident (Derailments)
Count By Type of Accident (Other)
Count by Cause - Equipment
Count by Cause - Human factor
Count by Cause - Other Miscellaneous
Count by Cause - Signal
Count by Cause - Track
3.10 Accident Causes

The Accident Causes query displays statistics for reportable train accidents (damage over the set threshold), emphasizing accident cause. There are six tables on the output, with all columns labeled essentially the same - column labels varying only by date range and whether “Year” = Calendar Year (CY) or “Year” = Fiscal Year (FY). Accident counts are reported for the last three full years plus the fourth partial to full year, based on whether partial year data is used or not. Table classes are by the major cause categories – equipment, highway -rail (subcategory to miscellaneous), human factor, miscellaneous, signal, and track (see FRA Guide Appendix C).
SELECTION PARAMETERS: Reporting Level, Railroad, Sort, Region, State, County, Type of Accident, Type of Track, Cause of Accident, Start Date, End Date
OUTPUT TABLES:
TRAIN ACCIDENTS BY CAUSE FROM FORM FRA F 6180.54 - MAJOR CAUSE = Equipment TRAIN ACCIDENTS BY CAUSE FROM FORM FRA F 6180.54 - MAJOR CAUSE = Highway - rail TRAIN ACCIDENTS BY CAUSE FROM FORM FRA F 6180.54 - MAJOR CAUSE = Human Factor TRAIN ACCIDENTS BY CAUSE FROM FORM FRA F 6180.54 - MAJOR CAUSE = Miscellaneous TRAIN ACCIDENTS BY CAUSE FROM FORM FRA F 6180.54 - MAJOR CAUSE = Signal TRAIN ACCIDENTS BY CAUSE FROM FORM FRA F 6180.54 - MAJOR CAUSE = Track
OUTPUT TABLE COLUMNS:
Total Count By
causePercent By Cause
Accident count By Type Accident - Collisions
Accident count By Type Accident - Derailments
Accident count By Type Accident - Other
Reportable Damage Amount ($$)
Reportable Damage Percent (%)
Casualty Count - Fatalities
Casualty Count Injuries (Nonfatal)

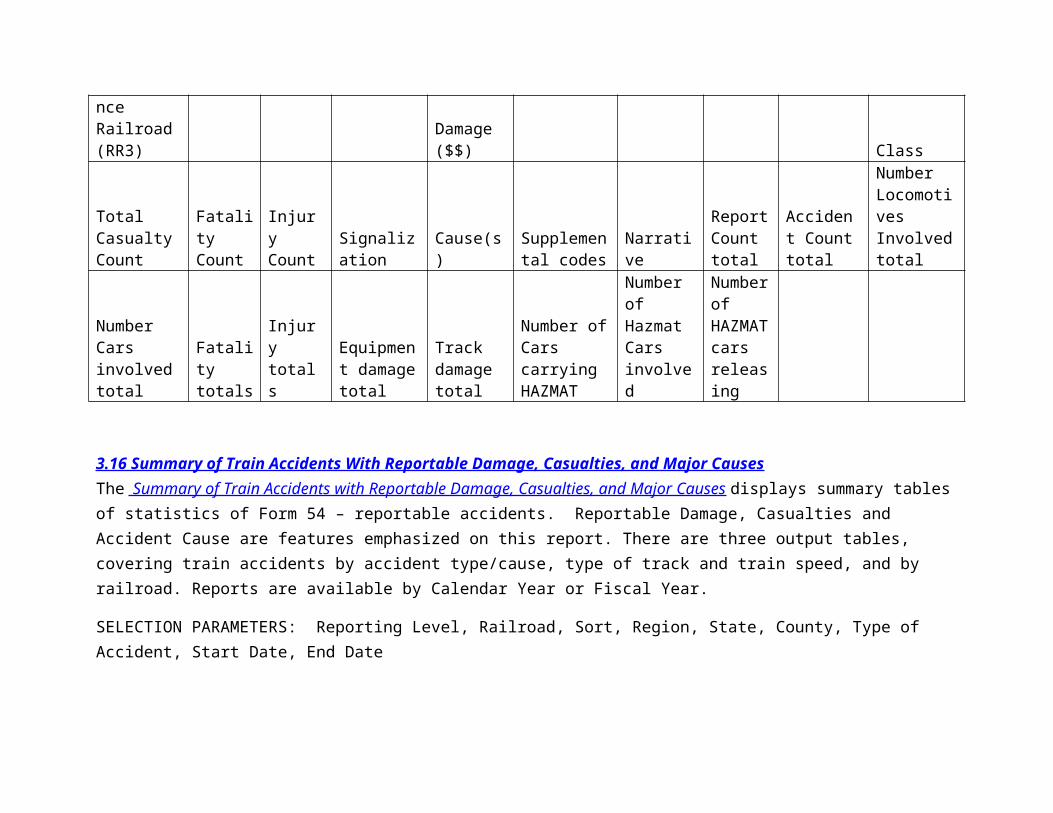
3.11 Accident Detail ReportThe Accident Rail Detail Report gives a text format report of the Form 54 – reportable accident. The text description report is embedded with statistics, and displayed date range is only one month at a time. Details of the location, injuries and fatalities, and the circumstances of the accident are displayed.
SELECTION PARAMETERS: Reporting Level, Railroad, Sort, Region, State, County, Type of Accident, Type of Track, Cause of Accident, Hazmat Options, Passenger Train Only, Damages, Report Sort Order, Search Time Frame
FIELDS EMBEDDED INTO REPORT:
Type of Accident
Date of accident Railroad
Incident report Number Latitude Longitude
Type of Equipment Involved
Time of accident
Locomotive Count State
Track Maintenance Railroad (RR3)
Cars Count County Speed
Equipment Damage ($$) Near / In City Track Type
Track Damage Milepost
FRA Railroad Class
Total Casualty Count
Fatality Count
Injury Count Signalization Cause(s)
Supplemental codes Narrative
Report Count total
Accident Count total
Number Locomotives Involved total
Number Cars involved total
Fatality totals
Injury totals
Equipment damage total
Track damage total
Number of Cars carrying HAZMAT
Number of Hazmat Cars involved
Number of HAZMAT cars releasing
3.16 Summary of Train Accidents With Reportable Damage, Casualties, and Major Causes

The Summary of Train Accidents with Reportable Damage, Casualties, and Major Causes displays summary tables of statistics of Form 54 – reportable accidents. Reportable Damage, Casualties and Accident Cause are features emphasized on this report. There are three output tables, covering train accidents by accident type/cause, type of track and train speed, and by railroad. Reports are available by Calendar Year or Fiscal Year.
SELECTION PARAMETERS: Reporting Level, Railroad, Sort, Region, State, County, Type of Accident, Start Date, End Date
OUTPUT TABLE COLUMNS:
TRAIN ACCIDENTS BY ACCIDENT TYPE SOURCE: FORM FRA F 6180.54
Total Count By Accident
type
Reportable Damage by Accident type
Casualties - Fatalities by Accident type
Casualties - Injuries by Accident type
Cause Count by Accident Type - Equipment
Cause Count by Accident Type - Highway rail crossing
Cause Count by Accident Type - Human factor
Cause Count by Accident Type - Miscellaneous / Other
Cause Count by Accident Type - Signal
Cause Count by Accident Type - Track
TRAIN ACCIDENTS BY TYPE TRACK AND CONSIST SPEED SOURCE: FORM FRA F 6180.54
Main Track
Speed, Range = (XXXX), Total Count
Main Track
Speed, Range = (XXXX), Total
Percent
Main Track, Range =
(XXXX), Type Accident = Collision
Main Track,
Range = (XXXX),
Type Accident = Derailment
Main Track
Speed, Range = (XXXX),
Type Accident
=
Main Track, Range =
(XXXX), Type Accident =
Other Miscellaneous
Main Track,
Range = (XXXX),
Reportable Damage
Main Track,
Range = (XXXX),
Casualties (Fatalities)
Main Track,
Range = (XXXX),
Casualties (Injuries)
Main Track,
Range = (XXXX),
Causes = Equipment

Highway Rail
CrossingMain Track,
Range = (XXXX),
Causes = Highway
Rail Crossing
Main Track,
Range = (XXXX),
Causes = Human factor
Main Track, Range = (XXXX),
Causes = Other /
Miscellaneous
Main Track,
Range = (XXXX),
Causes = Signal
Main Track,
Range = (XXXX),
Causes = Track
Summary Table --- All Railroads - Originally on Old Query 3.12 (Accident Table By Railroad)
Yard Track Speed,
Range = (XXXX),
Total Count
Yard Track
Speed, Range
= (XXXX), Total
Percent
Yard Track, Range =
(XXXX), Type Accident = Collision
Yard Track, Range = (XXXX),
Type Accident = Derailment
Yard Track
Speed, Range = (XXXX),
Type Accident
= Highway
Rail Crossing
Yard Track, Range =
(XXXX), Type Accident =
Other Miscellaneous
Yard Track, Range = (XXXX),
Reportable Damage
Yard Track,
Range = (XXXX),
Casualties (Fatalities)
Yard Track,
Range = (XXXX),
Casualties (Injuries)
Yard Track, Range = (XXXX),
Causes = Equipment
Yard Track, Range = (XXXX),
Causes = Highway
Rail
Yard Track, Range
= (XXXX), Causes
Yard Track, Range = (XXXX),
Causes = Other /
Miscellaneous
Yard Track, Range = (XXXX),
Causes = Signal
Yard Track,
Range = (XXXX),
Causes = Track

Crossing
= Human factor
3.17 Type Of Territory Vs. Accident Type and CauseThe Type of Territory Vs Accident Type and Cause displays summary tables of statistics of Form 54 – reportable accidents. It covers detailed statistics of the type of track, whether there was safety signals present, and the method of operation (train dispatching technique) involved. Two tables are output: by cause of accident and by accident type. Reports are available by Calendar Year or Fiscal Year.
SELECTION PARAMETERS: Reporting Level, Railroad, Sort, Region, State, County, Type of Track, Cause of Accident, Start Date, End Date
OUTPUT TABLE COLUMNS:
TYPE OF TERRITORY VS. ACCIDENT CAUSE by Type Track, Signalization, and Method of Operation
Count By Cause of
Accident - Equipment
Count By Cause of
Accident - Human factor
Count By Cause of
Accident - Miscellaneous
Count By Cause of
Accident - STC
Count By Cause of
Accident - Track
Count By Cause of
Accident - Track
Count By Cause of
Accident - Total
Type Track - Industry
Type Track - Main
Type Track - Side
Type Track - Yard
Type Track - Total
Signalization - Non Signaled
Signalization - Signaled
Method Of Operation - Other than Main
Method Of Operation - Block Register
Method Of Operation - Direct Train Control
Method Of Operation - Yard Restricted
Method Of Operation - Signal Indication

TYPE OF TERRITORY VS. ACCIDENT TYPE by Type Track, Signalization, and Method of Operation
Count By Cause of
Accident - Equipment
Count By Cause of
Accident - Human factor
Count By Cause of
Accident - Miscellaneous
Count By Cause of
Accident - STC
Count By Cause of
Accident - Track
Count By Cause of
Accident - Track
Count By Cause of
Accident - Total
Type Track - Industry
Type Track - Main
Type Track - Side
Type Track - Yard
Type Track - Total
Signalization - Non Signaled
Signalization - Signaled
Method Of Operation - Other than Main
Method Of Operation - Block Register
Method Of Operation - Direct Train Control
Method Of Operation - Yard Restricted
Method Of Operation - Signal Indication
3.18 Accident By State/RailroadThe Accident by State/Railroad report displays summary tables of statistics of Form 54 – reportable accidents. Cause Category is a major feature of this report. Reports are available by Calendar Year or Fiscal Year.
SELECTION PARAMETERS: Reporting Level, Railroad, Sort, Region, State, County, Type of Accident, Type of Track, Track Class, Cause of Accident, Casualty Subset, Hazmat Options, Passenger Trains Only, Damages, Report Sort Order, Type of Report Requested, Start Month for Report, End Month for Report
Accident Number
Report Number (Form 54 Link)
Killed/Injured ( 55A Report Link) Month Day State County
Type Of Track
Track Maintenance Railroad
Type accident
Primary Cause
Secondary Cause
Equipment Damage
Track Damage Fatalities Injuries
Rail Equipment Type Speed
Number of Locomotives Derailed
Number of Cars Derailed

4.06 Casualty Detail ReportThe Casualty Detail Report is a simple table of casualty data, sourced from Form 55A, including Employees on Duty. There is an active button (click on the incident number) to an HTML detail page giving all of the information on the original Form 55A in an easier to read version that translates all of the codes from the 55A.
SELECTION PARAMETERS: Reporting Level, Railroad, Sort, Region, State, County, Casualty Subset, Accident/Incident subsets, Start Date, End Date, Max Rows of Data
OUTPUT TABLE COLUMNS
Railroad State County DateType (accident) Jobcode
Incident Number (launches SAS code to display 55a in HTML format)
4.07 Casualty Map With Table
Casualty Map with Table displays a map of counties within a state, with casualty counts on the county level. There is also an accompanying table of counts, damage totals, count of derailments and other accidents, all by accident cause.
SELECTION PARAMETERS: Reporting Level, Railroad, Sort, Region, State, County, Casualty Subset, Accident/Incident subsets, Start Date, End Date
XX =the chosen state, with counts reported by county

OUTPUT TABLE COLUMNS
County
Casualties - Fatal (count)
Casualties -NonFatal (count)
Total (count)
4.08 Casualty Summary Table
Casualty Summary Tables displays two tables. The first displays fatality and injury counts by type of person (employee, trespasser, etc.) and the second displays casualty counts by type of accident, type of person and age of person.
SELECTION PARAMETERS: Reporting Level, Railroad, Sort, Region, State, County, Start Date, End Date
OUTPUT COLUMNS:
CASUALTIES BY TYPE PERSON AND PRIMARY EVENT FROM FORM FRA F 6180.55A
Type Person
Total Incidents - fatalities
Total Incidents - injuries
Total Casualties - fatalities
Total Casualties - injuries
Train Accidents w/o Highway Rail Crossing - fatalities
Train Accidents w/o Highway Rail Crossing - injuries
Highway Rail Crossing - fatalities
Highway Rail Crossing - injuries
Other events - fatalities
TYPE ACCIDENT, TYPE PERSON, AND AGE FROM FROM FRA F 6180.55A
Type Accident
Type Person
Age (count), Not Reported - fatalities
Age (count), Not Reported - injuries
Age (count), < 16 - fatalities
Age (count), < 16 - injuries
Age (count), 16 to 21 - fatalities
Age (count), 16 to 21 - injuries
Age (count), > 21 - fatalities
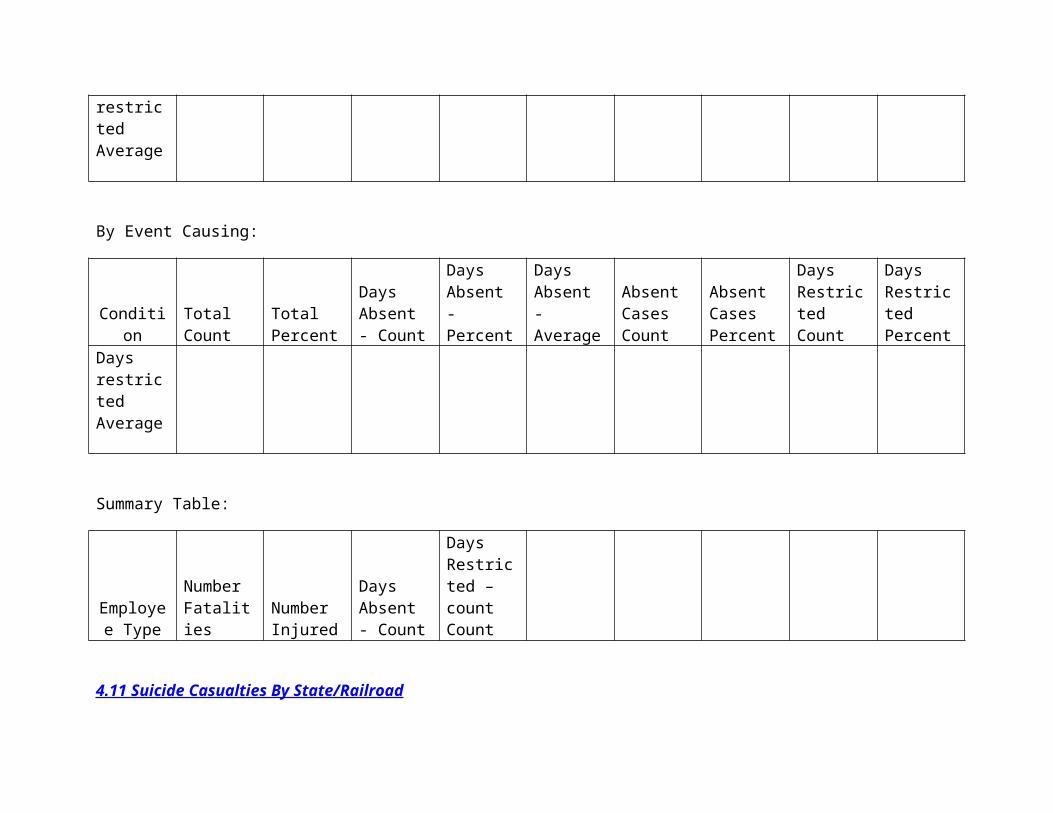
4.09 Worker Safety Report
The Worker Safety Report deals with employee injury and fatality statistics. It displays 13 tables total:
Six tables of Reportable Condition by job category Six tables of Events Causing by job category One summary table
The class of each table is by “Condition” describing the injury. Counts are by total, days absent, absent cases, and days restricted.
These 6 tables by reportable condition have basically the same columns:
WORKER SAFETY REPORT - REPORTABLE CONDITIONS Type of Job: Executives Officials and Staff Assistants -- By Condition
WORKER SAFETY REPORT - REPORTABLE CONDITIONS Type of Job: Professional and Administrative -- By Condition
WORKER SAFETY REPORT - REPORTABLE CONDITIONS Type of Job: Maintenance of Way and Structures -- By Condition
WORKER SAFETY REPORT - REPORTABLE CONDITIONS Type of Job: Maintenance of Equipment and Stores -- By Condition
WORKER SAFETY REPORT - REPORTABLE CONDITIONS Type of Job: Transportation, Other Than Train and Engine -- By Condition
WORKER SAFETY REPORT - REPORTABLE CONDITIONS Type of Job: Transportation, train and engine -- By Condition

SELECTION PARAMETERS: Reporting Level, Railroad, Sort, Region, State, County, Casualty Subsets, Type of Worker, Start Date, End Date
OUTPUT COLUMNS
By Reportable Condition:
ConditionTotal Count
Total Percent
Days Absent - Count
Days Absent - Percent
Days Absent - Average
Absent Cases Count
Absent Cases Percent
Days Restricted Count
Days Restricted Percent
Days restricted Average
By Event Causing:
ConditionTotal Count
Total Percent
Days Absent - Count
Days Absent - Percent
Days Absent - Average
Absent Cases Count
Absent Cases Percent
Days Restricted Count
Days Restricted Percent
Days restricted Average
Summary Table:

Employee Type
Number Fatalities
Number Injured
Days Absent - Count
Days Restricted – count Count
4.11 Suicide Casualties By State/Railroad
Suicide Casualties by State/Railroad gives counts of suicides. The earliest available data starts in June 2011. Each year is displayed in a separate table, with counts of fatalities and injuries by month.
SELECTION PARAMETERS: State, Railroad, Start Year, End Year
OUTPUT COLUMNS
MonthFatalities (count)
Injuries (count)
4.12 Casualties By State/Railroad
Casualties by State / Railroad is a detail level table of major casualty measures. There is an active link to the original 55A form reported.
SELECTION PARAMETERS: Reporting Level, Railroad, Sort, Region, State, County, Casualty Subsets, Location, Job Code Categories, Type of Person, Type of Report Requested, Start Month for Report, End Month for Report, Report Sort Order
OUTPUT COLUMNS:
Observation number
Month Day TA=Type Accident/Incident: 1 = Train Accident (form
Killed/Injured - Active LINK to 55A report
Type Person
Job (Jobcode)
Condition (Injury)
Event (Type)
State

54), 2 = Highway-rail (from 57), 3 = Other (form 55a)
County AgeDays Absent Days Restricted
4.13 Trespasser Incidents by Age, Day of Week, Time of Day
This query consists of seven Trespasser – related tables.
Parameters: Reporting Level, Railroad, Sort By, State, County, Start Date, End Date, Report Name
Trespasser Incidents of Fatalities and Injuries By Injury Type(condition) and Age Group
Injury Type
All Ages Unknown Age
Age 0 -12 Age 13 - 19 Age 20-29 Age 30 -39 Age 40-59 Age 60 +
Trespasser Fatalities By Railroad and Age Group
Railroad Count % (percentage of total)
Unknown Age
Age 0 -12 Age 13 - 19 Age 20-29 Age 30 -39 Age 40-59 Age 60 +
Trespasser Injuries By Railroad and Age Group
Railroad Count % Unknown Age 0 -12 Age 13 - 19 Age 20-29 Age 30 -39 Age 40-59 Age 60 +

(percentage of total)
Age
Trespasser Fatalities and Injuries By State and Age Group
Fatal Cases
State Unknown Age
Age 0 -12 Age 13 - 19
Age 20-29 Age 30 -39
Age 40-59 Age 60 + Total Killed Cnt
Total Killed %
NonFatal Cases
State Unknown Age
Age 0 -12 Age 13 - 19
Age 20-29 Age 30 -39
Age 40-59 Age 60 + Total Injured Cnt
Total Injured %
Trespasser Fatalities and Injuries By Month and Day of Week
Condition Fatality
Month Count (total)
% Sunday Monday Tuesday Wednesday
Thursday Friday Saturday
Condition Injury
Month Count (total)
% Sunday Monday Tuesday Wednesday
Thursday Friday Saturday
Trespasser Fatalities and Injuries By Time and Day of Week
AM/PM Time Count (total)
% Sunday Fatalities
Sunday Injuries
Monday Fatalities
Monday Injuries
Tuesday Fatalities
Tuesday Injuries

Wednesday Fatalities
Wednesday Injuries
Thursday Fatalities
Thursday Injuries
FridayFatalities
FridayInjuries
SaturdayFatalities
Saturday Injuries
Sunday Fatalities
SundayInjuries
Trespasser Fatalities and Injuries By Event and Location of Event
Event Location Count (total)
% Fatalities Fatalities %
Injuries Injuries % Unknown Age
Age 0 -12 Age 13 - 19 Age 20-29 Age 30 -39
Age 40-59
Age 60 +
5.08 Frequency of Crossing Collisions
Frequency of Crossing Collisions describes the top 25 most dangerous crossings taken from the Form 57 Crossing Incident reports, in two different tables:
Crossings with the most fatal incidents Crossings with the most incidents, fatal or nonfatal
SELECTION PARAMETERS: Reporting Level, Railroad, Sort, Region, State, County, Start Date, End Date, Number of Crossings per Ranking List

OUTPUT COLUMNS:
CROSSINGS THAT HAVE HAD THE MOST FATAL INCIDENTS, UP TO 25 CROSSINGS LISTED SORTED BY MOST FATAL INCIDENTS, MOST FATALITES, MOST INJURY INCIDENTS, MOST INJURIES
Observation number
Grade Crossing ID State
County / City
Total Incidents
Fatal Incidents
Total Fatalities (Deaths)
Injury Incidents
Total injuries
CROSSINGS THAT HAVE HAD THE MOST INCIDENTS, UP TO 25 CROSSINGS LISTED SORTED BY MOST FATAL INCIDENTS, MOST FATALITES, MOST INJURY INCIDENTS, MOST INJURIES
Observation number
Grade Crossing ID State
County / City
Total Incidents
Fatal Incidents
Total Fatalities (Deaths)
Injury Incidents
Total injuries
5.09 Hwy/Rail Detail Report
The Hwy/Rail Detail Report gives a text description of the Form 57 –Crossing Incident The text description report is embedded with statistics, and displayed date range is only one month at a time. Details of the type of crossing, warning devices, injuries and fatalities, and the circumstances of the Highway – Rail accident are displayed.
SELECTION PARAMETERS: Reporting Level, Railroad, Sort, Region, State, County, Type of Crossing, Accident Types, Start Date, End Date
OUTPUT, EMBEDDED WITHIN TEXT:
Number of
reports
Number of accidents
Total Number of locomotives in all
Total Number of cars in all consists
Total Number of fatalities
Total Number of Injuries
Accident Number XX of XX
Reporting Railroad Incident Number
Crossing ID number
Day

consists (deaths)
Month YearType equipment
Reporting Railroad
Vehicle type
Time (Hour)
Time (minutes)
Time (AM/PM) State County
Highway In/Near city speed
Number locomotives in consist
Number of cars in consist
vehicle direction
vehicle speed type track
type crossing weather
Visibilityair temperature
number of fatalities
number of injuries
driver age event
number of vehicle occupants
view obstructed flag
railroad transporting Hazmat flag
vehichle transporting Hazmat flag
Crossing Warning flag 1
Crossing Warning flag 2
Crossing Warning flag 3 Narrative
5.10 Hwy/Rail Map with Table
Highway – Rail Map with Table displays a map of counties within a state, with highway – rail incidents counts on the county level. There is also a table of crossing incidents counts by county.
SELECTION PARAMETERS: Reporting Level, Railroad, Sort, State, Start Date, End Date
Map Data Table
OUTPUT:
HIGHWAY-RAIL INCIDENTS FOR (state = XXXX)
County Totals Count
Totals - fatalities
Totals - injuries
At Public Crossing, Motor Vehicle -
At Public Crossing, Motor Vehicle -
At Public Crossing, Motor Vehicle -
At Public Crossing, Other - total Count
At Public Crossing, Other - fatalities
At Public Crossing, Other - injuries

total Count fatalities injuriesAt Private Crossing, Motor Vehicle - total Count
At Private Crossing, Motor Vehicle - fatalities
At Private Crossing, Motor Vehicle - injuries
At Private Crossing, Other - total Count
At Private Crossing, Other - fatalities
At Private Crossing, Other - injuries
At Private Crossing, Motor Vehicle - total Count
At Private Crossing, Motor Vehicle - fatalities
At Private Crossing, Motor Vehicle - injuries
5.14 Hwy Rail Accident Incident Summary By Railroad
Hwy Rail Accident Incident Summary by Railroad displays highway – rail incident count, fatality count, and injury count, as well as counts by public and private crossings. Three tables are output. Table class is by:
type of highway user warning device railroad
SELECTION PARAMETERS: Reporting Level, Railroad, Sort, State, County, Start Date, End Date
OUTPUT COLUMNS
HIGHWAY-RAIL INCIDENTS BY TYPE HIGHWAY USER -- FRA FORM 57
Type of highway
user - train struck
highway user: TYPE OF USER
Type of highway user - train struck BY highway
user: TYPE OF USER
type vehicle
Totals Count
Totals - fatalities
Totals - injuries
At Public Crossing, Motor Vehicle - total Count
At Public Crossing, Motor Vehicle - fatalities
At Public Crossing, Motor Vehicle - injuries
At Public Crossing, Other - total Count
At Public Crossing,
At Public Crossing,
At Private
At Private
At Private Crossing,
At Private Crossing,
At Private Crossing,
At Private Crossing,

Other - fatalities
Other - injuries
Crossing, Motor Vehicle - total Count
Crossing, Motor Vehicle - fatalities
Motor Vehicle - injuries
Other - total Count
Other - fatalities
Other - injuries
HIGHWAY-RAIL INCIDENTS BY WARNING DEVICE -- FRA FORM 57
Type of highway
user - train struck
highway user: TYPE OF USER
Type of highway
user - train struck BY highway
user: TYPE OF USER
type vehicle
Totals Count
Totals - fatalities
Totals - injuries
At Public Crossing, Motor Vehicle - total Count
At Public Crossing, Motor Vehicle - fatalities
At Public Crossing, Motor Vehicle - injuries
At Public Crossing, Other - total Count
At Public Crossing, Other - fatalities
At Public Crossing, Other - injuries
At Private Crossing, Motor Vehicle - total Count
At Private Crossing, Motor Vehicle - fatalities
At Private Crossing, Motor Vehicle - injuries
At Private Crossing, Other - total Count
At Private Crossing, Other - fatalities
At Private Crossing, Other - injuries
HIGHWAY-RAIL INCIDENTS BY RAILROAD -- FRA FORM 57
RAILROADTotals Count
Totals - fatalities
Totals - injuries
At Public Crossing, Motor Vehicle - total Count
At Public Crossing, Motor Vehicle - fatalities
At Public Crossing, Motor Vehicle - injuries
At Public Crossing, Other - total Count
At Public Crossing, Other - fatalities
At Public Crossing, Other - injuries

At Private Crossing, Motor Vehicle - total Count
At Private Crossing, Motor Vehicle - fatalities
At Private Crossing, Motor Vehicle - injuries
At Private Crossing, Other - total Count
At Private Crossing, Other - fatalities
At Private Crossing, Other - injuries
5.15 Consolidated Hwy -Rail Accident Incident
The Consolidated Hwy-Rail Accident Incident report is a large detail level data table of highway – rail incidents. Major measures are given. Because for any highway-rail incident multiple reporting forms may be appropriate, there are active links to the original report for 54 (reportable accident), 55A (casualty) and/or 57 (highway-rail incident) form for each highway-rail incident. If there is no report for a particular form type, the message “No records found!” will display.
SELECTION PARAMETERS: Reporting Level, Railroad, Sort, Region, State, County, Type of Crossing, Accident Types, Report Type, Start Month, End Month
OUTPUT COLUMNS
HIGHWAY-RAIL INCIDENTS BY RAILROAD -- FRA FORM 57
Observation number Railroad
Month / Day
54 Report Incident Number (active link to original report)
55A Casualty Report (active link to original report) State County City
Grade Crossing ID (active link to original Grade Crossing form)
Type of Crossing
Crossing Highway Name
Type of rail equipment
Train consist length
Highway User type
Crossing Warning / Protection
Total Fatalities
Total Injuries
8.05 Crossing Inventory By State
Crossing Inventory by State gives total count of all crossings for a given state, broken out by county. Data are also broken out by private crossing and public crossing. It also gives the percentage of crossings each county has by state. A summation is given at the bottom of the table.
SELECTION PARAMETERS: State
TOTAL AT-GRADE HIGHWAY-RAIL CROSSINGS FOR STATE = XXXX
CountyTotal Count
Total Percent
Private Vehicle Crossing Accident Count
Private Vehicle Crossing Accident Percent
Public Vehicle Crossing Accident Count
Public Vehicle Crossing Accident Percent
8.08 Public Crossing Inventory Detail Report
Public Crossing Inventory Detail Report gives total count of PUBLIC (not private) crossings. Tables are displayed separately for each county, city and whether the crossing is IN or NEAR a city. The “Primary Operating Railroad” is also given. Data are displayed on detailed street level geography. It also gives the last date that the inventory was updated.
SELECTION PARAMETERS: State, County, Crossing Protection, Public At Grade Crossing
OUTPUT COLUMNS
Public Crossing Inventory Detail Report: State = , County = , City = IN
Crossing IDStreet / Road
Type Warning
Total Tracks
Daily Trains
Average Daily Vehicles
Reporting Railroad
Inventory Updated

Public Crossing Inventory Detail Report: State = , County = , City = NEAR
Crossing IDStreet / Road
Type Warning
Total Tracks
Daily Trains
Average Daily Vehicles
Reporting Railroad
Inventory Updated
8.10 Public Grade Crossing Inventory By State and County
Public Grade Crossing Inventory by State and County displays detailed counts of PUBLIC (not private) crossings at differing levels of geography. Three levels of geography are displayed using three different tables:
In/Near City level County level Crossing level
SELECTION PARAMETERS: Reporting Level, Railroad, State, County, Public At Grade Crossing
OUTPUT COLUMNS
PUBLIC AT GRADE MOTOR VEHICLE CROSSINGS BY CITY AND PRINCIPAL WARNING DEVICE FOR ….. By City
City Total
Principal Warning device - None
Principal Warning device - Other
Principal Warning device - Cross Bucks
Principal Warning device - Stop Signs
Principal Warning device - Special Warning
Principal Warning device - HWTS, WW, Bells
Principal Warning device - Flashing Lights
Principal Warning device - Gates
Principal Warning device -

Quiet Zone
PUBLIC AT GRADE MOTOR VEHICLE CROSSINGS BY CITY AND PRINCIPAL WARNING DEVICE FOR ….. By County
City Total
Principal Warning device - None
Principal Warning device - Other
Principal Warning device - Cross Bucks
Principal Warning device - Stop Signs
Principal Warning device - Special Warning
Principal Warning device - HWTS, WW, Bells
Principal Warning device - Flashing Lights
Principal Warning device - Gates
Principal Warning device - Quiet Zone
PUBLIC AT GRADE MOTOR VEHICLE CROSSINGS BY CITY AND PRINCIPAL WARNING DEVICE FOR ….. By Railroad
City Total
Principal Warning device - None
Principal Warning device - Other
Principal Warning device - Cross Bucks
Principal Warning device - Stop Signs
Principal Warning device - Special Warning
Principal Warning device - HWTS, WW, Bells
Principal Warning device - Flashing Lights
Principal Warning device - Gates
Principal Warning device - Quiet Zone

PUBLIC AT GRADE MOTOR VEHICLE CROSSINGS BY RAILROAD AND PRINCIPAL AND WARNING DEVICES
State County City Street
Crossing Number (link to Crossing Inventory form) Railroad
Principal Warning Device
DETAIL TABLE OF RAIL CROSSING WARNING DEVICES ON GRADE CROSSING LEVEL BY ALL CROSSINGS
State County City Street
Crossing Number (link to Crossing Inventory form) Railroad
Four Quad Gates Gates
Cross Bucks
Flashing lights
HTWS, WW, Bells Stop Signs
None (no device) Quiet Zone
Other Notes:
Individual Reporting Level – counts displayed are for the chosen railroad code only – no aggregation takes place.

System reporting Level – Larger railroads (Class 1, Larger Class 2’s mostly) are often made up of a few, or many, smaller railroads. This reporting aggregates all of the railroads in a “system” together.
Consolidated Level – this is a special case reporting aggregation, allowed only for a few specific railroads who requested special consideration.