
· Web viewRelative Error= Absolute Error Accepted Value Relative Error= 0.003 m 2 0.038 m 2...
17
Optics – Converging Lenses Noam Kantor and Isaac Ilivicky Converging Lenses Group G – Type 2 graphical analysis By: Isaac Ilivicky & Noam Kantor Purposes: The purpose of this lab was to investigate the relationship between the object distance and the image distance for real images produced by a converging thin lens. In order to do this, we specifically analyzed the relationships between: Image Distance vs. Object Distance Image Height vs. Object distance Hypotheses: As the object distance increases, the image distance decreases. As the object distance increases, the image height decreases. Apparatus: A converging thin lens Multiple rails preferably with an attached scale (meter sticks on the sides) A light source (light bulb) The Object (an opaque sheet with a symbol of some sort cut out in the center, ours happened to be an “L”) A screen where the image will be shown (multiple sizes will most likely be necessary) A computer with LoggerPro or an organized data table of some sort Time, patience, and some humor
Transcript of · Web viewRelative Error= Absolute Error Accepted Value Relative Error= 0.003 m 2 0.038 m 2...

Optics – Converging LensesNoam Kantor and Isaac Ilivicky
Converging Lenses
Group G – Type 2 graphical analysis
By: Isaac Ilivicky & Noam Kantor
Purposes:The purpose of this lab was to investigate the relationship between the object distance and the image distance for real images produced by a converging thin lens. In order to do this, we specifically analyzed the relationships between:
Image Distance vs. Object Distance Image Height vs. Object distance
Hypotheses: As the object distance increases, the image distance decreases. As the object distance increases, the image height decreases.
Apparatus: A converging thin lens Multiple rails preferably with an attached scale (meter sticks on the sides) A light source (light bulb) The Object (an opaque sheet with a symbol of some sort cut out in the center, ours
happened to be an “L”) A screen where the image will be shown (multiple sizes will most likely be necessary) A computer with LoggerPro or an organized data table of some sort Time, patience, and some humor
Procedure1. Measure the focal length by pointing lens at an object very far away. The prime object
in our physics explorations has been a power pole across the highway. Adjust the position of the screen until the object is very “in focus.” The distance from the lens to the screen is the focal length of the lens.
2. In a dark laboratory, start with the object 15 focal lengths away form the lens. On the opposite side of the lens from the object, move the screen until you find a well-focused image. Record the distance from the lens is known as the object distance.

Optics – Converging LensesNoam Kantor and Isaac Ilivicky
3. Change the object distance in increments of approximately one focal length (rounded to the nearest 5.0 cm) until you reach a distance of 3 focal lengths away from the lens, recording the image distance and image height each time. Our suggestion is that in order to measure the same values without having to move the object every time (which with our apparatus was part of the light source), it is easier to move the lens and the screen.
4. When you are 3 focal lengths away from the lens, reduce the distance increment to 5.0 cm.
5. When you are 2 focal lengths away, reduce the distance increment to 1.0 cm until you reach an object distance of 1.0 cm less than 1 focal length away.
6. Another reminder; at every position, remember to record the object distance, image distance, and the image height.
7. Plot image distance vs. object distance and image height vs. object distance, and proceed with the analysis.
Diagram:
Credit to the UCLA physics department, however, due to current situations, GO TROJANS!

Optics – Converging LensesNoam Kantor and Isaac Ilivicky

Optics – Converging LensesNoam Kantor and Isaac Ilivicky

Optics – Converging LensesNoam Kantor and Isaac Ilivicky

Optics – Converging LensesNoam Kantor and Isaac Ilivicky
Experiment 1 Mathematical Analysisd i→imagedistance f →focal lengthdo→object distance
d i−f ∝ 1do−f
d i−f= kdo−f
k=∆(d i−f )
∆( 1do−f
)
k=0.041m2as calculated by loggerpro
d i−f=0.041m2
do−f
Type 2 Graphical Analysis Once we plotted the image distance vs. object distance, we noticed an inverse proportion
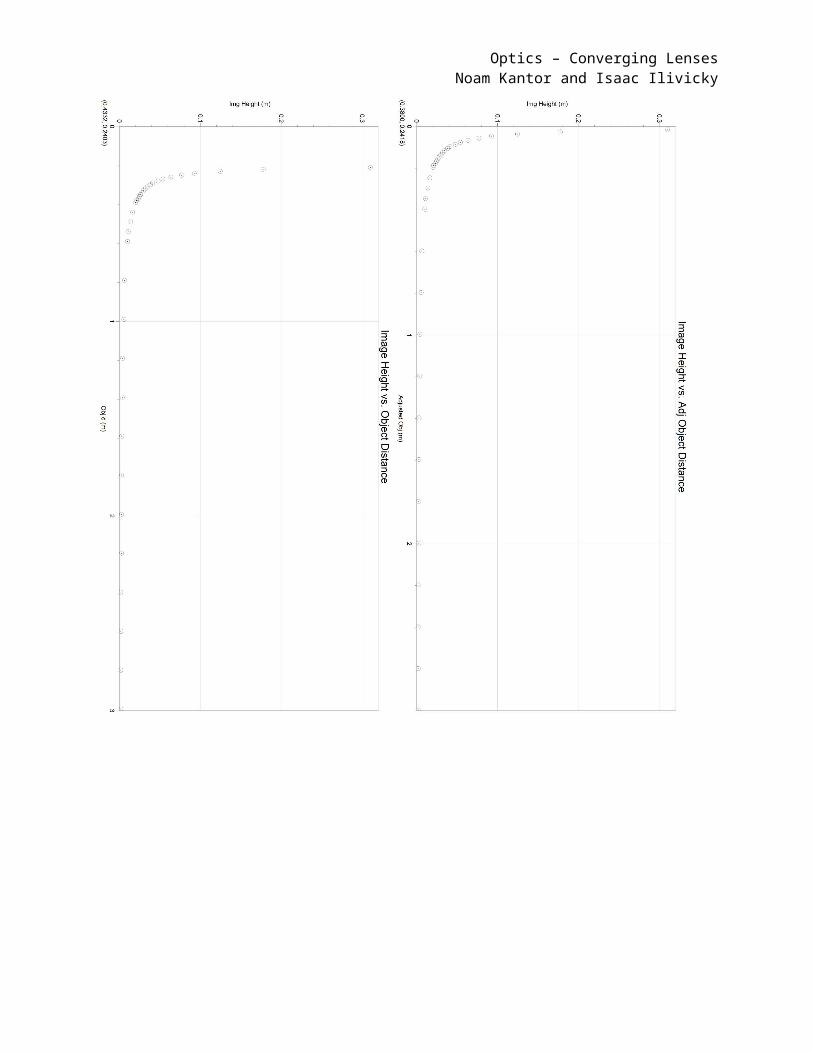
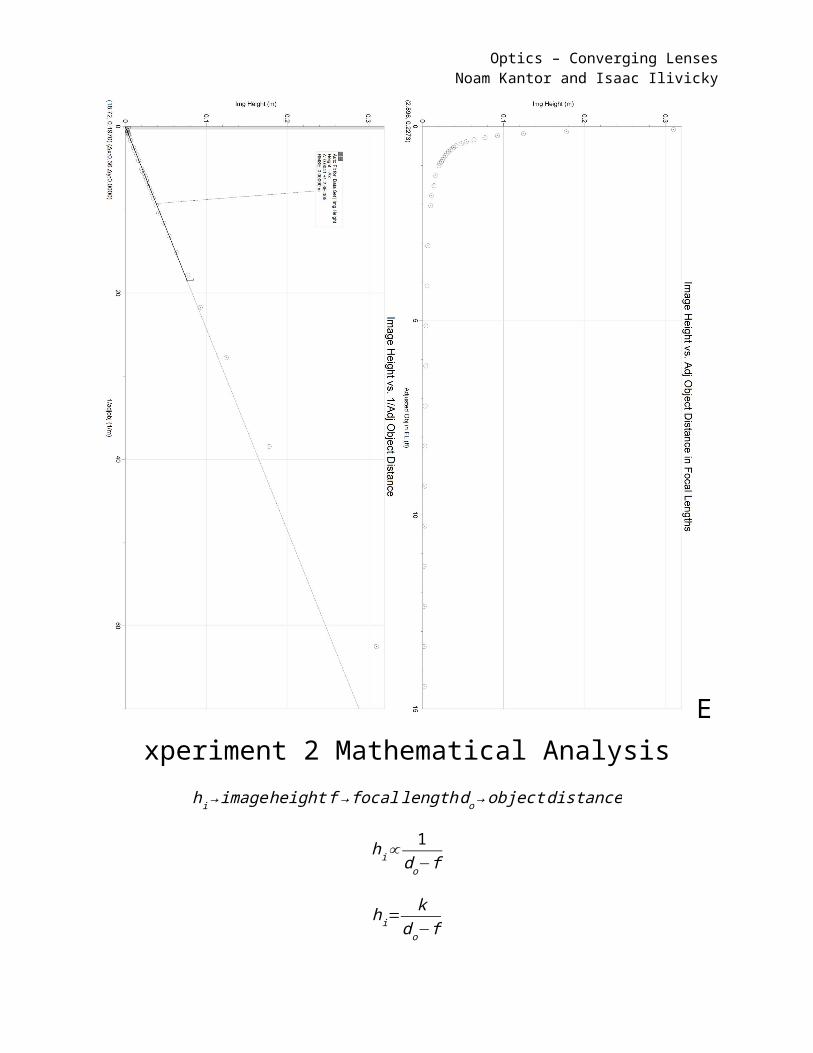
relationship with asymptotes that were not on the axes of the graph. After further observation, we realized that the two asymptotes were approximately equal to the pre-established focal length. And so, we adjusted our data, subtracting the value of the focal length from the recorded data for the image distances and the object distances, and then plotted this new set of data. Once this was plotted, our proportional inverse relationship’s asymptotes were lined up with the axes of the graph. Once we reached this point, we were able to linearlize the data, which resulted in a direct proportion when plotting image distance vs. 1/object distance. A similar process was taken when analyzing the second relationship, where we plotted image height vs. object distance. This graph also showed an inverse proportion relationship, with only the vertical asymptote being off from the vertical axis by a value equal to the focal length. After dealing with this phenomenon with the exact same process as before, we were able to derive a direct proportion when plotting (using the adjusted data) image height vs. 1/object distance.

Optics – Converging LensesNoam Kantor and Isaac Ilivicky
Experiment 1 Error AnalysisAcceptedValue=0.038m2ExperimentalValue=0.041m2
Absolute Error=|Accepted Value−ExperimentalValue|
Absolute Error=|0.038m2−0.041m2|
Absolute Error=0.003m2
Relative Error= Absolute ErrorAcceptedValue
Relative Error=0.003m2
0.038m2
Relative Error=¿7.9%
Optics – Converging LensesNoam Kantor and Isaac Ilivicky

Optics – Converging LensesNoam Kantor and Isaac Ilivicky
Experiment 2 Mathematical Analysishi→image height f →focal lengthdo→object distance
hi∝1
do−f
hi=k
d o−f
Optics – Converging LensesNoam Kantor and Isaac Ilivicky
k=∆(hi)
∆( 1do−f
)
k=0.0042m2as calculated by loggerpro
hi=0.0042m2
do−f
Optics – Converging LensesNoam Kantor and Isaac Ilivicky
Experiment 2 Error AnalysisAccepted Value=0.0038m2ExperimentalValue=0.0041m2
Absolute Error=|Accepted Value−ExperimentalValue|
Absolute Error=|0.0038m2−0.0041m2|
Absolute Error=0.0003m2
Relative Error= Absolute ErrorAcceptedValue
Relative Error=0.0003m2
0.0038m2
Relative Error=¿7.9%

Optics – Converging LensesNoam Kantor and Isaac Ilivicky
Error Explanation
Experiment 1: It was exceedingly difficult to tell whether an image was focused at a given position when the image distance was large because the image was dim anyways. So it was hard to differentiate between dimness and being out of focus.
Expeirment 2: The scale for the height only went to the nearest 2mm, so there was a large amount of estimation. At large object distances, the image was very small, and so this small scale was difficult to read.

Optics – Converging LensesNoam Kantor and Isaac Ilivicky
Final Mathematical Model
Experiment 1:
d i−f= f 2
do−f
Experiment 2:
hi=ho fd o−f

Optics – Converging LensesNoam Kantor and Isaac Ilivicky
do< f →No Image

Optics – Converging LensesNoam Kantor and Isaac Ilivicky
do≈ f but do>f → Enlarged , Inverted Image


![[PPT]Relative Dating - Harrisonburg City Public Schools - Staff ...staff.harrisonburg.k12.va.us/~esutliff/forms/Relative... · Web viewRelative Dating * * * * * * * * * I. Relative](https://static.fdocuments.us/doc/165x107/5ab11f1d7f8b9a00728be9ae/pptrelative-dating-harrisonburg-city-public-schools-staff-staffharrisonburgk12vausesutliffformsrelativeweb.jpg)