Viewing Streaming Spatially-Referenced Data at …hjs/pubs/acmgis14-labeling-header.pdfViewing...
4
In Proceedings of the 22nd ACM SIGSPATIAL International Conference on Advances in Geographic Information Systems, pp. 409-412, Dallas, TX, November 2014 Viewing Streaming Spatially-Referenced Data at Interactive Rates * Shangfu Peng Hanan Samet Marco D. Adelfio Center for Automation Research, Institute for Advanced Computer Studies Department of Computer Science, University of Maryland College Park, MD 20742 USA {shangfu, hjs, marco}@cs.umd.edu ABSTRACT Given the increasing prevalence of streaming spatially-referenced datasets resulting from sensor networks usually consisting of text objects of varying length (termed labels) as well as streaming spa- tially oriented queries leads to closer scrutiny of mapping inter- faces to present the data to users. These interfaces must cope with the fact that the labels associated with each location are constantly changing and that there are too many objects to display clearly within the interface. An algorithm meeting these challenges is pre- sented. It differs from classical methods by avoiding expensive pre-computation steps, thereby allowing different labels to be asso- ciated with locations without needing to completely recompute the layout. In other words, we are addressing a write-many read-many setting instead of the conventional write-once read-many setting. Our experiments show consistent sub-second query times for query windows that contain as many as 11 million data objects, with only slight differences in the set of displayed labels when compared to an exhaustive baseline algorithm. This enables the algorithm to be used in a mapping application that involves both streaming data and streaming queries such as windowing realized by real-time, contin- uous zooming and panning operations. Categories and Subject Descriptors H.2.8 [Database Management]: Database Applications—Spatial databases and GIS; H.2.4 [Database Management]: Systems— Query processing General Terms Algorithms, Design Keywords Dynamic map labeling, label selection, streaming data * This work was supported in part by the NSF under Grants IIS-10- 18475, IIS-12-19023, and IIS-13-20791 and by NVIDIA. Permission to make digital or hard copies of all or part of this work for personal or classroom use is granted without fee provided that copies are not made or distributed for profit or commercial advantage and that copies bear this notice and the full citation on the first page. Copyrights for components of this work owned by others than ACM must be honored. Abstracting with credit is permitted. To copy otherwise, or republish, to post on servers or to redistribute to lists, requires prior specific permission and/or a fee. Request permissions from [email protected]. SIGSPATIAL’14, November 04 - 07 2014, Dallas/Fort Worth, TX, USA Copyright 2014 ACM 978-1-4503-3131-9/14/11 ...$15.00 http://dx.doi.org/10.1145/2666310.2666432. Figure 1: Example of 1,000 labels 1. INTRODUCTION We have built many applications that use a map query interface (e.g., QUILT [25, 34] and the SAND Browser [7, 26]) to access and process data for which spatial and spatiotemporal indexes have been built in both conventional (e.g., [11, 12, 22, 24, 35]) and dis- tributed (e.g., [36] environments). Unlike traditional paper maps (e.g., [3, 5, 6, 8, 38]), which only exist at a single scale for a point- in-time snapshot of a dataset, the interfaces for these applications must be dynamic in order to handle changes to the viewing pa- rameters (i.e., usually with streaming pan and zoom actions), and, increasingly for many applications, changes to the underlying data, which are usually text objects of variable length (henceforth called labels). An example is a disease report browser which plots the names of diseases at locations where the diseases have been re- ported. In particular, the binding of the label to a location is dy- namic as the data changes over time. A challenge arises when there are too many objects to display clearly within the map interface. Figure 1 gives an example scenario which consists of the task of displaying just 1, 000 text objects in a map. In these circumstances, a subset of objects must be selected from the original dataset to dis- play so that users have a manageable amount of information (a task also known as “spatial sampling” [4] or “thinning”[33]). We use the term layout problem to describe the combined selection and display problem. Our primary contribution is developing a method with a good time complexity bound for sampling and placing labels to repre- sent large spatially-referenced datasets on a map. Our approach has two phases: filtering and intersection testing. In the filtering phase, we adapt the multiresolution select distinct (MRSD) method of Nutanong et al. [19, 20] for the centroids of the labels. It has been used in a system that made use of a map query interface for news photos [31] of a fixed size [9, 29]. The intersection testing phase handles dynamic objects of varying size by ensuring that the variable-width objects do not overlap. The effect of the stream- ing nature of the data is accommodated by constantly changing the data samples that were displayed and repeating the labeling action.
Transcript of Viewing Streaming Spatially-Referenced Data at …hjs/pubs/acmgis14-labeling-header.pdfViewing...

In Proceedings of the 22nd ACM SIGSPATIAL International Conference on Advances in Geographic Information Systems, pp. 409-412,Dallas, TX, November 2014
Viewing Streaming Spatially-Referenced Dataat Interactive Rates ∗
Shangfu Peng Hanan Samet Marco D. Adelfio
Center for Automation Research, Institute for Advanced Computer StudiesDepartment of Computer Science, University of Maryland
College Park, MD 20742 USA{shangfu, hjs, marco}@cs.umd.edu
ABSTRACTGiven the increasing prevalence of streaming spatially-referenceddatasets resulting from sensor networks usually consisting of textobjects of varying length (termed labels) as well as streaming spa-tially oriented queries leads to closer scrutiny of mapping inter-faces to present the data to users. These interfaces must cope withthe fact that the labels associated with each location are constantlychanging and that there are too many objects to display clearlywithin the interface. An algorithm meeting these challenges is pre-sented. It differs from classical methods by avoiding expensivepre-computation steps, thereby allowing different labels to be asso-ciated with locations without needing to completely recompute thelayout. In other words, we are addressing a write-many read-manysetting instead of the conventional write-once read-many setting.Our experiments show consistent sub-second query times for querywindows that contain as many as 11 million data objects, with onlyslight differences in the set of displayed labels when compared toan exhaustive baseline algorithm. This enables the algorithm to beused in a mapping application that involves both streaming data andstreaming queries such as windowing realized by real-time, contin-uous zooming and panning operations.
Categories and Subject DescriptorsH.2.8 [Database Management]: Database Applications—Spatialdatabases and GIS; H.2.4 [Database Management]: Systems—Query processing
General TermsAlgorithms, Design
KeywordsDynamic map labeling, label selection, streaming data
∗This work was supported in part by the NSF under Grants IIS-10-18475, IIS-12-19023, and IIS-13-20791 and by NVIDIA.
Permission to make digital or hard copies of all or part of this work forpersonal or classroom use is granted without fee provided that copies are notmade or distributed for profit or commercial advantage and that copies bearthis notice and the full citation on the first page. Copyrights for componentsof this work owned by others than ACM must be honored. Abstracting withcredit is permitted. To copy otherwise, or republish, to post on servers or toredistribute to lists, requires prior specific permission and/or a fee. Requestpermissions from [email protected]’14, November 04 - 07 2014, Dallas/Fort Worth, TX, USACopyright 2014 ACM 978-1-4503-3131-9/14/11 ...$15.00http://dx.doi.org/10.1145/2666310.2666432.
Figure 1: Example of 1,000 labels
1. INTRODUCTIONWe have built many applications that use a map query interface
(e.g., QUILT [25, 34] and the SAND Browser [7, 26]) to accessand process data for which spatial and spatiotemporal indexes havebeen built in both conventional (e.g., [11, 12, 22, 24, 35]) and dis-tributed (e.g., [36] environments). Unlike traditional paper maps(e.g., [3, 5, 6, 8, 38]), which only exist at a single scale for a point-in-time snapshot of a dataset, the interfaces for these applicationsmust be dynamic in order to handle changes to the viewing pa-rameters (i.e., usually with streaming pan and zoom actions), and,increasingly for many applications, changes to the underlying data,which are usually text objects of variable length (henceforth calledlabels). An example is a disease report browser which plots thenames of diseases at locations where the diseases have been re-ported. In particular, the binding of the label to a location is dy-namic as the data changes over time. A challenge arises when thereare too many objects to display clearly within the map interface.Figure 1 gives an example scenario which consists of the task ofdisplaying just 1, 000 text objects in a map. In these circumstances,a subset of objects must be selected from the original dataset to dis-play so that users have a manageable amount of information (a taskalso known as “spatial sampling” [4] or “thinning”[33]). We usethe term layout problem to describe the combined selection anddisplay problem.
Our primary contribution is developing a method with a goodtime complexity bound for sampling and placing labels to repre-sent large spatially-referenced datasets on a map. Our approachhas two phases: filtering and intersection testing. In the filteringphase, we adapt the multiresolution select distinct (MRSD) methodof Nutanong et al. [19, 20] for the centroids of the labels. It hasbeen used in a system that made use of a map query interface fornews photos [31] of a fixed size [9, 29]. The intersection testingphase handles dynamic objects of varying size by ensuring that thevariable-width objects do not overlap. The effect of the stream-ing nature of the data is accommodated by constantly changing thedata samples that were displayed and repeating the labeling action.
In Proceedings of the 22nd ACM SIGSPATIAL International Conference on Advances in Geographic Information Systems, pp. 409-412,Dallas, TX, November 2014
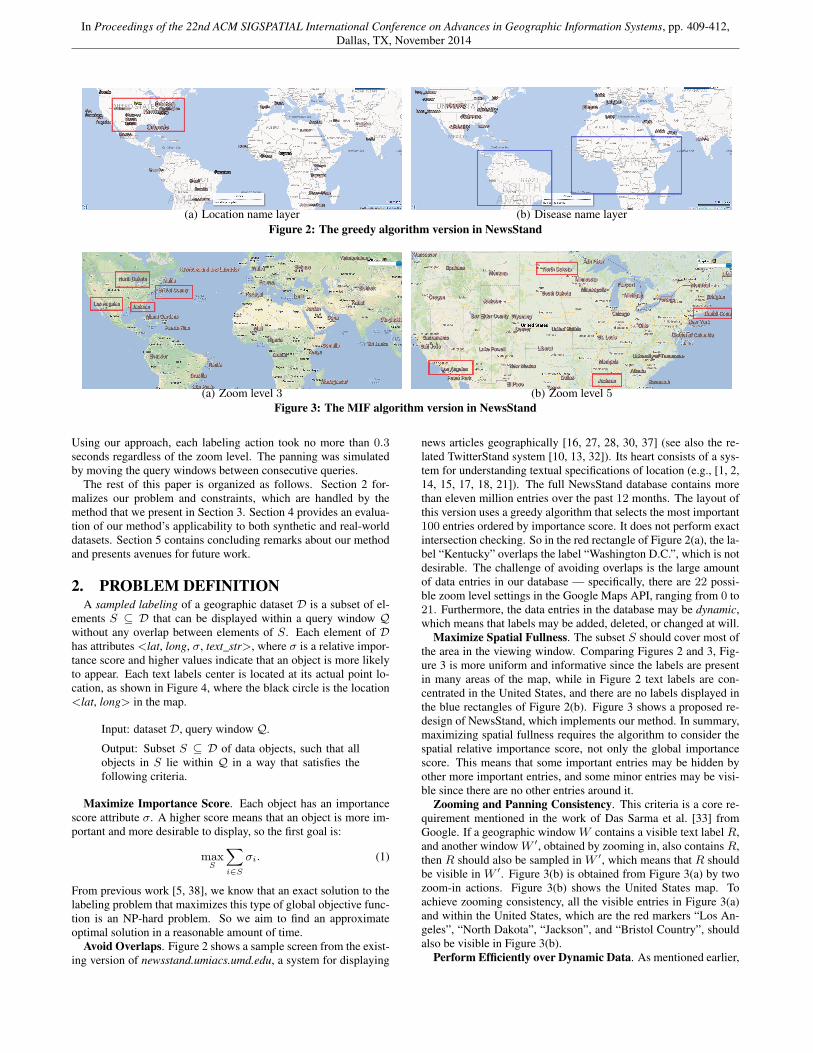
(a) Location name layer (b) Disease name layerFigure 2: The greedy algorithm version in NewsStand
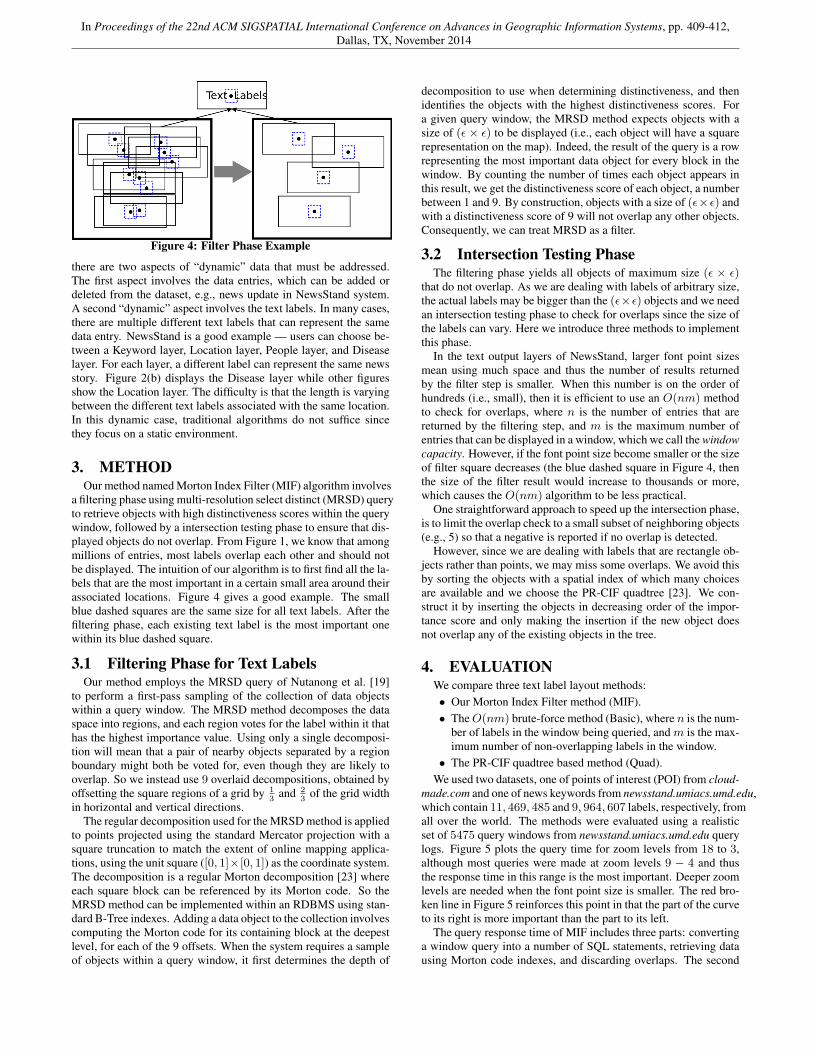
(a) Zoom level 3 (b) Zoom level 5Figure 3: The MIF algorithm version in NewsStand
Using our approach, each labeling action took no more than 0.3seconds regardless of the zoom level. The panning was simulatedby moving the query windows between consecutive queries.
The rest of this paper is organized as follows. Section 2 for-malizes our problem and constraints, which are handled by themethod that we present in Section 3. Section 4 provides an evalua-tion of our method’s applicability to both synthetic and real-worlddatasets. Section 5 contains concluding remarks about our methodand presents avenues for future work.
2. PROBLEM DEFINITIONA sampled labeling of a geographic dataset D is a subset of el-
ements S ⊆ D that can be displayed within a query window Qwithout any overlap between elements of S. Each element of Dhas attributes <lat, long, σ, text_str>, where σ is a relative impor-tance score and higher values indicate that an object is more likelyto appear. Each text labels center is located at its actual point lo-cation, as shown in Figure 4, where the black circle is the location<lat, long> in the map.
Input: dataset D, query window Q.
Output: Subset S ⊆ D of data objects, such that allobjects in S lie within Q in a way that satisfies thefollowing criteria.
Maximize Importance Score. Each object has an importancescore attribute σ. A higher score means that an object is more im-portant and more desirable to display, so the first goal is:
maxS
∑i∈S
σi. (1)
From previous work [5, 38], we know that an exact solution to thelabeling problem that maximizes this type of global objective func-tion is an NP-hard problem. So we aim to find an approximateoptimal solution in a reasonable amount of time.
Avoid Overlaps. Figure 2 shows a sample screen from the exist-ing version of newsstand.umiacs.umd.edu, a system for displaying
news articles geographically [16, 27, 28, 30, 37] (see also the re-lated TwitterStand system [10, 13, 32]). Its heart consists of a sys-tem for understanding textual specifications of location (e.g., [1, 2,14, 15, 17, 18, 21]). The full NewsStand database contains morethan eleven million entries over the past 12 months. The layout ofthis version uses a greedy algorithm that selects the most important100 entries ordered by importance score. It does not perform exactintersection checking. So in the red rectangle of Figure 2(a), the la-bel “Kentucky” overlaps the label “Washington D.C.”, which is notdesirable. The challenge of avoiding overlaps is the large amountof data entries in our database — specifically, there are 22 possi-ble zoom level settings in the Google Maps API, ranging from 0 to21. Furthermore, the data entries in the database may be dynamic,which means that labels may be added, deleted, or changed at will.
Maximize Spatial Fullness. The subset S should cover most ofthe area in the viewing window. Comparing Figures 2 and 3, Fig-ure 3 is more uniform and informative since the labels are presentin many areas of the map, while in Figure 2 text labels are con-centrated in the United States, and there are no labels displayed inthe blue rectangles of Figure 2(b). Figure 3 shows a proposed re-design of NewsStand, which implements our method. In summary,maximizing spatial fullness requires the algorithm to consider thespatial relative importance score, not only the global importancescore. This means that some important entries may be hidden byother more important entries, and some minor entries may be visi-ble since there are no other entries around it.
Zooming and Panning Consistency. This criteria is a core re-quirement mentioned in the work of Das Sarma et al. [33] fromGoogle. If a geographic window W contains a visible text label R,and another window W ′, obtained by zooming in, also contains R,then R should also be sampled in W ′, which means that R shouldbe visible in W ′. Figure 3(b) is obtained from Figure 3(a) by twozoom-in actions. Figure 3(b) shows the United States map. Toachieve zooming consistency, all the visible entries in Figure 3(a)and within the United States, which are the red markers “Los An-geles”, “North Dakota”, “Jackson”, and “Bristol Country”, shouldalso be visible in Figure 3(b).
Perform Efficiently over Dynamic Data. As mentioned earlier,
In Proceedings of the 22nd ACM SIGSPATIAL International Conference on Advances in Geographic Information Systems, pp. 409-412,Dallas, TX, November 2014
Figure 4: Filter Phase Example
there are two aspects of “dynamic” data that must be addressed.The first aspect involves the data entries, which can be added ordeleted from the dataset, e.g., news update in NewsStand system.A second “dynamic” aspect involves the text labels. In many cases,there are multiple different text labels that can represent the samedata entry. NewsStand is a good example — users can choose be-tween a Keyword layer, Location layer, People layer, and Diseaselayer. For each layer, a different label can represent the same newsstory. Figure 2(b) displays the Disease layer while other figuresshow the Location layer. The difficulty is that the length is varyingbetween the different text labels associated with the same location.In this dynamic case, traditional algorithms do not suffice sincethey focus on a static environment.
3. METHODOur method named Morton Index Filter (MIF) algorithm involves
a filtering phase using multi-resolution select distinct (MRSD) queryto retrieve objects with high distinctiveness scores within the querywindow, followed by a intersection testing phase to ensure that dis-played objects do not overlap. From Figure 1, we know that amongmillions of entries, most labels overlap each other and should notbe displayed. The intuition of our algorithm is to first find all the la-bels that are the most important in a certain small area around theirassociated locations. Figure 4 gives a good example. The smallblue dashed squares are the same size for all text labels. After thefiltering phase, each existing text label is the most important onewithin its blue dashed square.
3.1 Filtering Phase for Text LabelsOur method employs the MRSD query of Nutanong et al. [19]
to perform a first-pass sampling of the collection of data objectswithin a query window. The MRSD method decomposes the dataspace into regions, and each region votes for the label within it thathas the highest importance value. Using only a single decomposi-tion will mean that a pair of nearby objects separated by a regionboundary might both be voted for, even though they are likely tooverlap. So we instead use 9 overlaid decompositions, obtained byoffsetting the square regions of a grid by 1
3and 2
3of the grid width
in horizontal and vertical directions.The regular decomposition used for the MRSD method is applied
to points projected using the standard Mercator projection with asquare truncation to match the extent of online mapping applica-tions, using the unit square ([0, 1]×[0, 1]) as the coordinate system.The decomposition is a regular Morton decomposition [23] whereeach square block can be referenced by its Morton code. So theMRSD method can be implemented within an RDBMS using stan-dard B-Tree indexes. Adding a data object to the collection involvescomputing the Morton code for its containing block at the deepestlevel, for each of the 9 offsets. When the system requires a sampleof objects within a query window, it first determines the depth of
decomposition to use when determining distinctiveness, and thenidentifies the objects with the highest distinctiveness scores. Fora given query window, the MRSD method expects objects with asize of (ϵ × ϵ) to be displayed (i.e., each object will have a squarerepresentation on the map). Indeed, the result of the query is a rowrepresenting the most important data object for every block in thewindow. By counting the number of times each object appears inthis result, we get the distinctiveness score of each object, a numberbetween 1 and 9. By construction, objects with a size of (ϵ×ϵ) andwith a distinctiveness score of 9 will not overlap any other objects.Consequently, we can treat MRSD as a filter.
3.2 Intersection Testing PhaseThe filtering phase yields all objects of maximum size (ϵ × ϵ)
that do not overlap. As we are dealing with labels of arbitrary size,the actual labels may be bigger than the (ϵ×ϵ) objects and we needan intersection testing phase to check for overlaps since the size ofthe labels can vary. Here we introduce three methods to implementthis phase.
In the text output layers of NewsStand, larger font point sizesmean using much space and thus the number of results returnedby the filter step is smaller. When this number is on the order ofhundreds (i.e., small), then it is efficient to use an O(nm) methodto check for overlaps, where n is the number of entries that arereturned by the filtering step, and m is the maximum number ofentries that can be displayed in a window, which we call the windowcapacity. However, if the font point size become smaller or the sizeof filter square decreases (the blue dashed square in Figure 4, thenthe size of the filter result would increase to thousands or more,which causes the O(nm) algorithm to be less practical.
One straightforward approach to speed up the intersection phase,is to limit the overlap check to a small subset of neighboring objects(e.g., 5) so that a negative is reported if no overlap is detected.
However, since we are dealing with labels that are rectangle ob-jects rather than points, we may miss some overlaps. We avoid thisby sorting the objects with a spatial index of which many choicesare available and we choose the PR-CIF quadtree [23]. We con-struct it by inserting the objects in decreasing order of the impor-tance score and only making the insertion if the new object doesnot overlap any of the existing objects in the tree.
4. EVALUATIONWe compare three text label layout methods:• Our Morton Index Filter method (MIF).• The O(nm) brute-force method (Basic), where n is the num-
ber of labels in the window being queried, and m is the max-imum number of non-overlapping labels in the window.
• The PR-CIF quadtree based method (Quad).We used two datasets, one of points of interest (POI) from cloud-
made.com and one of news keywords from newsstand.umiacs.umd.edu,which contain 11, 469, 485 and 9, 964, 607 labels, respectively, fromall over the world. The methods were evaluated using a realisticset of 5475 query windows from newsstand.umiacs.umd.edu querylogs. Figure 5 plots the query time for zoom levels from 18 to 3,although most queries were made at zoom levels 9 − 4 and thusthe response time in this range is the most important. Deeper zoomlevels are needed when the font point size is smaller. The red bro-ken line in Figure 5 reinforces this point in that the part of the curveto its right is more important than the part to its left.
The query response time of MIF includes three parts: convertinga window query into a number of SQL statements, retrieving datausing Morton code indexes, and discarding overlaps. The second

In Proceedings of the 22nd ACM SIGSPATIAL International Conference on Advances in Geographic Information Systems, pp. 409-412,Dallas, TX, November 2014
0.01
0.1
1
10
100
369121518
Tim
e (
sec)
Zoom Level
MIFBasicQuad
(a) Query response time in POI
0.01
0.1
1
10
100
369121518
Tim
e (
sec)
Zoom Level
MIFBasicQuad
(b) Query response time in NewsStandFigure 5: Efficiency evaluation
step is the filtering phase, which consumes the most time. Thethird step, which checks intersection, can be implemented usingeither the O(nm) brute-force method or a spatial index such as thePR-CIF quadtree, and its execution time depends on the size of thefilter square (i.e., the query window and the font point size). Forthe Basic and Quad methods, we first use the PostGIS extensionto select all of the labels in the current window query. Since itretrieves a large amount of data entries, the query response time canbe large for query windows that contain many labels, and likewisefor the step to detect overlaps. Note that Figure 5 does not showany data for the Basic and Quad methods for zoom levels 8 to 3as it takes too long to process queries for this range. Its clear thatthe efficiency of MIF is stable, while the other methods (Basic andQuad) exhibit response times that are roughly proportional to thenumber of entries in the current window.
5. CONCLUDING REMARKSWe have presented the Morton Index Filter (MIF) algorithm for
efficiently sampling variable-sized data objects, such as text labels,for display within a map query window. The algorithm satisfiesmany important criteria for interactive map labeling. The core ofour algorithm is a set of indexes on the Morton code representationof each object’s location, which allows for extremely fast identifi-cation of distinctive objects. One particularly novel aspect of ouralgorithm is how it handles variable-width labels. Our evaluationshows that these objectives are achieved with consistent sub-secondresponse time at all zoom levels, even on datasets with tens of mil-lions of points in the query window.
6. REFERENCES[1] M. D. Adelfio and H. Samet. GeoWhiz: Using common categories for toponym
resolution. In P. Widmayer, editors, GIS, pages 542–545, Orlando, FL, 2013.[2] M. D. Adelfio and H. Samet. Structured toponym resolution using combined
hierarchical place categories. In GIR, pages 49–56, Orlando, FL, Nov. 2013.[3] P. K. Agarwal, M. J. van Kreveld, and S. Suri. Label placement by maximum
independent set in rectangles. Comput. Geom., 11(3-4):209–218, 1998.[4] K. Been, E. Daiches, and C.-K. Yap. Dynamic map labeling. IEEE TVCG, 12
(5):773–780, Sep–Oct, 2006.[5] J. Christensen, J. Marks, and S. Shieber. An empirical study of algorithms for
point-feature label placement. ACM TOGS, 14(3):203–232, 1995.[6] S. Doddi, M. V. Marathe, A. Mirzaian, B. M. E. Moret, and B. Zhu. Map labeling
and its generalizations. In SODA, pages 148–157, New Orleans, LA, 1998.[7] C. Esperança and H. Samet. Experience with SAND/Tcl: a scripting tool for
spatial databases. Journal of Vis. Lang. and Comput., 13(2):229–255, 2002.[8] M. Formann and F. Wagner. A packing problem with applications to lettering of
maps. In SOCG, pages 281–288, North Conway, NH, USA, 1991.[9] B. C. Fruin, H. Samet, and J. Sankaranarayanan. Tweetphoto: photos from news
tweets. In GIS, pages 582–585, Redondo Beach, CA, 2012.[10] N. Gramsky and H. Samet. Seeder finder - identifying additional needles in the
Twitter haystack. In LBSN, pages 44–53, Orlando, FL, 2013.[11] G. R. Hjaltason and H. Samet. Speeding up construction of PMR quadtree-based
spatial indexes. VLDBJ, 11(2):109–137, 2002.[12] E. G. Hoel and H. Samet. Benchmarking spatial join operations with spatial
output. In VLDB, pages 606–618, Zurich, Switzerland, 1995.[13] A. Jackoway, H. Samet, and J. Sankaranarayanan. Identification of live news
events using Twitter. In LBSN, pages 25–32, Chicago, 2011.
[14] M. D. Lieberman and H. Samet. Multifaceted toponym recognition for streamingnews. In SIGIR, pages 843–852, Beijing, China, 2011.
[15] M. D. Lieberman and H. Samet. Adaptive context features for toponym resolu-tion in streaming news. In SIGIR, pages 731–740, Portland, OR, 2012.
[16] M. D. Lieberman and H. Samet. Supporting rapid processing and interactivemap-based exploration of streaming news. In GIS, pages 179–188, RedondoBeach, CA, 2012.
[17] M. D. Lieberman, H. Samet, and J. Sankaranarayanan. Geotagging with locallexicons to build indexes for textually-specified spatial data. In ICDE, pages201–212, Long Beach, CA, 2010.
[18] M. D. Lieberman, H. Samet, and J. Sankaranarayanan. Geotagging: Using prox-imity, sibling, and prominence clues to understand comma groups. In GIR, article6, Zurich, Switzerland, 2010.
[19] S. Nutanong, M. D. Adelfio, and H. Samet. Multiresolution select-distinctqueries on large geographic point sets. In GIS, pages 159–168, Redondo Beach,CA, 2012.
[20] S. Nutanong, M. D. Adelfio, and H. Samet. An efficient layout method for alarge collection of geographic data entries. In EDBT, pages 717–720, Genoa,Italy, 2013.
[21] G. Quercini, H. Samet, J. Sankaranarayanan, and M. D. Lieberman. Determiningthe spatial reader scopes of news sources using local lexicons. In GIS, pages 43–52, San Jose, CA, 2010.
[22] H. Samet. A quadtree medial axis transform. CACM, 26(9):680–693, Sep. 1983.Also see CORRIGENDUM, CACM, 27(2):151, 1984.
[23] H. Samet. Foundations of Multidimensional and Metric Data Structures.Morgan-Kaufmann, San Francisco, 2006. (Translated to Chinese ISBN 978-7-302-22784-7).
[24] H. Samet and M. Tamminen. Bintrees, CSG trees, and time. Computer Graphics,19(3):121–130, 1985.
[25] H. Samet, A. Rosenfeld, C. A. Shaffer, and R. E. Webber. A geographic infor-mation system using quadtrees. Pattern Recognition, 17(6):647–656, 1984.
[26] H. Samet, H. Alborzi, F. Brabec, C. Esperança, G. R. Hjaltason, F. Morgan, andE. Tanin. Use of the SAND spatial browser for digital government applications.CACM, 46(1):63–66, 2003.
[27] H. Samet, M. D. Adelfio, B. C. Fruin, M. D. Lieberman, and B. E. Teitler. Portinga web-based mapping application to a smartphone app. In GIS, pages 525–528,Chicago, 2011.
[28] H. Samet, B. E. Teitler, M. D. Adelfio, and M. D. Lieberman. Adapting a mapquery interface for a gesturing touch screen interface. In WWW (CompanionVolume), pages 257–260, Hyderabad, India, 2011.
[29] H. Samet, M. D. Adelfio, B. C. Fruin, M. D. Lieberman, and J. Sankara-narayanan. PhotoStand: a map query interface for a database of news photos.PVLDB, 6(12):1350–1353, 2013.
[30] H. Samet, J. Sankaranarayanan, M. D. Lieberman, M. D. Adelfio, B. C. Fruin,J. M. Lotkowski, D. Panozzo, J. Sperling, and B. E. Teitler. Reading news withmaps by exploiting spatial synonyms. Communications of the ACM, 57(10), Oct.2014.
[31] J. Sankaranarayanan and H. Samet. Images in news. In ICPR, pages 3240–3243,Istanbul, Turkey, 2010.
[32] J. Sankaranarayanan, H. Samet, B. Teitler, M. D. Lieberman, and J. Sperling.TwitterStand: News in tweets. In GIS, pages 42–51, Seattle, WA, 2009.
[33] A. D. Sarma, H. Lee, H. Gonzalez, J. Madhavan, and A. Y. Halevy. Efficient spa-tial sampling of large geographical tables. In SIGMOD, pages 193–204, Scotts-dale, AZ, 2012.
[34] C. A. Shaffer, H. Samet, and R. C. Nelson. QUILT: a geographic informationsystem based on quadtrees. IJGIS, 4(2):103–131, 1990.
[35] R. Sivan and H. Samet. Algorithms for constructing quadtree surface maps. InSDH, volume 1, pages 361–370, Charleston, SC, 1992.
[36] E. Tanin, A. Harwood, and H. Samet. A distributed quadtree index for peer-to-peer settings. In ICDE, pages 254–255, Tokyo, Japan, 2005.
[37] B. Teitler, M. D. Lieberman, D. Panozzo, J. Sankaranarayanan, H. Samet, andJ. Sperling. NewsStand: A new view on news. In GIS, pages 144–153, Irvine,CA, 2008.
[38] F. Wagner and A. Wolff. An efficient and effective approximation algorithm forthe map labeling problem. In ESA, vol. 979 of Springer-Verlag Lecture Notes inComputer Science, pages 420–433, Corfu, Greece, 1995.