
eprints.lancs.ac.ukeprints.lancs.ac.uk/76687/1/Text.docx · Web viewempirical results. And section...
41
The cost of growth: Small firms and the pricing of bank loans Anoosheh Rostamkalaei, IEED, Lancaster University Management School a.rostamkalaei@lancaster .ac.uk and Mark Freel, Telfer School of Management, University of Ottawa and IEED, Lancaster University Management School [email protected] Tel: +1-613-562-5800 x 4733 Abstract Drawing upon data from the 2007 UK Survey of SME Finance, the current analysis is concerned with the extent to which growth firms are discriminated on price in loan markets. Or, more simply, the extent to which growth firms pay more for credit. Given relatively small turndown rates historically (Vos et al. 2007), higher credit prices may be a more substantial growth constraint than the access to finance issues that have dominated the academic literature to date. To this end, we observe, inter alia, that firms who have recorded recent high growth are more likely to pay higher interest rates for the loan they obtained. Moreover, small sized firms who intend to grow through the introduction of new products exhibit a higher probability of paying more for credit than their peers. Finally, acknowledging that banks are not risk funders, we discuss the potential policy implications of these findings. Keywords: Growth firms, Entrepreneurial Financing, Bank loans, Interest rate, Innovative firms JEL: L21, L26, G32 1
Transcript of eprints.lancs.ac.ukeprints.lancs.ac.uk/76687/1/Text.docx · Web viewempirical results. And section...
The cost of growth: Small firms and the pricing of bank loans
Anoosheh Rostamkalaei, IEED, Lancaster University Management [email protected]
and
Mark Freel, Telfer School of Management, University of Ottawa and IEED, Lancaster University Management School
[email protected]: +1-613-562-5800 x 4733
Abstract
Drawing upon data from the 2007 UK Survey of SME Finance, the current analysis is concerned
with the extent to which growth firms are discriminated on price in loan markets. Or, more simply, the extent to
which growth firms pay more for credit. Given relatively small turndown rates historically (Vos et al. 2007), higher
credit prices may be a more substantial growth constraint than the access to finance issues that have dominated the
academic literature to date. To this end, we observe, inter alia, that firms who have recorded recent high growth are
more likely to pay higher interest rates for the loan they obtained. Moreover, small sized firms who intend to grow
through the introduction of new products exhibit a higher probability of paying more for credit than their peers.
Finally, acknowledging that banks are not risk funders, we discuss the potential policy implications of these
findings.
Keywords: Growth firms, Entrepreneurial Financing, Bank loans, Interest rate, Innovative firms
JEL: L21, L26, G32
1

The cost of growth: Small firms and the pricing of bank loans
Abstract
Drawing upon data from the 2007 UK Survey of SME Finance, the current analysis is concerned
with the extent to which growth firms are discriminated on price in loan markets. Or, more simply, the extent to
which growth firms pay more for credit. Given relatively small turndown rates historically, higher credit prices may
be a more substantial growth constraint than the access to finance issues that have dominated the academic literature
to date. To this end, we observe, inter alia, that firms who have recorded recent high growth are more likely to pay
higher interest rates for the loan they obtained. Moreover, small sized firms who intend to grow through the
introduction of new products exhibit a higher probability of paying more for credit than their peers. Finally,
acknowledging that banks are not risk funders, we discuss the potential policy implications of these findings.
Keywords: Growth firms, Entrepreneurial Financing, Bank loans, Interest rate, Innovative firms
JEL: L21, L26, G32
2

1. Introduction
It has long been recognised that a small group of high growth firms create the bulk of the net new jobs in an
economy. These are Storey’s (1998) “ten percenters” or Birch’s (1990) “gazelles”. Unsurprisingly, these firms have
been the focus of considerable academic research (Henrekson and Johansson 2010) and policy attention (Hoffman
2007). Indeed, informed recent debate has focused on the merits of further shifting the emphasis of entrepreneurship
policy away from the creation of new ventures to the support of high growth firms (cf. Shane 2009; Mason and
Brown 2011). This view is consistent with recent evidence that suggests that the presence of “ambitious
entrepreneurship” is a stronger predictor of macro-economic growth than entrepreneurial activity in general (Stam et
al. 2007). In this light, identifying and supporting growth firms are key priorities.
Much of the extant academic research has been concerned with the characteristics of growing firms (Barringer,
Jones, and Neubaum 2005; Baum, Locke, and Smith 2001) or with the (often institutional) determinants of growth
(Davidsson and Henrekson 2002; Barkham, Gudgin, and Hart 2012). Less attention has been paid to the issue of
barriers to growth; that is, to the obstacles faced by firms as they expand rapidly (Lee 2013). However, an important
subset of barriers that has received attention relates to finance (Becchetti and Trovato 2002; Beck, Demirgüç-Kunt,
and Maksimovic 2005; Beck and Demirguc-Kunt 2006). In general, this line of research has explored the extent to
which limits to access to various forms of external finance constrains the growth of smaller firms. A prominent
finding in this literature is that growth firms are likely to be less successful loan applicants (e.g. Freel 2007). Failure,
from this perspective, is typically defined in terms of simple loan turndowns or loan scaling; such that growth firms
are more likely to either receive no loan or a smaller amount than applied for. These firms are credit rationed: that is,
assuming that these growth firms are otherwise observationally indistinct from successful applicants, banks are
rationing credit on some basis other than price.
However, whilst growth firms may disproportionately face turndowns or loan scaling, it still remains that the
majority receive the loans they apply for (Vos et al. 2007). In these cases, it is the terms of the loans which are of
interest. In particular, if growing firms are shown to pay systematically higher prices for debt, then this may be of
greater concern than the smaller numbers who are credit rationed. Whilst higher price may reflect higher risk, higher
loan prices may also hinder firm development, as the resources required to invest in growth are diverted to the loan
provider. This question is the focus of the current study. Drawing on data from the 2007 UK Survey of SME
Finance (Cosh et al. 2008), we model the price firms paid for variable rate loans. Our models contain information
both on past growth and future growth intentions; including the proposed growth strategies. We find evidence that
both past growth and future growth intention, conditional on strategy, associate with higher loan prices.
The manuscript is structured as follows: Section 2 briefly reviews the literature on bank financing of small firms,
with particular emphasis on growth firms, and develops three hypotheses that link loan pricing and firm growth.
Section 3 describes our data. Section 4 elaborates on our models and modelling choices. Section 5, presents our
3

empirical results. And section 6 offers concluding remarks, drawing out initial implications for entrepreneurs and
policymakers.
2. Literature review
In accessing bank finance, compared to large and established companies, small firms are disadvantaged by their
information opacity, the relative scarcity of collateralizable assets, and disproportionately high monitoring costs
(Beck and Demirguc-Kunt 2006; Berger and Udell 1998). For start-ups, lack of credit history and high rates of
failure also contribute to their unfavourable situations. In consequence, the small firm sector has long been thought
to be subject to credit rationing (Parker 2002; Stiglitz and Weiss 1981; Vos et al. 2007, among many): a situation in
which some borrowers are denied credit or receive a lower amount of credit than they applied for. An important
condition holds that these firms are, in all other respects, indistinguishable from those who have received (full)
credit (Parker 2002). In such a situation, a firm is known as credit rationed. It does not receive the money it
requested despite being willing to pay a higher interest rate (de Meza 2002). In short, banks are seen to ration credit
on some basis other than price.
In practice, credit institutions use a variety of techniques to distinguish between good and bad borrowers; employing
different contract terms such as higher pricing, collateralisation and sub-optimal loan sizes (Parker 2002). If banks
were to use similar contract terms, employing a pooled interest rate for all types of borrowers, good borrowers will
likely either exit the loan market (Parker 2002; Stiglitz and Weiss 1981) or subsidize lower quality borrowers (de
Meza 2002). Using different contract terms is a means to reveal the types of borrowers (Parker 2002) and to
recognise varying risks of default. For example, collateral is perceived as a sign of entrepreneurs’ commitment and
confidence in their success. The willingness to secure a loan with collateral, frequently through personal asset, acts
as a positive signal to banks about the qualities of the entrepreneur as a good borrower (Berger and Udell 1998;
Binks and Ennew 1996). In the presence of such instruments, and accounting for borrower heterogeneity, there is
limited evidence of broad-based credit rationing in the small firms’ literature (Freel 2007). However, the absence of
credit rationing does not necessarily entail the absence of discrimination. Indeed, given differing risk profiles
attendant upon varying firm characteristics and strategies, banks must inevitably discriminate one firm from another
in the terms of contracts they offer for credit. In this case, banks seek to ration credit on the basis of price and price-
related characteristics.
Firm strategy and performance are principal sources of borrower heterogeneity that may bear upon risk. As noted
above, only a small proportion of small firms make much of a contribution to net job creation, innovation, or
increased productivity (Shane 2009; Organisation for Economic Co-operation and Development 2013, 60). Due to
their importance, small growing firms have been the subject of numerous studies aiming to describe the growth
cycle and to identify the factors supporting or impeding growth (Dobbs and Hamilton 2007). Financial structure and
access to finance at the time of growth are common themes in these studies. Of course, access to finance does not
4

directly cause growth; but credit constraints may affect growth by suppressing it (Binks and Ennew 1996; Vickery
2008), or forcing managers to rely on internal funds as a source of growth investment (Rahaman 2011). Internal
sources of financing, often personal wealth or retained earnings, are typically the first option of an entrepreneur (Vos
et al. 2007; Berger and Udell 1998). However, internal sources are likely to be limited and this limitation may act to
constrain the growth of the firm (Beck and Demirguc-Kunt 2006). Indeed, Rahaman (2011) shows that as external
financial constraints lessen, firms switch from internal to external funds as a means to finance growth. Moreover,
this patterns of transition from internal to external funding is most pronounced in small unquoted companies
(Rahaman 2011). These firms are more likely to be financially constrained and to face information problems.
However, there is likely to be an important complementarity between internal and external finance: “Access to
internal sources of finance may play the twin roles of proxying for internal financial capacity as well as providing a
signal about the quality of future growth opportunities. Such signals, in turn, reduce the external financial
constraint” (Rahaman, 2011, p. 723). In short, small growing firms are eventually likely to view external sources of
finance as a complement to internal sources and to increasingly use external sources to fund growth. Crucially, of
these external sources, banks are consistently identified as the primary provider of external funds for small firms
(Robb and Robinson 2014).
In this vein, for instance, Beck et al (2005), based on data from a firm level survey conducted by the World Bank,
find that financial obstacles are perceived as the most important barriers to growth. The identified barriers largely
revolve around bank finance and include: the provision of collateral; the bureaucratic procedures of banks; the social
networks of borrowing; and, the price of finance. In other studies, perceived financing constraints are also shown to
have a positive association with growth intention (Binks and Ennew 1996; Nitani and Riding 2013). Firms intending
to grow expect to encounter more problems than firms which actually experienced growth. That is, growing firms
(who are often smaller and younger firms) anticipate that lack of credit history and an established relationship with
banks will result in tighter credit availability (Binks and Ennew 1996).
Consistent with the perception of finance as a barrier to growth, recent empirical research has provided evidence that
growth firms are more likely to have their loan applications refused (Riding et al. 2012), face loan scaling (Freel
2007) and identify themselves as discouraged borrowers (Freel et al. 2010). Typical rationalisation of these findings
focuses on the higher risk associated with growth firms. However, despite this risk, most loan applicants go on to
successfully borrow all or some of the money they sought. For instance, using data from the US National Survey of
Small Business Finance, Levenson and Willard (2000) estimated that only 6% of firms “had an unfulfilled desire for
credit”; of which 2% were actually denied funding and 4% were discouraged from applying. More specifically, Vos
et al. (2007) observed that fast growing small firms in the UK and US, respectively, applied for and obtained more
sources of financing than non-growth firms. It follows that, if most applicants are successful, the focus of the
discussion should shift from credit access to terms of credit. Central to credit terms are the prices firms pay for their
loans.
5

To the extent that higher loan prices reflect higher borrower risk (Berger and Udell 2003; Berger, Frame, and Miller
2005), one would anticipate growth firms facing higher loan rates. Firm growth implies change: change in, inter
alia, employment, sales, market share, or assets. Rapid growth implies rapid change. These changes occur over a
specific period of time (Dobbs and Hamilton 2007) and research has shown small firm growth to be episodic (Brush,
Ceru, and Blackburn 2009). In other words, growth is a temporary and dynamic phase that many firms experience
(Nightingale and Coad 2014), and growing firms undertake several alterations in their business processes and
products. Not only are the outcome of these changes uncertain, but the pace of change makes it more difficult for
banks and credit institutions to monitor growing firms and evaluate their performance (Binks and Ennew 1996). Past
research has shown that the price of obtaining funds rises as the valuation of the firm becomes less straightforward
for its investors (Strahan 1999). In this way, the increased levels of information asymmetry attached to growing
firms increases their risk and consequently the financial constraints they face (Beck and Demirguc-Kunt 2006; Beck,
Demirgüç-Kunt, and Maksimovic 2005; Binks and Ennew 1996; Nitani and Riding 2013). Higher loan price,
reflecting higher risk (Strahan 1999), may be a key manifestation of financial barriers for growth-oriented
entrepreneurs.
The foregoing leads us to two linked hypotheses:
H1. Firm which experienced growth in the near past pay higher interest rates on loans.
H2. Firms which intend to grow in near future pay higher interest rates on loans.
Small firms may take a variety of paths to growth (Garnsey, Stam, and Heffernan 2006). The variety in paths is
likely to be underpinned by variety in strategy. Importantly, the various growth strategies that entrepreneurs take
impose different levels of additional risk to their firms. For example, Wiklund and Shepherd (2005) report research
that suggests that ‘tried-and-true’ strategies lead to higher mean performance, whilst risky strategies – with higher
performance variety – may lead to both greater individual successes and more frequent failures. This is consistent
with the view that innovation only spurs growth in a “handful of ‘superstar’ fast growth firms” (Coad and Rao
2008); whilst for the bulk of firms innovative investments lead to zero or negative returns.
To the extent that banks primarily provide non-syndicated commercial loans to small businesses (Berger and Udell
2003), banks are not providers of risk capital. That is, banks do not share in the upside gain of spectacular growth.
Accordingly, the greater risk of failure is likely to bear on the lending decision and on the price of the loan; more
than the prospect of dramatic success. In this vein, Freel (2007) provides evidence that innovators were less likely to
get access to all of the funds they seek from their banks (i.e. to face loan scaling). Similarly, Nitani and Riding
(2013) find that costs of borrowing are higher for R&D intensive firms. In short, the foregoing leads us to anticipate
that firms seeking to grow through innovation will face higher borrowing costs than firms seeking to expand by
simply doing ‘more of the same’.
6

H3. Loan pricing is related to growth modes, such that more aggressive growth strategies will associate with higher
interest rates and safer strategies will be associated with lower interest rates.
3. Data and methodology
The data used in this study are a sub sample drawn from the 2007 UK Survey of SME Finance (Cosh et al. 2008).
Since the data was collected in autumn 2007, we anticipate that our results are not greatly influenced by the major
changes in banking environment starting from December 2008 in the United States. However, we reflect upon the
implications of the timing of the study in our concluding remarks. Respondents to the survey were owners or
managers of firms, excluding public and not for profit organizations, with less than 250 employees or/and £35
Million turnover. The initial sample was provided by Dun and Bradstreet with more than 82,000 firms. However,
after considering the survey criteria, survey quota and accessibility, around 25,000 firms were contacted. The
response rate was 10%. This response rate might increase the risk of sampling bias; however, the proportion of
responses is the same across all sizes of companies (Cosh et al. 2008). Testing for non-response bias was not
possible. In addition, weighting the respondents based on size, sector and region and comparing them with break-
down of 4.3 million businesses in the UK show that firms with zero employees represent relatively less than
population statistics. We bear these limitations in mind for interpretation of our results. The survey collected
information on a variety of financial tools firms had been using (within the three years prior to the survey date) for
business purposes including largest single outstanding loan. For these loans, data on interest rate and other terms of
contract were collected.
The survey includes 2,500 firms; however, for the purpose of this study, 247 firms are the focus. These are the firms
which use banks’ commercial loans and mortgages, with variable interest rate, at the time of data collection. Interest
rates incorporate elements of both the prevailing riskiness of the economic environment and the perceived (or
measured) riskiness of the individual borrower. By focusing only on variable rates loans, we hope to control for the
former and address only the latter. Variable interest rates comprise of a base rate plus some premium above base 1.
The former may be thought to capture the economic conditions at any given time; whilst the latter addresses the
riskiness of the entrepreneur or firms. By focusing on the premium paid over the base rate, variations in absolute
rates that may reflect different underlying economic conditions at the time of loan granting are largely controlled
for. Crucially, whilst our loans were all outstanding on the survey date, they were not all awarded
contemporaneously. The survey collected data on the premium paid over the base rate, rather than the final interest
rate. We hold that changes in rate premiums largely reflect the dynamics of the lending environment and firm level
characteristics, and much less the underlying economic conditions. Unlike several studies (Binks and Ennew 1996;
1 In the UK, this is typically the Bank of England base rate plus some premium determined by individual banks.
7
Beck and Demirguc-Kunt 2006; Beck, Demirgüç-Kunt, and Maksimovic 2005; Vos et al. 2007) regarding financial
constraints or loan pricing, our research deals with an objective measure of higher or lower price.
In contrast to variable rates, and to the extent that they do not vary over time, fixed rates are likely to reflect
borrower riskiness and economic conditions only at the time at which they were awarded. Accordingly, fixed loan
rates for loans awarded at different times are not directly comparable. We set them aside in the current analyses2.
3.1. Dependent variable
In constructing our dependent variable, we use a survey question that asks respondents the rate they paid for their
largest outstanding bank loan. The questions were only directed at those firms who reported using bank loan and
mortgage facilities at the time of data collection (around 25% of sample firms). Of these, 41% provided information
on the variable interest rate. The remainder held fixed rate loans. Firms holding variable rate loans were offered a
categorical response variable, which expressed the rate in percentage points above base. Specifically, firms could
indicate the rate they paid in one of seven rate ranges. The lowest range was 0-2%; thereafter the next four
categories increased by 2 percentage points at a time. The two final categories indicated variable interest rate in the
ranges of 10-15% and more than 15% over the prevailing base rate. However, no firms reported paying more than
10% over base rate.
Figure 1 represents the distribution of contracted rate premiums in the sample. The majority of loans falls in the first
category of 0-2% premium rate (57%), followed by the second category of 2-4% (33%). Because of the small
number of observations for premium rates of more than 4%, we recoded all these categories into one category.
Accordingly, our final dependent variable has three orderings: 0-2%, 2.01-4%, and greater than 4%. The ordered
nature of our dependent variable is reflected in our choice of analytical method – ordered probit – which we outline
below.
Insert figure 1-
3.2. Independent variable
Our independent variables are constructed to allow us to test hypotheses 1-3. Accordingly, they are concerned with
growth and growth strategies. To this end, the data allow us to construct three measures of growth. In the first
instance, and in line with H1, we focus on the growth history. Firms are considered to experience past growth if
respondents declared they experienced 30% increase in sales turnover for each of the three years preceding the
survey date3. This is a fairly high threshold and these growth firms may reasonably be thought of as ‘super growth’
2 To confirm our intuition, we performed a similar suite of analyses on fixed rate loans. As expected, these models were poor predictors of loan rate, with few significant variables. The results are available on request.3 The survey question specified the 30% threshold.
8

firms (Delmar, Davidsson, and Gartner 2003). In practical terms, these high growth firms were coded 1, with all
other firms coded as 0.
To address H2, our second independent variable focuses on growth aspirations. The relevant survey question
captures the owner managers’ growth intention over the three years subsequent to 2007. Owner managers’ growth
intentions are not trivial in distinguishing between actual growers and non-growers. Indeed, there is a longstanding
view that “one of the most important factors [in influencing growth] is the commitment of the leader of the company
to achieving growth” (Smallbone, Leigh, and North 1995, p. 59). In this instance, respondents were asked whether
they planned for their firm to “grow substantially”, “grow moderately”, “stay the same” or “become smaller”. We
coded firms intending to grow substantially or moderately as 1. Respondents who indicated that they wished their
firms to stay the same size or to become smaller were coded as 04.
However, since questions relating to growth intentions are likely to be prone to both a normative bias and the over
optimism of the entrepreneurs, we also focus on specific growth strategies. By this means, we investigate our third
hypothesis. To this end, the survey included a question on how firms intended to grow (directed only to those firms
indicating a growth intention). Specifically the question identifies four possible growth strategies: “move into new
markets”, “introduce new products or services”, “increase sale with existing products and services”, and “hire more
employees”. These strategies are not mutually exclusive and firms could indicate all, some or none. In line with our
stated hypothesis, we consider “new market” and “new products or services” to be higher risk, more aggressive
strategies; whilst “sales of existing product” and “hiring more employees” are lower risk, less aggressive strategies.
In each case, firms indicating the intention to follow one of the strategies were coded 1, otherwise firms were coded
0. This results in 4 binary dummy variables that are entered into the models. Respondents had the option to add to
these strategies, but because of small number of observations those responses are excluded from the analyses.
In addition to the variables that allow us to directly test our hypotheses, we also estimate models incorporating a
‘super growth’ variable. This variable was defined by the survey investigators (Cosh et al. 2008), such that firms
characterised as ‘super growth’ experienced more than 30% increase in turnover each of the 3 years prior to the
survey and intend to sustain the growth moderately or substantially over the three years subsequent to the survey.
This measure reflects the past and future orientation of the firms, excluding start-ups (firms in business for less than
two years). In essence, this variable is an interaction term between realised past growth and future growth intentions.
3.3. Control variables
In modelling small firm loan prices as a function of our independent variables, it is important to control for other
influences on price. These are likely to be factors which lower or raise perceived risk. Two factors, in particular, are
commonly considered in the empirical literature: the role of collateral and relational lending. Credit institutions
4 As a robustness check, we coded only those firms declaring an intention to grow substantially as 1, otherwise 0. The results were unchanged.
9

consider collateral as a positive signal that alleviates lending constraints by reducing information asymmetries or
default risks (Berger and Udell 1998; Parker 2002). The information asymmetry between banks and entrepreneurs
retards banks’ ability to distinguish between good and bad entrepreneurs. However, the entrepreneur, aware of their
situation, and trying to avoid imperilling their assets, increases their effort to succeed. Strahan (1999) argues that
collateral makes post-investment monitoring activities easier but does not affect the price, and the riskiness of a firm
is reflected in the price it pays. While pledging collateral may not necessarily lower the risk (price) for growth
firms, it is not an unambiguous merit (Binks and Ennew 1996). That is, as the risks of these firms increase, the gap
between the banks’ valuation of the assets (at the time of probable default) and the costs of obtaining those assets
from the firm rises. Hence, growing small firms, comparing to other small firms, are more prone to under-evaluation
of their assets or “inadequate collateral”. To mitigate this problem and respond to growing firms’ increasing
demands for funds, banks may rely on relationship lending (Binks and Ennew 1996).
The severity of information opacity can be mitigated by relational lending. Relationships allow banks to gather
information about the firm and entrepreneur over time and to shift the emphasis of lending decisions from hard to
soft criteria (Beck and Demirguc-Kunt 2006). This reduced problem of information asymmetry may translate into
greater access to bank finance at lower prices (Binks and Ennew 1996). However, there is no general consensus
about the effect of relationship banking. Sharpe (1990) suggests that banks, relying on the fact that firms are locked-
in, internalize the benefits of the relationship. Peterson and Rajan (1994) conclude that there is no significant
association between length of lending relationship and lower interest rate; excepting an insignificant effect where the
bank also provides other financial services to the firm. Moreover, loan pricing may also exhibit a cyclical pattern.
That is, when firms switch to new banks, interest rate decreases in order to lock in the new customers. However,
after a while, firms are charged the same price that they should have paid if they had stayed with their initial bank
(Ioannidou and Ongena 2010) or an even higher price to compensate the early subsidies (Kim, Kristiansen, and Vale
2012). Finally, when banks collect enough information about the firm’s performance, the interest rate decreases
again (Kim, Kristiansen, and Vale 2012).
Yet, despite the equivocal literature, the provision of collateral and the existence of longer term relationships are
likely to be important control variables in loan pricing models. In our model, these two variables are part of a set of
controls intended to capture important aspects of the loan contract. Collateral is measured as a simple dummy
variable taking the value 1 if the firm was asked to provide collateral in securing the loan, and 0 otherwise.
Relationship banking is proxied by the length of relationship with the firm’s primary bank. This information was
captured categorically, with the smallest category indicating a banking relationship of 0-3 years. Firms in this
category were coded 0, indicating no relationship banking, otherwise firms were coded 1.
In addition to these 2 variables, we also include indicators of the purpose of the loan and of the source of the loan. In
the first instance, we are able to observe whether the intended use of the loan was for working capital or for the
purchase of assets. Physical asset, purchased with a loan, can have a similar function as collateral (Berger and Udell
10

1998) and imply lower risk. We code loans sought for the purchase of physical assets as 1, otherwise we code them
as 0. In terms of loan source, this describes the relationship between the banks and the firm further. Specifically,
firms were asked whether their main bank was the only provider of the loan, one of the providers, or whether the
loan was provided by a bank other than the firm’s primary bank. In the last instance, we would anticipate that the
‘external’ bank would have had less information about the quality of the firm and the entrepreneur. In general, we
anticipate that working with a new bank or securing a loan from multiple sources may impact the price of loan (Kim,
Kristiansen, and Vale 2012; Peterson and Rajan 1994; Vos et al. 2007). In addition, we controlled for the access of
the entrepreneur to other sources of external finance. Entrepreneurs may use more than one source of external
finance to fund their company; and the various forms available may be more or less sensitive to information
asymmetries and require more or less information disclosure or firm monitoring. To this end, the pecking order
hypothesis (Myers 1984) posits that firms exhibit a preference hierarchy in seeking sources of finance; starting from
internal sources to debt and then equity financing. To the extent that external equity is rare and that other forms of
debt instrument (e.g. leases and overdrafts) entail lower agency costs, term loans may be at the bottom of the
hierarchy. In this case, firms may view term loans from banks as funding of last resort. Those who approach banks
later, having exhausted all other avenues of funding, may be viewed as more risky than those who approach banks
early, confident in their ability to repay principal and interest and to satisfy monitoring requirements5. Alternatively,
using multiple sources may signal to banks good management and lessen the risk. Regardless, it is clear that the
financing decisions of the entrepreneur prior to or at the time of the loan request may affect the perceived riskiness
of the business. The issue is one of sequencing (i.e. when the bank was approached in relation to other sources of
finance). Unfortunately, our data does not allow us to directly address this issue. Rather, to reflect the idea that the
entrepreneur has exhausted less costly sources of financing, and those which entail a lower agency burden, we build
a proxy based upon the number of sources of external finance the firm had used during the 3 years prior to, or were
using at the time of, the survey. Ideally, we would like detail on the financing of the firm before the loan request, but
the data did not provide any information to shed light on the historical financing activities. The index is a simple
count of identified use of loans from the owner, loans from family and friends, leasing and higher purchase
agreements, credit cards, and overdraft funding.
Our second set of control variables is intended to capture firm heterogeneity. The first of these variables is a ‘usual
suspect’ in empirical studies of small firms – viz. size. Size has been shown to affect both access to and price of
credit (Aterido, Hallward-Driemeier, and Pagés 2011; Beck, Demirgüç-Kunt, and Maksimovic 2005; Binks and
Ennew 1996; Freel 2007; Vos et al. 2007). Even within small firm samples, larger firms are less likely to suffer (or
to suffer less) from information opacity and their performance may be more easily evaluated (Berger and Udell
1998). In this study, size is measured by the number of employees and coded into four size-bands: zero employees,
1-9, 10-49 and more than 50 employees. The zero size-band provides our reference category. We also control for
broad sectoral variation at the SIC division level. Here, agriculture acts as our reference category. Finally, we also
include the age of the business as a control variable. As the firm grow older, one expects that the credit history and
5 We are grateful to an anonymous reviewer for raising this possibility.
11
reputation of the firm act as risk mitigating factors. Due to the structure of the questionnaire and number of
observations, we defined age of the business as 1 if it is older than 10 years and zero otherwise.
Beyond these structural characteristics, banks also rely on information they have on the quality of the owner of the
business (as a borrower) (Berger and Frame 2007). To this end, we were able to incorporate in our models measures
of entrepreneurial experience, and owner-manager’s age and gender. However, when these are included with
business age in our models, collinearity becomes a concern. In the final analyses we use age of the entrepreneur in
preference to entrepreneurial experience. Importantly, our key findings are robust to this choice. Lastly, we control
for gender of the principal owner. This is measured as a simple binary variable taking the value 1 if the principal
owner was male, and 0 otherwise6.
3.4. Descriptive statistics
Table 1 presents descriptive statistics for the variables used in our analyses. As the data in panel A illustrate, most of
the firms are active in the service sector; have between 10-49 employees; and are older firms. For almost two-thirds
of firms, their main bank is the only provider of the loan. From the data in panel B, 82% of firms are principally
owned and managed by men; the remaining 18% of firms are run by women or jointly. Seventy-seven percent of
sample firms had a banking relationship extending more than 3 years and 76% of firms were required to collateralize
the loan of interest.
Panel B also records the distribution of firms across our key independent variables, such that: 17% of firms were
classed as “super growth” firms (i.e. firms experiencing growth more than 30% in each of the three years preceding
the survey and intending to growth in the three subsequent years). This figure is largely constrained by the 19% of
sample firms that were recorded as having experienced growth in the previous three years. Perhaps unsurprisingly,
71% of firms reported an intention to pursue growth in the coming years. This large figure may speak to normative
biases or over-optimism. However, only around 25% of firms indicate an intention to “grow substantially”, which is
closer to the number of past growers. In terms of growth strategies, 22% of firms indicated their intention to seek
growth through penetrating into new markets, 30% expect growth through new product or services, 55% expect to
increase the sale of existing product in the same market, and 34% plan to recruit more employees. As noted, these
strategies were not mutually exclusive and firms could select more than one strategy for growth.
Insert table 1-
4. Methods
6 This would include cases where the principal ownership was female or shared.
12

To examine the relationship between firm growth and the price of loans, and given the ordered nature of our
dependent variable, we estimate a series of ordered probit models (Greene and Hensher 2009). However, only a
proportion of the sample report loan rates, since only a proportion of our sample have outstanding loans. Focusing
only on these firms may result in sample selection bias. This bias may result from two selection issues: firstly, we
only deal with firms that applied for and were offered loans and, secondly, amongst those firms, we opt to consider
only those that received variable rated loans. To control for potential issues of selection bias, we estimate a two-
stage model (Heckman 1979). For completeness, we present the results of both the simple ordered probit and the
two-stage ordered probit in tables 3 and 4 (the details of the selection model used in the two-stage Heckman model
is detailed in the following section). Ordered probits, along with other forms of regression, are sensitive to
collinearity amongst the independent variables. For this purpose, table 2 also displays Variance Inflation Factors
(VIFs) for all the explanatory variables - calculated in regressions excluding and including the Inverse Mills Ratio
(IMR). In no cases is there evidence of multicollinearity.
Insert table 2-
5. Results
Table 3 presents the result of the simple ordered probit models. All the models are statistically significant at 99%. In
the first instance, our base model considers the control variables that are intended to proxy firm heterogeneity. Here,
we note that firm size associates with loan pricing. That is, as the size of the firm increases loan price decreases.
This is consistent with our expectations. Beyond this, we observe that older firms, the use of funds to purchase
assets and the provision of collateral are significantly negatively related to the probability of paying higher interest
rates. To restate, if a firm used the loan to purchase fixed assets and/or provided collateral for the loan, then the
probability of paying a higher price for the loan falls. In contrast, there is tentative evidence that the probability of
paying a higher loan rate rises with the age of the entrepreneur.
The second model includes all our control variables along with past growth. The significant variables from our base
model continue to associate with loan prices, except for the age of the business. However, we also now note a
negative relationship between loan syndication and the probability of paying higher interest rates. Importantly, and
in line with hypothesis 1, firms that experienced rapid growth in the past have a higher probability of paying more
interest.
Model 3 is concerned with growth intentions. In this, our control variables largely act in the same manner. However,
we do not find any support for our second hypothesis. There is no evidence that firms declaring an intention to grow
in the future pay higher rates of interest. Our initial intuition was that this was likely to relate to the high proportion
of firms reporting a growth intention. Over 70% of firms in the sub-sample declared an intention to grow over the
three years following the survey. However, recoding the variable to indicate only those firms planning to growth
“substantially” does not change this finding. It would seem that banks pay little regard to broad growth intentions in
pricing loans. However, it may also reflect the countervailing effects of different intended strategies (see below).
13

As a supplementary analysis, we introduce an interaction term to model 4. It indicates that, when coupled with past
growth, growth intentions do associate with higher loan prices. That is, firms enjoying growth in the past and
planning to grow in the future are more likely to have paid higher rates of interest on their loans. The survey team
termed such firms ‘super growth’, but one may also think of them as sustainable growers. Regardless, this result
provides further evidence in support of the global hypothesis that growing firms are discriminated on price in loan
markets. These firms differ from ‘future growth’ firms to the extent that, despite having proven past success, they
continue to pay more for loans than their non- and less growing peers.
The final model in table 3 is concerned with the relationship between different growth strategies and loan prices.
Here the results are broadly in line with H3. Of our four growth modes, growth through new product introduction is
positively associated with loan rates, whilst growth through sales of existing products is negatively associated with
growth rates. In other words, firms pursuing a ‘more of the same’ strategy appear to pay less for loans than those
pursuing more aggressive, innovative strategies. In our analysis, penetrating into new market or hiring more
employees are not significant explanatory variables in predicting the probability of higher or lower interest rates.
These results support our speculations about the associations between modes of growth and loan pricing; whereby
riskier strategies are associated with more expensive bank financing. Conversely, firms intending to sell more of
‘tested-and-tried’ products are associated with lower cost of financing. The countervailing effects of aggressive and
conservative intended strategies may also help explain the lack of a significant finding in support of H2.
Insert table3-
Insert table4-
As noted earlier in the paper, the foregoing analyses may be susceptible to selection biases arising from our focus
only on those firms who held variable rate loans. To control for the potential sample selection bias, the Heckman
(1979) two-stage model has been used. In the first stage, we estimate a Probit model of the probability of accessing
loans for all the observations in the sample. To calculate the probability of having loans in firms, we introduce the
following selection equation:
p(accessing to loan)= f (export, innovation, capital expenditure, size, assets, legal status, age of the business)
In our selection equation, we try to consider not only the variables that ease access to loans (e.g. firm size, asset base
and legal status) (Beck and Demirguc-Kunt 2006; Berger and Udell 1998; Berger and Udell 2006; Freel 2007), but
also variables that may affect the demand for loans (e.g. export activity, innovation, and recent capital expenditure).
In this way, we see loan utilisation as a function of both firms’ demand and banks’ willingness to supply. Exporting,
innovation, and capital expenditure are reported by the owners or managers. From this equation, we calculate the
14
Inverse Mill’s Ratio (IMR) which is subsequently used as an additional explanatory variable in the second stage
model. As table 4 records, the coefficient of the IMR is statistically significant in four models out of five 7. This
suggests the presence of selection bias (Jones 2007, 36–37); although our data does not support the existence of
selection bias in one of the models8.
Turning to our two-stage ordered probit, with Heckman correction; table 4 takes a similar approach to table 3, but all
models include the IMR calculated from the probit selection equation. Although the thrust of these results are
broadly in line with regards our independent variables, there is one intriguing differences with respect to our control
variables. Firm size, measured by the number of employees, was a negative and significant explanatory factor in the
probability of paying higher loan prices in the absence of our control for potential selection bias. However, when
selection is controlled for, size is no longer significant. It would seem that, whilst size may associate with holding a
loan, it has no robust influence on loan pricing. However, syndication, collateralization and loan use continue to be
significantly negatively associated with the probability of paying higher interest rates.
In all but our ancillary ‘super growth’ model, the existence of sample selection bias is indicated. However, where
this is controlled for, we continue to find evidence to support hypotheses 1 and 3 – though not hypothesis 2. In other
words, firms which have recorded past growth or who intend to grow through innovation are likely to have paid
higher rates of interest on their loans. Our sustainable, or ‘super growers’, are also likely to have paid a higher price
for credit. These firms, whilst not denied credit, are discriminated on the basis of price. In the next section, we turn
to the implications of these findings.
6. Discussion and concluding remarks
Based on UK survey of SME Finance (2007), we find that growth firms pay higher interest rates on bank loans. This
result holds after controlling for the effects of size, owner’s experience, industry sector, loan purpose, collateral and
relationship banking. In simple terms, firms that have successfully grown their businesses in the recent past paid
higher interest rates. Even where these firms anticipated sustaining their growth, they exhibited a higher probability
of paying more. That is, despite evidence of success and ambition, interest rates are higher.
Moreover, although intention to grow does not, on its own, show any association with higher price, we note that
intended growth strategy associates with loan price. Specifically, more risky strategies, involving the introduction of
new products and services, associated with higher interest rate; whilst, more conservative strategies, associated with
increased sales of the same products in existing markets, associate with lower loan prices.
7 The results of first stage probit regression are available on demand8 Another model, considering use of variable rate loans as the dependent variable of the probit (selection) model was also estimated. The results were broadly in line with the reported approach.
15

Crucially, none of the foregoing need imply a criticism of banks. Growth and innovation are likely to entail
additional risks to small businesses. Although banks are the primary sources of financing when entrepreneurs decide
to seek external financing (Robb and Robinson 2014), banks are not risk funders. Rather, in assessing loan
applications, banks are interested in the “serviceability” of the firms not the value of the business: the ability to
generate enough cash flow to pay the debt (Cowling, Liu, and Ledger 2012; Lee, Sameen, and Cowling 2014). In
this sense, growing small firms may be perceived as less attractive to risk-averse banks. Other sources of external
financing such as venture capital funds are presumed to be better suited to the financing of viable high risk projects.
However, for reasons of both supply and demand, venture capital is used by only a small proportion of firms. In our
sample, only four out of 2500 firms sought venture capital financing in the three years prior to 2007 and only 11%
reported that they may consider equity financing in future. If the risk of a project is too high that banks cannot offer
any interest rate to hedge the risk, the project may declined or the loan downsized. More often, however, the interest
rate rises (Parker 2002) and valuable capital is diverted to the loan provider in the form of a risk premium. This
might open a door for interventions designed to ameliorate the apparent risk of growth firms.
Academic commentary has recently argued that interventions in the process of establishment or growth of SMEs are
justified if targeted to growing and innovative firms (Shane 2009; Mason and Brown 2011; Nightingale and Coad
2014). If programs do not recognize the differences among the firms, their implementation will favour lower quality
firms at the expenses of higher quality ones (Nightingale and Coad 2014). Supporting lower quality firms would
decrease the investment rate of return and consequently would increase the price of capital for all type of firms
(Nightingale and Coad 2014). Alas, it seems easier to call for support targeted to high growth firms than to provide
practical guidance on how this may be achieved. In large part this is because “[high growth firms] are found across
all sectors of the economy, a heterogeneity that is also reflected in their age, size, origin, and ownership ( Mason and
Brown 2011, p.222)”.
We believe that focusing on the riskiness of growth firms may be a useful starting point for practical intervention.
This rests on an appreciation of growth risk as both objective and perceived. To the extent that growth firms are
objectively riskier, there is little policy can do other than offering to bear risk. This is what loan guarantee schemes
(LGS) currently do. Whilst belief in the existence of credit rationing is the fundamental rationale for loan guarantee
schemes (Cowling 2010), in practice they encourage incrementality or additionality in lending ( Riding et al., 2007).
That is, they encourage lending to firms that would have received turndowns otherwise due to their higher risk of
default (Zecchini and Ventura 2009). Crucially, guarantors typically apply a fee to cover defaults and protect the
integrity of the scheme. Thus, raising loan price. Regardless, our concern is not with firms that would otherwise be
turned-down for a loan. Rather, ours is with those [growth] firms who pay a higher price for loans. To this end,
whilst Riding (1998) observes that “the objective [of LGS] is to assist small firms, not to subsidize risky ones”, one
might wonder if there was a role for a targeted schemes whose objective was to subsidize risk. Of course, the
broader provision of grants to growing firms would be a more direct form of subsidy – providing some funds and
signalling firm quality in the event of a loan application.
16

Regardless, in the absence of further evidence, we are agnostic on the desirability of interventions aimed at
addressing the objective riskiness of growth firms – at least, beyond that which already exists. However, we are
more convinced of the merits of potential interventions aimed at reducing perceived riskiness. Much of the banks
assessment of small firm risk is likely to result from the greater information opacity attendant upon small firms
generally and growing small firms specifically. Past evidence has suggested that, for SMEs, relationship banking
may provide access to finance at lower costs (Binks and Ennew 1996). Relationships reduce information asymmetry.
However, there may be other, more timely, ways of reducing information asymmetries. In this, an analogy may be
drawn with the growing number of Investment Readiness programmes across Europe (Mason and Kwok, 2010).
Mason and Kwok(2010) note that the primary reason that businesses are not ‘investment ready’ is one of
information failure. In large part this involves presentational shortcomings: “Even if the underlying proposition is
sound a business may still fail to raise finance if the business plan is poorly constructed and presented” (Mason and
Kwok 2010, p.272). The parallels to ‘debt readiness’ are clear. Given the relative use of debt and equity even
amongst growing small firms, interventions designed to improve the ‘debt readiness’ of growing firms may be well
suited. In line with “investment readiness” (Mason and Harrison 2001), the main goal of such assistant to growth
firms should be increasing the quality of loan application and also providing information on the different banking
product and services, and their associate costs, potentially available for those firms.
In conclusion, based on the 2007 UK survey of SME Financing and information on the variable rate loans, we find
that growing firms hold more expensive loans. Similarly, those whose future growth plans revolve around
innovation are also more likely to hold higher priced loans. We interpret these findings to indicate a relationship
between firm risk (both objective and perceived) and loan pricing. However, there are inevitably limitations to our
research. In the first instance, higher loan rates may simply reflect the willingness of growth firms to accept poorer
contract terms. Busy entrepreneurs must allocate precious time and resources to apply for a loan. In consequence,
they are more willing to meet the higher loan price because of the higher opportunity/transaction costs they incur –
relative to non-growth firms9. Secondly, for the firms that had grown in the three previous years, our data does not
provide any information on whether the premium rate was contracted before, after or coincidental to growth. Still,
the significant partial relationship between the modes of future growth and interest rate suggests that even if the loan
is granted before initiating growth process, it captures the higher risk profile. Moreover, the modal number of years
firms had held loans in the sample was between 1 and 3 years. Thirdly, from all the bank facilities available to
SMEs, our study was only concerned with term loans and only variable rate term loans. Overdrafts or lines of credit,
which are likely to be important sources of working capital, are only a minor component in our financial ‘bundling’
explanatory variable. Future research might investigate the relationship among different risk profiles, the propensity
to use broader bank facilities, and the price those facilities obtain. Although we loosely proxy the capital structure of
the firm in terms of number of sources an entrepreneur uses, this sheds limited light on the perceived riskiness of the
9 We are grateful to anonymous reviewer for raising this possibility.
17

business prior to contracting loan terms and conditions. Further research, where data is available, may consider the
riskiness of the business due to its proximate financing decisions.
Fourthly, we concentrated on variable rate loans and the premium above base rates. Our expectation was that base
rates control for macro fluctuations. Nonetheless, our results may be context specific. The UK banking system is
relatively concentrated on supply side (Competition Commission Report 2002). As reported by Competition
Commission (2002), SME owners mainly work with one bank for all their required services and rarely change their
banks for better prices. Owners of course have the option to seek quotes from different banks, but the associate costs
and the perceived importance of banking relationship to the owners, make bargaining difficult (Competition
Commission Report 2002). Moreover, the scope for ‘shopping around’ is more limited than would be the case in a
more fragmented banking market. In the UK SME loan market, lending relationship becomes important for banks
and SMEs: Banks try to lock-in their customers, as SMEs are less likely to switch to new banks, and SMEs use
relationship banking to access finance more easily or on better terms (Berger and Udell 2006). Concentration in
banking markets has been shown to associate with the extent of relational lending (Ashton and Keasey 2005).
Moreover, establishing a long term relationship would aid banks to assess SMEs activities with lower degree of
information opacity (Ashton and Keasey 2005). In such a market, growing and innovative firms maybe more likely
to accept higher fees in order to keep their relationship with their banks and ensure their access to finance at the time
of cash flow difficulties. However, increasing competition among banks may increase customers’ bargaining power
and lower the price of loans (Rice and Strahan 2010).
The final consideration is the pertinence of our findings given the current situation in the UK loan market following
the financial crisis. Small firms’ access to bank facilities experienced a sharp decline from 2008. Whilst SMEs
decreased their demand for finance, the supply side was marked by a “U-shaped pattern”; with an initial decline and
subsequent recovery to the levels experienced before December 2009 (Cowling et al., 2012). Small businesses, in
the early part of this period, experienced higher rejection rates comparing to previous years. But the situation eased
considerably after 2009 (Financing SMEs and Entrepreneurs 2014: An OECD Scoreboard 2014). These patterns
held for all types of SMEs. Intriguingly, in the case of growing and innovative firms, firms intending to grow
reduced their demands, but firms who had achieved growth before the crisis maintained the same level of debt
demand (Cowling, Liu, and Ledger 2012). Nonetheless, Lee et al. (2014) show that access to bank finance for
innovative firms became more difficult after the financial crisis (based on 2007-2012 loan applications) and that
these firms were more likely to be unable to secure debt financing from any bank. Yet, the average credit scoring of
innovative and non-innovative firms did not differ significantly during this period, suggesting that assessments of
objective risk remained at the same level (Lee et al., 2014). One possible explanation of higher rates of loan refusal
for innovative firm might be banks’ increased perceived risk about their activities. In the recessionary period, the
most significant factor affecting the loan appraisal decision was the size of businesses, with growth orientation
apparently ignored in the process of decision making (Cowling et al., 2012). Regardless, given the recovery of loan
approval rates to before crisis levels, we anticipate that banks are likely to rely upon the same criteria to appraise
18

loan applications as prevailed in the pre-recession period. In short, bank assessment of risk and subsequent pricing
are likely to follow similar logics today as when our data was collected10.
References:
Ashton, John, and Kevin Keasey. 2005. “Competition and the Provision of Banking Services to SMEs in the U.K.” Small Business Economics 24 (5): 477–85. doi:10.1007/s11187-005-6447-x.
Aterido, Reyes, Mary Hallward-Driemeier, and Carmen Pagés. 2011. “Big Constraints to Small Firms’ Growth? Business Environment and Employment Growth across Firms.” Economic Development and Cultural Change 59 (3): 609–47.
Barkham, Richard, Graham Gudgin, and Mark Hart. 2012. The Determinants of Small Firm Growth: An Inter-Regional Study in the United Kingdom 1986-90. Routledge. http://books.google.ca/books?hl=en&lr=&id=7IU95d1d_4wC&oi=fnd&pg=PT7&dq=determinants+of+growth+firms&ots=4WDZfVxwgM&sig=nEC_5zB3Ld6aikpyuEf2HYjopNw.
Barringer, Bruce R., Foard F. Jones, and Donald O. Neubaum. 2005. “A Quantitative Content Analysis of the Characteristics of Rapid-Growth Firms and Their Founders.” Journal of Business Venturing 20 (5): 663–87. doi:10.1016/j.jbusvent.2004.03.004.
Baum, J. R., E. A. Locke, and K. G. Smith. 2001. “A MULTIDIMENSIONAL MODEL OF VENTURE GROWTH.” Academy of Management Journal 44 (2): 292–303. doi:10.2307/3069456.
Becchetti, Leonardo, and Giovanni Trovato. 2002. “The Determinants of Growth for Small and Medium Sized Firms. The Role of the Availability of External Finance.” Small Business Economics 19 (4): 291–306.
Beck, Thorsten, and Asli Demirguc-Kunt. 2006. “Small and Medium-Size Enterprises: Access to Finance as a Growth Constraint.” Journal of Banking & Finance 30 (11): 2931–43. doi:10.1016/j.jbankfin.2006.05.009.
Beck, Thorsten, Asli Demirgüç-Kunt, and Vojislav Maksimovic. 2005. “Financial and Legal Constraints to Growth: Does Firm Size Matter?” The Journal of Finance 60 (1): 137–77. doi:10.1111/j.1540-6261.2005.00727.x.
Berger, Allen N., and W. Scott Frame. 2007. “Small Business Credit Scoring and Credit Availability*.” Journal of Small Business Management 45 (1): 5–22.
Berger, Allen N., W.Scott Frame, and Nathan H. Miller. 2005. “Credit Scoring and the Availability, Price, and Risk of Small Business Credit.” Journal of Money Credit and Banking 37 (2): 191–222.
Berger, Allen N., and Gregory F. Udell. 1998. “The Economics of Small Business Finance: The Roles of Private Equity and Debt Markets in the Financial Growth Cycle.” Journal of Banking & Finance 22: 613–73.
———. 2003. “Small Business and Debt Finance.” In Handbook of Entrepreneurship Research, edited by Z.J. Acs and David B. Audretsch, 299–328. Great Britain: Kluwer Academic Publisher.
———. 2006. “A More Complete Conceptual Framework for SME Finance.” Journal of Banking & Finance 30 (11): 2945–66. doi:10.1016/j.jbankfin.2006.05.008.
Binks, Martin R., and Christine T. Ennew. 1996. “Growing Firms and Credit Constraint.” Small Business Economics, no. 8: 17–25.
Birch, David L. 1990. “Sources of Job Growth—and Some Implications.” In Jobs, Earnings, and Employment Growth Policies in the United States, 71–76. Springer.
Brush, Candida G., Dennis J. Ceru, and Robert Blackburn. 2009. “Pathways to Entrepreneurial Growth: The Influence of Management, Marketing, and Money.” Business Horizons 52 (5): 481–91. doi:10.1016/j.bushor.2009.05.003.
Coad, Alex, and Rekha Rao. 2008. “Innovation and Firm Growth in High-Tech Sectors: A Quantile Regression Approach.” Research Policy 37 (4): 633–48. doi:10.1016/j.respol.2008.01.003.
Competition Commission Report. 2002. The Supply of Banking Services by Clearing Banks to Small and Medium-Sized enterprises:A Report on the Supply of Banking Services by Clearing Banks to Small and Medium-Sized Enterprises within the UK. I. UK: Competition Commission. http://webarchive.nationalarchives.gov.uk/+/http://www.competition-commission.org.uk/rep_pub/reports/2002/462banks.htm#summary.
10 Informal conversations with British banking professionals suggests that this is a reasonable supposition. The things that ‘mattered’ stayed the same. Rather, it is the thresholds at which they matter that changed during the crisis.
19

Cosh, Andy, Alan Hughes, Anna Bullock, and Isobel Milner. 2008. “Inancing UK Small and Medium-Sized Enterprises: The 2007 Survey.” http://publications.eng.cam.ac.uk/361860/.
Cowling, M., W. Liu, and A. Ledger. 2012. “Small Business Financing in the UK before and during the Current Financial Crisis.” International Small Business Journal 30 (7): 778–800. doi:10.1177/0266242611435516.
Cowling, Marc. 2010. “The Role of Loan Guarantee Schemes in Alleviating Credit Rationing in the UK.” Journal of Financial Stability 6 (1): 36–44. doi:10.1016/j.jfs.2009.05.007.
Davidsson, Per, and Magnus Henrekson. 2002. “Determinants of the Prevalance of Start-Ups and High-Growth Firms.” Small Business Economics 19 (2): 81–104.
De Meza, David. 2002. “OVERLENDING?” THE ECONOMIC JOURNAL 112 (477): F17–F31. doi:10.1111/1468-0297.00681.
Delmar, Frédéric, Per Davidsson, and William B. Gartner. 2003. “Arriving at the High-Growth Firm.” Journal of Business Venturing 18 (2): 189–216.
Dobbs, Matthew, and R.T. Hamilton. 2007. “Small Business Growth: Recent Evidence and New Directions.” International Journal of Entrepreneurial Behaviour & Research 13 (5): 296–322. doi:10.1108/13552550710780885.
Financing SMEs and Entrepreneurs 2014: An OECD Scoreboard. 2014. OECD:Center of Entrepreneurship, SMEs, and Local Development. http://www.oecd.org/cfe/smes/financing-smes-scoreboard-2014.htm.
Freel, Mark, Sara Carter, Stephen Tagg, and Colin Mason. 2010. “The Latent Demand for Bank Debt: Characterizing ‘discouraged Borrowers.’” Small Business Economics 38 (4): 399–418. doi:10.1007/s11187-010-9283-6.
Freel, Mark S. 2007. “Are Small Innovators Credit Rationed?” Small Business Economics 28 (1): 23–35. doi:10.1007/s11187-005-6058-6.
Garnsey, Elizabeth, Erik Stam, and Paul Heffernan. 2006. “New Firm Growth: Exploring Processes and Paths.” Industry & Innovation 13 (1): 1–20. doi:10.1080/13662710500513367.
Greene, William H., and David A. Hensher. 2009. “Modeling Ordered Choice”. C.T Bauer College of Busniess. http://www.bauer.uh.edu/rsusmel/phd/OrderedChoiceSurvey.pdf.
Heckman, James J. 1979. “Sample Selection Bias as a Specification Error.” Econometrica 47 (1): 153. doi:10.2307/1912352.
Henrekson, Magnus, and Dan Johansson. 2010. “Gazelles as Job Creators: A Survey and Interpretation of the Evidence.” Small Business Economics 35 (2): 227–44. doi:10.1007/s11187-009-9172-z.
Hoffman, Anders N. 2007. “A Rough Guide to Entrepreneurship Policy.” Handbook of Entrepreneurship Policy. Cheltenham: Edward Elgar.
Ioannidou, Vasso, and Steven Ongena. 2010. “‘Time for a Change’: Loan Conditions and Bank Behavior When Firms Switch Banks.” The Journal of Finance 65 (5): 1847–77.
Jones, Andrew M. 2007. Applied Econometrics for Health Economists: A Practical Guide. Abingdon: Radcliffe.Kim, Moshe, Eirik Gaard Kristiansen, and Bent Vale. 2012. “Life-Cycle Patterns of Interest-Rate Mark-Ups in
Small-Firm Finance*: Life-Cycle Patterns of Interest-Rate Mark-Ups in Small-Firm Finance.” The Scandinavian Journal of Economics 114 (2): 629–57. doi:10.1111/j.1467-9442.2011.01688.x.
Lee, Neil. 2013. “What Holds Back High-Growth Firms? Evidence from UK SMEs.” Small Business Economics, 1–13.
Lee, Neil, Hiba Sameen, and Marc Cowling. 2014. “Access to Finance for Innovative SMEs since the Financial Crisis.” In CBS, Copenhagen.
Levenson, Alec, and Kristen Willard. 2000. “Do Firms Get the Financing They Want? Measuring Credit Rationing Experienced by Small Businesses in the U.S.” Small Business Economics 14 (2): 83–94.
Mason, Colin, and Ross Brown. 2011. “Creating Good Public Policy to Support High-Growth Firms.” Small Business Economics 40 (2): 211–25. doi:10.1007/s11187-011-9369-9.
Mason, Colin, and Jennifer Kwok. 2010. “Investment Readiness Programmes and Access to Finance: A Critical Review of Design Issues.” Local Economy 25 (4): 269–92.
Mason, Colin M., and Richard T. Harrison. 2001. “‘Investment Readiness’: A Critique of Government Proposals to Increase the Demand for Venture Capital.” Regional Studies 35 (7): 663–68. doi:10.1080/00343400120075939.
Myers, Stewart C. 1984. “The Capital Structure Puzzle.” The Journal of Finance 39 (3): 574–92. doi:10.1111/j.1540-6261.1984.tb03646.x.
Nightingale, P., and A. Coad. 2014. “Muppets and Gazelles: Political and Methodological Biases in Entrepreneurship Research.” Industrial and Corporate Change 23 (1): 113–43. doi:10.1093/icc/dtt057.
20

Nitani, Miwako, and Allan Riding. 2013. “Growth, R&D Intensity and Commercial Lender Relationships.” Journal of Small Business & Entrepreneurship 26 (2): 109–24. doi:10.1080/08276331.2013.771852.
Organisation for Economic Co-operation and Development. 2013. Entrepreneurship at a Glance 2013. Paris: Organization for Economic Cooperation & Development. https://login.libproxy.uregina.ca:8443/login?url=http://dx.doi.org/10.1787/entrepreneur_aag-2013-en.
Parker, Simon, C. 2002. “DO BANKS RATION CREDIT TO NEW ENTERPRISES? AND SHOULD GOVERNMENT INTERVENE?” Scottish Journal of Political Economics 49 (2): 162–94.
Peterson, Mitchel, and Raghuram Rajan. 1994. “The Benefits of Lending Relationships: Evidence from Small Business Data.” THE JOURNAL OF FINANCE XLIX (1): 3–37.
Rahaman, Mohammad M. 2011. “Access to Financing and Firm Growth.” Journal of Banking & Finance 35 (3): 709–23. doi:10.1016/j.jbankfin.2010.09.005.
Rice, Tara, and Philip E. Strahan. 2010. “Does Credit Competition Affect Small-Firm Finance?” The Journal of Finance 65 (3): 861–89. doi:10.1111/j.1540-6261.2010.01555.x.
Riding, A. L. 1998. “On the Care and Nature of Loan Guarantee Programs.” Le Financement de La Croissance Au Canada.
Riding, Allan, Judith Madill, and George Haines. 2007. “Incrementality of SME Loan Guarantees.” Small Business Economics 29 (1-2): 47–61. doi:10.1007/s11187-005-4411-4.
Riding, Allan, Barbara J. Orser, Martine Spence, and Brad Belanger. 2012. “Financing New Venture Exporters.” Small Business Economics 38 (2): 147–63. doi:10.1007/s11187-009-9259-6.
Robb, Alicia M., and David T. Robinson. 2014. “The Capital Structure Decisions of New Firms.” Review of Financial Studies 27 (1): 153–79.
Shane, Scott. 2009. “Why Encouraging More People to Become Entrepreneurs Is Bad Public Policy.” Small Business Economics 33 (2): 141–49. doi:10.1007/s11187-009-9215-5.
Sharpe, Steven A. 1990. “Asymmetric Information, Bank Lending, and Implicit Contracts: A Stylized Model of Customer Relationships.” The Journal of Finance 45 (4): 1069–87.
Smallbone, David, Roger Leig, and David North. 1995. “The Characteristics and Strategies of High Growth SMEs.” International Journal of Entrepreneurial Behaviour & Research 1 (3): 44–62.
Stam, Erik, Kashifa Suddle, Jolanda Hessels, and Andre J Van Stel. 2007. “High Growth Entrepreneurs, Public Policies and Economic Growth”. Jena economic research papers. http://www.econstor.eu/handle/10419/25593.
Stiglitz, J., and A. Weiss. 1981. “Credit Rationing in Markets with Imperfect Information.” The American Economic Review 71 (3): 393–410.
Storey, David John. 1998. The Ten Percenters: Fourth Report: Fast Growing SMEs in Great Britain. Deloitte & Touche.
Strahan, Philip E. 1999. “Borrower Risk and the Price and Nonprice Terms of Bank Loans.” FRB of New York Staff, no. 30 (October). doi:10.2139/ssrn.192769.
Vickery, James. 2008. “How and Why Do Small Firms Manage Interest Rate Risk?” Journal of Financial Economics 87 (2): 446–70.
Vos, Ed, Andy Jia-Yuh Yeh, Sara Carter, and Stephen Tagg. 2007. “The Happy Story of Small Business Financing.” Journal of Banking & Finance 31 (9): 2648–72. doi:10.1016/j.jbankfin.2006.09.011.
Wiklund, Johan, and Dean Shepherd. 2005. “Entrepreneurial Orientation and Small Business Performance: A Configurational Approach.” Journal of Business Venturing 20 (1): 71–91. doi:10.1016/j.jbusvent.2004.01.001.
Zecchini, Salvatore, and Marco Ventura. 2009. “The Impact of Public Guarantees on Credit to SMEs.” Small Business Economics 32 (2): 191–206.
21

Figures and tables:
0.00-2.00%; 57.14%
2.01-4.00%; 33.20%
4.01-6.00%; 3.09%6.01-8.00%; 6.18%
8.01-10.00%; 0.39%
Chart Title
Figure1- Frequency of premium rates in the sub-sample of firms using loan and mortgages with variable interest rate.
A. Freq Percent Cum. B. Mean Std. Dev
Sector Business older than 10 years 65%Agriculture etc. 21 8.11 8.11 Age of the owner (years) 50.88 10.36Manufacturing 20 7.72 15.83 Male ownership 82%Construction 30 11.58 27.41 Purchased asset with loan 53%
Wholesale/Retail 32 12.36 39.77More than three years relationship with bank 77%
Service sectors 156 60.23 100 Collateral 76% Size0 employee 16 6.18 6.18 Super growth 17%1-9 employees 66 25.48 31.66 Past growth 19%10-49 employees 105 40.54 72.2 Growth intention 71%50-249 employees 72 27.8 100 New Market 25% Loan provider New Product 31%Only main bank 168 64.86 64.86 More sale 55%Main bank one of the provider 57 22.01 86.87 More employees 34%Main bank not a provider 34 13.13 100Number of sources of finance used A
0 12 4.63 4.631 34 13.13 17.762 78 30.12 47.883 80 30.89 78.764 45 17.37 96.145 10 3.86 100
A. Including leasing, loan from owner, loan from family and friends, credit cards, and overdraftTable 1- Frequency table of the characteristics of firms, owners, and loan for firms using loan and mortgages with variable rate.
22

Variables VIFa VIFbVariables VIFa VIFb
Age of the owner 1.40 1.45 Relationship with bank (>3years =1) 1.20 1.19Male Ownership 1.23 1.35 Collateral (yes=1) 1.13 1.19Sector-Ref: Agriculture Count of financial resource c - Ref :0 Manufacturing 1.98 2.12 1 type 3.77 4.35 Construction 2.42 2.59 2 types 6.07 7.87 Wholesale/Retail 2.40 2.51 3 types 6.09 7.93 Service sectors 3.61 3.77 4 types 4.36 5.61Size-Ref: zero 5 types 2.02 2.48 1-9 employees 4.59 5.87 past growth 4.98 6.49 10-49 employees 5.90 8.38 Future growth 2.54 2.64 50-249 employees 5.40 8.68 Super growth 5.81 7.05Business older than 10 years 1.55 1.77 New Market 1.48 1.46Asset Purchased with loan 1.15 1.21 New product 1.64 1.58Loan provider- Ref: only main bank More sale 1.80 1.79main bank one of the provider 1.17 1.22 More employees 1.79 1.85Main bank not a provider 1.20 1.27 IMR -- 1.71a.Matrix of variables excluding IMR, b. Matrix of variables including IMR, c. use of credit card, overdraft, leasing, loan from the owner, and loan family and friends
Table 2- Variance Inflation Factor
23

Base Model Past Growth Future Growth Super Growth Modes of Growth One stage models Coef. Std. Err. Coef. Std. Err. Coef. Std. Err. Coef. Std. Err. Coef. Std. Err.Age of the owner 0.0158* 0.008 0.0205** 0.009 0.0162* 0.008 0.0235** 0.009 0.0121 0.009Male Ownership -0.162 0.219 -0.192 0.220 -0.171 0.220 -0.338 0.240 -0.186 0.220Sector-Ref: AgricultureManufacturing 0.674 0.414 0.682 0.416 0.671 0.414 0.699 0.445 0.764* 0.425Construction 0.526 0.395 0.504 0.396 0.519 0.395 0.44 0.409 0.65 0.413Wholesale/Retail 0.389 0.383 0.34 0.385 0.394 0.383 0.291 0.391 0.413 0.387Service sectors 0.108 0.333 0.0657 0.335 0.108 0.333 0.0936 0.341 0.118 0.335Size-Ref: zero1-9 -0.0831 0.350 -0.0595 0.350 -0.0808 0.350 -0.0742 0.392 -0.00772 0.35610-49 -0.714** 0.357 -0.721** 0.357 -0.710** 0.357 -0.703* 0.398 -0.648* 0.36950-249 -0.776** 0.377 -0.809** 0.378 -0.784** 0.378 -0.772* 0.411 -0.798** 0.393Business older than 10 years -0.346* 0.206 -0.281 0.210 -0.334 0.209 -0.18 0.235 -0.316 0.213Asset Purchased with loan -0.432** 0.172 -0.433** 0.172 -0.425** 0.173 -0.404** 0.184 -0.475*** 0.176Loan provider-Ref: only main bankmain bank one of the provider -0.342 0.213 -0.402* 0.218 -0.342 0.214 -0.393* 0.224 -0.302 0.218Main bank not a provider -0.0392 0.259 -0.0102 0.260 -0.032 0.260 -0.065 0.293 -0.0366 0.267Relationship with bank (>3years =1) -0.2 0.210 -0.226 0.211 -0.191 0.212 -0.323 0.238 -0.207 0.213Collateral (yes=1) -0.540*** 0.185 -0.513*** 0.186 -0.541*** 0.186 -0.425** 0.199 -0.498*** 0.189Sources of finance A- Ref:01 types 0.683 0.452 0.737 0.453 0.691 0.453 0.848* 0.507 0.623 0.4562 types 0.375 0.416 0.383 0.416 0.385 0.417 0.487 0.468 0.368 0.4193 types 0.637 0.427 0.627 0.427 0.636 0.427 0.775 0.482 0.615 0.4314 types 0.633 0.435 0.635 0.434 0.629 0.435 0.597 0.498 0.568 0.4405 types 0.017 0.617 -0.16 0.633 0.00391 0.620 -0.0449 0.677 -0.0165 0.632past growth 0.420* 0.219Future growth 0.0449 0.128Super growth 0.496* 0.261New Market -0.0117 0.221New product 0.504** 0.216more sale -0.389** 0.192More employees 0.0358 0.212/cut1 -0.763 0.828 -0.336 0.860 -0.667 0.872 0.0943 0.990 -0.878 0.852/cut2 0.55 0.828 0.99 0.862 0.646 0.872 1.378 0.994 0.478 0.850Number of observation 230 230 230 206 230Prob > chi2 0.0004 0.0002 .0006 0.0058 0.0002Pseudo R2 .1131 .1216 .1133 .1085 .1315Dependent variable is contracted premium rate on variable rate loans (1=0 to 2%, 2=2% to 4%, 3=More than 4%)*** p<0.01, ** p<0.05, * p<0.1
Table 3- Results of one-stage Ordered Probit Model
24
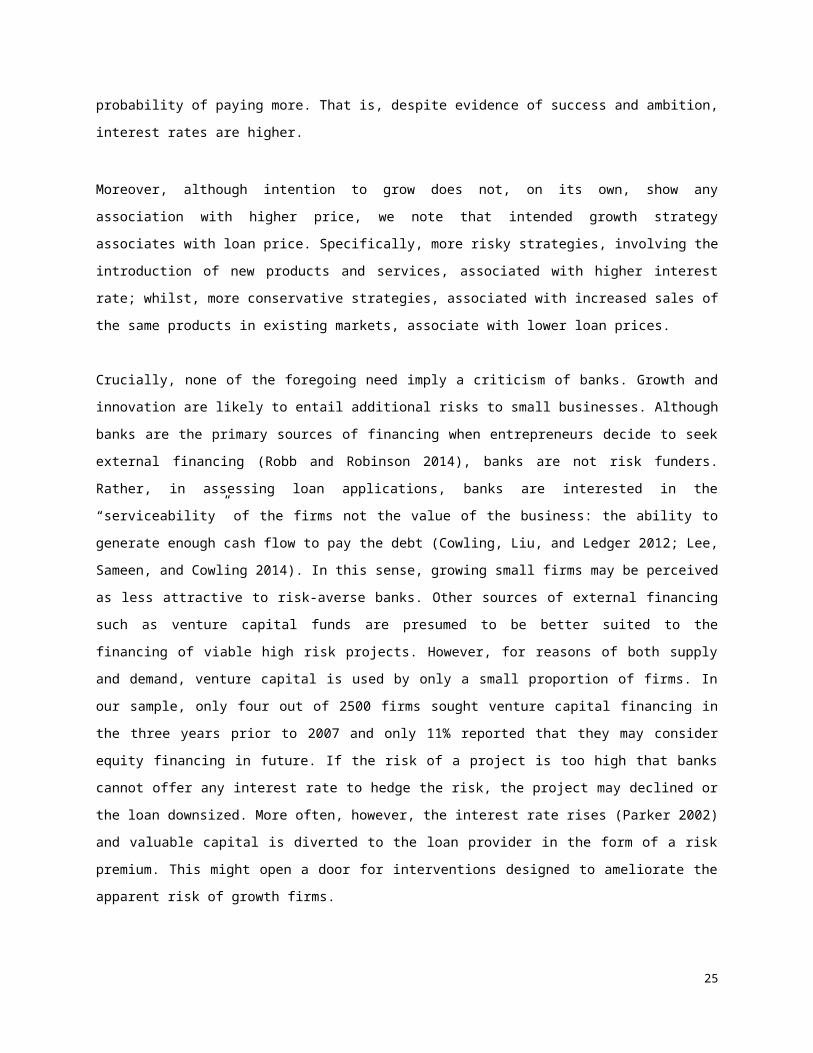
Base Model Past Growth Future Growth Super Growth Modes of Growth Two stage models Coef. Std. Err. Coef. Std. Err. Coef. Std. Err. Coef. Std. Err. Coef. Std. Err.Age of the owner 0.0175* 0.009 0.0231** 0.010 0.0185** 0.009 0.0292*** 0.010 0.0138 0.009Male Ownership -0.115 0.240 -0.15 0.242 -0.148 0.243 -0.349 0.271 -0.149 0.242Sector-Ref: AgricultureManufacturing 0.626 0.444 0.632 0.446 0.624 0.443 0.619 0.470 0.698 0.450Construction 0.369 0.430 0.367 0.432 0.344 0.429 0.3 0.441 0.522 0.441Wholesale/Retail 0.108 0.425 0.0697 0.426 0.119 0.424 0.0662 0.433 0.0882 0.425Service sectors 0.0937 0.362 0.0608 0.363 0.0862 0.361 0.0368 0.369 0.0887 0.359Size-Ref: zero1-9 0.462 0.420 0.506 0.421 0.474 0.422 0.331 0.473 0.59 0.43110-49 -0.102 0.442 -0.109 0.444 -0.0965 0.444 -0.232 0.501 0.0351 0.46550-249 -0.00638 0.488 -0.0495 0.490 -0.0195 0.489 -0.177 0.541 0.0396 0.511Business older than 10 years -0.465* 0.241 -0.373 0.246 -0.420* 0.247 -0.311 0.269 -0.441* 0.251Asset Purchased with loan -0.395** 0.190 -0.394** 0.192 -0.374* 0.192 -0.426** 0.204 -0.430** 0.195Loan provider-Ref: only main bankmain bank one of the provider -0.471** 0.230 -0.555** 0.236 -0.478** 0.231 -0.552** 0.239 -0.454* 0.235Main bank not a provider -0.149 0.280 -0.132 0.280 -0.121 0.282 -0.302 0.324 -0.115 0.290Relationship with bank (>3years =1) -0.138 0.230 -0.171 0.231 -0.118 0.232 -0.282 0.258 -0.16 0.234Collateral (yes=1) -0.415** 0.200 -0.377* 0.201 -0.424** 0.200 -0.316 0.211 -0.363* 0.203Sources of finance A- Ref:01 types 0.716 0.508 0.739 0.508 0.754 0.510 1.002* 0.570 0.671 0.5142 types 0.259 0.464 0.239 0.464 0.293 0.466 0.393 0.519 0.245 0.4703 types 0.545 0.481 0.515 0.481 0.546 0.481 0.675 0.538 0.515 0.4864 types 0.447 0.479 0.407 0.479 0.443 0.479 0.318 0.548 0.377 0.4865 types -0.143 0.646 -0.369 0.664 -0.169 0.651 -0.266 0.716 -0.173 0.663
past growth 0.499** 0.243
Future growth 0.121 0.141
Super growth 0.646** 0.275
New Market -0.0482 0.228
New product 0.603*** 0.225
more sale -0.25 0.206
More employees -0.0164 0.232IMR 0.955** 0.417 0.888** 0.421 0.983** 0.418 0.71 0.444 1.031** 0.422/cut1 0.58 1.041 1.041 1.070 0.901 1.108 1.079 1.195 0.647 1.072/cut2 1.905* 1.048 2.385** 1.079 2.226** 1.114 2.408** 1.204 2.018* 1.078Number of observation 201 201 201 182 201Prob > chi2 0.0024 0.0010 0.0029 0.0054 0.0012Pseudo R2 .1168 .1280 .1188 .1267 .1381Dependent variable is contracted premium rate on variable rate loans (1=0 to 2%, 2=2% to 4%, 3=More than 4%)
25

*** p<0.01, ** p<0.05, * p<0.1Table4- Result of second-stage Ordered Probit model
26


![eprints.lancs.ac.ukeprints.lancs.ac.uk/...the_Power_of_Images...2015.docx · Web viewI am grateful to Ismail Kadare for drawing my attention to this [67].. Both groups were anti-fascist](https://static.fdocuments.us/doc/165x107/5a70b6707f8b9a93538c479d/eprintslancsacukeprintslancsacukthepowerofimages2015docxdoc.jpg)


