hvchbs.zeitgenossen.ch viewChoosing a Tesla Coil Pulse Discharge Capacitor. ... high voltage...
15
Choosing a Tesla Coil Pulse Discharge Capacitor It’s not exactly a trivial task, evaluating/choosing a long-living, reliable and well behaving capacitor for a TC. Problem is high pps, high voltage reversal and relatively low control about exceptions vs. the nominal operating conditions. In what follows is an attempt to present data for a TC, which is working …with too weak a capacitor: The evaluation is based on Pspice simulations (by Microsim 9), and experience with the real TC. The Pspice simulation schematic is the following: 1
Transcript of hvchbs.zeitgenossen.ch viewChoosing a Tesla Coil Pulse Discharge Capacitor. ... high voltage...

Choosing a Tesla Coil Pulse Discharge Capacitor
It’s not exactly a trivial task, evaluating/choosing a long-living, reliable and well behaving capacitor for a TC. Problem is high pps, high voltage reversal and relatively low control about exceptions vs. the nominal operating conditions. In what follows is an attempt to present data for a TC, which is working …with too weak a capacitor:
The evaluation is based on Pspice simulations (by Microsim 9), and experience with the real TC.The Pspice simulation schematic is the following:
1

The relevant, 100s wide window, “zooms” of simulation-results for capacitor sizing are:
1st Discharge, during a 50Hz halfcycle.
2nd Discharge, during a 50Hz halfcycle.
The 2 graphs look essentially the same, with accidental small deviations. However there is a different charging voltage run of the curve in the 2nd vs. the 1st discharge. This will be discussed below.
Based on the results from these graphs, an evaluation of cap live vs. voltage & voltage reversal was performed in an Excel 10 spreadsheet, which is a “dynamic” form of Jim Lux's HV-Experimenters Handbook explanations.
Please <ctrl+click> the following link, in order to see (or yourself trying) the Excel-calculations: CapLive.xlsx(The Excel document is assumed to reside in the same folder as this Word-document)
2

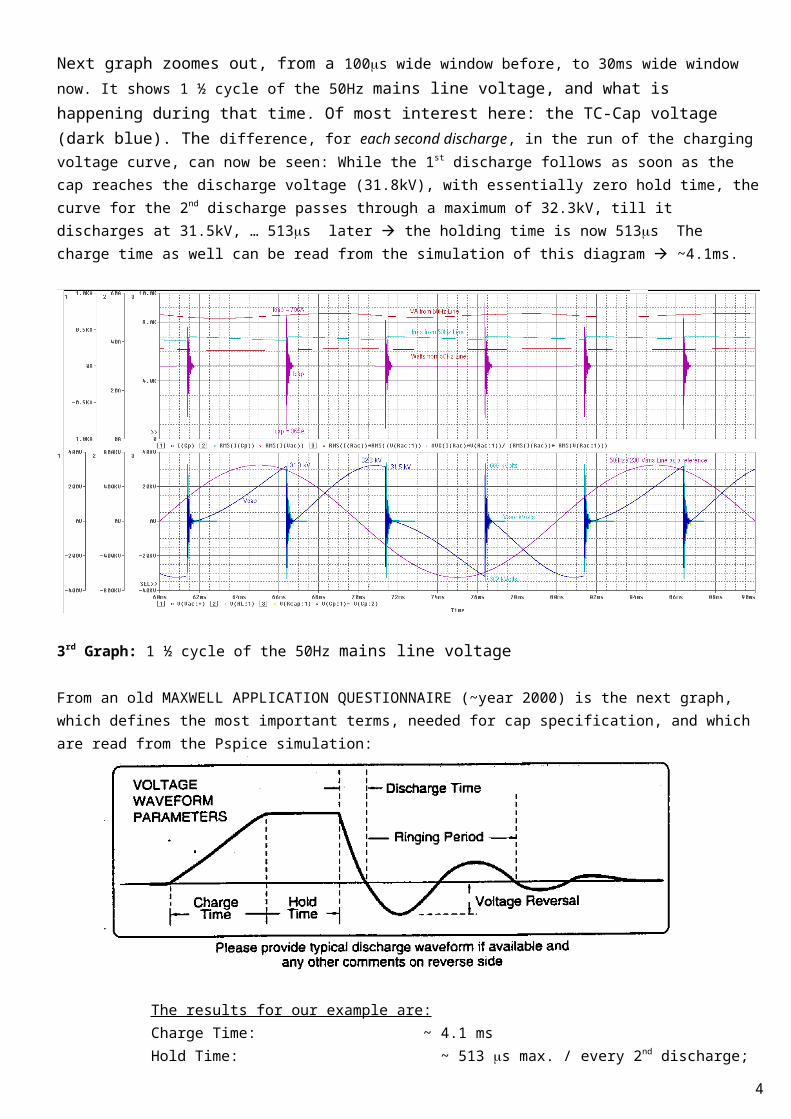
Next graph zoomes out, from a 100s wide window before, to 30ms wide window now. It shows 1 ½ cycle of the 50Hz mains line voltage, and what is happening during that time. Of most interest here: the TC-Cap voltage (dark blue). The difference, for each second discharge, in the run of the charging voltage curve, can now be seen: While the 1st discharge follows as soon as the cap reaches the discharge voltage (31.8kV), with essentially zero hold time, the curve for the 2nd discharge passes through a maximum of 32.3kV, till it discharges at 31.5kV, … 513s later the holding time is now 513s The charge time as well can be read from the simulation of this diagram ~4.1ms.
3rd Graph: 1 ½ cycle of the 50Hz mains line voltage
From an old MAXWELL APPLICATION QUESTIONNAIRE (~year 2000) is the next graph, which defines the most important terms, needed for cap specification, and which are read from the Pspice simulation:
The results for our example are:Charge Time: ~ 4.1 msHold Time: ~ 513 s max. / every 2nd discharge; 1st is near zero, see 3rd graphDischarge Time: ~ 3.22 sRinging Period: ~ 13 s however the TC ringing continues, up to ~350 sVoltage at Discharge: ~ 32 kV this is not shown in the diagram above.Voltage Reversal: ~ 27 kV 84% but 88/90% assumed in my other calculations
The data estimated above, where used to fill a General Atomics Capacitor Feedback Questionnaire:
3
Capacitor FeedbackQuestionnaire
You may fill out this form to request an engineering evaluation and receive a quote for General Atomics Energy Products capacitors to fill your need. Provide as much of the requested information as you can and then click the “Send” button below to e-mail the form to our application engineers. You will receive a prompt response.
Please give us the following contact information:Your Name Kurt SchranerTitle BSEECompany Name None (private; hobbyist)Address Spalentorweg 52City BaselState/Province Kanton BSCountry SwitzerlandZip/Postal Code CH-4051Daytime Phone +41 (61) 271 92 78FAX noneEmail Address [email protected]
Briefly describe your application: Well, it’s only a Tesla Coil, which is performing well with
a 55nF Aerovox Cap, but the Cap is overstrained by the present situation. BTW: I have no connections to government or military app’s regarding this subject.
Capacitance (+/-10%): 60nF
Operating Voltage: 32kV
Rated Voltage: 80kV
Voltage Reversal (Normal): 0.88
Voltage Reversal (Fault): 0.90 ?
Peak Current (Normal): 895A
Peak Current (Fault): ~1kA ?
RMS Current: 42A
Repetition Rate: 200/sec
Design Life:
(@ 90% Relliability) ~1500 hrs
Charge/Discharge Cycles 8.0E7
Duty Cycle:
Continuous or Burst Mode (on/off time) ~0.5/5 ms
Discharge Time: 3.3us
Inductance Maximum: 20nH; < 100
Ringing Frequency: ~76kHz
Charge Time: 4.1msec
Hold Time:
(At full charge) 513us max.
Operating Temperature Range: 25-40C
Storage Temperature Range: 10-30C
Case Style (Plastic, Welded, Drawn): Plastic
Case Size: L<~700mm
Terminal Configuration: ? free
Brackets: ? free
4

Prototype Quantity: ? 1
Production Quantity: 1 or 2 ?
Case Size/Style/Bushings/Brackets (limitations & requirements) Too long a Cap > 700mm might pose a problem. One
sided Bushings and Brackets: welcome! But not a necessity.
Comments?“Think”, Part Number 37336 would fit the conditions perfectly.
5

Additional Graphs and InformationThe complete ringing process of one discharge is shown in the next graph. Time range is 400 s
4rd Graph: nearly complete ringing of a coupled double resonant circuit TC capacitor discharge. ... the extended ringing time, within these kind of systems, is obvious: it’s about 350 s, in our case.
It needs to be mentioned: all simulations above are performed, assuming the hypothetical situation, no sparks would break out at the top-terminal of the TC. However, this would happen: they would break out. Sparks draw energy out of the system, and the decline of the ringing would be faster, and more dramatic. This would also affect voltage reversal , toward a lower value.
In the 5th graph, shown next , we have an overview of the whole 100 ms of simulation time (the first 5 cycles of the 50Hz Line feed). The lower frequency startup transient can be seen, and the run is continued till the RMS-current, apparent- and real- power and power-factor traces attain fairly stable values (numerical values of those have been written into the 1st and 2nd discharge diagrams above).
5th Graph: complete simulation with startup transient.
6

Finally the Fast Fourier Transform (FFT-) capability of the Microsim 9 Pspice simulator is used, in order to have a look at some of the traces in frequency domain. Next graph shows the FFT-spectra of the TC’s top terminal / secondary voltage (cyan) and the current trough the primary capacitor (violett):
6th Graph (linear x-axis): the frequencies marked show that the simulated TC is tuned to a little too high a frequency (~80kHz) vs. the measured frequency (76kHz outdoors; 74kHz indoors) of the real coil. (I assumed the difference would not have a decisive influence to this capacitor sizing, in order to justify a complete retuned simulation and capturing / reworking the graphs again) .
The next FFT-graph, with log frequency axis, is presented, essentially to have a look at the lower frequency content:
7th Graph (log x-axis): of main interest is the dominant lower f content of the primary cap voltage (dark blue). This, however, is to be expected, if we consider the (time domain) 3 rd Graph on page 3 in this text.
7

In order to demonstrate, the waveforms in the simulation can be verified in real life, we present 2 scope shots, which were taken on the TC in question, by Dr.Ing ETH Martin Damev and Andreas Saile, who did the startup and troubleshooting of the TC, powerfully supported by TC owner Fritz Egli. Tools were a resistive voltage divider and a TEK storage scope.
Martin Damev comments the above diagrams:
…“ Bilder und Oszillogramme von unserer Messung. Zu den Oszillogrammen (BMP-Dateien) möchte ich noch erwähnen, dass ein grosses Häuschen (Div) auf der y-Achse einer Spannung von 4350V entspricht. Die Kondensator-Ladespannung beträgt also etwa 13 kVp vor jeder Zündung.“
The only 13kV cap voltage at discharge time and the waveforms of the scope shots need further comment:
By the time of measurement an 80nF cap was residing in the TC
The cap could not be charged to higher voltage, because the power of the HV supply was not sufficient(meaning, the current controlling inductor was not set to too low an inductance this would have been a too severe stress on the HV supply)
The TC in the whole was not yet optimally tuned.
The scope shots do not show higher frequency components, due to the f-response of the resistive divider.(divider essentially for low f-AC, with a limit max. a few kHz, i.e. < 4kHz)
The synchronous rotary spark gap was tuned optimally for 2 equal discharges per 50 Hz AC half-cycle,for the rest of the situation “as is”.
Since April 13th 2012 ( Friday 13th !), the TC is tuned well and running with a 55nF / 50kV Aerovox cap very satisfactory, see picture on page 1, taken from a short movie.
Kurt Schraner, April 28th 2012
8

Appendix:Summary page of my TC-Plan Excel program for the electrical design of TC’s, applied to Fritz Egli’s coil.Remark: the design calculation is not completely consistent with the simulation results above, but gives a condensed overview of the most relevant design parameters of this TC, and may be accepted as “close enough”. The topload capacitance, at first calculated by Terry Fritz’s E-Tesla (56.2pF) was corrected by adding 3.8pF, in order to fit the measured in-room resonant frequency of 74.5kHz.
9