scholar.harvard.eduscholar.harvard.edu/files/...phylogeny_in...clean.docx · Web viewAbstractThe...
30
For ODE special issue “New Animal Phylogeny”: New Animal Phylogeny: Future challenges for animal phylogeny in the age of phylogenomics Gonzalo Giribet Museum of Comparative Zoology & Department of Organismic and Evolutionary Biology, Harvard University, 26 Oxford Street, Cambridge, MA 02138, USA Email: [email protected] 1 1 2 3 4 5 6 7 8 9 10 11
Transcript of scholar.harvard.eduscholar.harvard.edu/files/...phylogeny_in...clean.docx · Web viewAbstractThe...

For ODE special issue “New Animal Phylogeny”:
New Animal Phylogeny: Future challenges for animal phylogeny in the age of phylogenomics
Gonzalo Giribet
Museum of Comparative Zoology & Department of Organismic and Evolutionary Biology, Harvard University, 26 Oxford Street, Cambridge, MA 02138, USAEmail: [email protected]
1
1
2
3
4
5
6
7
8
9
10
11
Abstract The science of phylogenetics, and specially the subfield of molecular systematics, has grown exponentially not only in the amount of publications and general interest, but especially in the amount of genetic data available. Modern phylogenomic analyses use large genomic and transcriptomic resources, yet a comprehensive molecular phylogeny of animals, including the newest types of data for all phyla, remains elusive. Future challenges need to address important issues with taxon sampling—especially for rare and small animals—, orthology assignment, algorithmic developments, data storage, and to figure out better ways to integrate information from genomes and morphology in order to place fossils more precisely in the animal tree of life. Such precise placement will also aid in providing more accurate dates to major evolutionary events during the evolution of our closest kingdom.
Keywords Genomics – Transcriptomics – Metazoan phylogeny – New animal phylogeny – Fossils – Tip dating – Total evidence dating
2
12
13
14
15
16
17
18
19
20
21
22
23
24
25
26
27

Introduction
Almost two decades have passed since the publication of what has become to be known as “The New Animal Phylogeny” (Adoutte et al. 2000; Halanych 2004)—a new set of phylum-level relationships largely driven by molecular data and mostly derived from two of the most influential papers on animal molecular phylogenetics (Halanych et al. 1995; Aguinaldo et al. 1997). These seminal studies introduced two “new” clades of animals, Lophotrochozoa (Halanych et al. 1995)—a clade unfortunately later incorrectly equated with Spiralia by subsequent authors (Laumer et al. 2015a)—and Ecdysozoa (Aguinaldo et al. 1997). These studies were based on analyses of 18S rRNA sequence data and were subsequently corroborated by a series of likewise influential papers using larger 18S rRNA data sets, additional markers, and sometimes morphology (e.g., Giribet et al. 1996; Zrzavý et al. 1998; Giribet et al. 2000; Peterson and Eernisse 2001). Few other major changes in animal phylogeny are comparable to the ones introduced by Halanych et al. (1995) and Aguinaldo et al. (1997), perhaps followed closely only by another major re-arrangement related to Platyhelminthes, proposing their non-monophyly and a special position for Acoela and Nemertodermatida, as sister groups to the remaining Bilateria—i.e., Nephrozoa (Carranza et al. 1997; Ruiz-Trillo et al. 1999; Jondelius et al. 2002). Much more recently, and based on first-generation phylogenomic analyses, Dunn et al. (2008) shook the animal tree once more by placing Ctenophora as the sister group to all other animals, contradicting prior ideas about metazoan evolution and increasing complexity at the base of the tree. However, this result remains contentious (e.g., Nosenko et al. 2013; Ryan et al. 2013; Moroz et al. 2014; Halanych 2015; Whelan et al. 2015), unlike the abovementioned clades: Lophotrochozoa (and the more inclusive Spiralia), Ecdysozoa and Nephrozoa, which are found almost universally in recent phylogenomic analyses (Hejnol et al. 2009; Nesnidal et al. 2010; Nesnidal et al. 2013; Struck et al. 2014; Laumer et al. 2015a). One notable exception to this consensus is a rather controversial study that claims to place Xenoturbellida and Acoelomorpha within Deuterostomia (Philippe et al. 2011).
3
28
29
30
31
32
33
34
35
36
37
38
39
40
41
42
43
44
45
46
47
48
49
50
51
52
53
54
55
56
57
58
59
60
While a consensus is emerging with respect to the relationships and composition of these major clades (Halanych 2004; Giribet 2008; Edgecombe et al. 2011; Dunn et al. 2014, a few aspects remain uncertain (see Fig. 1). These include mostly the internal relationships of Ecdysozoa, Spiralia, and Lophotrochozoa, and the base of the animal tree )—specifically, the relative position of Porifera or Ctenophora as the sister group to all remaining Metazoa, a topic that remains contentious due to data and model dependence (e.g., Pick et al. 2010; Nosenko et al. 2013; Whelan et al. 2015). In this review the progress and future challenges to reconstruct the animal tree of life are discussed.
Animal phylogenomics—or the use of large data sets to infer animal phylogenies
The term phylogenomics, which originally had a different meaning (Eisen and Fraser 2003), has become widespread and now refers to phylogenetic analyses using large amounts of genetic data. It is often associated with the use of data derived from methods that sequence blindly, as opposed to the more traditional PCR-based target sequencing (often using Sanger sequencing). The field has exploded with the generalized use of massive parallel sequencing methods (often called “next generation sequencing” or “NGS”). However, different authors give different meanings to the word phylogenomics, with some using it to refer exclusively to the use of whole-genome data to infer phylogenies (Dopazo et al. 2004), while now it is mostly used in the sense described above, yet some target gene approaches rightfully qualify as “phylogenomic” (e.g., Regier et al. 2010). The term phylotranscriptomics has also been applied (Oakley et al. 2013) to refer to phylogenetic analyses using transcriptomic data as the major source of protein-encoding genes.
For animal phylogeny, early phylogenomic approaches made use of the genomes of a few model organisms complemented with EST (Expressed Sequence Tags) sequencing using Sanger-based methods (e.g., Philippe et al. 2005; Delsuc et al. 2006; Marlétaz et al. 2006; Hausdorf et al. 2007; Philippe
4
61
62
63
64
65
66
67
68
69
70
71
72
73
74
75
76
77
78
79
80
81
82
83
84
85
86
87
88
89
90
91
92
93
94
et al. 2007; Dunn et al. 2008; Helmkampf et al. 2008; Hejnol et al. 2009; Philippe et al. 2009). These early analyses were followed by a series of papers that incorporated 454 sequence data to the previous data sets, but concentrated into animal subclades. In fact, the only attempts to evaluate animal phylogeny as a whole (including most animal phyla) are still based mostly on ESTs (Dunn et al. 2008; Hejnol et al. 2009).
The newest data sets have provided for the first time resolution at the base of Spiralia (Laumer et al. 2015a). It is now clear that Platyhelminthes do not group with the original Lophotrochozoa, but neither do they constitute the proposed clade Platyzoa (Cavalier-Smith 1998; Giribet et al. 2000). “Platyzoa” is now understood as a grade of two clades, Gnathifera and Rouphozoa, the latter constituting the sister group to Lophotrochozoa (Struck et al. 2014; Laumer et al. 2015a). The monophyly of the classical clade Lophophorata is likewise emerging in recent analyses (Nesnidal et al. 2013; Laumer et al. 2015a). However, a few aspects of spiralian phylogeny remain unresolved, such as the position of Cycliophora (Laumer et al. 2015a), a group difficult to assess molecularly as well as morphologically (e.g., Neves et al. 2009).
Major progress has also been made in the internal phylogeny of traditionally difficult phyla, like Annelida (Struck et al. 2011; Weigert et al. 2014; Andrade et al. 2015; Laumer et al. 2015a; Lemer et al. 2015), Mollusca (Kocot et al. 2011; Smith et al. 2011; Kocot et al. 2013; Zapata et al. 2014; González et al. 2015) and Platyhelminthes (Egger et al. 2015; Laumer et al. 2015b). Phylogenomics has provided the datasets that contain enough information to find resolution and support for some of the most recalcitrant clades in animal evolution. For instance, it is now well accepted that Annelida includes many taxa formerly considered different phyla or with supposed affiliations with other animal groups, such as Sipuncula, Echiura, Pogonophora and Vestimentifera, Myzostomida, or Diurodrilida (Struck et al. 2011; Kvist and Siddall 2013; Weigert et al. 2014; Andrade et al. 2015; Laumer et al. 2015a). As the costs of generating molecular sequence data decrease and the techniques for obtaining RNA and DNA become more sensitive, progress is now being made in many new directions, from the inclusion of previously impracticable small samples (e.g., Andrade et al.
5
95
96
97
98
99
100
101
102
103
104
105
106
107
108
109
110
111
112
113
114
115
116
117
118
119
120
121
122
123
124
125
126
127
128

2015; Laumer et al. 2015b) to applying phylogenomic approaches to much more recent divergences, including species problems, relationships within families, or among families, etc.
Future challenges
Resolving outstanding issues in animal phylogeny will require a concerted effort to gather genomic data from key taxa (Lopez et al. 2014), as recently done for insects (Misof et al. 2014) and birds (Zhang et al. 2014), to provide two examples. In addition, computational development of software and hardware will become more limiting than generating the genomic data per se. Storing the vast amounts of raw and processed genomic data is also emerging as a critical issue. If our goal is to provide a well-resolved animal phylogeny, several areas must thus move forward:
1. Taxon sampling
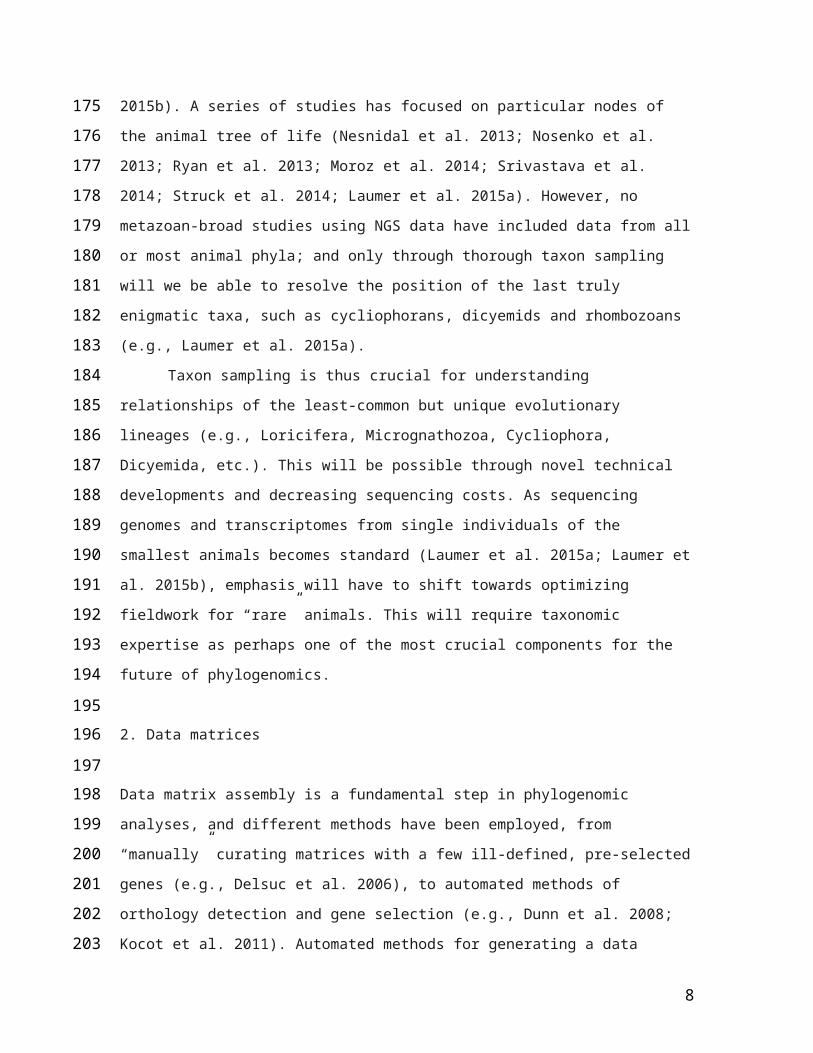
Although the first phylogenomic analyses made use of the available genomes, those studies generated little data (e.g., Philippe et al. 2005). Taxon sampling was later emphasized in subsequent EST analyses (e.g., Dunn et al. 2008; Hejnol et al. 2009), and data sets are now available for several animal phyla (e.g., Kocot et al. 2011; Smith et al. 2011; Struck et al. 2011; Kvist and Siddall 2013; Andrade et al. 2014; Cannon et al. 2014; Fernández et al. 2014; Sharma and Wheeler 2014; Telford et al. 2014; von Reumont and Wagele 2014; Weigert et al. 2014; Zapata et al. 2014; Andrade et al. 2015; Egger et al. 2015; Laumer et al. 2015b). A series of studies has focused on particular nodes of the animal tree of life (Nesnidal et al. 2013; Nosenko et al. 2013; Ryan et al. 2013; Moroz et al. 2014; Srivastava et al. 2014; Struck et al. 2014; Laumer et al. 2015a). However, no metazoan-broad studies using NGS data have included data from all or most animal phyla; and only through thorough taxon sampling will we be able to resolve the position of the last truly enigmatic taxa, such as cycliophorans, dicyemids and rhombozoans (e.g., Laumer et al. 2015a).
6
129
130
131
132
133
134
135
136
137
138
139
140
141
142
143
144
145
146
147
148
149
150
151
152
153
154
155
156
157
158
159
160
161

Taxon sampling is thus crucial for understanding relationships of the least-common but unique evolutionary lineages (e.g., Loricifera, Micrognathozoa, Cycliophora, Dicyemida, etc.). This will be possible through novel technical developments and decreasing sequencing costs. As sequencing genomes and transcriptomes from single individuals of the smallest animals becomes standard (Laumer et al. 2015a; Laumer et al. 2015b), emphasis will have to shift towards optimizing fieldwork for “rare” animals. This will require taxonomic expertise as perhaps one of the most crucial components for the future of phylogenomics.
2. Data matrices
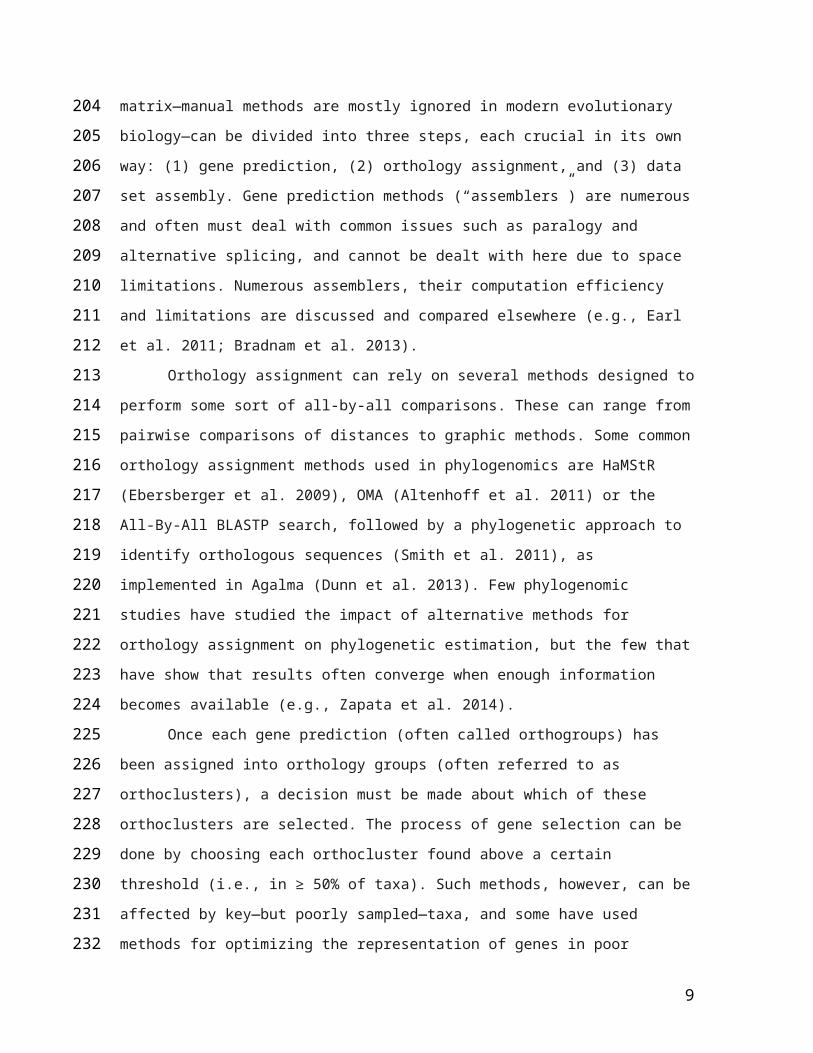
Data matrix assembly is a fundamental step in phylogenomic analyses, and different methods have been employed, from “manually” curating matrices with a few ill-defined, pre-selected genes (e.g., Delsuc et al. 2006), to automated methods of orthology detection and gene selection (e.g., Dunn et al. 2008; Kocot et al. 2011). Automated methods for generating a data matrix—manual methods are mostly ignored in modern evolutionary biology—can be divided into three steps, each crucial in its own way: (1) gene prediction, (2) orthology assignment, and (3) data set assembly. Gene prediction methods (“assemblers”) are numerous and often must deal with common issues such as paralogy and alternative splicing, and cannot be dealt with here due to space limitations. Numerous assemblers, their computation efficiency and limitations are discussed and compared elsewhere (e.g., Earl et al. 2011; Bradnam et al. 2013).
Orthology assignment can rely on several methods designed to perform some sort of all-by-all comparisons. These can range from pairwise comparisons of distances to graphic methods. Some common orthology assignment methods used in phylogenomics are HaMStR (Ebersberger et al. 2009), OMA (Altenhoff et al. 2011) or the All-By-All BLASTP search, followed by a phylogenetic approach to identify orthologous sequences (Smith et al. 2011), as implemented in Agalma (Dunn et al. 2013). Few phylogenomic studies have studied the impact of alternative methods for orthology assignment on phylogenetic estimation, but the few that have show that
7
162
163
164
165
166
167
168
169
170
171
172
173
174
175
176
177
178
179
180
181
182
183
184
185
186
187
188
189
190
191
192
193
194
195
results often converge when enough information becomes available (e.g., Zapata et al. 2014).
Once each gene prediction (often called orthogroups) has been assigned into orthology groups (often referred to as orthoclusters), a decision must be made about which of these orthoclusters are selected. The process of gene selection can be done by choosing each orthocluster found above a certain threshold (i.e., in ≥ 50% of taxa). Such methods, however, can be affected by key—but poorly sampled—taxa, and some have used methods for optimizing the representation of genes in poor libraries (Laumer et al. 2015b). In addition to these criteria based on percentage of occupancy allowed into the final matrix (Hejnol et al. 2009), criteria based on data properties have been used for designing the final data set. One such approach is BaCoCa (BAse COmposition CAlculator), which combines multiple statistical approaches to identify biases in aligned sequence data (Kück and Struck 2014). Others have used methods to select sets of genes with different evolutionary rates (Fernández et al. 2014), added bins of genes with increasing evolutionary rates (Sharma and Wheeler 2014), or used measures such as phylogenetic informativeness to select sets of genes (López-Giráldez et al. 2013). Each of these strategies may drive results according to the properties of the selected sets of genes.
3. Algorithmic developments
Algorithmic developments are obviously important in phylogenomic analyses, and these may apply to any step of the phylogenetic analysis. An interesting study actually quantified the computational effort invested in the different steps leading to a phylogenomic analysis, from transcriptome assembly to phylogenetic tree inference (Dunn et al. 2013). Critical resources are memory and number of CPUs (or time), which scale in different ways at the different steps. For example, assembly requires large amounts of memory, while other processes may require more CPU time. Algorithmic developments in all the areas described above are therefore welcome in phylogenomic analyses.
Two areas of desired improvement are the all-by-all comparisons for orthology assignment, and phylogenetic analyses using complex probabilistic
8
196
197
198
199
200
201
202
203
204
205
206
207
208
209
210
211
212
213
214
215
216
217
218
219
220
221
222
223
224
225
226
227
228
229
models. A commonly used implementation of the CAT-GTR model of evolution, PhyloBayes MPI, which implements infinite mixture models of across site variation of the substitution process (Lartillot et al. 2013), often does not converge on large data sets (e.g., Fernández et al. 2014). In fact, increased complexity in evolutionary models, often required for dealing with heterogeneous genomic and phylogenomic datasets, comes at a high computational cost. Faster and more efficient algorithms thus need to be developed to cope with the ever-increasing size of datasets (Stamatakis 2014a, 2014b). For phylogenetic inference, fast and accurate methods, like parsimony, may be able to provide a quick tree hypothesis without the burden of other methods (Kvist and Siddall 2013), but parsimony software needs to incorporate realistic amino acid transition matrices before they can be generally applied to large phylogenomic analyses.
4. Data storage
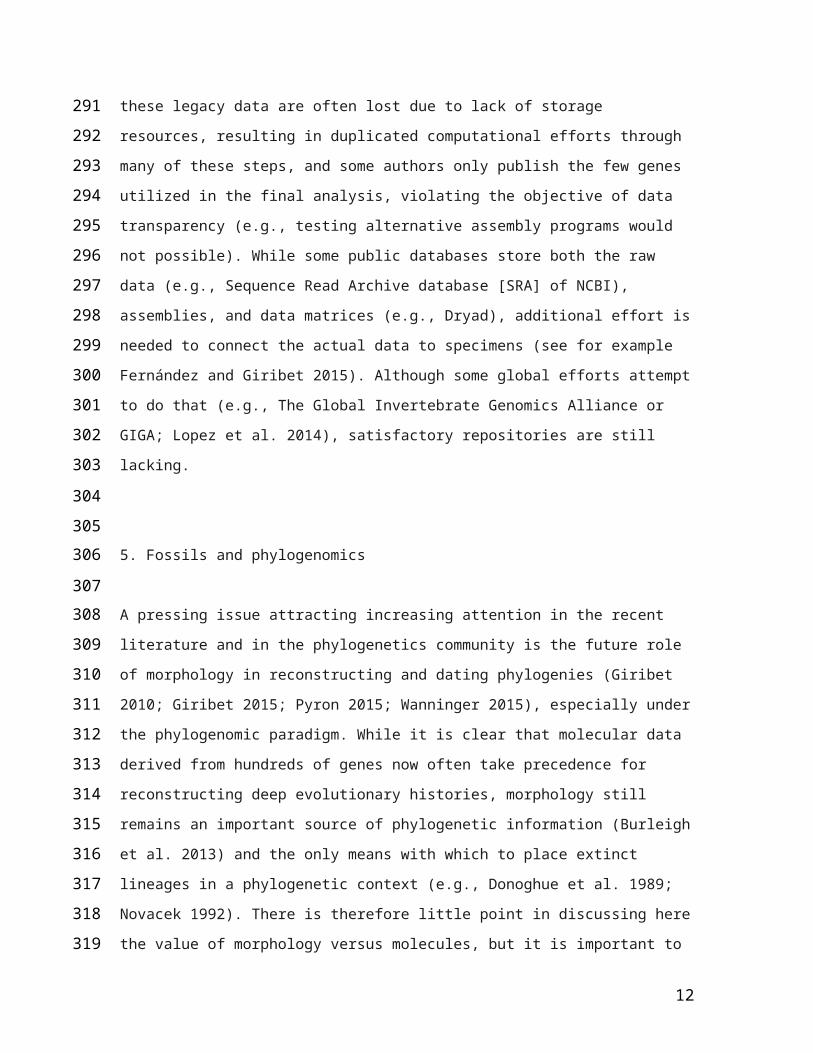
The amounts of data generated for phylogenetic analyses have grown exponentially in the past few years, to the point of being now considered part of the “Big Data science”, and these are just going to get much bigger (Stephens et al. 2015). Although the genes utilized in each analysis per each terminal may only be in the range of a few hundreds or thousands, the raw data generated and all intermediate steps after sanitation, assembly, translation to amino acids, and orthogroup assignment, as well as tracking all connections between these steps, are orders of magnitude larger and require huge storage requirements. Some of these legacy data are often lost due to lack of storage resources, resulting in duplicated computational efforts through many of these steps, and some authors only publish the few genes utilized in the final analysis, violating the objective of data transparency (e.g., testing alternative assembly programs would not possible). While some public databases store both the raw data (e.g., Sequence Read Archive database [SRA] of NCBI), assemblies, and data matrices (e.g., Dryad), additional effort is needed to connect the actual data to specimens (see for example Fernández and Giribet 2015). Although some global efforts attempt
9
230
231
232
233
234
235
236
237
238
239
240
241
242
243
244
245
246
247
248
249
250
251
252
253
254
255
256
257
258
259
260
261
262

to do that (e.g., The Global Invertebrate Genomics Alliance or GIGA; Lopez et al. 2014), satisfactory repositories are still lacking.
5. Fossils and phylogenomics
A pressing issue attracting increasing attention in the recent literature and in the phylogenetics community is the future role of morphology in reconstructing and dating phylogenies (Giribet 2010; Giribet 2015; Pyron 2015; Wanninger 2015), especially under the phylogenomic paradigm. While it is clear that molecular data derived from hundreds of genes now often take precedence for reconstructing deep evolutionary histories, morphology still remains an important source of phylogenetic information (Burleigh et al. 2013) and the only means with which to place extinct lineages in a phylogenetic context (e.g., Donoghue et al. 1989; Novacek 1992). There is therefore little point in discussing here the value of morphology versus molecules, but it is important to stress that placement of fossils remains an important scientific enterprise, and that their precise placement can have important downstream implications for attempting to use molecular data to date evolutionary events (Parham et al. 2012).
Room for error in placement of fossils is generally much higher when fossils are assigned to nodes, and thus, an alternative using fossils as terminals in a combined analysis of molecules and morphology is now back in fashion (Murienne et al. 2010; Pyron 2011; Wood et al. 2013; Garwood et al. 2014; Sharma and Giribet 2014; Arcila et al. 2015)—this is often referred to as total evidence dating or tip-dating. (Combining fossils with molecules was more common in earlier total evidence analyses of animal relationships using Sanger data (Wheeler et al. 1993; Gatesy and O'Leary 2001; Wheeler et al. 2004).) Fossils serve the dual purpose of contributing data from extinct taxa and providing more accurate estimates for dating phylogenomic trees, thus re-invigorating systematic paleontology as well as the science of morphology in general and morphological data matrices in particular (Giribet 2015; Pyron 2015).
10
263
264
265
266
267
268
269
270
271
272
273
274
275
276
277
278
279
280
281
282
283
284
285
286
287
288
289
290
291
292
293
294
295
296

Final Remarks
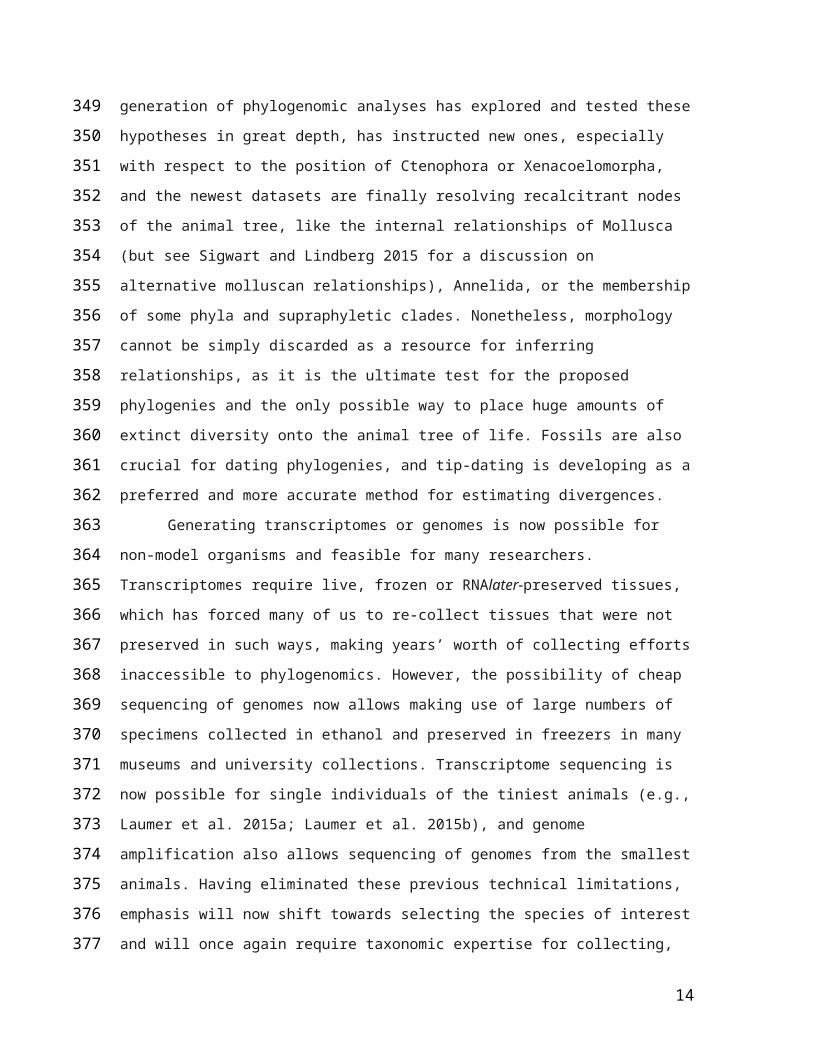
It is undisputed that molecules have taken a prominent role in reconstructing animal phylogeny and that a new consensus of animal relationships is emerging (see Fig. 1). The first generation of molecular phylogenetic analyses provided a refreshed framework for the animal tree, proposing key hypotheses such as Ecdysozoa, Spiralia and Lophotrochozoa. The current generation of phylogenomic analyses has explored and tested these hypotheses in great depth, has instructed new ones, especially with respect to the position of Ctenophora or Xenacoelomorpha, and the newest datasets are finally resolving recalcitrant nodes of the animal tree, like the internal relationships of Mollusca (but see Sigwart and Lindberg 2015 for a discussion on alternative molluscan relationships), Annelida, or the membership of some phyla and supraphyletic clades. Nonetheless, morphology cannot be simply discarded as a resource for inferring relationships, as it is the ultimate test for the proposed phylogenies and the only possible way to place huge amounts of extinct diversity onto the animal tree of life. Fossils are also crucial for dating phylogenies, and tip-dating is developing as a preferred and more accurate method for estimating divergences.
Generating transcriptomes or genomes is now possible for non-model organisms and feasible for many researchers. Transcriptomes require live, frozen or RNAlater-preserved tissues, which has forced many of us to re-collect tissues that were not preserved in such ways, making years’ worth of collecting efforts inaccessible to phylogenomics. However, the possibility of cheap sequencing of genomes now allows making use of large numbers of specimens collected in ethanol and preserved in freezers in many museums and university collections. Transcriptome sequencing is now possible for single individuals of the tiniest animals (e.g., Laumer et al. 2015a; Laumer et al. 2015b), and genome amplification also allows sequencing of genomes from the smallest animals. Having eliminated these previous technical limitations, emphasis will now shift towards selecting the species of interest and will once again require taxonomic expertise for collecting, vouchering and identifying such organisms. Genomics has largely driven our
11
297
298
299
300
301
302
303
304
305
306
307
308
309
310
311
312
313
314
315
316
317
318
319
320
321
322
323
324
325
326
327
328
329
330
understanding of animal relationships in recent times, but animal phylogeny remains the arena of zoologists, and not of just molecular biologists who rely on others for specimens and taxonomic identifications, and who may not always understand the importance of keeping vouchers and basic information about the collected specimens.
Acknowledgements Andreas Wanninger solicited this review, based on work developed during the past few years in part supported by the US National Science Foundation (Grants #0334932, #0531757, #0732903, and #1457539). Much of the work discussed here has benefited from collaboration and discussions with close colleagues, especially Casey Dunn, Greg Edgecombe, Gustavo Hormiga, Prashant Sharma, Christopher Laumer, Sónia Andrade, Rosa Fernández, Sarah Lemer, David Combosch, and Sebastian Kvist. Christine Palmer and two anonymous reviewers provided additional criticism of this review.
12
331
332
333
334
335
336
337
338
339
340
341
342
343
344
345

References
Adoutte, A., Balavoine, G., Lartillot, N., Lespinet, O., Prud'homme, B., & de Rosa, R. (2000). The new animal phylogeny: reliability and implications. Proceedings of the National Academy of Sciences of the USA, 97(9), 4453-4456.
Aguinaldo, A. M. A., Turbeville, J. M., Lindford, L. S., Rivera, M. C., Garey, J. R., Raff, R. A., et al. (1997). Evidence for a clade of nematodes, arthropods and other moulting animals. Nature, 387, 489-493.
Altenhoff, A. M., Schneider, A., Gonnet, G. H., & Dessimoz, C. (2011). OMA 2011: orthology inference among 1000 complete genomes. Nucleic Acids Research, 39, D289-D294, doi:10.1093/Nar/Gkq1238.
Andrade, S. C. S., Montenegro, H., Strand, M., Schwartz, M., Kajihara, H., Norenburg, J. L., et al. (2014). A transcriptomic approach to ribbon worm systematics (Nemertea): resolving the Pilidiophora problem. Molecular Biology and Evolution, 31(12), 3206-3215, doi:10.1093/molbev/msu253.
Andrade, S. C. S., Novo, M., Kawauchi, G. Y., Worsaae, K., Pleijel, F., Giribet, G., et al. (2015). Articulating “archiannelids”: Phylogenomics and annelid relationships, with emphasis on meiofaunal taxa. Molecular Biology and Evolution, doi:10.1093/molbev/msv157.
Arcila, D., Pyron, R. A., Tyler, J. C., Ortí, G., & Betancur-R, R. (2015). An evaluation of fossil tip-dating versus node-age calibrations in tetraodontiform fishes (Teleostei: Percomorphaceae). Molecular Phylogenetics and Evolution, 82, 131-145, doi:10.1016/j.ympev.2014.10.011.
Bradnam, K. R., Fass, J. N., Alexandrov, A., Baranay, P., Bechner, M., Birol, I., et al. (2013). Assemblathon 2: evaluating de novo methods of genome assembly in three vertebrate species. GigaScience, 2(1), 10, doi:10.1186/2047-217X-2-10.
Burleigh, J. G., Alphonse, K., Alverson, A. J., Bik, H. M., Blank, C., Cirranello, A. L., et al. (2013). Next-generation phenomics for the Tree of Life. PLoS Currents Tree of Life, 5, doi:10.1371/currents.tol.085c713acafc8711b2ff7010a4b03733.
13
346347348
349
350
351
352
353
354
355
356
357
358
359
360
361
362
363
364
365
366
367
368
369
370
371
372
373
374
375
376
377
378
379
Cannon, J. T., Kocot, K. M., Waits, D. S., Weese, D. A., Swalla, B. J., Santos, S. R., et al. (2014). Phylogenomic resolution of the hemichordate and echinoderm clade. Current Biology, 24(23), 2827-2832, doi:10.1016/j.cub.2014.10.016.
Carranza, S., Baguñà, J., & Riutort, M. (1997). Are the Platyhelminthes a monophyletic primitive group? An assessment using 18S rDNA sequences. Molecular Biology and Evolution, 14(5), 485-497.
Cavalier-Smith, T. (1998). A revised six-kingdom system of life. Biological Reviews, 73, 203-266.
Delsuc, F., Brinkmann, H., Chourrout, D., & Philippe, H. (2006). Tunicates and not cephalochordates are the closest living relatives of vertebrates. Nature, 439(7079), 965-968.
Donoghue, M. J., Doyle, J. J., Gauthier, J., Kluge, A. G., & Rowe, T. (1989). The importance of fossils in phylogeny reconstruction. Annual Review of Ecology and Systematics, 20, 431-460.
Dopazo, H., Santoyo, J., & Dopazo, J. (2004). Phylogenomics and the number of characters required for obtaining an accurate phylogeny of eukaryote model species. Bioinformatics, 20 Suppl 1, I116-I121.
Dunn, C. W., Giribet, G., Edgecombe, G. D., & Hejnol, A. (2014). Animal phylogeny and its evolutionary implications. Annual Review of Ecology, Evolution, and Systematics, 45(1), 371-395, doi:10.1146/annurev-ecolsys-120213-091627.
Dunn, C. W., Hejnol, A., Matus, D. Q., Pang, K., Browne, W. E., Smith, S. A., et al. (2008). Broad phylogenomic sampling improves resolution of the animal tree of life. Nature, 452(7188), 745-749, doi:10.1038/nature06614.
Dunn, C. W., Howison, M., & Zapata, F. (2013). Agalma: an automated phylogenomics workflow. BMC Bioinformatics, 14, 330, doi:10.1186/1471-2105-14-330.
Earl, D., Bradnam, K., St John, J., Darling, A., Lin, D. W., Fass, J., et al. (2011). Assemblathon 1: A competitive assessment of de novo short read assembly methods. Genome Research, 21(12), 2224-2241, doi:10.1101/Gr.126599.111.
14
380
381
382
383
384
385
386
387
388
389
390
391
392
393
394
395
396
397
398
399
400
401
402
403
404
405
406
407
408
409
410
411
412
Ebersberger, I., Strauss, S., & von Haeseler, A. (2009). HaMStR: Profile hidden markov model based search for orthologs in ESTs. BMC Evolutionary Biology, 9, 157, doi:10.1186/1471-2148-9-157.
Edgecombe, G. D., Giribet, G., Dunn, C. W., Hejnol, A., Kristensen, R. M., Neves, R. C., et al. (2011). Higher-level metazoan relationships: recent progress and remaining questions. Organisms, Diversity & Evolution, 11, 151-172, doi:10.1007/s13127-011-0044-4.
Egger, B., Lapraz, F., Tomiczek, B., Müller, S., Dessimoz, C., Girstmair, J., et al. (2015). A transcriptomic-phylogenomic analysis of the evolutionary relationships of flatworms. Current Biology, 25(10), 1347-1353, doi:10.1016/j.cub.2015.03.034.
Eisen, J. A., & Fraser, C. M. (2003). Phylogenomics: Intersection of evolution and genomics. Science, 300(5626), 1706-1707, doi:10.1126/science.1086292.
Fernández, R., & Giribet, G. (2015). Unnoticed in the tropics: phylogenomic resolution of the poorly known arachnid order Ricinulei (Arachnida). Royal Society Open Science, 2(6), 150065, doi:10.1098/rsos.150065.
Fernández, R., Hormiga, G., & Giribet, G. (2014). Phylogenomic analysis of spiders reveals nonmonophyly of orb weavers. Current Biology, 24(15), 1772-1777, doi:10.1016/j.cub.2014.06.035.
Garwood, R. J., Sharma, P. P., Dunlop, J. A., & Giribet, G. (2014). A new stem-group Palaeozoic harvestman revealed through integration of phylogenetics and development. Current Biology, 24, 1-7, doi:10.1016/j.cub.2014.03.039.
Gatesy, J., & O'Leary, M. A. (2001). Deciphering whale origins with molecules and fossils. TRENDS in Ecology and Evolution, 16, 562-570.
Giribet, G. (2008). Assembling the lophotrochozoan (=spiralian) tree of life. Philosophical Transactions of the Royal Society B: Biological Sciences, 363, 1513-1522.
Giribet, G. (2010). A new dimension in combining data? The use of morphology and phylogenomic data in metazoan systematics. Acta Zoologica (Stockholm), 91, 11-19, doi:10.1111/j.1463-6395.2009.00420.x.
15
413
414
415
416
417
418
419
420
421
422
423
424
425
426
427
428
429
430
431
432
433
434
435
436
437
438
439
440
441
442
443
444
445

Giribet, G. (2015). Morphology should not be forgotten in the era of genomics—a phylogenetic perspective. Zoologischer Anzeiger, 256, 96-103, doi:10.1016/j.jcz.2015.01.003.
Giribet, G., Carranza, S., Baguñà, J., Riutort, M., & Ribera, C. (1996). First molecular evidence for the existence of a Tardigrada + Arthropoda clade. Molecular Biology and Evolution, 13(1), 76-84.
Giribet, G., Distel, D. L., Polz, M., Sterrer, W., & Wheeler, W. C. (2000). Triploblastic relationships with emphasis on the acoelomates and the position of Gnathostomulida, Cycliophora, Plathelminthes, and Chaetognatha: A combined approach of 18S rDNA sequences and morphology. Systematic Biology, 49(3), 539-562.
González, V. L., Andrade, S. C. S., Bieler, R., Collins, T. M., Dunn, C. W., Mikkelsen, P. M., et al. (2015). A phylogenetic backbone for Bivalvia: an RNA-seq approach. Proceedings of the Royal Society B: Biological Sciences, 282(1801), 20142332, doi:10.1098/rspb.2014.2332.
Halanych, K. M. (2004). The new view of animal phylogeny. Annual Review of Ecology, Evolution and Systematics, 35, 229-256.
Halanych, K. M. (2015). The ctenophore lineage is older than sponges? That cannot be right! Or can it? J Exp Biol, 218(Pt 4), 592-597, doi:10.1242/jeb.111872.
Halanych, K. M., Bacheller, J. D., Aguinaldo, A. M. A., Liva, S. M., Hillis, D. M., & Lake, J. A. (1995). Evidence from 18S ribosomal DNA that the lophophorates are protostome animals. Science, 267(5204), 1641-1643.
Hausdorf, B., Helmkampf, M., Meyer, A., Witek, A., Herlyn, H., Bruchhaus, I., et al. (2007). Spiralian phylogenomics supports the resurrection of bryozoa comprising ectoprocta and entoprocta. Molecular Biology and Evolution, 24(12), 2723-2729, doi:10.1093/molbev/msm214.
Hejnol, A., Obst, M., Stamatakis, A., M., O., Rouse, G. W., Edgecombe, G. D., et al. (2009). Assessing the root of bilaterian animals with scalable phylogenomic methods. Proceedings of the Royal Society B: Biological Sciences, 276, 4261-4270, doi:10.1098/rspb.2009.0896.
Helmkampf, M., Bruchhaus, I., & Hausdorf, B. (2008). Phylogenomic analyses of lophophorates (brachiopods, phoronids and bryozoans) confirm the
16
446
447
448
449
450
451
452
453
454
455
456
457
458
459
460
461
462
463
464
465
466
467
468
469
470
471
472
473
474
475
476
477
478
479
Lophotrochozoa concept. Proceedings of the Royal Society B: Biological Sciences, 275(1645), 1927-1933, doi:10.1098/rspb.2008.0372.
Jondelius, U., Ruiz-Trillo, I., Baguñà, J., & Riutort, M. (2002). The Nemertodermatida are basal bilaterians and not members of the Platyhelminthes. Zoologica Scripta, 31, 201-215.
Kocot, K. M., Cannon, J. T., Todt, C., Citarella, M. R., Kohn, A. B., Meyer, A., et al. (2011). Phylogenomics reveals deep molluscan relationships. Nature, 447, 452-456, doi:10.1038/nature10382.
Kocot, K. M., Halanych, K. M., & Krug, P. J. (2013). Phylogenomics supports Panpulmonata: Opisthobranch paraphyly and key evolutionary steps in a major radiation of gastropod molluscs. Molecular Phylogenetics and Evolution, 69(3), 764-771, doi:10.1016/j.ympev.2013.07.001.
Kück, P., & Struck, T. H. (2014). BaCoCa – A heuristic software tool for the parallel assessment of sequence biases in hundreds of gene and taxon partitions. Molecular Phylogenetics and Evolution, 70, 94-98, doi:10.1016/j.ympev.2013.09.011.
Kvist, S., & Siddall, M. E. (2013). Phylogenomics of Annelida revisited: a cladistic approach using genome-wide expressed sequence tag data mining and examining the effects of missing data. Cladistics, 29(4), 435-448, doi:10.1111/cla.12015.
Lartillot, N., Rodrigue, N., Stubbs, D., & Richer, J. (2013). PhyloBayes MPI: Phylogenetic reconstruction with infinite mixtures of profiles in a parallel environment. Systematic Biology, 62(4), 611-615, doi:10.1093/Sysbio/Syt022.
Laumer, C. E., Bekkouche, N., Kerbl, A., Goetz, F., Neves, R. C., Sørensen, M. V., et al. (2015a). Spiralian phylogeny informs the evolution of microscopic lineages. Current Biology, 25(15), 2000-2006, doi:10.1016/j.cub.2015.06.068.
Laumer, C. E., Hejnol, A., & Giribet, G. (2015b). Nuclear genomic signals of the "microturbellarian" roots of platyhelminth evolutionary innovation. eLife, 4, e05503, doi:10.7554/eLife.05503.
Lemer, S., Kawauchi, G. Y., Andrade, S. C. S., González, V. L., Boyle, M. J., & Giribet, G. (2015). Re-evaluating the phylogeny of Sipuncula through
17
480
481
482
483
484
485
486
487
488
489
490
491
492
493
494
495
496
497
498
499
500
501
502
503
504
505
506
507
508
509
510
511
512
transcriptomics. Molecular Phylogenetics and Evolution, 83, 174-183, doi:10.1016/j.ympev.2014.10.019.
Lopez, J. V., Bracken-Grissom, H., Collins, A. G., Collins, T., Crandall, K., Distel, D., et al. (2014). The Global Invertebrate Genomics Alliance (GIGA): Developing community resources to study diverse invertebrate genomes. Journal of Heredity, 105(1), 1-18, doi:10.1093/jhered/est084.
López-Giráldez, F., Moeller, A. H., & Townsend, J. P. (2013). Evaluating phylogenetic informativeness as a predictor of phylogenetic signal for metazoan, fungal, and mammalian phylogenomic data sets. Biomed Research International, 2013, 621604, doi:10.1155/2013/621604.
Marlétaz, F., Martin, E., Perez, Y., Papillon, D., Caubit, X., Lowe, C. J., et al. (2006). Chaetognath phylogenomics: a protostome with deuterostome-like development. Current Biology, 16(15), R577-R578.
Misof, B., Liu, S., Meusemann, K., Peters, R. S., Donath, A., Mayer, C., et al. (2014). Phylogenomics resolves the timing and pattern of insect evolution. Science, 346(6210), 763-767, doi:10.1126/science.1257570.
Moroz, L. L., Kocot, K. M., Citarella, M. R., Dosung, S., Norekian, T. P., Povolotskaya, I. S., et al. (2014). The ctenophore genome and the evolutionary origins of neural systems. Nature, 510(7503), 109-114, doi:10.1038/nature13400.
Murienne, J., Edgecombe, G. D., & Giribet, G. (2010). Including secondary structure, fossils and molecular dating in the centipede tree of life. Molecular Phylogenetics and Evolution, 57, 301-313, doi:10.1016/j.ympev.2010.06.022.
Nesnidal, M. P., Helmkampf, M., Bruchhaus, I., & Hausdorf, B. (2010). Compositional heterogeneity and phylogenomic inference of metazoan relationships. Molecular Biology and Evolution, 27(9), 2095-2104, doi:10.1093/molbev/msq097.
Nesnidal, M. P., Helmkampf, M., Meyer, A., Witek, A., Bruchhaus, I., Ebersberger, I., et al. (2013). New phylogenomic data support the monophyly of Lophophorata and an Ectoproct-Phoronid clade and indicate that Polyzoa and Kryptrochozoa are caused by systematic bias. BMC Evolutionary Biology, 13, 253, doi:10.1186/1471-2148-13-253.
18
513
514
515
516
517
518
519
520
521
522
523
524
525
526
527
528
529
530
531
532
533
534
535
536
537
538
539
540
541
542
543
544
545
546

Neves, R. C., Kristensen, R. M., & Wanninger, A. (2009). Three-dimensional reconstruction of the musculature of various life cycle stages of the cycliophoran Symbion americanus. Journal of Morphology, 270(3), 257-270, doi:10.1002/jmor.10681.
Nosenko, T., Schreiber, F., Adamska, M., Adamski, M., Eitel, M., Hammel, J., et al. (2013). Deep metazoan phylogeny: When different genes tell different stories. Molecular Phylogenetics and Evolution, 67(1), 223-233, doi:10.1016/j.ympev.2013.01.010.
Novacek, M. J. (1992). Fossils as critical data for phylogeny. In M. J. Novacek, & Q. D. Wheeler (Eds.), Extinction and phylogeny (1st ed., pp. 46-88). New York: Columbia University Press.
Oakley, T. H., Wolfe, J. M., Lindgren, A. R., & Zaharoff, A. K. (2013). Phylotranscriptomics to bring the understudied into the fold: monophyletic Ostracoda, fossil placement, and pancrustacean phylogeny. Molecular Biology and Evolution, 30(1), 215-233, doi:10.1093/molbev/mss216.
Parham, J. F., Donoghue, P. C. J., Bell, C. J., Calway, T. D., Head, J. J., Holroyd, P. A., et al. (2012). Best practices for justifying fossil calibrations. Systematic Biology, 61(2), 346-359.
Peterson, K. J., & Eernisse, D. J. (2001). Animal phylogeny and the ancestry of bilaterians: inferences from morphology and 18S rDNA gene sequences. Evolution & Development, 3(3), 170-205.
Philippe, H., Brinkmann, H., Copley, R. R., Moroz, L. L., Nakano, H., Poustka, A. J., et al. (2011). Acoelomorph flatworms are deuterostomes related to Xenoturbella. Nature, 470(7333), 255-258, doi:10.1038/nature09676.
Philippe, H., Brinkmann, H., Martinez, P., Riutort, M., & Baguñà, J. (2007). Acoel flatworms are not Platyhelminthes: evidence from phylogenomics. PLoS ONE, 2, e717.
Philippe, H., Derelle, R., Lopez, P., Pick, K., Borchiellini, C., Boury-Esnault, N., et al. (2009). Phylogenomics revives traditional views on deep animal relationships. Current Biology, 19, 1-17, doi:10.1016/j.cub.2009.02.052.
Philippe, H., Lartillot, N., & Brinkmann, H. (2005). Multigene analyses of bilaterian animals corroborate the monophyly of Ecdysozoa,
19
547
548
549
550
551
552
553
554
555
556
557
558
559
560
561
562
563
564
565
566
567
568
569
570
571
572
573
574
575
576
577
578
579
580
Lophotrochozoa and Protostomia. Molecular Biology and Evolution, 22(5), 1246-1253.
Pick, K. S., Philippe, H., Schreiber, F., Erpenbeck, D., Jackson, D. J., Wrede, P., et al. (2010). Improved phylogenomic taxon sampling noticeably affects nonbilaterian relationships. Molecular Biology and Evolution, 27(9), 1983-1987, doi:10.1093/molbev/msq089.
Pyron, R. A. (2011). Divergence time estimation using fossils as terminal taxa and the origins of Lissamphibia. Systematic Biology, 60(4), 466-481.
Pyron, R. A. (2015). Post-molecular systematics and the future of phylogenetics. Trends in Ecology & Evolution, 30(7), 384-389, doi:10.1016/j.tree.2015.04.016.
Regier, J. C., Shultz, J. W., Zwick, A., Hussey, A., Ball, B., Wetzer, R., et al. (2010). Arthropod relationships revealed by phylogenomic analysis of nuclear protein-coding sequences. Nature, 463, 1079-1083, doi:10.1038/nature08742.
Ruiz-Trillo, I., Riutort, M., Littlewood, D. T. J., Herniou, E. A., & Baguñà, J. (1999). Acoel flatworms: earliest extant bilaterian Metazoans, not members of Platyhelminthes. Science, 283(5409), 1919-1923.
Ryan, J. F., Pang, K., Schnitzler, C. E., Nguyen, A. D., Moreland, R. T., Simmons, D. K., et al. (2013). The genome of the ctenophore Mnemiopsis leidyi and its implications for cell type evolution. Science, 342(6164), 1242592, doi:10.1126/science.1242592.
Sharma, P. P., & Giribet, G. (2014). A revised dated phylogeny of the arachnid order Opiliones. Frontiers in Genetics, 5, 255, doi:10.3389/fgene.2014.00255.
Sharma, P. P., & Wheeler, W. C. (2014). Cross-bracing uncalibrated nodes in molecular dating improves congruence of fossil and molecular age estimates. Frontiers in Zoology, 11(1), 57, doi:10.1186/s12983-014-0057-x.
Sigwart, J. D., & Lindberg, D. R. (2015). Consensus and confusion in molluscan trees: Evaluating morphological and molecular phylogenies. Systematic Biology, 64(3), 384-395, doi:10.5061/dryad.b4m2c.
Smith, S., Wilson, N. G., Goetz, F., Feehery, C., Andrade, S. C. S., Rouse, G. W., et al. (2011). Resolving the evolutionary relationships of molluscs
20
581
582
583
584
585
586
587
588
589
590
591
592
593
594
595
596
597
598
599
600
601
602
603
604
605
606
607
608
609
610
611
612
613
614

with phylogenomic tools. Nature, 480, 364-367, doi:10.1038/nature10526.
Srivastava, M., Mazza-Curll, Kathleen L., van Wolfswinkel, Josien C., & Reddien, Peter W. (2014). Whole-body acoel regeneration is controlled by Wnt and Bmp-Admp signaling. Current Biology, 24(10), 1107-1113, doi:10.1016/j.cub.2014.03.042.
Stamatakis, A. (2014a). ExaBayes User's Manual.Stamatakis, A. (2014b). RAxML version 8: A tool for phylogenetic analysis and
post-analysis of large phylogenies. Bioinformatics, doi:10.1093/bioinformatics/btu033.
Stephens, Z. D., Lee, S. Y., Faghri, F., Campbell, R. H., Zhai, C., Efron, M. J., et al. (2015). Big Data: Astronomical or Genomical? PLoS Biology, 13(7), e1002195, doi:10.1371/journal.pbio.1002195.
Struck, T. H., Paul, C., Hill, N., Hartmann, S., Hösel, C., Kube, M., et al. (2011). Phylogenomic analyses unravel annelid evolution. Nature, 471(7336), 95-98, doi:10.1038/nature09864.
Struck, T. H., Wey-Fabrizius, A. R., Golombek, A., Hering, L., Weigert, A., Bleidorn, C., et al. (2014). Platyzoan paraphyly based on phylogenomic data supports a non-coelomate ancestry of Spiralia. Molecular Biology and Evolution, 31(7), 1833-1849, doi:10.1093/molbev/msu143.
Telford, M. J., Lowe, C. J., Cameron, C. B., Ortega-Martinez, O., Aronowicz, J., Oliveri, P., et al. (2014). Phylogenomic analysis of echinoderm class relationships supports Asterozoa. Proceedings of the Royal Society B: Biological Sciences, 281(1786), 20140479, doi:10.1098/rspb.2014.0479.
von Reumont, B. M., & Wagele, J. W. (2014). Advances in molecular phylogeny of crustaceans in the light of phylogenomic data. In J. W. Wagele, & T. Bartholomaeus (Eds.), Deep metazoan phylogeny: The backbone of the tree of life. New insights from analyses of molecules, morphology, and theory of data analysis (pp. 385-398). Berlin/Boston: De Gruyter.
Wanninger, A. (2015). Morphology is dead – long live morphology! Integrating MorphoEvoDevo into molecular EvoDevo and phylogenomics. Frontiers in Ecology and Evolution, 3, 54, doi:10.3389/fevo.2015.00054.
21
615
616
617
618
619
620
621
622
623
624
625
626
627
628
629
630
631
632
633
634
635
636
637
638
639
640
641
642
643
644
645
646
647
648
Weigert, A., Helm, C., Meyer, M., Nickel, B., Arendt, D., Hausdorf, B., et al. (2014). Illuminating the base of the annelid tree using transcriptomics. Molecular Biology and Evolution, 31(6), 1391-1401, doi:10.1093/molbev/msu080.
Wheeler, W. C., Cartwright, P., & Hayashi, C. Y. (1993). Arthropod phylogeny: a combined approach. Cladistics, 9(1), 1-39.
Wheeler, W. C., Giribet, G., & Edgecombe, G. D. (2004). Arthropod systematics. The comparative study of genomic, anatomical, and paleontological information. In J. Cracraft, & M. J. Donoghue (Eds.), Assembling the Tree of Life (pp. 281-295). New York: Oxford University Press.
Whelan, N. V., Kocot, K. M., Moroz, L. L., & Halanych, K. M. (2015). Error, signal, and the placement of Ctenophora sister to all other animals. Proceedings of the National Academy of Sciences of the USA, 112(18), 5773-5778, doi:10.1073/pnas.1503453112.
Wood, H. M., Matzke, N. J., Gillespie, R. G., & Griswold, C. E. (2013). Treating fossils as terminal taxa in divergence time estimation reveals ancient vicariance patterns in the palpimanoid spiders. Systematic Biology, 62(2), 264-284, doi:10.1093/sysbio/sys092.
Zapata, F., Wilson, N. G., Howison, M., Andrade, S. C. S., Jörger, K. M., Schrödl, M., et al. (2014). Phylogenomic analyses of deep gastropod relationships reject Orthogastropoda. Proceedings of the Royal Society B: Biological Sciences, 281, 20141739, doi:10.1101/007039.
Zhang, G., Li, C., Li, Q., Li, B., Larkin, D. M., Lee, C., et al. (2014). Comparative genomics reveals insights into avian genome evolution and adaptation. Science, 346(6215), 1311-1320, doi:10.1126/science.1251385.
Zrzavý, J., Mihulka, S., Kepka, P., Bezdek, A., & Tietz, D. (1998). Phylogeny of the Metazoa based on morphological and 18S ribosomal DNA evidence. Cladistics, 14(3), 249-285.
22
649
650
651
652
653
654
655
656
657
658
659
660
661
662
663
664
665
666
667
668
669
670
671
672
673
674
675
676
677
678
679
680
Fig. 1 Hypothesis of animal phylogeny derived from multiple phylogenomic sources. This tree was not generated using any explicit algorithm. Taxa in red indicate unstable taxa, taxa with deficient genomic/transcriptomic data or taxa for which no phylogenomic analysis is available. Taxa in blue indicate conflict between some studies, but with a relatively stable position. Green nodes indicate clades supported across most well-sampled studies; blue nodes indicate clades that are contradicted in some studies, especially due to the position of some rough taxa; red node indicates a putative clade not thoroughly tested in phylogenomic analyses.
23
681
682
683
684
685
686
687
688
689