€¦ · Web view · 2016-03-18Morocco European Free Trade Association (EFTA) 01.12.99 Goods...
169
RESTRICTED WT/TPR/S/329 7 December 2015 (15-6416) Page: 1/169 Trade Policy Review Body TRADE POLICY REVIEW REPORT BY THE SECRETARIAT KINGDOM OF MOROCCO This report, prepared for the fifth Trade Policy Review of Morocco, has been drawn up by the WTO Secretariat on its own responsibility. The Secretariat has, as required by the Agreement establishing the Trade Policy Review Mechanism (Annex 3 of the Marrakesh Agreement Establishing the World Trade Organization), sought clarification from Morocco on its trade policies and practices. Any technical questions arising from this report may be addressed to Jacques Degbelo (022 739 5583), Catherine Hennis-Pierre (022 739 5640) and Alya Belkhodja (022 739 5162). Document WT/TPR/G/329 contains the policy statement submitted by Morocco. Note: This report is subject to restricted circulation and press embargo until the end of the first session of the meeting of the Trade Policy Review Body on Morocco. This report was drafted in French.
Transcript of €¦ · Web view · 2016-03-18Morocco European Free Trade Association (EFTA) 01.12.99 Goods...
RESTRICTED
WT/TPR/S/329
7 December 2015(15-6416) Page: 1/135
Trade Policy Review Body
TRADE POLICY REVIEW
REPORT BY THE SECRETARIAT
KINGDOM OF MOROCCO
This report, prepared for the fifth Trade Policy Review of Morocco, has been drawn up by the WTO Secretariat on its own responsibility. The Secretariat has, as required by the Agreement establishing the Trade Policy Review Mechanism (Annex 3 of the Marrakesh Agreement Establishing the World Trade Organization), sought clarification from Morocco on its trade policies and practices.
Any technical questions arising from this report may be addressed to Jacques Degbelo (022 739 5583), Catherine Hennis-Pierre (022 739 5640) and Alya Belkhodja (022 739 5162).
Document WT/TPR/G/329 contains the policy statement submitted by Morocco.
Note: This report is subject to restricted circulation and press embargo until the end of the first session of the meeting of the Trade Policy Review Body on Morocco. This report was drafted in French.
WT/TPR/S/329 • Kingdom of Morocco
- 2 -
CONTENTSSUMMARY 81 ECONOMIC ENVIRONMENT 111.1 Main features of the economy 111.2 Recent economic trends 131.3 Trade performance 151.4 Foreign investment 222 TRADE AND INVESTMENT REGIME 252.1 Overview 252.2 Trade policy objectives 282.3 Trade agreements and arrangements 292.3.1 World Trade Organization (WTO) 292.3.2 Agreements with the European countries and Turkey 312.3.2.1 European Union 312.3.2.2 Agreement with EFTA 322.3.2.3 Agreement with Turkey 322.3.3 Trade relations with Arab countries 322.3.3.1 Greater Arab Free Trade Area (GAFTA) 332.3.3.2 Relations with the United Arab Emirates (UAE) 332.3.3.3 Arab-Mediterranean Free Trade Agreement ("Agadir Agreement") 332.3.4 Agreements with the sub-Saharan African countries 332.3.5 Agreements with countries of the Americas342.3.6 Non-reciprocal preferential arrangements 342.4 Investment regime 342.4.1 Investment Charter 352.4.2 Free zones regime 362.4.3 Tax incentives for investment under the General Tax Code 372.4.4 Investment aid 372.4.5 International investment agreements and conventions 373 TRADE POLICIES AND PRACTICES BY MEASURE 393.1 Measures directly affecting imports 393.1.1 Customs procedures 393.1.2 Customs valuation 413.1.3 Customs levies 423.1.3.1 Overview 423.1.3.2 Applied most-favoured-nation (MFN) tariff 423.1.3.3 Other duties and charges levied solely on imports 463.1.3.4 Bindings 473.1.3.5 Internal duties and taxes 483.1.3.5.1 Value added tax (VAT) 483.1.3.5.2 Internal consumption tax (TIC) 50

WT/TPR/S/329 • Kingdom of Morocco
- 3 -
3.1.3.5.3 Other internal taxes 503.1.3.6 Duty and tax exemptions and concessions 503.1.3.7 Tariff preferences 503.1.4 Rules of origin 513.1.5 Import prohibitions, quantitative restrictions, licensing and prior authorization 533.1.6 Contingency measures 543.1.6.1 Safeguard measures 553.1.6.2 Anti-dumping and countervailing measures 563.1.7 Standards and other technical requirements 573.1.7.1 Standards, testing and certification 573.1.7.2 Sanitary, phytosanitary and environmental measures 593.1.7.3 Marking, labelling and packaging 633.2 Measures directly affecting exports 643.2.1 Procedures 643.2.2 Export taxes 653.2.3 Export prohibitions, licensing and control 653.2.4 Exports subsidies, promotion and support 653.2.4.1 Export free zones 663.2.4.2 Customs regimes 673.2.4.3 Export financing 683.2.4.4 Insurance693.2.4.5 Promotion 703.3 Measures affecting production and trade 703.3.1 State trading, State-owned enterprises and privatization 703.3.2 Incentives 743.3.3 Competition policy and price controls 753.3.4 Government procurement 773.3.5 Intellectual property rights 803.3.6 Industrial property rights 823.3.6.1.1 New varieties of plants 843.3.6.1.2 Copyright and related rights 844 TRADE POLICIES BY SECTOR 864.1 Agriculture and agro-industry 864.1.1 Overview 864.1.2 Agricultural policy894.1.3 Border measures 904.1.4 Support for production and export 934.1.5 Developments in some subsectors 954.1.5.1 Cereals and their products 954.1.5.2 Oilseeds 954.1.5.3 Sugar 96
WT/TPR/S/329 • Kingdom of Morocco
- 4 -
4.1.5.4 Carbonated beverages, wine and cider 964.1.5.5 Livestock and livestock products 974.2 Fishery and aquaculture products 984.2.1 Overview of the market and the regulations 984.2.2 Fishing by foreign enterprises 1024.2.2.1 Morocco-EU fisheries agreement 1024.2.2.2 Fisheries agreement with the Russian Federation 1024.2.2.3 Fisheries agreement with Japan 1024.2.3 Preservation and sustainable management of fishery resources 1024.3 Mining 1034.3.1 Overview 1034.3.2 Phosphates 1044.3.3 Other mineral products 1044.4 Energy 1054.4.1 Upstream petroleum sector 1074.4.2 Downstream petroleum sector1074.4.3 Natural gas 1084.4.4 Electricity 1094.5 Manufacturing and crafts sector 1104.5.1 Support for production, infrastructure and training 1104.5.2 Some activities 1124.5.2.1 Craft industry and informal sector 1124.5.2.2 Clothing 1124.5.3 Automotive industry 1134.6 Transport services 1144.6.1 Road transport 1154.6.2 Rail transport 1174.6.3 Maritime transport 1184.6.3.1 Transport services 1184.6.3.2 Port services 1184.6.4 Air transport 1214.6.4.1 Transport services 1214.6.4.2 Airport services 1224.7 Tourism services 1224.8 Telecommunications services 1254.8.1 Overview 1254.8.2 Policy 1264.8.3 Universal service 1284.8.4 Morocco's commitments under the GATS 1284.8.5 Free Trade Agreement (FTA) with the United States 1284.9 Postal services 128
WT/TPR/S/329 • Kingdom of Morocco
- 5 -
4.10 Insurance services1294.10.1 Overview 1294.10.2 Policy 1294.11 Banking services and other financial services 1314.11.1 Overview 1314.11.2 Policy 1324.11.3 International commitments 1344.12 Professional services and business services 1344.12.1 Overview 1344.12.2 Accounting and auditing services 1354.12.3 Legal services 1364.12.3.1 Lawyers 1364.12.3.2 Notaries and adouls 1374.12.4 Architectural services 1374.12.5 Engineering services 138
CHARTS
Chart 1.1 Trend in merchandise exports, 2008-2014 16Chart 1.2 Structure of merchandise trade, 2008 and 2014 17Chart 1.3 Direction of merchandise trade, 2008 and 2014 20Chart 1.4 Trade in services, 2008-2014 22Chart 1.5 Stock of Moroccan direct investment abroad, 2004-2013 24Chart 2.1 Number of participants in WTO technical assistance and training activities, 2009-2014 30Chart 2.2 WTO assistance to Morocco, by field of activity, 2009-2014 31Chart 3.1 Import duty on common wheat, 2008-2015 44Chart 3.2 Breakdown of applied MFN tariff rates, 2015 46Chart 3.3 Escalation of applied MFN rates by manufacturing industry, 2015 47Chart 4.1 Trade in agricultural products, 2008-2014 93Chart 4.2 Fishery production, 2009-2014 99Chart 4.3 Local sales and exports of mineral and processed products, 2008-2014 103Chart 4.4 Imports of energy products, 2005-2014 106Chart 4.5 Customs duties by manufacturing industry, 2009 and 2015112Chart 4.6 Logistics performance index, 2007 and 2012 115Chart 4.7 Trends in port traffic, transhipment excluded, 2003-2014 119Chart 4.8 Tourism: number of arrivals and revenue, 2009-2014 122
TABLES
Table 1.1 Basic economic indicators, 2008-2014 11Table 1.2 Corporation tax (IS), 2015 14
WT/TPR/S/329 • Kingdom of Morocco
- 6 -
Table 1.3 Balance of payments, 2008-2014 16Table 1.4 Structure of imports, 2008-2014 18Table 1.5 Structure of exports, 2008-2014 19Table 1.6 Origin of imports, 2008-2014 21Table 1.7 Destination of exports, 2008-2014 21Table 1.8 Foreign direct investment inflows, by activity sector and country, 2008-2014 23Table 2.1 Texts of trade related laws and regulations published since 2008 26Table 2.2 List of regional trade agreements concluded by Morocco, 2015 28Table 2.3 Morocco's notifications to the WTO, 2009-2014 29Table 2.4 Tariff preferences under the EU Morocco Agreement, 2015 32Table 3.1 Revenue from duties and taxes levied on imports, 2008-2014 42Table 3.2 Variable customs duty applicable to sugar, 2015 43Table 3.3 Variable customs duty applicable to cereals, 2015 43Table 3.4 MFN tariff structure, 2009 and 2015 44Table 3.5 Brief analysis of the MFN tariff, 2015 45Table 3.6 Tariff lines for which the applied rate exceeds the bound rate, 2015 48Table 3.7 Some products for which there is a difference between the internal VAT and the import VAT, 2015 49Table 3.8 Applied MFN rates and preferential rates, 2015 51Table 3.9 Preferential rules of origin 52Table 3.10 Some products whose import is restricted, 2015 53Table 3.11 Free zones operating in 2015 66Table 3.12 Suspensive procedures, 2015 67Table 3.13 Some companies with a State holding operating in 2015 71Table 3.14 Principal methods for awarding government procurement contracts, 2010-2014
79Table 4.1 Main agrifood products, 2008 and 2010-2013 86Table 4.2 Main imports of agricultural products, 2008-2014 87Table 4.3 Exports of agricultural products, 2008-2014 88Table 4.4 MFN agricultural tariffs of at least 30%, 2009 and 2015 90Table 4.5 Tariff quotas notified to the WTO, 2015 92Table 4.6 Overview of agricultural activities eligible for state financial aid, 2015 93Table 4.7 Customs duty on oil imports, by main supplier, 2009 and 2015 96Table 4.8 Customs duty on beverages, by main supplier, 2009 and 2015 96Table 4.9 Internal taxes on domestically produced or imported alcoholic beverages, 2008 and 2015 97Table 4.10 Fishery production, 2009-2014 99Table 4.11 Tariffs on imported fishery products, 2009 and 2015 100Table 4.12 Imports of energy resources, 2005 and 2010-2014 106Table 4.13 Electricity generation, 2002, 2008, 2010 and 2012-2014 109Table 4.14 Clothing exports (HS 61 and 62) to the United States market, 2005 and 2010-2014 113Table 4.15 Bilateral TIR agreements, 2015 116
WT/TPR/S/329 • Kingdom of Morocco
- 7 -
Table 4.16 Indicators for the main ports, 2015 120Table 4.17 Tourism: number of arrivals and revenue, 2008-2014 123Table 4.18 System of incentives for investment in tourism 124Table 4.19 Available information concerning some regulated professions, 2014 135
WT/TPR/S/329 • Kingdom of Morocco
- 8 -
SUMMARY
1. Since Morocco's last Trade Policy Review (TPR) in 2009, its economy has continued to grow at an average annual rate of 3.7% and to diversify, helped by a stable macroeconomic framework with moderate inflation and interest rates. The trade reforms introduced since the last TPR also contributed to this performance by stimulating competition on the domestic markets, encouraging innovation and creating new jobs, one of the main challenges facing the Moroccan economy. According to the World Bank classification, Morocco is currently a lower-middle-income country.
2. Following the shock created by the financial crisis of 2008, international trade and investment were particularly responsive to the reforms introduced. During the period 2009-2014, goods exports regained and then surpassed their 2008 level, with an annual growth rate of 10% in terms of the national currency, the dirham. Goods imports grew still faster, causing the trade deficit to widen. Services exports continued their dynamic growth, reaching US$14 billion, equivalent to close to 60% of goods exports. The current account deficit, which reached almost 10% of GDP in 2012, fell to below 6% of GDP in 2014.
3. The automobile industry performed well, accounting for 30% of Morocco's total exports – double its share for 2009 – thanks partly to European direct investment in the free zones. Tourism continued to expand rapidly, and is one of the country's main sources of foreign exchange. Agrifood exports also gained in importance, while retaining their traditional role as a source of family employment and income for the rural population. In the case of certain plant products such as beans, tomatoes, olives and certain leguminous plants, Morocco accounts for a substantial share of world exports. On the other hand, exports of crude phosphates, which are still under a State monopoly, declined sharply in spite of a national strategy to limit the global supply and influence the price of phosphates and their byproducts.
4. Because Moroccan coastal waters are subject to intensive fishing, the new Halieutis plan is seeking to ensure the sustainability of fishery resources, and to upgrade and modernize the sector and improve its competitiveness and performance. Within the WTO, Morocco has submitted a proposal in the framework of the rules negotiations on fisheries subsidies in which it argues that special and differential treatment should permit developing country Members to be exempt from any ban on subsidies.
5. Morocco imports the bulk of the energy it consumes, partly from its Arab partners, and from Spain in the case of electricity. Over the past few years, consumer subsidies for petroleum products considerably widened the budget deficit, which reached 7% of GDP in 2012 before falling back to 4.6% in 2014. These subsidies are currently being phased out. Considerable amounts are also being spent under the Government's economic development policy which rests on three pillars: State supply of integrated production infrastructure to private investors; subsidies and other incentives granted to private investors, including for exports; and programmes to train the labour force in new techniques.
6. With more than ten agreements currently in force, Morocco is one of the countries that has concluded the largest number of trade agreements. Its main trading partner is the European Union (EU), both on the import side (approximately half of the total) and the export side (two thirds of the total). The partnership was reinforced by a Free Trade Agreement (FTA) in 2000, supplemented by a protocol on trade in agricultural products in 2012. However, this agricultural trade is still hampered by a whole array of measures such as threshold or minimum entry prices, seasonal restrictions according to domestic production, and other forms of quotas. In spite of the wide range of preferential trade agreements in force, it is agricultural imports on an MFN basis that developed fastest during the period.
7. Morocco has participated actively in the work of the WTO, including in the area of notifications. It has notified, under Category A, a considerable number of measures covered by the Agreement on Trade Facilitation, but as of November 2015 it had not yet ratified the Agreement. Fresh steps were taken to shorten the time during which goods remain in customs zones and ports. Known operators can now carry out more than 30 operations remotely, including the release and clearance of goods. The computerization of customs procedures has included, inter alia, digital signature of customs declarations, e-payment, and electronic validation of bank guarantees. Thanks to the new "PortNet" electronic platform, electronic data and information can be exchanged between port operators involved in foreign trade. A framework agreement between Customs and the Directorate-General of Taxation (DGI) also enables approved economic operators to exchange
WT/TPR/S/329 • Kingdom of Morocco
- 9 -
tax data, thereby avoiding much of the red tape caused by the complexity of the Moroccan taxation system.
8. However, outside the export free zones (ZFEs), in which tax, banking and exchange incentives are among the main attractions, "import commitments" are still required under the exchange regulations, in addition to the detailed declaration. Goods entering or leaving the ZFEs are exempt from all duties and taxes. A business tax of 8.75% is charged after the fifth year of operation, instead of the usual tax of 30%. Eligibility for ZFE status does not require companies to export a minimum share of their output: there is no ceiling on the share of their sales in Moroccan national territory. The conditions governing these companies' exports and domestic sales are specified on a case-by-case basis. As a result, this regime will tend to generate competition to the detriment of the rest of the local economy. At the same time, there are several different laws governing the same tax incentives, and numerous exemptions are available.
9. The customs duty on imports has undergone a major reform which has led to a decrease in both the number and the rates. Thus, the average MFN tariff rate fell from 20.2% in 2009 to 12.5% in 2015. The average rate for agricultural products (WTO definition) decreased from 44.5% in 2009 to 30% in 2015. In the case of non-agricultural products, the simple average decreased from 16.3% in 2009 to 9.5% in 2015. The number of tariff peaks (duties higher than 15%) fell from 47% of the total tariff schedule in 2009 to 33% in 2015, i.e. still close to one third of the total. The number of variable duties also decreased, with certain products such as rice and maize no longer subject to them. The duty rates currently vary depending on the import price, the season and/or the domestic harvest, chiefly in the case of wheat and sugar. At the same time, the WTO-bound tariff quotas are not always applied.
10. The stated objective of the Plan Maroc Vert (Green Morocco Plan) for sustainable agricultural development is to protect traditional production sectors from foreign competition while fostering international competitiveness of exportable products, and to promote local processing of imported inputs, thereby replacing imports of finished goods in order to narrow the trade deficit. Accordingly, the reform seeks to apply the principle of tariff escalation, depending on the degree of processing (from inputs, through semi-finished products to finished goods). Another objective is to narrow the difference in taxation between the FTAs and the MFN regime in order to avoid the deviation of trade towards inefficient producers.
11. Thanks to the reform, the number of tariff lines for which the applied rates continue to exceed Morocco's WTO bound rates has decreased from 1,373 in 2009 to 792 today. These cases have existed ever since 2000, when Morocco amalgamated the tariff and the fiscal import levy (PFI), which as a rule stood at 15%, by adding them together. Needless to say, the two had been bound separately at the WTO, the former as a tariff and the latter in the category of "other duties and taxes". However, in spite of this amalgamation, several other duties and taxes are still levied on imports alone, and should probably be rationalized. These include the "parafiscal" taxes (0.25% of customs value), the "stamp" duty, the "storage" tax (4-14% of the customs value if the goods stay more than three days in customs), the "administrative" fees, the "computer" tax, and the tax for the control and stamping of imported handmade carpets (5%). The import taxation system is further complicated by two different VAT regimes (the "internal" and "import" regimes) with or without "right of deduction" of VAT paid on inputs.
12. Morocco has introduced a new legal framework governing trade defence measures, and has set up an Import Monitoring Commission responsible for such measures. Since 2008, several new anti-dumping and safeguard duties have entered into force, some of them involving FTA partners, generally in the form of quotas above which additional duties apply. A new Competition Council has been tasked, under the Constitution as amended in 2011, with ensuring transparency and equity in economic relations, inter alia by analysing and regulating competition on the different markets, and controlling unfair trade practices and economic merger operations. The Moroccan Accreditation System (SEMAC) was introduced in 2013 in the Ministry responsible for industry, which is in charge of accreditation and evaluating the technical competence of certification, testing and qualification bodies. The purpose of this reform is to facilitate the process of bringing local manufactures into line with international quality standards while preserving the comparative advantage deriving from their uniqueness as local Moroccan products.
13. In 2010, Morocco set up a new National Food Safety Board (ONSSA), responsible for the safety of consumers, animals and plants, fishery products and animal feed, as well as for controlling and approving agricultural inputs (seed, pesticides, fertilizer) and veterinary medicines, and applying the legislation and regulations on veterinary and phytosanitary health control. The
WT/TPR/S/329 • Kingdom of Morocco
- 10 -
ONSSA takes a sample and issues a certificate of analysis for each import of food products. The new law of 2010 on the protection of animals and animal health, the health safety of food of animal origin, animal feed and animal byproducts is the outcome of a joint Morocco-EU project on sanitary and phytosanitary measures. Its provisions cover all stages of production, handling, treatment, processing, packaging, presentation, transport, storage, distribution, sale and export of primary products, food products for human consumption and animal feed.
14. In 2014, Morocco abolished the foreign exchange undertaking linked to the obligation to repatriate export proceeds, which remains in force. Export subsidies are granted for certain agricultural products in order to reduce freight costs to certain destinations. The Moroccan Export Insurance Company (SMAEX) provides insurance at subsidized rates against political risks, disasters and non-transfer, as well as special commercial risks for companies which export capital goods, carry out public works, or supply services lasting over one year. It also covers risks relating to market surveys and fairs.
15. Since Morocco's last TPR, there have also been changes to its legislative framework for intellectual property. A new law has been introduced to raise the level of industrial property protection in Morocco and to bring the legislation into line with the country's international commitments, notably the TRIPS Agreement and the Trademark Law Treaty. An Agreement between Morocco and the European Patent Organization on the validation of European patents was signed in 2010. Morocco is not a member of the Patent Law Treaty. The Customs Administration has been given increased responsibility under the new legislation, which allows for automatic suspension of the release into circulation of goods suspected of being counterfeit or pirated or their automatic confiscation at the border. The 2014 Finance Law strengthened the legal instruments available by making counterfeiting a first category customs offence.
16. A new Government Procurement Code was enacted in January 2014 in order to harmonize government procurement rules for all government and regional authorities and more than 200 public institutions that were not previously covered. The privatization process, which had enabled Morocco to channel a large volume of foreign direct investment to the energy, financial services, telecommunications and tourism sectors during the period 2000-2010, subsequently began to slow down. The State still holds significant shares in the main telecommunications companies, banks, and insurance companies as well as railway and air transport companies. The State also invested heavily in ports, motorways and railways, providing what should be a further boost to Morocco's foreign trade. The Moroccan banks have made substantial investments in the African banks under GATS Mode 3. There are still some restrictions on foreign presence in the road and air transport and insurance sectors, as well as in professional services, which are largely reserved for Moroccans.
17. In conclusion, thanks to Morocco's numerous reforms to its trade regime since the last TPR and its efforts to develop transport, telecommunications and Internet infrastructures, its economy has continued to grow vigorously. The government's current objectives are to continue opening up the economy to foreign trade, to promote sustainable development, particularly in agriculture, and to develop rural areas, notably through eco-tourism. These objectives are more likely to be met in full if a major regulatory reform is undertaken to simplify the tax system and to ensure greater freedom of exchange, while at the same time harmonizing the rules governing ZFE enterprises with those applicable to companies operating outside the ZFEs. This would enable the economy to become even more competitive and would make it easier to set up new companies and create new jobs.
WT/TPR/S/329 • Kingdom of Morocco
- 11 -
1 ECONOMIC ENVIRONMENT
1.1 Main features of the economy
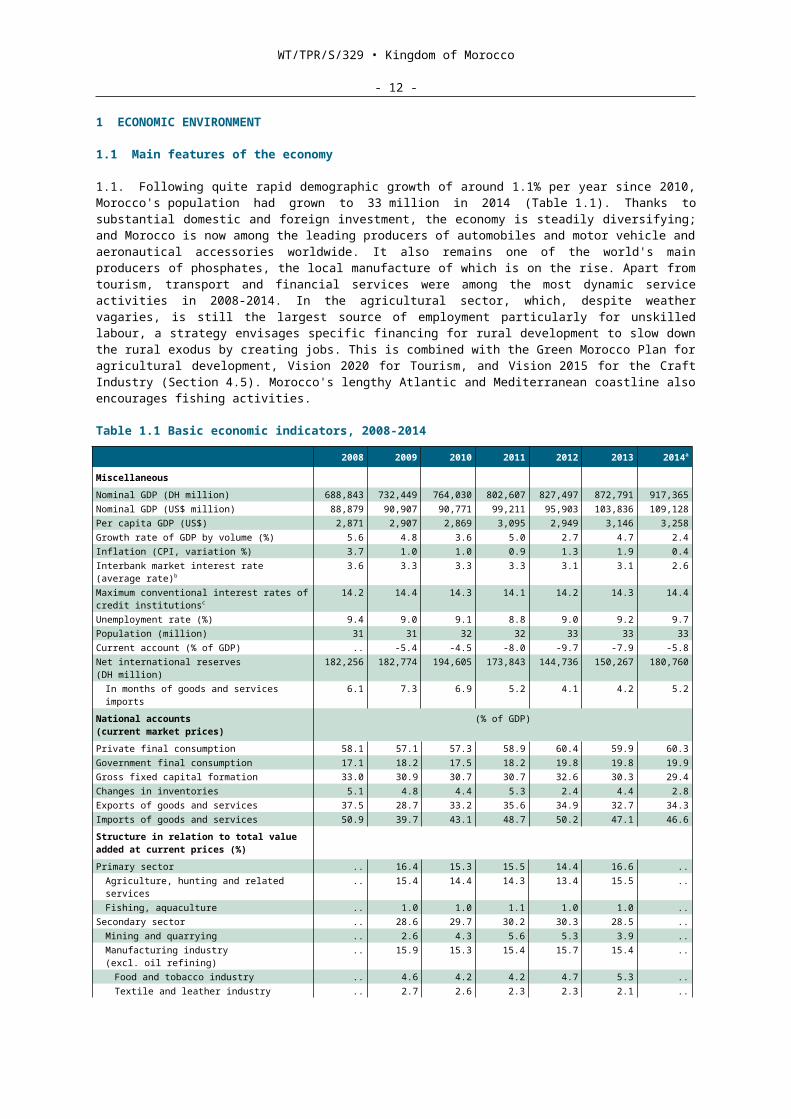
1.1. Following quite rapid demographic growth of around 1.1% per year since 2010, Morocco's population had grown to 33 million in 2014 (Table 1.1). Thanks to substantial domestic and foreign investment, the economy is steadily diversifying; and Morocco is now among the leading producers of automobiles and motor vehicle and aeronautical accessories worldwide. It also remains one of the world's main producers of phosphates, the local manufacture of which is on the rise. Apart from tourism, transport and financial services were among the most dynamic service activities in 2008-2014. In the agricultural sector, which, despite weather vagaries, is still the largest source of employment particularly for unskilled labour, a strategy envisages specific financing for rural development to slow down the rural exodus by creating jobs. This is combined with the Green Morocco Plan for agricultural development, Vision 2020 for Tourism, and Vision 2015 for the Craft Industry (Section 4.5). Morocco's lengthy Atlantic and Mediterranean coastline also encourages fishing activities.
Table 1.1 Basic economic indicators, 2008-2014
2008 2009 2010 2011 2012 2013 2014a
MiscellaneousNominal GDP (DH million) 688,843 732,449 764,030 802,607 827,497 872,791 917,365Nominal GDP (US$ million) 88,879 90,907 90,771 99,211 95,903 103,836 109,128Per capita GDP (US$) 2,871 2,907 2,869 3,095 2,949 3,146 3,258Growth rate of GDP by volume (%) 5.6 4.8 3.6 5.0 2.7 4.7 2.4Inflation (CPI, variation %) 3.7 1.0 1.0 0.9 1.3 1.9 0.4Interbank market interest rate (average rate)b
3.6 3.3 3.3 3.3 3.1 3.1 2.6
Maximum conventional interest rates of credit institutionsc
14.2 14.4 14.3 14.1 14.2 14.3 14.4
Unemployment rate (%) 9.4 9.0 9.1 8.8 9.0 9.2 9.7Population (million) 31 31 32 32 33 33 33Current account (% of GDP) .. -5.4 -4.5 -8.0 -9.7 -7.9 -5.8Net international reserves (DH million) 182,256 182,774 194,605 173,843 144,736 150,267 180,760
In months of goods and services imports 6.1 7.3 6.9 5.2 4.1 4.2 5.2National accounts (current market prices)
(% of GDP)
Private final consumption 58.1 57.1 57.3 58.9 60.4 59.9 60.3Government final consumption 17.1 18.2 17.5 18.2 19.8 19.8 19.9Gross fixed capital formation 33.0 30.9 30.7 30.7 32.6 30.3 29.4Changes in inventories 5.1 4.8 4.4 5.3 2.4 4.4 2.8Exports of goods and services 37.5 28.7 33.2 35.6 34.9 32.7 34.3Imports of goods and services 50.9 39.7 43.1 48.7 50.2 47.1 46.6Structure in relation to total value added at current prices (%)Primary sector .. 16.4 15.3 15.5 14.4 16.6 ..
Agriculture, hunting and related services .. 15.4 14.4 14.3 13.4 15.5 ..Fishing, aquaculture .. 1.0 1.0 1.1 1.0 1.0 ..
Secondary sector .. 28.6 29.7 30.2 30.3 28.5 ..Mining and quarrying .. 2.6 4.3 5.6 5.3 3.9 ..Manufacturing industry (excl. oil refining) .. 15.9 15.3 15.4 15.7 15.4 ..
Food and tobacco industry .. 4.6 4.2 4.2 4.7 5.3 ..Textile and leather industry .. 2.7 2.6 2.3 2.3 2.1 ..Chemical and para-chemical industry .. 2.3 2.3 3.2 3.2 2.7 ..Mechanical, metalworking and electrical industry
.. 3.2 3.4 3.1 3.1 2.9 ..
Other manufacturing industries .. 3.0 2.9 2.6 2.5 2.4 ..Energy .. 3.1 3.2 2.8 2.8 2.7 ..
Oil refining and other energy products .. 0.2 0.4 0.3 0.2 0.0 ..Electricity and water .. 2.9 2.8 2.6 2.6 2.6 ..
Construction and public works .. 7.0 6.8 6.5 6.5 6.6 ..Tertiary sector .. 55.0 55.0 54.3 55.3 54.9 ..
Commerce .. 11.0 10.6 10.4 10.4 10.2 ..Hotels and restaurants .. 2.6 2.8 2.5 2.6 2.7 ..Transport .. 3.9 4.0 3.8 3.8 3.9 ..Postal services and telecommunications .. 3.4 3.4 3.0 2.8 2.3 ..Financial and insurance activities .. 6.1 5.9 5.9 6.1 5.9 ..
Real estate, leasing and business services
.. 13.0 12.9 12.6 13.1 12.9 ..
Other non-financial services .. 1,5 1,5 1,4 1,4 1,4 ..
WT/TPR/S/329 • Kingdom of Morocco
- 12 -
2008 2009 2010 2011 2012 2013 2014a
General government and social security .. 9.2 9.1 9.4 9.7 9.7 ..Education, health and social services .. 9.5 9.7 10.2 10.4 10.5 ..Nominal sector .. -5.3 -4.9 -5.0 -5.0 -4.8 ..
Exchange rateExchange rate (DH/US$, annual average) 7.8 8.1 8.4 8.1 8.6 8.4 8.4Exchange rate (DH/€, annual average) 11.4 11.2 11.1 11.2 11.1 11.2 11.2Nominal effective exchange rated 0.8 1.8 -2.7 0.1 -0.6 2.1 1.2Real effective exchange rated 0.5 2.0 -4.1 -2.3 -2.0 1.8 0.1
(% of GDP, unless otherwise indicated)Public financeTotal income and grants 26.0 23.1 22.2 23.4 23.8 22.9 23.3
Fiscal income 23.3 20.2 19.6 19.9 20.8 19.3 19.2Of which:
Direct taxes 11.4 9.6 8.3 8.6 9.3 8.6 8.4Indirect taxes 8.6 7.8 8.5 8.8 8.9 8.4 8.3
Of which: VATe 6.0 5.2 5.8 6.1 6.2 5.8 5.7Domestic 2.5 2.1 2.4 2.3 2.3 2.2 2.2Imports 3.5 3.0 3.4 3.8 3.9 3.6 3.5
Customs duties 1.9 1.6 1.6 1.3 1.1 0.9 0.8Non-fiscal income 2.3 2.4 2.1 3.1 2.6 3.2 3.8Grants .. .. .. .. .. 0.6 1.4
Total expenditure and net loans 25.6 25.2 26.8 29.3 30.6 27.9 27.9Current expenditure 21.9 20.4 20.6 23.7 25.4 23.3 22.8
Of which wages and salaries 9.8 10.1 10.0 10.8 11.4 11.0 11.0Investment expenditure 5.3 6.2 6.0 6.1 6.1 5.3 5.7Net loans 1.2 0.0 0.0 0.0 0.0 0.0 0.0
Overall balance including grants 0.4 -2.1 -4.6 -5.9 -6.8 -5.1 -4.6Public debtExternal public debt (US$ million) 16,492 19,372 20,798 22,048 25,222 28,801 30,715
% of GDP 19.4 20.8 22.7 23.6 25.7 26.9 30.3External debt of the Treasury (% of GDP) 9.9 10.8 12.1 12.4 14.1 14.9 15.4Domestic debt of the Treasury (% of GDP) 37.4 36.2 38.2 41.3 45.5 48.6 48.5Total debt of the Treasury (% of GDP) 47 47 50 54 60 64 64
.. Not available.a Provisional.b The figures refer to December each year.c Financial year starting in April.d A minus sign (-) indicates a depreciation, index (2010 = 100).e Net of revenue share transferred to local authorities.Source: Ministry of the Economy and Finance; viewed at: http://www.finances.gov.ma/fr/SitePages/Home.aspx.
Bank Al-Maghrib, Quarterly Bulletin No. 143, March 2015. Statistical data provided by the authorities. African Development Bank, African Statistical Yearbook 2015; viewed at: http://www.afdb.org/fileadmin/uploads/afdb/Documents/Publications/African_Statistical_Yearbook_2015.pdf. IMF, International Financial Statistics; viewed at: http://elibrary-data.imf.org/ (database accessed in November 2015).
1.2. Between 2009 and 2014, Morocco succeeded in increasing its per capita GDP by 3.7% per year to reach a level of US$3,250 in 2014, thereby doubling its per capita income over the last ten years (Table 1.1). Despite recent natural gas discoveries, Morocco imports the bulk of its energy requirements, and the high prices of energy products have had an adverse effect on the country's public finances since energy consumption is subsidized.
1.3. Considerable progress has been made on basic infrastructure and access to social services, as shown by the rise in the expenditure item "Education, health and social services", to nearly 10% of GDP (Table 1.1). Drinking water coverage in rural areas was around 95% in 2014; the rural electrification rate rose from 18% in 1995 to 99% in 2014; and school enrolment among rural girls aged 12-14 years was 62% in 2014 compared to 40% in 2007. Nonetheless, 38% of women are still illiterate, compared to 24% of men. Life expectancy at birth rose from 67 years in 2004 to 72 in 2010.
1.4. Morocco's currency is the dirham, which has been indexed to a currency basket consisting of the euro and the US dollar (60% and 40%, respectively since 13 April 2015, compared to 80% and

WT/TPR/S/329 • Kingdom of Morocco
- 13 -
20% previously).1 The country's central bank, Bank Al-Maghrib (BAM, Section 4.11), is responsible for monetary policy. The foreign exchange regime imposes no restrictions on payments and transfers related to current international transactions and foreign investment in Morocco.2
Nonetheless, export enterprises have to repatriate all their export earnings and surrender at least 30% of those earnings on the foreign exchange market within 150 days from their receipt. They may freely hold bank accounts in convertible dirhams or foreign exchange to deposit up to 70% of their export earnings (50% prior to December 2010).3 These accounts can be used, among other things, to pay their operating expenses, and make repayments on professional loans or expenses related to export activity.
1.5. Since 2007, mutual funds (UCITS) have been allowed to invest up to 10% of their portfolios in securities denominated in foreign currency and held abroad.4 Insurance companies and pension funds may also make foreign-currency investments abroad, up to a maximum of 5%, respectively, of their total assets and reserves. Since 2010 resident corporations may transfer up to DH 50 million abroad to finance their investments (DH 100 million for Africa).
1.2 Recent economic trends
1.1. Since the previous review of its trade policy in 2009, Morocco has persevered with its strategy of economic diversification, investment in transport infrastructure and gradual trade liberalization. This has generated a strong overall economic performance, as real GDP growth averaged almost 3.7% per year in 2009-2014. This growth was driven by both private- and public-sector consumption, which have increased their shares of GDP by 2 and 3 percentage points, respectively since 2008 (Table 1.1). Despite easing slightly in the last three years, investment remained at a high level averaging around 35% of GDP between 2009 and 2014, one of the highest rates in the region. Despite sustained high raw material prices on international markets during this period, foreign trade continued to contribute positively to economic growth, thanks to the performance of the automotive, aeronautical, and electronics industries, in particular. In October 2015, the Government was forecasting growth of around 5% for that year, based on the exceptional results of the agricultural harvest and the continued improvement of non-farming activities. The Ministry of the Economy and Finance (MEF) is responsible for economic and financial policy, including preparation of the annual finance laws.
1.2. Inflation remained in check, in keeping with the goal of monetary policy, with beneficial effects on economic activity. The inflation target for 2015 is 1.5%, despite increases in the minimum hourly wage that took effect in July 2014 and July 2015 (12.85 DH/hour and 13.46 DH/hour, respectively), and new water and electricity rates (Section 4.4.4). BAM interventions, based on a set of instruments forming the operational framework of monetary policy, aim to influence the interbank rate; the latter, in turn, affects other interest rates, which remained very stable at relatively low levels throughout the period (Table 1.1). With a view to protecting retail customers, the global effective interest rate on consumer loans may not exceed the ceiling defined for conventional interest rates (TMIC). The latter correspond to rates charged on consumer loans during the preceding calendar year, plus a 200 basis-point spread. The TMIC rose from 14.2% between 1 April 2008 and 31 March 2009 to 14.4% for the year running from 1 April 2014 to 31 March 2015.
1.3. The period analysed was characterized by a sharp deterioration in the country's public finances, with the budget deficit growing to over 7% of GDP in 2012, before dropping back to around 5% in 2013 and 2014, as a consequence of fiscal reform and the curtailment of operating expenses. Fiscal income slipped back from its end-December 2012 level, owing to a 2.6% fall in customs revenues and domestic tax revenues, which were down by 1.2%. Current expenditure also grew strongly after 2008, mainly owing to consumer subsidies (la compensation). Since 2013, steps have been taken to reduce these subsidies.
1.4. Morocco has two public institutions that intervene in the subsidy system, with a major impact on the country's public finances: the Compensation Fund, which acts to stabilize energy and sugar prices (sugar, oil products, butane gas); and the National Interprofessional Cereals and Pulses Board (ONICL), which subsidizes flour. These measures aim to support the purchasing power of the
1 IMF (2014).2 Morocco accepted Article VIII of the Articles of Agreement of the International Monetary Fund on
21 January 1993.3 Foreign Exchange Board Circular No. 1736 of 24 December 2010.4 Foreign Exchange Board Circular No. 1721 of 1 August 2007.
WT/TPR/S/329 • Kingdom of Morocco
- 14 -
most vulnerable social sectors, specifically by alleviating the impact on consumers of variations in the international prices of these products.
1.5. Recognizing that the increase in these expenses, and borrowing to finance them, aggravate the country's macroeconomic vulnerability and reduce resources available for public investment, the Government introduced reforms in this domain in 2013, by partially indexing the prices of certain petroleum products. It has also engaged in hedging operations to cover any rise in international diesel prices. In 2014-2015, the reform process was continued with a view to total liberalization of the prices of petroleum products (Section 4.4.2).
1.6. Since the 2007 Finance Law, Morocco has had a General Tax Code (CGI), which organizes the various taxes and fiscal incentives much more transparently than before. Nonetheless, this very large Code, of almost 500 pages, could well be simplified. The 1999 tax reform made it possible to reduce the fiscal burden and expand the tax base, by reducing the number of rates and eliminating exemptions; this should be continued.
1.7. The schedule of taxes levied on companies and their revenues is shown in Table 1.2. Income tax (Articles 21 ff. of the CGI) is applicable to the income and profits accruing to natural persons and partnerships, and certain agricultural operations. The top rate was lowered from 42% in 2007 to 38% in 2010, and the tax-free threshold was raised from DH 20,000 in 1999 to DH 30,000 in 2010. Income and corporation tax were phased in for large agricultural undertakings (with a turnover in excess of DH 5 million) under the 2015 Finance Law, in accordance with the ordinary law regime. For the first two years, only farms with a turnover of more than DH 35 million will be affected. Upon expiry of the transition period (end-2019), all agricultural enterprises with a turnover in excess of DH 5 million will be subject to income and corporation tax.
Table 1.2 Corporation tax (IS), 2015Tax rate Entities covered37% Credit institutions and similar organizations, Bank Al-Maghrib, Deposit and Management Fund,
insurance and reinsurance companies30% Normal tax rate17.5% Enterprises that export goods (other than scrap metal) or services, in respect of the value of
export sales, also applicable to enterprises that sell to other enterprises established in the export platforms (Article 6 (I-B-1° and 2°) of the CGI)Hotel enterprises (Article 6 (I-B-3°) of the CGI)Mining enterprises mentioned in Article 6 (I-D-1°) of the CGIEnterprises domiciled and operating in the province of Tangier in respect of the activities specified by decree (Article 6 (I-D-2° and II-C-1°-a) of the CGI)Craft enterprises (Article 6 (II-C-1°-b) of the CGI)Private schools or vocational training entities referred to in Article 6 (II-C-1°-c) of the CGIReal estate developers specified in Article 6 (II-C-2°) of the CGISporting corporations mentioned in Article 6 (II-C-1°-d) aboveAgricultural operations mentioned in Article 6 (II-C-5°) aboveEnterprises setting up in specific regions
10% Companies earning a taxable income ≤ DH 300,000 Optionally, offshore banks in the first 15 consecutive years following the date of approvalRegional or international headquarters or representation offices of non-resident companies with "Casablanca Finance City" status
8.75% Enterprises operating in export free zones, during the 20 consecutive fiscal years following the fifth fiscal year of full exemptionService companies with "Casablanca Finance City" status, after the period of five fiscal years' exemption specified in Article 6 (I-B-4°) of the CGI
0% Enterprises operating in export free zones, during the first five fiscal years of operationService companies with "Casablanca Finance City" status during the first five fiscal years of operationAgricultural enterprises with a turnover of < DH 35 million, in respect of their agricultural sales (Article 6 II-C-5°)
Source: CGI.
1.8. In relation to value added tax (VAT) (Section 3.1.3), the United Nations Conference on Trade and Development (UNCTAD) advised Morocco after 2008 to reduce the number of rates and
WT/TPR/S/329 • Kingdom of Morocco
- 15 -
exemptions and to speed up the reimbursement process.5 The 2014 Finance Law introduced provisions for the repayment of VAT credits, and to combat informal activity. As stressed by the Organisation for Economic Co-operation and Development (OECD), in practice, the taxation of private individuals and corporate entities differs significantly depending on whether the firms are informal, and thus largely escape taxation; or are in the export sector, and thus receive major tax benefits; or are in the non-exporting formal economy, which is heavily taxed.
1.9. With the aim of helping small and particularly very small enterprises to move into the formal sector, the status of self-entrepreneur (autoentrepreneur) was created in January 2015. Although activities eligible for this status are mostly in the crafts sector, trade, small -scale non-automated production and services are also covered. According to the authorities, this status affords many advantages which include the simplification of procedures for setting up a business and cessation of activity; exemption from commercial registration; electronic payment of a specific income tax and exemption from VAT; social coverage; and exemption from seizure of the entrepreneur's main domicile. In October 2015, the Government Council adopted two decrees implementing the relevant law (Decree on the National Committee of Self-Entrepreneurs and Decree on the National Register of Self-Entrepreneurs), along with a third decree which is currently being prepared to cover activities eligible for that status. To encourage entry into the formal sector, the National Agency for the Promotion of Small and Medium-Sized Enterprises (ANPME) finances 50% of expenses relating to the administrative formalities involved in forming a corporate entity or registration in the Register of Self-Entrepreneurs, with a ceiling of DH 2,000 per beneficiary.
1.3 Trade performance
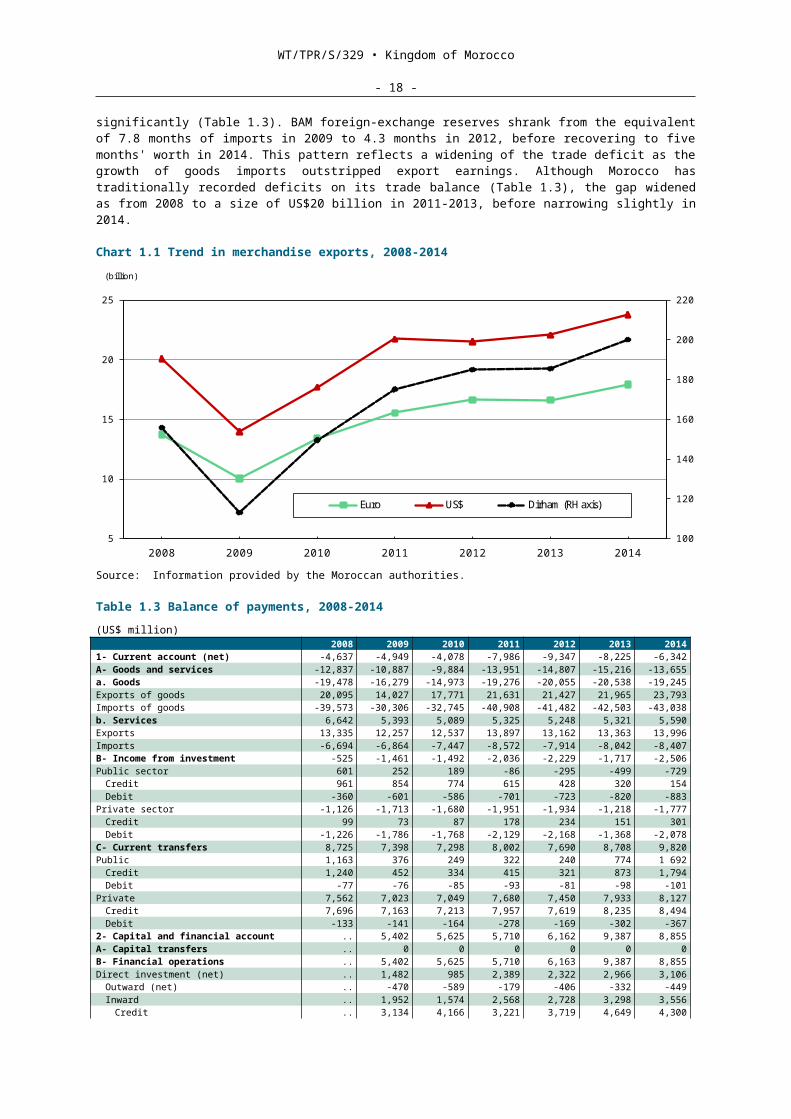
1.1. Financial transfers from Moroccans living abroad were Morocco's main source of foreign exchange in 2014, followed by tourism. Automobile exports have replaced phosphate products as the leading export product. In a study on the effects of the global financial and economic crisis on the Moroccan economy, the Royal Institute of Strategic Studies (IRES) identifies four main channels through which global economic circumstances affect the Moroccan economy: the weakening of foreign demand for Moroccan goods, particularly from the European Union; the drop in tourism revenues; smaller transfers by Moroccans living abroad; and dwindling foreign direct investment (FDI). As Chart 1.1 shows, the recession in the Eurozone in 2009 caused demand for Moroccan exports to plummet.
1.2. After that, in 2009-2014, goods exports regained and then surpassed their 2008 level, with annual growth of 10% in dirham terms. Goods imports grew significantly (Table 1.3). BAM foreign-exchange reserves shrank from the equivalent of 7.8 months of imports in 2009 to 4.3 months in 2012, before recovering to five months' worth in 2014. This pattern reflects a widening of the trade deficit as the growth of goods imports outstripped export earnings. Although Morocco has traditionally recorded deficits on its trade balance (Table 1.3), the gap widened as from 2008 to a size of US$20 billion in 2011-2013, before narrowing slightly in 2014.
5 UNCTAD (2008).
WT/TPR/S/329 • Kingdom of Morocco
- 16 -
Chart 1.1 Trend in merchandise exports, 2008-2014
100
120
140
160
180
200
220
5
10
15
20
25
2008 2009 2010 2011 2012 2013 2014
Euro US$ Dirham (RH axis)
Graphique 1. Evolution des exportations marocaines de marchandises 2008-14
(billion)
I nformation supplied by the Moroccan authoritiesSource:Source: Information provided by the Moroccan authorities.
Table 1.3 Balance of payments, 2008-2014(US$ million) 2008 2009 2010 2011 2012 2013 20141- Current account (net) -4,637 -4,949 -4,078 -7,986 -9,347 -8,225 -6,342A- Goods and services -12,837 -10,887 -9,884 -13,951 -14,807 -15,216 -13,655a. Goods -19,478 -16,279 -14,973 -19,276 -20,055 -20,538 -19,245Exports of goods 20,095 14,027 17,771 21,631 21,427 21,965 23,793Imports of goods -39,573 -30,306 -32,745 -40,908 -41,482 -42,503 -43,038b. Services 6,642 5,393 5,089 5,325 5,248 5,321 5,590Exports 13,335 12,257 12,537 13,897 13,162 13,363 13,996Imports -6,694 -6,864 -7,447 -8,572 -7,914 -8,042 -8,407B- Income from investment -525 -1,461 -1,492 -2,036 -2,229 -1,717 -2,506Public sector 601 252 189 -86 -295 -499 -729
Credit 961 854 774 615 428 320 154Debit -360 -601 -586 -701 -723 -820 -883
Private sector -1,126 -1,713 -1,680 -1,951 -1,934 -1,218 -1,777Credit 99 73 87 178 234 151 301Debit -1,226 -1,786 -1,768 -2,129 -2,168 -1,368 -2,078
C- Current transfers 8,725 7,398 7,298 8,002 7,690 8,708 9,820Public 1,163 376 249 322 240 774 1 692
Credit 1,240 452 334 415 321 873 1,794Debit -77 -76 -85 -93 -81 -98 -101
Private 7,562 7,023 7,049 7,680 7,450 7,933 8,127Credit 7,696 7,163 7,213 7,957 7,619 8,235 8,494Debit -133 -141 -164 -278 -169 -302 -367
2- Capital and financial account .. 5,402 5,625 5,710 6,162 9,387 8,855A- Capital transfers .. 0 0 0 0 0 0B- Financial operations .. 5,402 5,625 5,710 6,163 9,387 8,855Direct investment (net) .. 1,482 985 2,389 2,322 2,966 3,106
Outward (net) .. -470 -589 -179 -406 -332 -449Inward .. 1,952 1,574 2,568 2,728 3,298 3,556
Credit .. 3,134 4,166 3,221 3,719 4,649 4,300Debit .. -1,182 -2,592 -653 -991 -1,351 -744
Portfolio investment (net) .. -18 89 -233 109 519 178Other investment (net) .. 1,579 2,043 1,865 976 2,781 1,136Net public-sector borrowing .. 2,359 2,507 1,689 2,755 3,121 4,435Public-sector drawings .. 3,489 3,772 3,156 4,346 4,901 6,238
Of which Treasury .. 1,869 2,558 1,725 2,683 2,738 2,088Public-sector amortization .. -1,130 -1,265 -1,467 -1,590 -1,780 -1,804
Of which Treasury .. -615 -677 -825 -915 -952 -998Reserve assets .. 64 -1,206 2,632 3,470 -1,399 -3,175Statistical discrepancy .. -517 -341 -356 -286 237 661
.. Not available.Source: Information provided by the Moroccan authorities.
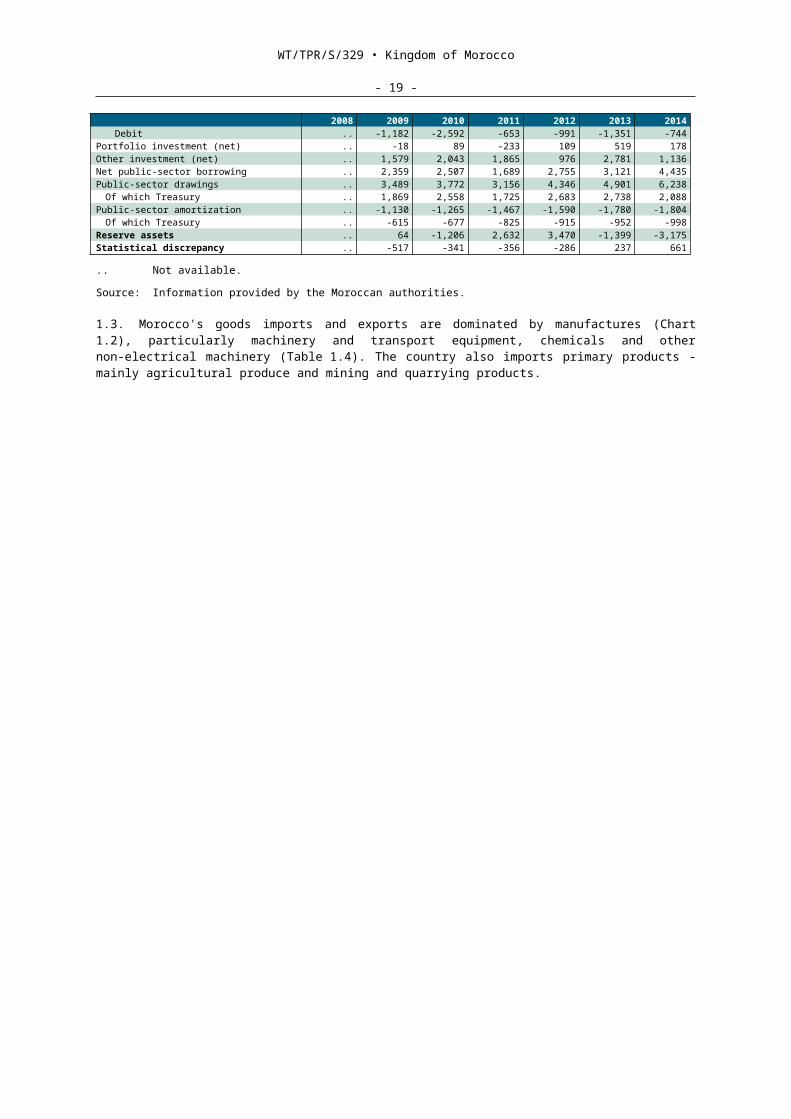
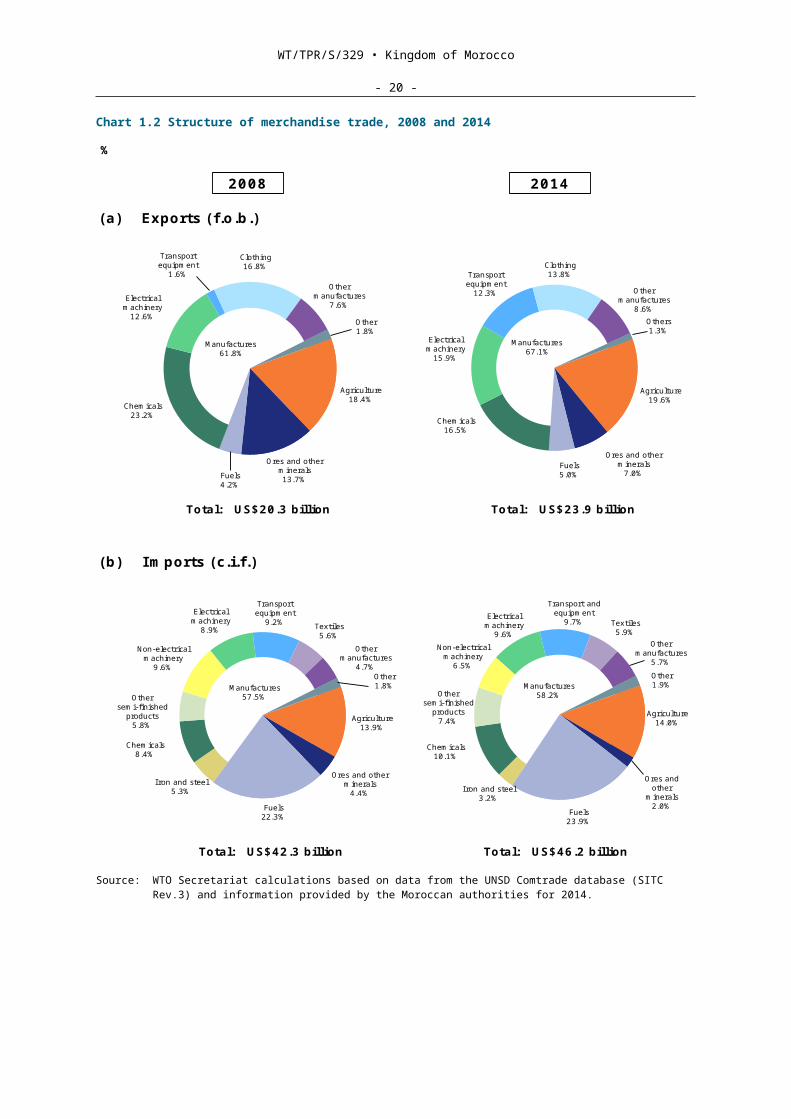
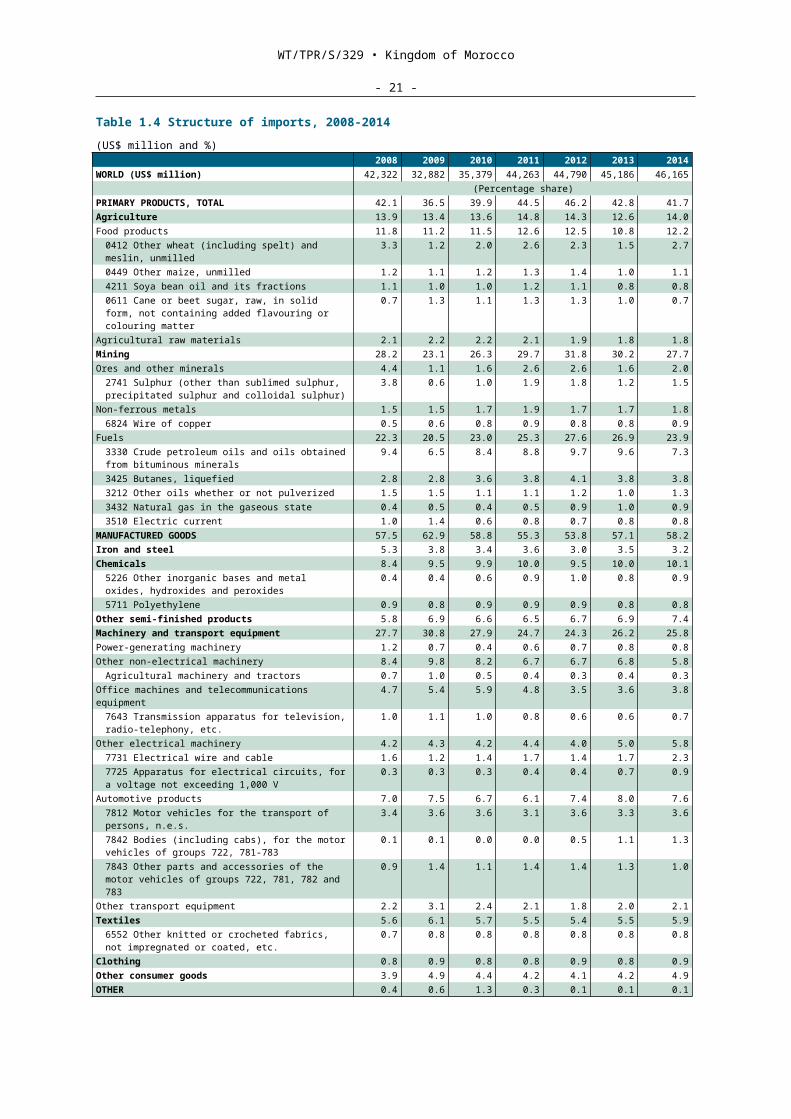
1.3. Morocco's goods imports and exports are dominated by manufactures (Chart 1.2), particularly machinery and transport equipment, chemicals and other non-electrical machinery (Table 1.4). The
WT/TPR/S/329 • Kingdom of Morocco
- 17 -
country also imports primary products - mainly agricultural produce and mining and quarrying products.
Chart 1.2 Structure of merchandise trade, 2008 and 2014
Graphique 1.2Structure du commerce des marchandises, 2008 et 2014
2008 2014
(a) Exports (f.o.b.)
Fuels5.0%
Others1.3%
Electrical machinery
15.9%
Ores and other minerals
7.0%
Clothing13.8%
Chemicals16.5%
Agriculture19.6%
Manufactures67.1%
Other manufactures
8.6%
Transport equipment
12.3%
Total: US$20.3 billion Total: US$23.9 billion
(b) I mports (c.i.f.)
Fuels22.3%
Agriculture 13.9%
Manufactures57.5%
Non-electrical machinery
9.6%
Othersemi-finished
products5.8%
Other1.8%
Chemicals8.4%
Textiles5.6%
Other manufactures
4.7%
Ores and other minerals
4.4%Iron and steel
5.3%
Electrical machinery
8.9%
Transport equipment
9.2%
Fuels23.9%
Agriculture 14.0%
Manufactures58.2%
Non-electrical machinery
6.5%
Othersemi-finished
products7.4%
Other1.9%
Chemicals10.1%
Textiles5.9%
Other manufactures
5.7%
Ores and other
minerals2.0%
Iron and steel3.2%
Electrical machinery
9.6%
Transport and equipment
9.7%
Total: US$42.3 billion Total: US$46.2 billion
%
Calculs du Secrétariat de l'OMC basés sur les données issues de la base de dnnées Comtrade (CTCI Rev.3) de la DSNU et les données fournies par les autorités du Maroc pour 2014.
Fuels4.2%
Source:
Other1.8%
Electrical machinery
12.6%
Ores and other minerals13.7%
Clothing16.8%
Chemicals23.2%
Agriculture18.4%
Manufactures61.8%
Other manufactures
7.6%
Transport equipment
1.6%
Source: WTO Secretariat calculations based on data from the UNSD Comtrade database (SITC Rev.3) and information provided by the Moroccan authorities for 2014.
WT/TPR/S/329 • Kingdom of Morocco
- 18 -
Table 1.4 Structure of imports, 2008-2014(US$ million and %)
2008 2009 2010 2011 2012 2013 2014WORLD (US$ million) 42,322 32,882 35,379 44,263 44,790 45,186 46,165
(Percentage share)PRIMARY PRODUCTS, TOTAL 42.1 36.5 39.9 44.5 46.2 42.8 41.7Agriculture 13.9 13.4 13.6 14.8 14.3 12.6 14.0Food products 11.8 11.2 11.5 12.6 12.5 10.8 12.2
0412 Other wheat (including spelt) and meslin, unmilled
3.3 1.2 2.0 2.6 2.3 1.5 2.7
0449 Other maize, unmilled 1.2 1.1 1.2 1.3 1.4 1.0 1.14211 Soya bean oil and its fractions 1.1 1.0 1.0 1.2 1.1 0.8 0.80611 Cane or beet sugar, raw, in solid form, not containing added flavouring or colouring matter
0.7 1.3 1.1 1.3 1.3 1.0 0.7
Agricultural raw materials 2.1 2.2 2.2 2.1 1.9 1.8 1.8Mining 28.2 23.1 26.3 29.7 31.8 30.2 27.7Ores and other minerals 4.4 1.1 1.6 2.6 2.6 1.6 2.0
2741 Sulphur (other than sublimed sulphur, precipitated sulphur and colloidal sulphur)
3.8 0.6 1.0 1.9 1.8 1.2 1.5
Non-ferrous metals 1.5 1.5 1.7 1.9 1.7 1.7 1.86824 Wire of copper 0.5 0.6 0.8 0.9 0.8 0.8 0.9
Fuels 22.3 20.5 23.0 25.3 27.6 26.9 23.93330 Crude petroleum oils and oils obtained from bituminous minerals
9.4 6.5 8.4 8.8 9.7 9.6 7.3
3425 Butanes, liquefied 2.8 2.8 3.6 3.8 4.1 3.8 3.83212 Other oils whether or not pulverized 1.5 1.5 1.1 1.1 1.2 1.0 1.33432 Natural gas in the gaseous state 0.4 0.5 0.4 0.5 0.9 1.0 0.93510 Electric current 1.0 1.4 0.6 0.8 0.7 0.8 0.8
MANUFACTURED GOODS 57.5 62.9 58.8 55.3 53.8 57.1 58.2Iron and steel 5.3 3.8 3.4 3.6 3.0 3.5 3.2Chemicals 8.4 9.5 9.9 10.0 9.5 10.0 10.1
5226 Other inorganic bases and metal oxides, hydroxides and peroxides
0.4 0.4 0.6 0.9 1.0 0.8 0.9
5711 Polyethylene 0.9 0.8 0.9 0.9 0.9 0.8 0.8Other semi-finished products 5.8 6.9 6.6 6.5 6.7 6.9 7.4Machinery and transport equipment 27.7 30.8 27.9 24.7 24.3 26.2 25.8Power-generating machinery 1.2 0.7 0.4 0.6 0.7 0.8 0.8Other non-electrical machinery 8.4 9.8 8.2 6.7 6.7 6.8 5.8
Agricultural machinery and tractors 0.7 1.0 0.5 0.4 0.3 0.4 0.3Office machines and telecommunications equipment 4.7 5.4 5.9 4.8 3.5 3.6 3.8
7643 Transmission apparatus for television, radio-telephony, etc.
1.0 1.1 1.0 0.8 0.6 0.6 0.7
Other electrical machinery 4.2 4.3 4.2 4.4 4.0 5.0 5.87731 Electrical wire and cable 1.6 1.2 1.4 1.7 1.4 1.7 2.37725 Apparatus for electrical circuits, for a voltage not exceeding 1,000 V
0.3 0.3 0.3 0.4 0.4 0.7 0.9
Automotive products 7.0 7.5 6.7 6.1 7.4 8.0 7.67812 Motor vehicles for the transport of persons, n.e.s.
3.4 3.6 3.6 3.1 3.6 3.3 3.6
7842 Bodies (including cabs), for the motor vehicles of groups 722, 781-783
0.1 0.1 0.0 0.0 0.5 1.1 1.3
7843 Other parts and accessories of the motor vehicles of groups 722, 781, 782 and 783
0.9 1.4 1.1 1.4 1.4 1.3 1.0
Other transport equipment 2.2 3.1 2.4 2.1 1.8 2.0 2.1Textiles 5.6 6.1 5.7 5.5 5.4 5.5 5.9
6552 Other knitted or crocheted fabrics, not impregnated or coated, etc.
0.7 0.8 0.8 0.8 0.8 0.8 0.8
Clothing 0.8 0.9 0.8 0.8 0.9 0.8 0.9Other consumer goods 3.9 4.9 4.4 4.2 4.1 4.2 4.9OTHER 0.4 0.6 1.3 0.3 0.1 0.1 0.1
Source: WTO Secretariat calculations based on data from the UNSD Comtrade database (SITC Rev.3) and information provided by the Moroccan authorities for 2014.
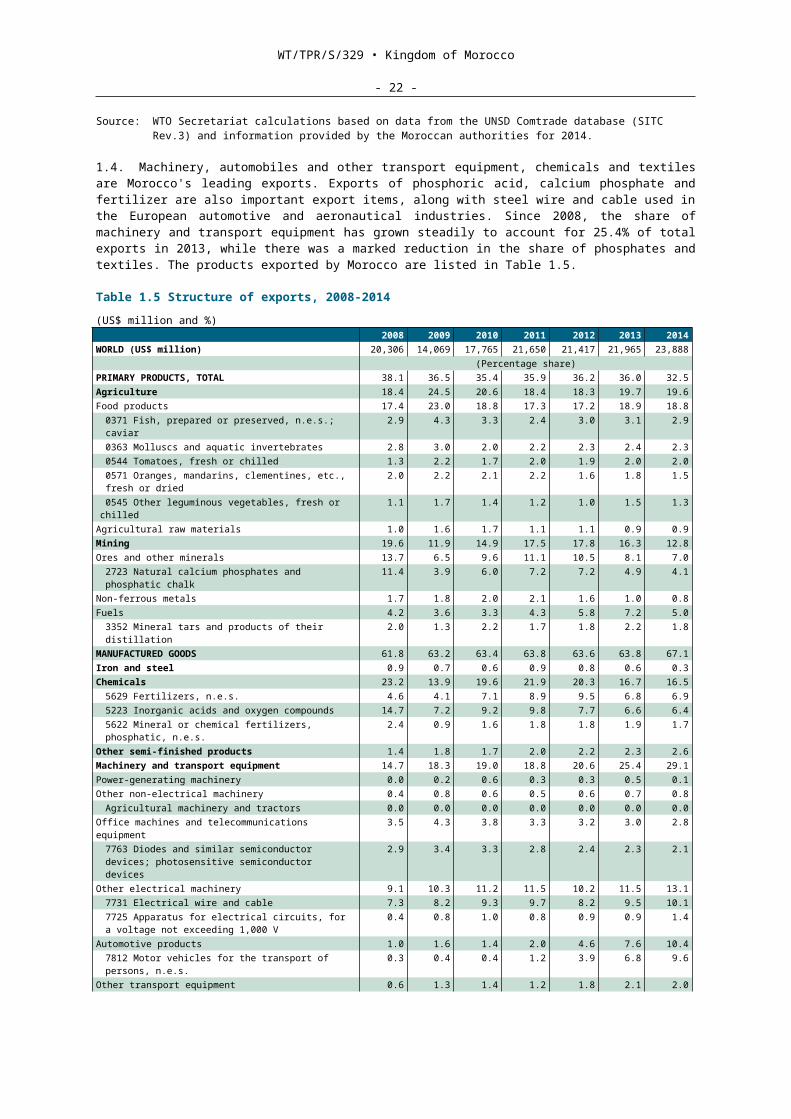
1.4. Machinery, automobiles and other transport equipment, chemicals and textiles are Morocco's leading exports. Exports of phosphoric acid, calcium phosphate and fertilizer are also important export items, along with steel wire and cable used in the European automotive and aeronautical industries. Since 2008, the share of machinery and transport equipment has grown steadily to account for 25.4% of total exports in 2013, while there was a marked reduction in the share of phosphates and textiles. The products exported by Morocco are listed in Table 1.5.
WT/TPR/S/329 • Kingdom of Morocco
- 19 -
Table 1.5 Structure of exports, 2008-2014(US$ million and %)
2008 2009 2010 2011 2012 2013 2014WORLD (US$ million) 20,306 14,069 17,765 21,650 21,417 21,965 23,888
(Percentage share)PRIMARY PRODUCTS, TOTAL 38.1 36.5 35.4 35.9 36.2 36.0 32.5Agriculture 18.4 24.5 20.6 18.4 18.3 19.7 19.6Food products 17.4 23.0 18.8 17.3 17.2 18.9 18.8
0371 Fish, prepared or preserved, n.e.s.; caviar 2.9 4.3 3.3 2.4 3.0 3.1 2.90363 Molluscs and aquatic invertebrates 2.8 3.0 2.0 2.2 2.3 2.4 2.30544 Tomatoes, fresh or chilled 1.3 2.2 1.7 2.0 1.9 2.0 2.00571 Oranges, mandarins, clementines, etc., fresh or dried
2.0 2.2 2.1 2.2 1.6 1.8 1.5
0545 Other leguminous vegetables, fresh or chilled 1.1 1.7 1.4 1.2 1.0 1.5 1.3Agricultural raw materials 1.0 1.6 1.7 1.1 1.1 0.9 0.9Mining 19.6 11.9 14.9 17.5 17.8 16.3 12.8Ores and other minerals 13.7 6.5 9.6 11.1 10.5 8.1 7.0
2723 Natural calcium phosphates and phosphatic chalk
11.4 3.9 6.0 7.2 7.2 4.9 4.1
Non-ferrous metals 1.7 1.8 2.0 2.1 1.6 1.0 0.8Fuels 4.2 3.6 3.3 4.3 5.8 7.2 5.0
3352 Mineral tars and products of their distillation 2.0 1.3 2.2 1.7 1.8 2.2 1.8MANUFACTURED GOODS 61.8 63.2 63.4 63.8 63.6 63.8 67.1Iron and steel 0.9 0.7 0.6 0.9 0.8 0.6 0.3Chemicals 23.2 13.9 19.6 21.9 20.3 16.7 16.5
5629 Fertilizers, n.e.s. 4.6 4.1 7.1 8.9 9.5 6.8 6.95223 Inorganic acids and oxygen compounds 14.7 7.2 9.2 9.8 7.7 6.6 6.45622 Mineral or chemical fertilizers, phosphatic, n.e.s.
2.4 0.9 1.6 1.8 1.8 1.9 1.7
Other semi-finished products 1.4 1.8 1.7 2.0 2.2 2.3 2.6Machinery and transport equipment 14.7 18.3 19.0 18.8 20.6 25.4 29.1Power-generating machinery 0.0 0.2 0.6 0.3 0.3 0.5 0.1Other non-electrical machinery 0.4 0.8 0.6 0.5 0.6 0.7 0.8
Agricultural machinery and tractors 0.0 0.0 0.0 0.0 0.0 0.0 0.0Office machines and telecommunications equipment 3.5 4.3 3.8 3.3 3.2 3.0 2.8
7763 Diodes and similar semiconductor devices; photosensitive semiconductor devices
2.9 3.4 3.3 2.8 2.4 2.3 2.1
Other electrical machinery 9.1 10.3 11.2 11.5 10.2 11.5 13.17731 Electrical wire and cable 7.3 8.2 9.3 9.7 8.2 9.5 10.17725 Apparatus for electrical circuits, for a voltage not exceeding 1,000 V
0.4 0.8 1.0 0.8 0.9 0.9 1.4
Automotive products 1.0 1.6 1.4 2.0 4.6 7.6 10.47812 Motor vehicles for the transport of persons, n.e.s.
0.3 0.4 0.4 1.2 3.9 6.8 9.6
Other transport equipment 0.6 1.3 1.4 1.2 1.8 2.1 2.07929 Parts, n.e.s. (not including tyres, engines and electrical parts), of the goods of group 792
0.3 1.0 0.9 1.0 0.9 1.6 1.6
Textiles 1.6 2.2 1.9 1.9 1.7 1.7 1.8Clothing 16.8 21.9 16.9 15.1 15.1 14.4 13.8
8426 Women's trousers, etc., not knitted or crocheted
2.4 3.1 2.4 2.0 2.0 2.1 1.8
8414 Men's trousers, etc., not knitted or crocheted 2.1 2.5 1.9 1.4 1.6 1.3 1.28454 T-shirts, singlets and other vests, knitted or crocheted
1.4 1.7 1.5 1.5 1.3 1.2 1.1
8427 Women's or girls' blouses, shirts and shirt-blouses, not knitted or crocheted
1.2 1.4 0.9 0.9 0.9 1.0 1.1
8442 Suits, ensembles, jackets, blazers, dresses, skirts, trousers, bib and brace overalls, etc.
0.6 1.2 1.1 1.1 1.1 1.2 1.0
Other consumer goods 3.2 4.4 3.7 3.1 2.9 2.9 3.0OTHER 0.1 0.3 1.2 0.3 0.2 0.1 0.4
Source: WTO Secretariat calculations based on data from the UNSD Comtrade database (SITC Rev.3) and information provided by the Moroccan authorities for 2014.
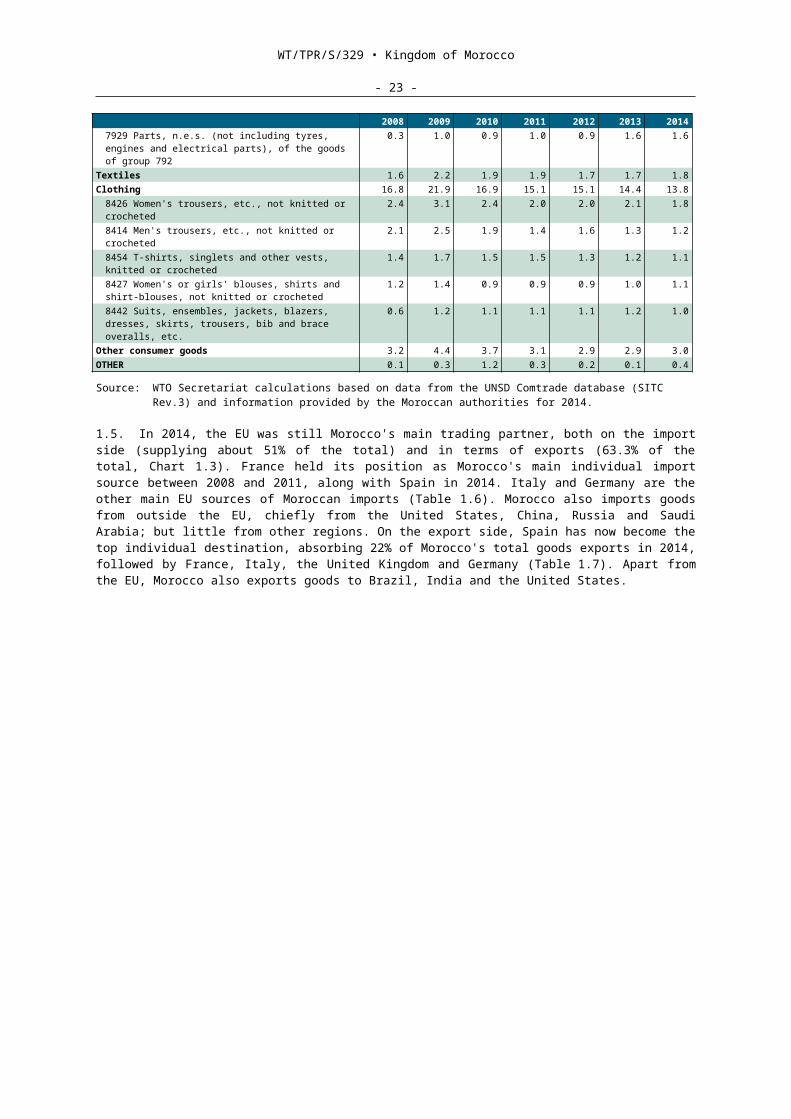
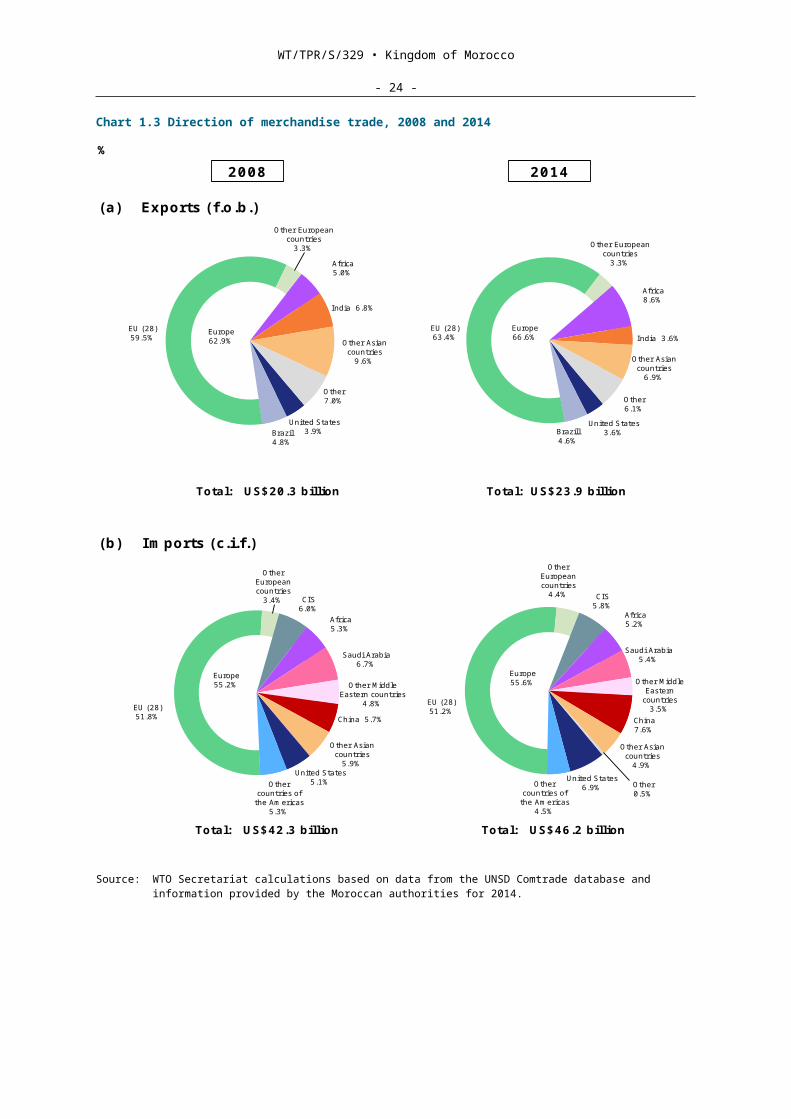
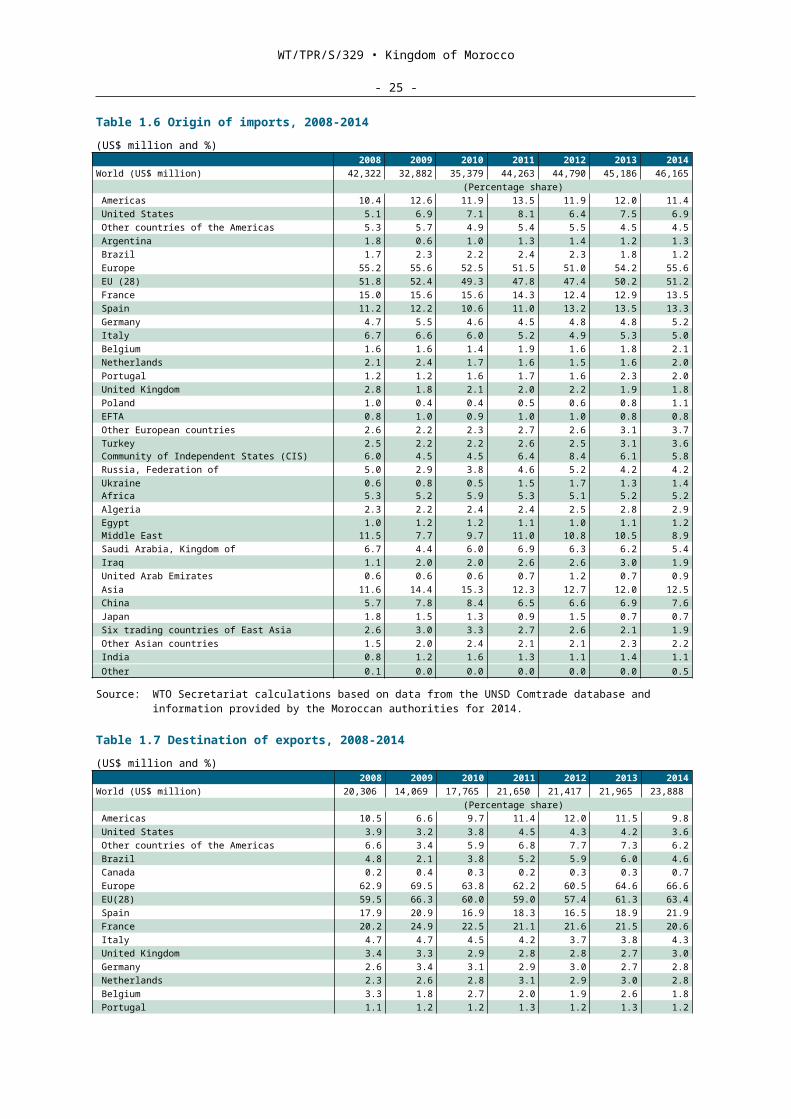
1.5. In 2014, the EU was still Morocco's main trading partner, both on the import side (supplying about 51% of the total) and in terms of exports (63.3% of the total, Chart 1.3). France held its position as Morocco's main individual import source between 2008 and 2011, along with Spain in 2014. Italy and Germany are the other main EU sources of Moroccan imports (Table 1.6). Morocco also imports goods from outside the EU, chiefly from the United States, China, Russia and Saudi Arabia; but little from other regions. On the export side, Spain has now become the top individual destination, absorbing 22% of Morocco's total goods exports in 2014, followed by France, Italy, the United Kingdom and Germany (Table 1.7). Apart from the EU, Morocco also exports goods to Brazil, India and the United States.
WT/TPR/S/329 • Kingdom of Morocco
- 20 -
Chart 1.3 Direction of merchandise trade, 2008 and 2014
2008 2014
(a) Exports (f.o.b.)
Africa8.6%
Other6.1%
Europe66.6%
Other Asian countries
6.9%
EU (28)63.4% India 3.6%
United States3.6%Brazill
4.6%
Other European countries
3.3%
Total: US$20.3 billion Total: US$23.9 billion
(b) Imports (c.i.f.)
EU (28)51.8% China 5.7%
Other European countries
3.4%
Other Asian countries
5.9%United States
5.1%
Saudi Arabia6.7%
Other Middle Eastern countries
4.8%
Other countries of
the Americas 5.3%
Europe55.2%
Africa5.3%
CIS6.0%
EU (28)51.2%
China 7.6%
Other European countries
4.4%
Other Asian countries
4.9%United States
6.9%
Saudi Arabia5.4%
Other Middle Eastern
countries3.5%
Other countries of
the Americas 4.5%
Europe55.6%
Africa5.2%
CIS5.8%
Other0.5%
Total: US$42.3 billion Total: US$46.2 billion
%
Africa5.0%
Other7.0%
Europe62.9% Other Asian
countries9.6%
EU (28)59.5%
India 6.8%
United States3.9%Brazil
4.8%
Other European countries
3.3%
Source: WTO Secretariat calculations based on data from the UNSD Comtrade database and information provided by the Moroccan authorities for 2014.
WT/TPR/S/329 • Kingdom of Morocco
- 21 -
Table 1.6 Origin of imports, 2008-2014(US$ million and %)
2008 2009 2010 2011 2012 2013 2014World (US$ million) 42,322 32,882 35,379 44,263 44,790 45,186 46,165
(Percentage share) Americas 10.4 12.6 11.9 13.5 11.9 12.0 11.4 United States 5.1 6.9 7.1 8.1 6.4 7.5 6.9 Other countries of the Americas 5.3 5.7 4.9 5.4 5.5 4.5 4.5 Argentina 1.8 0.6 1.0 1.3 1.4 1.2 1.3 Brazil 1.7 2.3 2.2 2.4 2.3 1.8 1.2 Europe 55.2 55.6 52.5 51.5 51.0 54.2 55.6 EU (28) 51.8 52.4 49.3 47.8 47.4 50.2 51.2 France 15.0 15.6 15.6 14.3 12.4 12.9 13.5 Spain 11.2 12.2 10.6 11.0 13.2 13.5 13.3 Germany 4.7 5.5 4.6 4.5 4.8 4.8 5.2 Italy 6.7 6.6 6.0 5.2 4.9 5.3 5.0 Belgium 1.6 1.6 1.4 1.9 1.6 1.8 2.1 Netherlands 2.1 2.4 1.7 1.6 1.5 1.6 2.0 Portugal 1.2 1.2 1.6 1.7 1.6 2.3 2.0 United Kingdom 2.8 1.8 2.1 2.0 2.2 1.9 1.8 Poland 1.0 0.4 0.4 0.5 0.6 0.8 1.1 EFTA 0.8 1.0 0.9 1.0 1.0 0.8 0.8 Other European countries 2.6 2.2 2.3 2.7 2.6 3.1 3.7 Turkey Community of Independent States (CIS)
2.56.0
2.24.5
2.24.5
2.66.4
2.58.4
3.16.1
3.65.8
Russia, Federation of 5.0 2.9 3.8 4.6 5.2 4.2 4.2 Ukraine Africa
0.65.3
0.85.2
0.55.9
1.55.3
1.75.1
1.35.2
1.45.2
Algeria 2.3 2.2 2.4 2.4 2.5 2.8 2.9 Egypt Middle East
1.011.5
1.27.7
1.29.7
1.111.0
1.010.8
1.110.5
1.28.9
Saudi Arabia, Kingdom of 6.7 4.4 6.0 6.9 6.3 6.2 5.4 Iraq 1.1 2.0 2.0 2.6 2.6 3.0 1.9 United Arab Emirates 0.6 0.6 0.6 0.7 1.2 0.7 0.9 Asia 11.6 14.4 15.3 12.3 12.7 12.0 12.5 China 5.7 7.8 8.4 6.5 6.6 6.9 7.6 Japan 1.8 1.5 1.3 0.9 1.5 0.7 0.7 Six trading countries of East Asia 2.6 3.0 3.3 2.7 2.6 2.1 1.9 Other Asian countries 1.5 2.0 2.4 2.1 2.1 2.3 2.2 India 0.8 1.2 1.6 1.3 1.1 1.4 1.1 Other 0.1 0.0 0.0 0.0 0.0 0.0 0.5
Source: WTO Secretariat calculations based on data from the UNSD Comtrade database and information provided by the Moroccan authorities for 2014.
Table 1.7 Destination of exports, 2008-2014(US$ million and %)
2008 2009 2010 2011 2012 2013 2014World (US$ million) 20,306 14,069 17,765 21,650 21,417 21,965 23,888
(Percentage share) Americas 10.5 6.6 9.7 11.4 12.0 11.5 9.8 United States 3.9 3.2 3.8 4.5 4.3 4.2 3.6 Other countries of the Americas 6.6 3.4 5.9 6.8 7.7 7.3 6.2 Brazil 4.8 2.1 3.8 5.2 5.9 6.0 4.6 Canada 0.2 0.4 0.3 0.2 0.3 0.3 0.7 Europe 62.9 69.5 63.8 62.2 60.5 64.6 66.6 EU(28) 59.5 66.3 60.0 59.0 57.4 61.3 63.4 Spain 17.9 20.9 16.9 18.3 16.5 18.9 21.9 France 20.2 24.9 22.5 21.1 21.6 21.5 20.6 Italy 4.7 4.7 4.5 4.2 3.7 3.8 4.3 United Kingdom 3.4 3.3 2.9 2.8 2.8 2.7 3.0 Germany 2.6 3.4 3.1 2.9 3.0 2.7 2.8 Netherlands 2.3 2.6 2.8 3.1 2.9 3.0 2.8 Belgium 3.3 1.8 2.7 2.0 1.9 2.6 1.8 Portugal 1.1 1.2 1.2 1.3 1.2 1.3 1.2 Austria 0.4 0.5 0.4 0.4 0.5 0.6 0.8 EFTA 1.8 1.9 1.9 1.6 1.5 1.3 1.0 Other European countries 1.5 1.3 1.9 1.6 1.6 1.9 2.3 Turkey 1.5 1.3 1.9 1.6 1.6 1.9 2.3 Community of independent states (CIS) 1.5 1.4 1.2 1.4 1.4 1.4 1.0 Russia, Federation of 1.5 1.3 1.2 1.2 1.2 1.2 0.9 Africa 5.0 7.3 7.2 6.5 9.3 8.8 8.6 Algeria 0.6 0.9 0.8 1.1 1.1 1.0 0.9 Mauritania 0.3 0.3 0.4 0.5 0.6 0.6 0.8 Middle East 2.2 2.0 2.6 1.4 1.6 1.4 1.6
WT/TPR/S/329 • Kingdom of Morocco
- 22 -
2008 2009 2010 2011 2012 2013 2014 Asia 16.4 12.1 14.4 15.6 13.8 10.9 10.5 China 0.8 1.1 1.4 0.9 1.3 1.6 1.1 Japan 1.1 1.2 0.7 0.7 1.0 1.2 0.9 Six trading countries of East Asia 2.4 2.7 3.2 2.8 2.7 2.0 2.0 Singapore 1.5 1.5 1.9 1.9 1.4 1.3 1.3 Other Asian countries 12.0 7.2 9.1 11.1 8.9 6.1 6.5 India 6.8 5.2 6.1 7.0 5.4 3.7 3.6 Pakistan 2.3 1.3 1.5 2.0 1.6 1.1 1.1 Bangladesh 0.4 0.1 0.4 1.1 0.7 0.4 0.7 Other 1.5 1.2 1.2 1.5 1.4 1.5 1.8
Source: WTO Secretariat calculations based on data from the UNSD Comtrade database and information provided by the Moroccan authorities for 2014.
1.6. Despite the traditionally surplus balance of both transfers (related to income earned by Moroccans living abroad) and services, the current account was in deficit between 2009 and 2014. This shortfall, which first appeared in 2007, grew to a level of US$9.3 billion in 2012 before narrowing in 2013 and 2014.
1.7. Morocco is a net exporter of services, reporting a net positive balance of US$7 billion in 2014 (Table 1.3 and Chart 1.4). Service exports are equivalent to roughly 60% of goods exports in value terms. Unlike the latter, which have grown considerably since 2009, earnings from service exports did not increase significantly between 2009 and 2014.
Chart 1.4 Trade in services, 2008-2014
0
2
4
6
8
10
12
14
16
18
2008
2009
2010
2011
2012
2013
2014
Transport Travel Communication servicesInsurance services Royalties and licence fees Other business servicesGovernment
0
1
2
3
4
5
6
7
8
9
10
2008
2009
2010
2011
2012
2013
2014
Office des changes, information en ligne. Adresse consultée: http:/ / www.oc.gov; and les données de l'année 2014 sont fournis par les autorités.
Source:
Graphique 1.[Morocco]Commerce des services, 2008-2014(US$ billion)
Exports Imports
Source: Foreign Exchange Board; viewed at: http://www.oc.gov. Figures for 2014 provided by the authorities.
1.4 Foreign investment
1.1. Having fallen during the world recession in 2008-2009, foreign direct investment (FDI) flows recovered, albeit unevenly, with a decline to DH 25.2 billion in 2009 followed by an increase of almost DH 10 billion in 2010, and then a new fall to DH 26 million in 2011. The amounts recorded in 2009 and 2011 are less than the average for 2008-2013. In the latter year, Morocco received the Maghreb's largest share of FDI, ranking among the leaders on the African continent. According to preliminary figures, FDI grew by 7.8% in 2014, having attained a level of DH 39 billion (US$4.6 billion) in the previous year (Table 1.8). The robust growth of investment was encouraged inter alia by the pursuit of reforms aimed at improving the business environment (Section 2.1), the launch of infrastructure projects, and the new sectoral policies described in Section 4.
WT/TPR/S/329 • Kingdom of Morocco
- 23 -
Table 1.8 Foreign direct investment inflows, by activity sector and country, 2008-2014(US$ million and %) 2008 2009 2010 2011 2012 2013 2014Total (DH million) 27,963 25,250 35,068 26,060 32,092 39,077 36,460Total (US$ million) 3,608 3,134 4,166 3,221 3,719 4,649 4,032
(Percentage of the total)By sector Industry 6.4 10.8 13.6 23.5 25.5 39.2 27.1 Real estate 32.7 22.0 20.7 31.2 22.8 19.2 29.5 Energy and mining 5.6 0.6 2.2 6.9 17.4 7.0 3.9 Holding companies 7.9 0.7 2.7 4.5 2.6 4.5 5.1 Banks 17.7 25.5 13.0 5.2 5.5 3.8 2.4 Tourism 20.3 11.4 11.6 9.8 5.2 8.5 9.3 Commerce 0.6 0.7 3.5 6.7 4.6 5.1 7.1 Major public works 0.9 0.4 1.2 2.2 2.8 4.8 4.6 Transport 0.6 1.5 1.7 1.2 0.9 2.3 0.6 Telecommunications 0.8 21.2 25.0 1.6 0.2 0.6 0.5 Agriculture 0.1 0.1 0.2 0.4 0.3 0.8 0.4 Fishing 0.1 0.0 0.1 0.1 0.0 0.2 0.1 Insurance 0.7 1.8 0.6 0.6 6.5 0.3 0.4 Surveys .. 0.0 0.2 0.1 0.7 0.3 0.3 Other services 5.3 3.1 3.6 5.5 4.7 3.2 8.3 Miscellaneous 0.1 0.2 0.2 0.6 0.2 0.2 0.4By country of origin France 37.7 51.3 58.4 34.3 38.2 37.3 32.4 United Arab Emirates 16.9 4.6 7.4 17.8 24.3 8.7 12.3 Switzerland 5.9 4.1 4.4 4.6 3.9 7.1 5.2 United Kingdom 4.3 3.9 2.9 3.8 2.4 6.6 5.3 Saudi Arabia, Kingdom of 1.8 1.0 1.7 6.0 3.8 4.9 10.6 Luxembourg .. 0.6 0.2 0.6 0.9 4.8 3.5 United States 3.0 2.9 1.8 4.1 5.8 4.3 7.3 Germany 4.7 2.8 1.9 2.6 1.7 3.4 1.8 Spain 9.4 6.1 5.4 6.6 4.9 2.8 4.0 Netherlands 0.7 0.8 1.6 1.9 3.4 2.2 2.9 Mauritius 0.0 0.0 0.5 0.1 0.9 1.6 0.0 Belgium .. 3.4 3.0 4.4 1.4 1.4 0.0 Qatar 0.5 0.4 0.6 0.4 1.7 1.0 1.4 Other countries 15.1 18.1 10.3 13.0 6.8 13.9 13.3.. Not available.Source: FDI data provided by the authorities. Foreign Exchange Board, online information, financial flows;
viewed at: http://www.oc.gov.ma/portal/content/statistiques-des-%C3%A9changes-ext%C3%A9rieurs/bd/flux-financiers.
1.2. Since 2011, the largest FDI flows have gone to the industrial and real estate sectors. These developments reflect the increasing attractiveness of the Moroccan industrial sector, ahead of other sectors that have traditionally been targeted, such as banking or real estate. In 2008-2013, FDI in industry increased six-fold, and its share of the total grew from 6.4% to 39.2%. The vigorous growth of certain industrial segments, such as agrifood, automobiles, aeronautics and electronics, has favoured the undertaking of large-scale operations.6 Several large groups have recently set up business in Morocco, including the French firms Safran and Renault, and the Canadian company Bombardier.
1.3. France remains Morocco's primary foreign investor, far ahead of the United Arab Emirates, Switzerland and the United Kingdom. Its share even exceeded 50% in 2009 and 2010, before dropping back in 2013 to the level at the start of the review period. In 2013, France's share mainly reflected an increase in Danone's equity stake in the Centrale laitière dairy products group. The United Emirates' share of FDI was also substantially larger in 2011 and 2012, while Spain's share declined throughout the period.
1.4. Morocco is also pursuing a foreign investment policy that basically targets sub-Saharan African countries. Morocco's FDI stock in African countries has increased over the past ten years, outweighing that in European countries between 2006 and 2011 (Chart 1.5). France was the main destination country throughout the period under review, with an FDI stock of US$629 million in 2012, followed in Europe by the United Kingdom. The sub-Saharan African country with the largest
6 French Embassy in Morocco, Regional Economic Service, June 2014.
WT/TPR/S/329 • Kingdom of Morocco
- 24 -
cumulative FDI stock is Mali, with US$260 million in 2012, followed by Côte d'Ivoire and, in smaller amounts, Gabon and Senegal. Over the review period, Egypt was also a major destination for Moroccan FDI.
1.5. According to the Moroccan Capital Investors Association (AMIC), DH 4.9 billion were invested in Morocco in 2014 in 155 enterprises, of which 99 are still in portfolio. Capital investment is currently estimated at around DH 696 million. According to AMIC, the draft law amending and supplementing Law No. 41-05 on Venture Capital Institutions (Section 4.11) improves the legal framework for capital investment activities, and will complete the range of financing alternatives available to enterprises.
Chart 1.5 Stock of Moroccan direct investment abroad, 2004-2013(US$ million)
94 207531 643
924 996 922 978 1,0091,212
303 264
436606
689 742 886 934 1,032
1,167
0
500
1,000
1,500
2,000
2,500
3,000
2004 2005 2006 2007 2008 2009 2010 2011 2012 2013
Africa Europe Other countries
Graphique 1.[Morocco]Stock des investissements directs marocains a l'etranger
Base de données de la CNUCED FDI / TNC. Adresse consultée: http:/ / unctad.org/ en/ Pages/ DIAE/ FDI % 20Statistics/ FDI -Statistics-Bilateral.aspx; et Rapport annuel position financiere exterieure globale 2012, Office des changes.
Source:
(millions de $EU)
Source: UNCTAD FDI/TNC database; viewed at: http://unctad.org/en/Pages/DIAE/FDI Statistics/FDI-Statistics-Bilateral.aspx. Foreign Exchange Board, Rapport annuel sur la position financière extérieure globale 2012 (Annual Report on the global external position 2012).
WT/TPR/S/329 • Kingdom of Morocco
- 25 -
2 TRADE AND INVESTMENT REGIME
2.1 Overview
2.1. A new Constitution was approved by referendum in July 2011 replacing that of 1996 and legislative elections followed on 25 November 2011. The stated aims of this constitutional reform were to strengthen democracy, human rights and individual freedoms, as well as to bolster local and regional administration and expertise. Among the new elements, Article 31 of the new Constitution guarantees every citizen access to a healthy environment, water and to sustainable development. Article 107 enshrines the independence of the judiciary from the legislative and executive branches. The Constitution also contains new provisions on transparency, good governance and the fight against corruption, and expands the remit of the Central Body for the Prevention of Corruption (ICPC) set up in 2008, as well as the powers of the Inspectorate-General of Finance and the Court of Audit.7
2.2. Under the Constitution, the King is the Head of State. He appoints the Head of Government and, on the latter's proposal, also appoints the other members of the Government. He is also empowered to terminate the functions of the Government and to dissolve the Parliament.8 The King signs and ratifies treaties and chairs the Supreme Council of the Judiciary. The King has vested full authority to negotiate and sign treaties in the Minister of Foreign Affairs and Cooperation (MAEC), who may in turn give authority to the other ministries to sign international agreements within their respective areas of competence; for example, to the Ministry of Industry, Trade, Investment and the Digital Economy (MICIEN) and to the Ministry responsible for trade, attached to the former, in the case of trade agreements. At the political level, the MAEC coordinates negotiations on Morocco's external commitments in the economic, trade, financial, social, cultural and technical spheres. The MAEC also conducts negotiations on treaties, conventions, agreements, protocols and other international legal instruments of a political or diplomatic nature.2.3. The King and his Government hold executive power. Legislative power is exercised by the bicameral Parliament, comprising the House of Representatives and the House of Councillors; the Parliament approves Government action, in particular by adopting the laws on finance and budgetary control.9 The King, the Head of Government and the two Chambers are responsible for proposing revisions to the Constitution.10
2.4. The Constitutional Council is charged with verifying the legitimacy of parliamentary elections and referendums as well as the constitutionality of all laws and regulations. It comprises 12 members (six appointed by the King, three by the President of the Chamber of Representatives, and three by the President of the House of Councillors) appointed for a term of nine years.
2.5. The Court of Audit is responsible for overseeing the implementation of finance laws and evaluating the management of entities under its control.11 There are nine regional courts of auditors in operation and they oversee the management of local authorities.12 An Economic, Social and Environmental Council was set up in 2011 under the Constitution. It advises the Government and the two Houses of Parliament, more particularly on the general orientation of Morocco's economy.
2.6. Like other ministries in their respective domains, the Ministry of Foreign Trade (MCE) prepares draft laws on trade policy in cooperation with the other ministries and government agencies concerned.13 An absolute majority of the members of the two Chambers is required for the adoption of all draft and proposed laws. The King must enact any law adopted, within the 30 days following its adoption.
7 ADB (2012).8 Articles 24 to 27 of the Constitution.9 The law on budgetary control records annual financial performance and makes it possible to verify
whether the budget has been implemented in accordance with the approval given and to see whether there are any differences between the estimates and the final figures.
10 Article 103 of the 1996 Constitution.11 In accordance with the Constitution, Law No. 62-99 establishing the Financial Courts Code was
enacted on 13 June 2002. This law expressly lays down the powers, organization and functioning of the Court of Audit as well as the regional courts of audit, and determines the special status of the magistrates of these courts.
12 Under Article 194 of the 2011 Constitution, the regional courts are responsible for checking the accounts and evaluating the management of local governments and their groups.
13 WTO (2009).

WT/TPR/S/329 • Kingdom of Morocco
- 26 -
2.7. Under Moroccan law, international legal instruments, including the WTO Agreements, take precedence over domestic law. Treaties liable to affect constitutional provisions may be signed subject to the necessary constitutional amendments, which must be adopted prior to their ratification. The internal hierarchy of regulations is as follows: the Constitution, laws, decrees, orders, and internal measures (such as circulars or notes). The Dahir is a formal instrument that serves, inter alia, to enact laws and to appoint some senior Government officials as well as the representatives of certain professions such as notaries; it is not part of the strict hierarchy of regulations.2.8. Under the Morocco-United States Free Trade Agreement (FTA), Morocco is required to publish on the website of the General Secretariat of the Government (SGG), for a period of at least 15 days and for public comment, all draft laws, decrees, orders and/or administrative decisions relating to trade, government procurement, investment, e-commerce, intellectual property, the environment and labour matters.14 The SGG website also contains an electronic version of the Official Journal (OJ), as well as a list of all ministries and their Internet addresses.15
2.9. Since its previous TPR in 2009, Morocco has revised or amended much of its legislation on trade or international investment. The main changes are set out in Table 2.1, together with a reference to the sections of this report in which they are dealt with.
Table 2.9 Texts of trade related laws and regulations published since 2008Area (section of the report) Instrument/textNew Constitution (2.1) 2011 ConstitutionStarting a business Law No. 24-10 on general partnerships, limited partnerships, partnerships limited
by shares, limited liability companies and joint venturesVAT, excise duty, customs duty (3.2) Successive finance lawsComputerized online customs database (BADR) delivery note fee (3.2.1)
Circular No. 5221/312 of 17 June 2010 (BADR)
Electronic exchange of legal data (3.1.1) Decree No. 2-08-518 of 21 May 2009Containers (3.2.1) Circular No. 5334/312 of 17 August 2012 and Ministry of the Economy and
Finance (MEF) Circular of September 2012Mark affixed to wood packaging (3.1.3) Order of the Minister of Agriculture and Marine FisheriesAuthorized economic operator Decree No. 2-10-121 of 6 July 2010; MEF Orders Nos. 690.11 and 691.11Management of petrol prices (4.4) Various successive decreesVariable customs duties (3.1.3) Successive decrees amending or suspending the import duty applicable to
common wheat Fisheries (4.2.2) Law No. 15-12 of June 2014 on action to prevent and combat illegal, unreported
and unregulated fishing (IUU) (OJ No. 6262 of 5 June 2014)Law on notaries (4.12.3) Law No. 32-09 on the profession of notaryPublic-private partnership (3.3.1) Law No. 86-12 on public-private partnership contractsCreation of the AMDI (2.4) Law No. 41-08 establishing the Moroccan Investment Agency (AMDI)Creation of the National Agency for the Development of Aquaculture (4.2.1)
Law No. 52-09 of February 2011 establishing the National Agency for the Development of Aquaculture (ANDA)
Trade defence measures(3.1.6) Law No. 15-09 on trade defence measures of June 2011Electricity (4.4.3) Law No. 13-09 removing the ceiling on the capacity of renewable energy
installationsCompetition (3.4.3) Law No. 20-13 on the Competition CouncilPostal services (4.9) Law No. 07-08 transforming Barid Al Maghrib into a public limited company, OJ
No. 5822 of 18 March 2010Consumer protection (3.1.7) Law No. 24-09 on the safety of products and servicesStandardization, certification, accreditation (3.1.7)
Law No. 12-06 of March 2011 on standardization, certification and accreditation, and its implementing Decree No. 2-10-252 of 20 April 2011
SPS controls (3.1.7) Law No. 28-07 on food safety (11 February 2010)Food additives (3.1.7) Joint Order No. 1795-14 of 14 May 2014Maximum residue limits (3.1.7) Joint Order No. 156-14 of 17 January 2014Creation of the ONSSA (3.1.7) Decree No. 2-09-482 (23 November 2009) implementing Law No. 25-08
establishing the National Food Safety BoardImportation of bovine animals and products (3.1.7)
Order No. 2543-09 of 29 October 2009 of the Minister of Agriculture and Marine Fisheries
National SPS Committee (3.1.7) Decree No. 2-10-122 of 06 July 2010 establishing the National Committee on Sanitary and Phytosanitary Measures
14 Decree No. 2-08-229 of 18 June 2009 establishing a procedure for the publication of draft laws and regulations, OJ No. 5744 of 18 June 2009; viewed at: http://81.192.52.100/BO/fr/2009/bo_5744_fr.pdf.
15 SGG website, viewed at: http://www.sgg.gov.ma/Accueil.aspx.
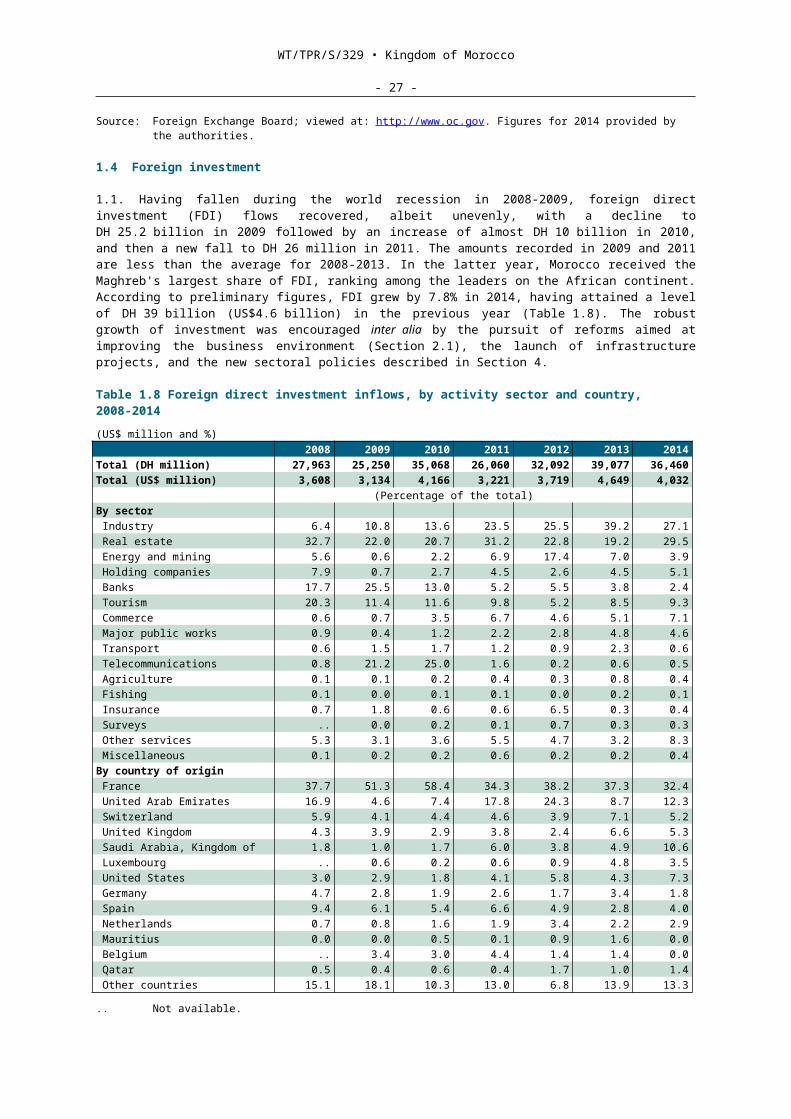
WT/TPR/S/329 • Kingdom of Morocco
- 27 -
Area (section of the report) Instrument/textFood safety (3.1.7) Decree No. 2-10-473 (6 September 2011) implementing certain provisions of Law
No. on food safetyRegulation of cocoa (3.1.7) Decree No. 2-06-517 11 December 2009 regulating the production of and trade in
cocoa, chocolate and their products for human consumptionRegulation of salt (3.1.7) Decree No. 2-08-362 of 28 May 2009 on the iodization of salt for human
consumptionRegulation of vinegar (3.1.7) Decree No. 2-10-385 of 27 May 2011 regulating the manufacture of and trade in
vinegar Regulation of oils (3.1.7) Decree No. 2-14-268 of 29 January 2015 on the quality and safety of olive oils and
olive pomace oils placed on the marketRegulation of tea (3.1.7) Decree No. 2-13-711 of 4 March 2015 on the quality and safety of tea placed on
the marketRegulation of labelling (3.1.7) Decree No. 2-12-389 of 22 April 2013 laying down the conditions and terms for
the labelling of food productsUndesirable substances in animal feed (3.1.7)
Order No. 1490-1413 dated 3 May 2013 of the Minister of Agriculture and Marine Fisheries
Export control (3.2.1) Law No. 61-12 amending and supplementing Law No. 31-86 establishing the Autonomous Export Control and Coordination Agency (15 August 2013)
Government procurement (3.4.1.3) Decree on government procurementIntellectual property (3.3.5) Law No. 23-13 supplementing and amending Law No. 17-97 on the protection of
industrial propertySelf-entrepreneur status (1.3) Law No. 114-13 of January 2015 on the status of self-entrepreneursBanking law (4.11.2) Law No. 103.12 on credit institutions and similar organizationsCasablanca Finance City (4.11) Law No. 44-10 of 2011Venture capital institutions (4.11) Law No. 18-14 amending and supplementing Law No. 41-05 on Venture Capital
Institutions, published in the Official Journal on 19 March 2015
Source: WTO Secretariat.
2.10. The Central Body for the Prevention of Corruption (ICPC) was set up in 2008 with responsibility for coordinating, supervising and monitoring anti-corruption policies. A five-pronged reform of the justice system is also in progress designed to: (i) consolidate guarantees of the independence of the justice system while investing the Supreme Council of the Judiciary with the status of a constitutional body; (ii) modernize rules, in particular those governing business and investment; (iii) upgrade structures and human resources; (iv) enhance the efficiency of the judicial system by eliminating red tape and the complexities currently hampering it; and (v) raise moral standards in the justice system in order to protect against the temptations of corruption and the abuse of power.
2.11. In May 2012 Morocco signed the OECD Declaration on Propriety, Integrity and Transparency in the Conduct of International Business and Finance.16 Transparency International ranked Morocco 80th out of 175 countries in 2014 as regards governance, which was a marked improvement on its 2013 ranking of 91st among 177 countries.17 In 2011, Morocco was the subject of a report under the United Nations Convention against Corruption (UNCAC) following the country's ratification of that Convention in May 2007.18 Published in 2008, the Moroccan Code of Good Corporate Governance Practices was supplemented in 2012 by the Code of Good Governance Practices in State-owned Enterprises and Public Institutions (EEPs).19 These developments will undoubtedly be beneficial to international trade and investment.
2.12. Since its preceding TPR (2009), Morocco has also made significant headway according to the indicators of the World Bank's Doing Business programme, which is testimony to the efforts deployed to improve the business environment, including the creation of the National Committee for Business Environment in 2009. Cross-border trade has improved markedly in terms of time-frames, costs and the number of export and import documents required. There have also been improvements in respect of facilitating access to credit and the payment of taxes, which reflect the significant efforts made by the fiscal administrations. The cost of setting up companies has fallen appreciably. Morocco no longer stipulates a minimum capital requirement for limited liability companies.20 Ownership transfers nonetheless remain costly, and there has been no improvement in this regard; the cost of raising loans is still high by international standards.
16 OECD (2013).17 Viewed at: http://www.transparency.org/country/#MAR.18 Viewed at: http://www.transparency.org/files/content/publication/96-civil-society-review-morocco-
2011.pdf.19 Circular No. 3/2012 of 19 March 2012. Websites also viewed:
http://www.ecgi.org/codes/documents/morocco_code_march2008_fr.pdf and http://www.finances.gov.ma/Docs/2013/depp/Codegouvernance_fran%C3%A7ais.pdf.
WT/TPR/S/329 • Kingdom of Morocco
- 28 -
2.13. The country ranks 77th out of 148 countries (73rd out of 133 countries in 2009) in the World Economic Forum ranking21, which identifies excessive bureaucracy as the main constraint on the private sector. The report underlines the need to press ahead with reforms, more specifically in the following areas: (i) protection of intellectual property (in which Morocco ranked 90 th out of 148); (ii) innovation (106th); (iii) labour market regulation (122nd); and (iv) the quality of higher education (102nd).
2.2 Trade policy objectives
2.1. As of the early 1990s the Moroccan Government resolutely began opening up its economy internationally so as to attract outside investment and promote exports while gradually liberalizing imports. This opening to foreign partners has been evident in most of Morocco's leading production sectors, especially in industry (Section 4.5), tourism (4.7), and in the sectors of transport (4.6), mining (4.3) and energy (4.4). The Green Morocco Plan (Section 4.1), which aims to foster export-oriented and environmentally sustainable agriculture, also shields the sector from foreign competition.
2.2. A number of infrastructure development projects (ports, roads, telecommunications) were also launched or completed during the period 2009-2014, and have positively impacted international trade and investment. The appreciable increase in foreign direct investment (FDI), especially in 2013, (Section 1.4) would suggest that Morocco's foreign partners have taken this policy on board.
2.3. Morocco has liberalized its trade mainly with the European Union, then with the United States. Its stated aims are to be part of the regional integration and trade cooperation process, together with the African and Arab countries in particular. Accordingly, Morocco is one of the countries having concluded the largest number of bilateral and regional free trade agreements (Table 2.2). The WTO framework provides a package of multilateral rules and disciplines for Moroccan trade policy, and they will serve as reference points for these bilateral agreements.
Table 2.10 List of regional trade agreements concluded by Morocco, 2015
Parties and agreement Effective dateCoverage of
the Agreement
Notification to the WTOYear Legal provision
Morocco - United States 01.01.06 Goods & services
2005 GATT Article XXIV & GATS Article V
Morocco – Turkey 01.01.06 Goods 2006 GATT Article XXIVMorocco - European Union 01.03.00 Goods 2000 GATT Article XXIVNew agricultural protocols (in the form of an exchange of letters with the EU)
01.10.12 Goods ..
Morocco - European Free Trade Association (EFTA)
01.12.99 Goods 2000 GATT Article XXIV
Agreement establishing the Greater Arab Free Trade Area (GAFTA)
01.01.98 Goods 2006 GATT Article XXIV
Global System of Trade Preferences among Developing Countries (GSTP)
19.04.89 Goods 1989 Enabling clause
Agadir Agreement 06.07.06 Goods Not notifiedMorocco - United Arab Emirates 09.07.03 Goods Not notifiedMorocco – Tunisia 16.03.99 Goods Not notifiedArab Maghreb Union Non-operational Goods Not notified
.. Not available.Source: WTO Secretariat, Regional Trade Agreements database,
http://rtais.wto.org/UI/PublicMaintainRTAHome.aspx.
2.3 Trade agreements and arrangements
2.3.1 World Trade Organization (WTO)
2.1. Morocco is an original WTO Member and observed the Organization's 20th anniversary by hosting an African Ministerial and Parliamentary Conference in Marrakesh in April 2015. The
20 Law No. 24-10 amending and supplementing Law No. 5-96 on general partnerships, limited partnerships, partnerships limited by shares, limited liability companies and joint ventures (Article 46); viewed at: http://adala.justice.gov.ma/production/html/Fr/liens/..%5C173580.htm.
21 WEF (2014).
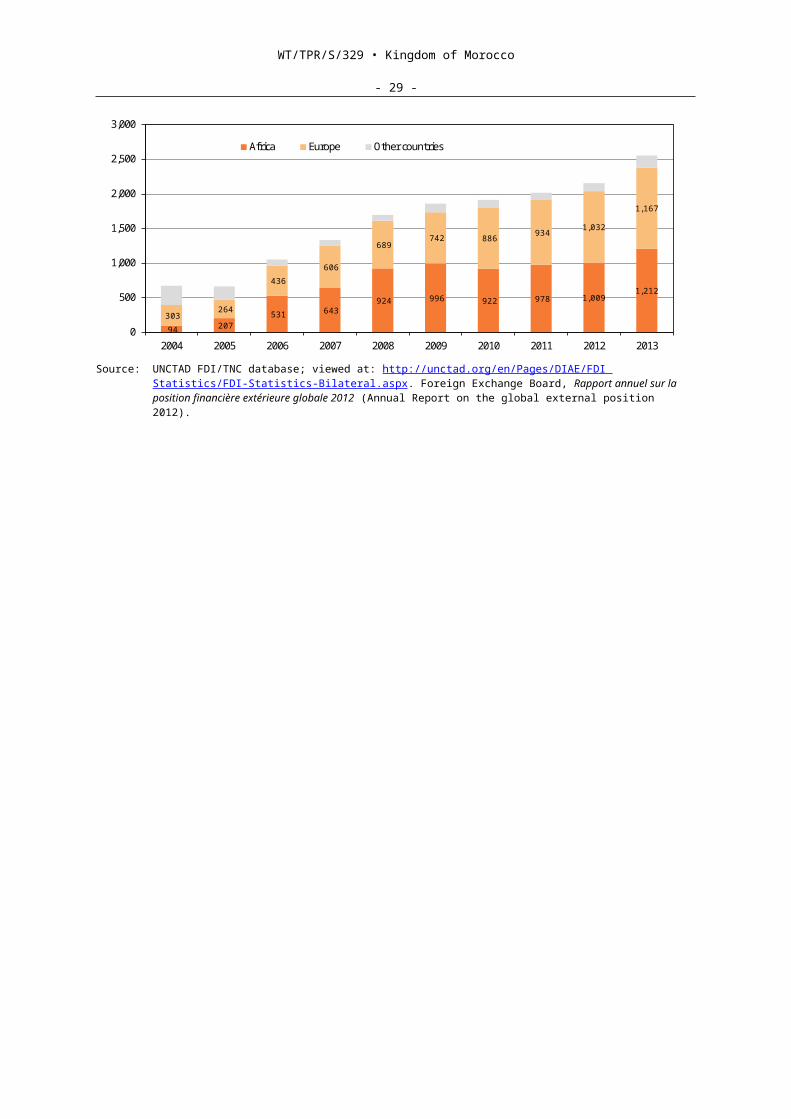
WT/TPR/S/329 • Kingdom of Morocco
- 29 -
Protocol of Amendment to insert the Agreement on Trade Facilitation into Annex 1A of the WTO Agreement was adopted in November 2014.22 Morocco was in the process of ratifying it in 2015. Morocco had not previously signed any plurilateral agreement or any of the protocols and agreements concluded under the WTO; Table 2.3 shows Morocco's main notifications to the WTO.
Table 2.11 Morocco's notifications to the WTO, 2009-2014
Agreement/Decision Document symbol and date of the most recent notification Description of notification
Agreement on AgricultureArticle 18.2 G/AG/N/MAR/39, 06/05/2014; G/AG/N/MAR/35, 09/01/2012 Tariff quotasArticles 10 and 18.2 G/AG/N/MAR/40, 06/05/2014; G/AG/N/MAR/34, 09/01/2012 Export subsidiesArticles 5.7 and 18.2 G/AG/N/MAR/38, 05/05/2014; G/AG/N/MAR/36, 09/01/2012 Special safeguardArticle 18.2 G/AG/N/MAR/37, 27/03/2012 Domestic supportAgreement on import licensing proceduresArticles 1.4(a) and 8.2(b) G/LIC/N/1/MAR/7 and G/LIC/N/1/MAR/8, 20/06/2014; G/LIC/N/1/MAR/5,
09/11/2012; G/LIC/N/1/MAR/4/Corr.1, 05/12/2011; G/LIC/N/1/MAR/4, 29/11/2011
Laws and regulations
Articles 1.4(a) and 8.2(b) and 7.3
G/LIC/N/1/MAR/6, 09/11/2012; G/LIC/N/1/MAR/3/Corr.1, 02/09/2011; G/LIC/N/1/MAR/3, 25/07/2011; G/LIC/N/1/MAR/2/Corr.1, 28/01/2011; G/LIC/N/1/MAR/2, 26/01/2011
Laws and regulations
Articles 5.1 to 5.4 G/LIC/N/1/MAR/1, 29/11/2011 Laws and regulationsRegional trade agreementsArticles GATT 1994 XXIV; GATT 1994 XXIV:7(a)
WT/REG91/N/1/Add.2/Rev.1 and WT/REG91/N/1/Add.3/Rev.1, 25/03/2013; WT/REG91/N/1/Add.2 and WT/REG91/N/1/Add.3 04/05/2012; WT/REG91/N/1/Add.1, 22/10/2010
Laws and regulations
Anti-dumping Article 16.4Article 18.5
G/ADP/N/265/MAR, 13/03/2015; G/ADP/N/259/MAR, 15/10/2014; G/ADP/N/252/MAR, 29/01/2014; G/ADP/N/244/MAR, 30/09/2013; G/ADP/N/237/MAR, 04/03/2013; G/ADP/N/1/MAR/3; G/SCM/N/1/MAR/3; G/SG/N/1/MAR/2, 01/03/2013; G/ADP/N/230/MAR, 13/09/2012; G/ADP/N/230/MAR, 26/03/2012; G/ADP/N/216/MAR, 27/07/2011
Laws and regulations
Agreement on sanitary and phytosanitary measuresAnnex B, paragraph 7 G/SPS/N/MAR/41, 10/04/2015; G/SPS/N/MAR/40, 07/01/2015;
G/SPS/N/MAR/39, 15/12/2014; G/SPS/N/MAR/38, 14/08/2014; G/SPS/N/MAR/37, 20/09/2013; G/SPS/N/MAR/36, 14/08/2013; G/SPS/N/MAR/35, 24/04/2013; G/SPS/N/MAR/34, 05/02/2013; G/SPS/N/MAR/33.Add.1, 25/09/2012; G/SPS/N/MAR/33, 25/07/2012; G/SPS/N/MAR/32, 29/03/2012 and G/SPS/N/MAR/31, 25/07/2011 and G/SPS/N/MAR/30, 15/07/2011 and G/SPS/N/MAR/29, 10/05/2010
Sanitary and phytosanitary measures
SafeguardsArticles 9.1 and 12.4Article 12.8
G/SG/N/7/MAR/3, G/SG/N/11/MAR/3, 22/10/2014; G/SG/N/1/MAR/2, 01/03/2013
Laws and regulations
Article 12.1(a) G/SG/N/6/MAR/8, 17/06/2014; G/SG/N/6/MAR/7, 10/10/2012; G/SG/N/6/MAR/6, 24/08/2010
Laws and regulations
Articles 9.1, 12.1(b), 12.1(c)
G/SG/N/8/MAR/3/Suppl.1/Corr.1; G/SG/N/10/MAR/3/Corr.1; G/SG/N/11/MAR/2/Suppl.1/Corr.1, 26/05/2014; G/SG/N/8/MAR/3/Suppl.1; G/SG/N/10/MAR/3; G/SG/N/11/MAR/2/Suppl.1, 20/12/2013
Laws and regulations
Articles 9.2, 12.1(b) and (c) G/SG/N/8/MAR/3/Suppl.2; G/SG/N/10/MAR/3/Suppl.1; G/SG/N/11/MAR/2/Suppl.2, 11/04/2014
Laws and regulations
Articles 9.2, 12.1(b), 12.4, 12.6
G/SG/N/7/MAR/2; G/SG/N/8/MAR/3; G/SG/N/11/MAR/2, 02/05/2013 Laws and regulations
Repeal G/SG/N/9/MAR/3, 12/01/2011; G/SG/N/9/MAR/2, 21/09/2010 Laws and regulationsArticles 9.2, 12.1(b) and (c) G/SG/N/8/MAR/2/Suppl.3; G/SG/N/10/MAR/2/Suppl.3;
G/SG/N/11/MAR/1/Suppl.3, 03/09/2010Laws and regulations
Agreement on subsidies and countervailing measuresArticle 32.6 G/SCM/N/1/MAR/3, 01/03/2013 Laws and regulationsAgreement on trade in services Article GATS III:3 S/C/N/740 and S/C/N/741, 09/05/2014; S/C/N/735 and S/C/N/738,
11/04/2014; S/C/N/732, S/C/N/733, S/C/N/734, S/C/N/736 and S/C/N/737, 10/04/2014; S/C/N/608 and S/C/N/609, 21/11/2011
Laws and regulations
Trade Facilitation AgreementMinisterial Decision WT/MIN(13)/36
WT/PCTF/N/MAR/1, 4/08/2014 Notification of Category A commitments
Source: WTO Secretariat.
22 Viewed at: https://www.wto.org/english/tratop_e/tradfa_e/tradfa_agreement_e.htm.

WT/TPR/S/329 • Kingdom of Morocco
- 30 -
2.2. In the wake of the Bali Ministerial Conference in December 2013, the Moroccan authorities focused their participation in the WTO on: (i) trade facilitation; (ii) agriculture; and (iii) intellectual property. Morocco has already effected several of the reforms envisaged under the new trade facilitation provisions (Section 3.1). In agriculture, the authorities are taking part in the tariff quota negotiations (Section 3.1 and 4.1). Morocco forms part of the most active groups in the TRIPS negotiations in progress in the WTO23, particularly on geographical indications.
2.3. The WTO Institute for Training and Technical Cooperation (ITTC) extends technical assistance to Moroccan civil servants in order to build their capacity to implement international trade agreements and help improve their participation in the multilateral negotiations. The number of Moroccan civil servants who have benefited from WTO technical assistance increased from 36 in 2009 to 158 in 2013, though the figure fell back to 78 participants in 2014 (Chart 2.1). This reduction was partly offset by a significant increase in online courses.
Chart 2.6 Number of participants in WTO technical assistance and training activities, 2009-2014
52 41
9574
119
18
7 18
53
65
57
73
0
20
40
60
80
100
120
140
160
180
200
0
50
100
150
200
250
300
2009 2010 2011 2012 2013 2014
Online courses
In-person courses
Cost
Number of participantsTotal: CHF 1.1 million
(CHF '000)
Source: WTO Secretariat.
2.4. As Chart 2.1 shows, the number of Moroccan participants in e-learning courses grew six-fold in six years. The online courses most attractive to Moroccan civil servants are "Introduction to the WTO", level 1 ("generalist" path), followed by "Multilateral Trade Agreements", level 2 ("generalist" path).
2.5. WTO technical assistance has attracted participants with diverse backgrounds from the public and private sectors, the media and from academia. For four years the WTO also funded a Chair of International Trade at the Mohammed V University. As coordinator of the African Group in 2013, Morocco benefited from WTO support in the form of an 11-month internship. The gender distribution of Moroccan participants in WTO activities was 360 men versus 227 women for the period 2009-2014.
2.6. As regards the topics chosen by Moroccan civil servants during the 2009-2014 period, activities of a general nature (relating to most WTO topics) accounted for 50% of all types of activity (Chart 2.2), followed by SPS measures (15%), non-agricultural market access (NAMA) (6%), and trade in services (GATS) (5%).
23 Viewed at: https://www.wto.org/english/tratop_e/trips_e/trips_groups_e.htm.
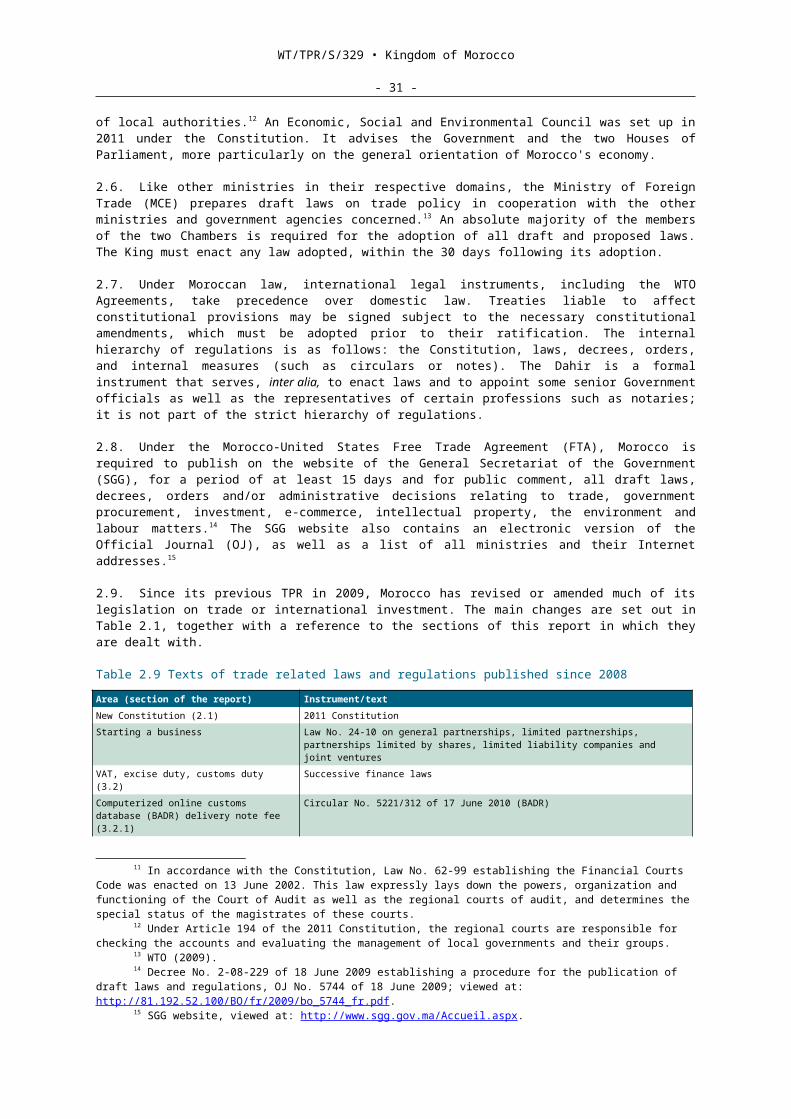
WT/TPR/S/329 • Kingdom of Morocco
- 31 -
Chart 2.7 WTO assistance to Morocco, by field of activity, 2009-2014
0% 5% 10% 15% 20% 25% 30% 35%
TBTSPS
ServicesMedia relations
RulesDispute settlement
NegotiationsGovernment procurement
GeneralTrade facilitation
EnvironmentDevelopment
WTO ChairsNAMA
AgricultureTRIPSRTAs
Accessions
Share of total cost (Total: CHF 1.1 million)
Share in the number of participants (Total: 672)
Cost
Participants
Source: WTO Secretariat.
2.3.2 Agreements with the European countries and Turkey
2.3.2.1 European Union
2.1. The EU-Morocco Association Agreement was signed in 1996 and took effect in 2000.24 It provided for the phased establishment of a free trade area for industrial goods traded directly between the two partners, over a 12-year transition period that ended in 2012.25 As pertains to agricultural products, new protocols were implemented in October 2012, repealing the previous ones. These new protocols contain provisions on safeguards, sanitary and phytosanitary measures, standards and technical regulations. Table 2.4 sets out the tariff preferences accorded reciprocally by the parties.
Table 2.12 Tariff preferences under the EU Morocco Agreement, 2015
Trade Agricultural productsWTO definition
Fisheries products Non-agricultural products
Imports into Morocco: products originating in the EU
Reduced customs duties: average of 16.3% (MFN: 30%). Average dutiable rates on the 1,071 dutiable lines: 39%
Reduced customs duties: average of 10.6% (MFN: 16.6%)
Duty free except for 141 lines, average duty: 0.2%, (MFN: 9.3%); average duty on the 141 dutiable lines: 17%
Imports into the European Union: products originating in Morocco
Reduced customs duties and tariff quotas: average of 0.4% (MFN: 14.4%). Average duty on the 48 dutiable lines: 36%
Duty free (MFN: 12.0%)
Duty free (MFN: 3.8%)
Source: WTO Secretariat.
2.2. Moroccan exports under this Agreement increased 6% annually for the period 2008-2014 to stand at DH 126.6 billion; the share of these exports enjoying effective preferences, or almost DH 49 billion in 2014, increased by 26% per annum. Moroccan imports from the EU rose by 3% annually over the period to reach close to DH 200 billion; the share entering with preferential treatment was up 7% to DH 95 billion, with the bulk of the remainder entering under the MFN regime. Negotiations were launched in March 2013 with a view to concluding a Deep and Comprehensive Free Trade Agreement (DCFTA) between Morocco and the European Union.26
24 The Agreement can be viewed in full at: http://rtais.wto.org/UI/PublicPreDefRepByLegalCoverShowCard.aspx?rtaid=92.
25 General Customs Administration, Morocco-European Communities Association Agreement, 2010; viewed at: http://www.douane.gov.ma/dms_prod/loadDocument?documentId=43327.
26 Viewed at: http://trade.ec.europa.eu/doclib/press/index.cfm?id=888.
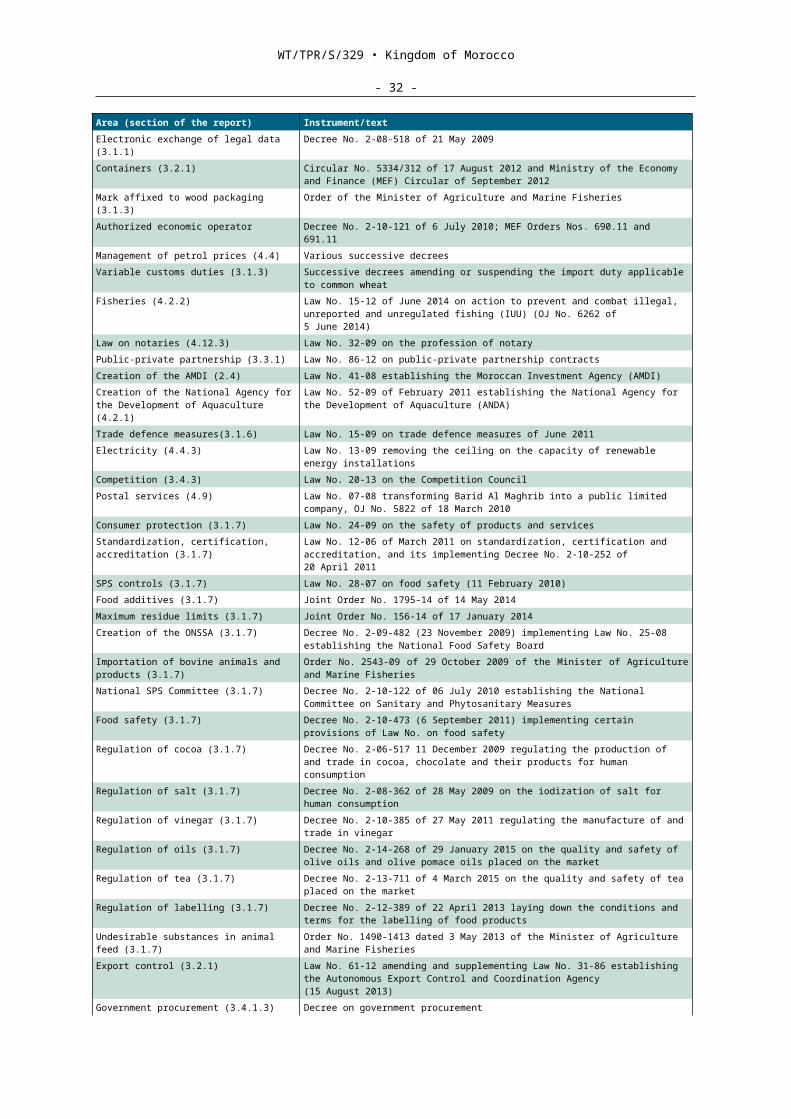
WT/TPR/S/329 • Kingdom of Morocco
- 32 -
2.3.2.2 Agreement with EFTA
2.1. Signed on 19 June 1997 and implemented by the parties since 2000, the Association Agreement with EFTA covers goods only. For non-agricultural products it envisages progressive tariff reduction over 12 years, along the lines of the EU scheme.27 For agricultural products, unlike the agreement with the EU, concessions have been exchanged separately with each of the member countries, as EFTA does not have a common agricultural policy.28 The value of Morocco's exports to EFTA countries fell (less than €2 billion in 2014), but the share of exports covered by preferences rose by 16% per annum between 2008 and 2014. Imports also grew substantially to DH 3 billion, of which DH 1.6 billion was covered by preferences.
2.3.2.3 Agreement with Turkey
2.1. Moroccan trade with Turkey has grown dynamically since 2008, running at 17% annually for exports (totalling DH 4.6 billion in 2014) and at 12% per annum for imports (14 billion in 2014). Preferential trade has not expanded significantly faster than overall trade. Signed in April 2004 and in force since January 2006, the free trade agreement between Morocco and Turkey covers mainly non-agricultural products as well as some agricultural products the trade of which has been partially liberalized through preferential tariff quotas. Under this agreement, a free trade area for non-agricultural products between Morocco and Turkey was gradually established over a period of ten years, with asymmetric treatment in favour of Morocco, whose non-agricultural products have enjoyed full exemption since the entry into force of the agreement. For non-agricultural products originating in Turkey and imported into Morocco, tariffs were phased out over ten years (in keeping with the schedules). As of 1 January 2015, the agreement entered into its 10th and last year of tariff elimination. All non-agricultural products originating from the two countries are now being traded free of duty.
2.3.3 Trade relations with Arab countries
2.1. Morocco's stated aim since 2001 has been to establish a customs union and a common market with its Arab partners. The 31st session of the Council of Ministers of Foreign Affairs of the Maghreb Union, convening in Rabat in May 2013, called for the creation of an area providing for the free movement of persons, services and goods, and for the strengthening of banking cooperation in the Maghreb. This customs union initiative would resurrect the Arab Maghreb Union (AMU), which has so far failed to get off the ground since it was launched in 1989. Regional political instability and insecurity together with the closure of the land borders between Morocco and Algeria are drastically limiting cooperation among the countries in the subregion. Most of Morocco's trade with its Maghreb partners takes place under the Agadir Agreement (see below).
2.3.3. Greater Arab Free Trade Area (GAFTA)
2.1. The agreement creating the Greater Arab Free Trade Area dates back to 1997 and its implementation was completed in 2005. The WTO was notified in October 2006.29 The agreement covers only goods originating in and coming directly from the 18 Arab countries, with the exception of meat, cereal, soya bean and their byproducts covered by the Morocco-United States Free Trade Agreement, and this in order to avoid eroding the preference accorded to the United States. The Agreement provides for full exemption from import duty and taxes having equivalent effect.30
2.3.3. Relations with the United Arab Emirates (UAE)
2.1. The Morocco-UAE Free Trade Agreement, which has not been notified to the WTO, was signed on 25 June 2001 and took effect on 9 July 2003. Since 2005, Morocco has accorded entry free of all duties and taxes for goods from the UAE, with the exception of the products covered by the aforementioned preferential clause in favour of the United States.31 Trade between the
27 Viewed at: https://www.admin.ch/opc/fr/classified-compilation/20021941/201304010000/0.632.315.491.pdf.
28 Viewed at: http://www.invest.gov.ma/index.php?Id=34479&lang=fr.29 Viewed at: http://rtais.wto.org/UI/PublicShowMemberRTAIDCard.aspx?rtaid=16.30 General Customs Administration, Tariff and free trade agreements between Morocco and Arab and
African countries and Generalized System of Preferences, 2010; viewed at: http://www.google.ch/url?sa=t&rct=j&q=&esrc=s&frm=1&source=web&cd=1&ved=0CB4QFjAA&url=http%3A%2F%2Fwww.douane.gov.ma%2Fdms_prod%2FloadDocument%3FdocumentId%3D43330&ei=CUFcVerwOMHBUrvMgdgD&usg=AFQjCNFHidD4jgkfcFlHsP3G0LCUC2tq4Q.
31 Viewed at: http://www.abh-ace.be/fr/binaries/UAE.FR.Final.Final-A5-LD_tcm449-263989.pdf.
WT/TPR/S/329 • Kingdom of Morocco
- 33 -
two countries expanded by more than 27% on average between 2009 and 2014, accounting for 0.7% of Morocco's external trade in 2014. FDI was up by 33% between 2010 and 2014. With a share of 13%, the UAE ranked second among foreign investors in Morocco in 2014, after France.
2.3.3. Arab-Mediterranean Free Trade Agreement ("Agadir Agreement")
2.1. The Agadir Agreement took effect on 27 March 2007. It brings together some Arab-Mediterranean countries (Egypt, Jordan, Morocco and Tunisia) and has not been notified to the WTO.32 It commits the parties to waiving all import duties and any taxes having equivalent effect. The rules of origin provide for diagonal cumulation of origin for products manufactured jointly in EU Member countries, the EFTA countries and in Turkey (Pan-Euro-Med), with the exception of agricultural and agro-industrial products that have not yet been liberalized between the EU and each of the parties to the Agreement.33 The value of Morocco's total imports from the EU, EFTA and Turkey combined rose by 4% annually between 2008 and 2014 to stand at DH 6.5 million. The share of imports enjoying effective preferences increased by 21%, demonstrating the attractiveness of this scheme to importers. Moroccan exports benefiting under the scheme have grown appreciably, with exports totalling DH 2.2 billion in 2014.
2.3.4 Agreements with the sub-Saharan African countries
2.1. In the light of the rapid growth of trade in general and trade in services in particular with the countries of sub-Saharan Africa (Section 4.11), the Moroccan authorities are attempting to redefine the framework of their regional trade cooperation. Morocco currently accords preferential access to some products originating in and coming directly from 34 least developed countries (LDCs) in Africa.34
2.2. Tariff and trade agreements have been concluded with Guinea and Senegal providing for reciprocal tariff exemption. In January 2015, public-private and private-private agreements were concluded between Morocco and Côte d'Ivoire for economic partnership mainly in the realm of infrastructure. On balance, the establishment of mixed commissions for economic cooperation, as forums where government leaders and economic operators can identify partnership opportunities and share ideas for boosting economic relations, have yielded encouraging results. Trade expanded by almost 18% between 2009 and 2013. Moroccan private investment in Africa now stands at almost DH 16 billion. These investments cover a diverse range of mainly high value-added sectors.
2.3.5 Agreements with countries of the Americas
2.1. Since coming into force in 2006, the free trade agreement with the United States has boosted both the volume of trade, from US$1 billion in 2004 to US$4 billion in 2012, and of direct investment, which is also covered under the agreement. More than 120 US companies are now established in Morocco. They represent an overall investment of over US$2.2 billion and generate more than 100,000 direct and indirect jobs.35
2.2. Since 2006 the agreement has permitted free access to the US market for most of Morocco's non-agricultural products including fisheries products, but not textiles and clothing. The bulk of trade in agricultural products is now free of customs duties and taxes; the most sensitive products enjoy tariff preferences within the limits of an annual tariff quota (Section 4.1). The agreement provides for the holding of strategic dialogues, three of which have taken place since Morocco's previous TPR in 2009.
2.3. As pertains to trade in services and to investment, the FTA with the United States provides for all sectors to be free of restrictions, barring those specified in a "negative" list. This approach led to the drawing up of a list of exceptions to national treatment, which was notified by Morocco as part of its process of accession to the OECD Declaration on International Investment and Multinational Enterprises (Section 2.4).
32 Viewed at: http://www.agadiragreement.org/Home.aspx.33 For further details, see in particular: http://www.agadiragreement.org/CMS/UploadedFiles/Etude
%20Textile%20-%20Pays%20de%20l'Accord%20d'Agadir%20-%20mars%202008.pdf.34 WTO document G/C/6, 9 May 2001.35 Viewed at: http://www.lopinion.ma/def.asp?codelangue=23&id_info=45170.
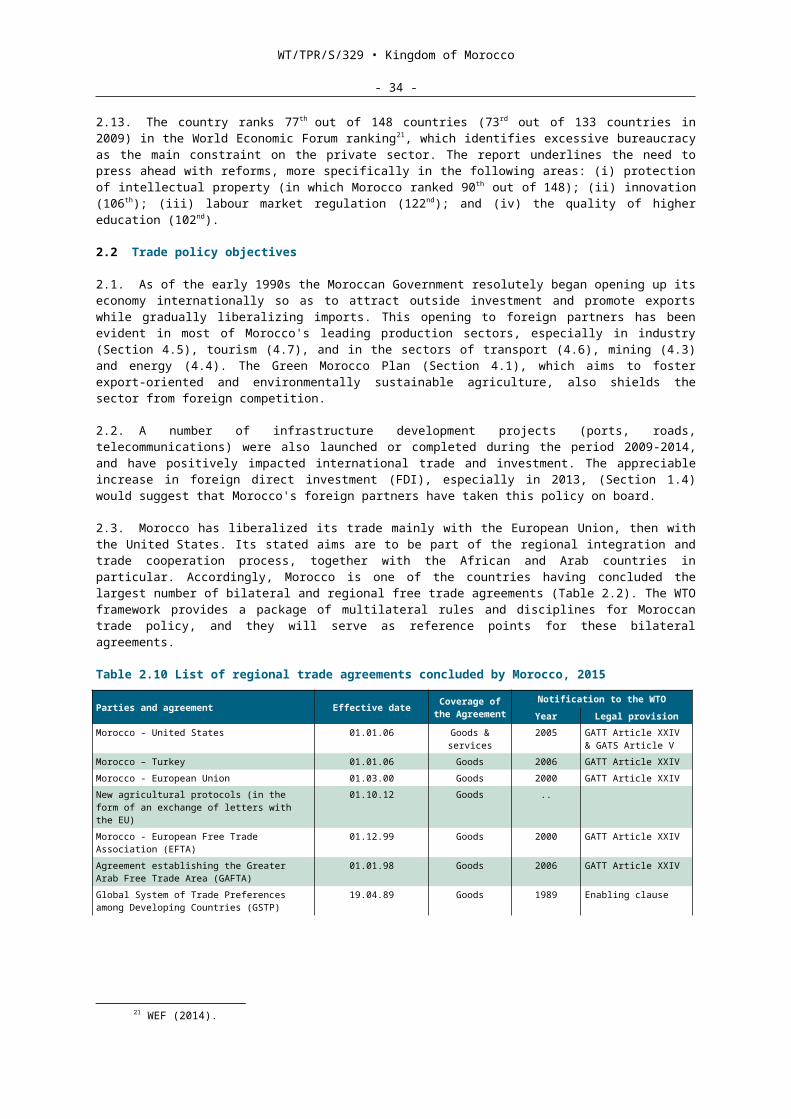
WT/TPR/S/329 • Kingdom of Morocco
- 34 -
2.4. Canada and Morocco are currently engaged in negotiations with a view to concluding a free trade agreement.36
2.3.6 Non-reciprocal preferential arrangements
2.1. Australia, Belarus, Canada, Japan, New Zealand and Russia accord tariff preferences to Morocco under the Generalized System of Preferences (GSP).37 Moroccan exports of products covered by the GSP are therefore totally or partially exempt from customs duties in those countries. Morocco ceased being accorded GSP benefits by the United States with the implementation of the Morocco-United States Free Trade Agreement in 2006, and by the EU as of 1 January 2014.
2.4 Investment regime
2.1. Encouraging FDI is a Moroccan Government priority. Broadly speaking, the relevant legislation applies equally to Moroccan and foreign legal entities and to domestic or foreign investment (direct and portfolio), with the exception of certain monopolies (e.g. phosphate mining), certain provisions regarding foreigners in the natural resource sector and the acquisition of agricultural land. UNCTAD maintains a website that lists all texts and measures relating to investment worldwide, including in Morocco.38 UNCTAD reviewed Morocco's investment policy in 2008 and a report on the implementation of the recommendations of that review is expected at the end of 2015.39
2.2. The OECD published a similar review in 201040 after Morocco became the 42nd country to accede to the OECD Declaration on International Investment and Multinational Enterprises in November 2009. In acceding to the Declaration, Morocco undertook to grant national treatment to foreign investors, with the exception of those on a negative list notified upon accession and regularly updated, and to encourage responsible corporate behaviour. In exchange, other parties acceding to the Declaration guarantee equivalent treatment to Moroccan investors abroad.
2.3. In the process of accession to the OECD Declaration on International Investment and Multinational Enterprises, Morocco identified the sectors in which it maintains restrictions on market access and national treatment for FDI. Morocco places a 49% cap on foreign ownership of capital in air transport companies (Section 4.6.4) and maritime transport companies (Section 4.6.3), as well as marine fishing companies (Section 4.2).41 Another restriction notified by Morocco concerns access for foreign investors to the ownership of agricultural land; foreigners may nonetheless enter into long-term leases (99 years maximum) on such land. There is a substantial presence of foreign investors in the agricultural sector, especially as regards agricultural land concessions previously managed by government agencies. In the banking sector, Morocco has reserved a discretionary right under certain international agreements to limit all foreign majority stakes in the capital of large national banks, but does not appear to have exercised that right (in practice).
2.4. The reform of the 1995 Investment Charter, already recommended by UNCTAD in 2008, is still in progress. Although Morocco's investment regime has undergone some changes since its preceding TPR in 2009, the investment regime has still not been the subject of a law consolidating all the relevant texts and encompassing all activities. A draft investment law is in preparation, however. According to information from the Moroccan Investment Development Agency, the draft is being examined by the General Secretariat of the Government. The text is not expected to consolidate all investment provisions, however.
36 Viewed at: http://www.canadainternational.gc.ca/morocco-maroc/bilateral_relations_bilaterales/canada_morocco-maroc.aspx?lang=fra.
37 General Customs Administration, Tariff and free trade agreements between Morocco and Arab and African countries and Generalized System of Preferences; viewed at: http://www.google.ch/url?sa=t&rct=j&q=&esrc=s&frm=1&source=web&cd=1&ved=0CB4QFjAA&url=http%3A%2F%2Fwww.douane.gov.ma%2Fdms_prod%2FloadDocument%3FdocumentId%3D43330&ei=CUFcVerwOMHBUrvMgdgD&usg=AFQjCNFHidD4jgkfcFlHsP3G0LCUC2tq4Q.
38 UNCTAD – Investment Policy Hub; viewed at: http://investmentpolicyhub.unctad.org.39 UNCTAD (2015, forthcoming).40 OECD (2010).41 Maritime fishing licences may be accorded only to vessels flying the Moroccan flag and subject to the
same capital limitations and restrictions as maritime transport companies, or to foreign vessels chartered by Moroccan natural or legal persons.
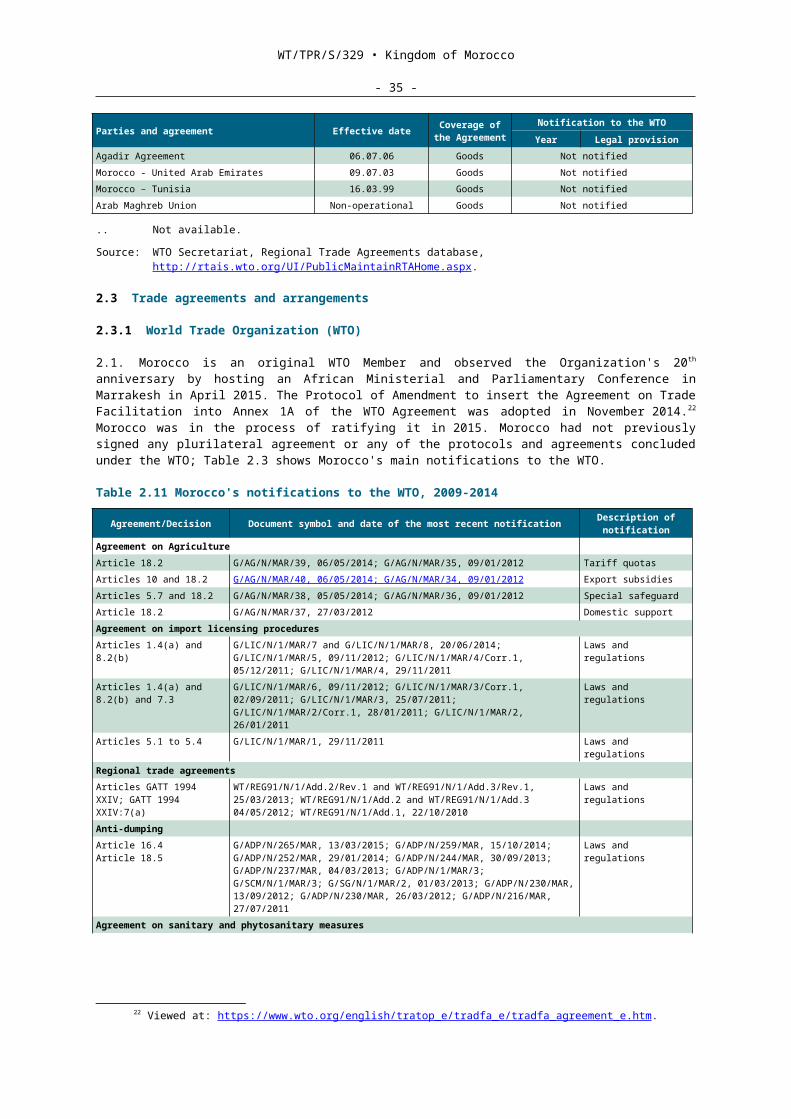
WT/TPR/S/329 • Kingdom of Morocco
- 35 -
2.5. At the institutional level, the Moroccan Investment Development Agency (AMDI) was set up in 2009 under the supervision of the MICIEN.42 The AMDI is responsible for developing and promoting investment in Morocco and constitutes the secretariat of the Investment Commission.43 The Moroccan Investment Development Agency (AMDI) works with the Regional Investment Centres (CRIs) in promoting and supporting investors. In terms of promotion, the CRIs are a source of information for promoting the regions and their territorial development.2.6. Each project for which it is hoped to obtain state aid must first go through the CRIs and be approved by them before being processed by the AMDI. According to the OECD, the main challenge is that of transforming all CRIs into genuine integrated single windows equipped to handle all the administrative steps involved in the process of setting up a business (registration, reporting and compliance, including licensing and authorizations).44
2.4.1 Investment Charter
2.7. Despite being deemed outdated by the authorities, Framework Law No. 18-95 of 1995 establishing the Investment Charter is still the main investment legislation.45 The preparation of a new law on investment is still a major priority legislative project for 2015. A consolidated text on the general investment regime would clarify and lend greater transparency to the conditions under which investors operate. The addition of implementing decrees, including determination of the legal remedies available to investors (see below) would complete this legislation and render it effective and credible. As things stand, the agricultural sector (Section 4.1), offshore banks, offshore holding companies and mining companies have their own regulations which are distinct from the Charter.
2.8. The Charter provides a convertibility regime for resident and non-resident foreign investors and Moroccans living abroad bringing in foreign currency, under which they may freely transfer abroad the dividends and profits generated by these investments, as well as the proceeds of their disposal or liquidation, without any limitation on the amount or duration, after payment of the applicable duties and taxes in Morocco. Resident foreigners are allowed to transfer their profits, salaries, wages, pensions and fees. Funds coming from abroad may pass through an account in foreign currency or convertible dirhams. This account makes it possible to conduct investment transactions in Morocco and guarantees the transfer and the repatriation of the proceeds of the investment as well as the added value from any resale. Moreover, Moroccan banks may grant local-currency loans to foreigners not resident in Morocco to finance the purchase or building of residences in Morocco, covering up to 70% of the building's purchase or construction price.
2.9. Although the Charter provides for certain income tax or corporate tax exemptions for investors, all incentives and other fiscal measures are now in principle contained in the General Tax Code (CGI) (Section 1.2), which takes precedence over all previous legislation. Article 7 of the Charter (reproduced in Article 6B of the CGI) offers exporting companies full exemption from corporation tax for a period of five years and a reduction in corporation tax to 17.5% (instead of the usual 30% rate) after this period. This reduction is also available to companies that set up in certain prefectures and provinces stipulated by decree, and to craft enterprises.
2.10. Articles 17 and 18 of the Charter lay the groundwork for the State to bear certain investor expenditures such as for the purchase of land, vocational training or external infrastructure spending, and create the Investment Promotion Fund.46 The Charter also permits the importation of capital goods, equipment and tools, spare parts and accessories needed to make and develop investment, at rates varying between 2.5% and 10%.
2.4.2 Free zones regime
2.1. Subject to prior authorization, domestic or foreign companies wishing to set up in Morocco for export purposes may operate under the export free zones (ZFE) regime, pursuant to a law which also dates from 1995.47 Exports from Morocco's free zones increased from DH 10.5 billion to
42 Viewed at: http://www.invest.gov.ma.43 The AMDI was created under Dahir No. 1-09-22 of 18 February 2009 enacting Law No. 41-08, in
replacement of the Foreign Investment Directorate.44 Viewed at: http://www.oecd.org/globalrelations/Dim I-5 R%C3%A9sum%C3%A9.pdf. See the UNCTAD
progress report on Morocco's IPR for further information in this regard.45 Viewed at: http://www.sgg.gov.ma/ http://www.sgg.gov.ma/Portals/0/lois/CHARTE_INVES_FR.pdf .46 Viewed at: http://www.maghrebarabe.org/admin_files/unpan005731.pdf.47 Law No. 19-94 enacted on 26 January 1995.
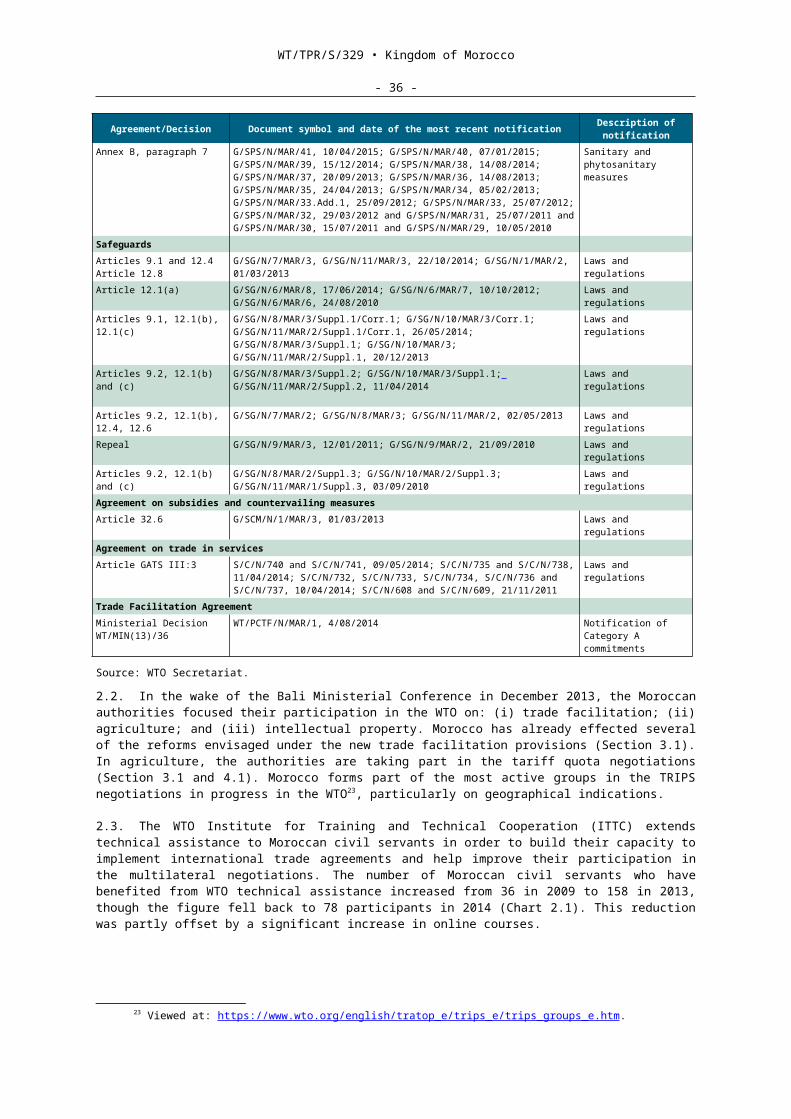
WT/TPR/S/329 • Kingdom of Morocco
- 36 -
DH 34.5 billion between 2008 and 2014. According to the authorities, the export free zones constitute one of main factors behind the growth in investment in Morocco.
2.2. The authorization is granted by the local ZFE commission at the place of establishment, as the body that decides on the eligibility of projects for benefits under the ZFE regime. All the activities authorized in export free zones are industrial export activities (agro-industry, textiles and leather, metalworking, mechanics, electrical equipment, etc.) and the related service activities. According to the authorities, there is a priori no minimum share of output that must be exported.
2.3. The approval of the Foreign Exchange Board is required before legal entities headquartered in Morocco and Moroccan citizens residing in Morocco may set up business in export free zones. Transactions taking place within export free zones must be settled exclusively in convertible foreign currency.
2.4. Goods entering or leaving the export free zones for export purposes and those obtained or remaining in these zones are exempt from all direct or indirect duties and taxes affecting imports, movement, consumption, production or exports. Under this regime, companies are also fully exempt from corporation tax during the first five consecutive fiscal years, and subject to a reduced corporation tax rate of 8.75% for the next 20 consecutive fiscal years; natural persons are granted full exemption from income tax during the first five consecutive fiscal years and a rebate of 80% for the following ten consecutive years. There are no restrictions on foreign exchange transactions or on capital repatriation and currency convertibility. Registration fees are waived for acts relating to the constitution or increase of capital for companies established in free zones. The concessions listed above may not be cumulated with any other investment incentives.
2.5. As noted by the authorities, in addition to the above benefits, companies setting up in export free zones benefit from simplified procedures (i.e. single window), which allows them to circumvent red tape.
2.4.3 Tax incentives for investment under the General Tax Code
2.1. The CGI provides for corporation tax or income tax waivers or reductions to encourage investment, in addition to those described above for export companies.48
2.2. Farms are exempt from corporation and income tax on their agricultural income. The Moroccan Government has decided, beginning in 2015, to phase in these two taxes for agricultural enterprises with a turnover of more than DH 5 million, which contrasts with the situation existing hitherto. From 1 January 2014 to 31 December 2015, only farmers with a turnover of less than DH 35 million will continue to benefit from corporate and income tax waivers; from 1 January 2016 to 31 December 2017 only those with a turnover of less than DH 20 million; and from 1 January 2018 to 31 December 2019, only those with a turnover of less than DH 10 million will be exempt. At the end of the process in 2020, only farmers with a turnover of less than DH 5 million will remain exempt from these two taxes.
2.3. Tax incentives are also accorded to exporting mining companies that benefit from a permanent corporation tax rate of 17.5%. An 8.75% corporation tax is applied to companies with "Casablanca Finance City (CFC)" status; a 10% rate is applied to offshore banks, to CFC banks after the first five years, and any company making a fiscal profit of DH 300,000 or less; and a rate of 17.5% is levied on the activities of certain companies (hotel, craft, mining, educational, sporting, etc.).
2.4. There are numerous special regimes, exemptions, reduced rates and suspensions (temporary or permanent) in respect of income tax, for example for agricultural activities, hotel enterprises, businesses operating in export free zones, and for very small enterprises.
2.5. VAT exemptions on imports are also foreseen in the CGI for certain types of investment (Section 3.2).
2.4.4 Investment aid
2.1. The Hassan II Fund for Economic and Social Development49 offers financial aid for national or foreign investment. It bears a part of the costs incurred for the construction or purchase of
48 Viewed at: http://www.finances.gov.ma/Docs/2014/DGI/cgi_2014_fr.pdf.
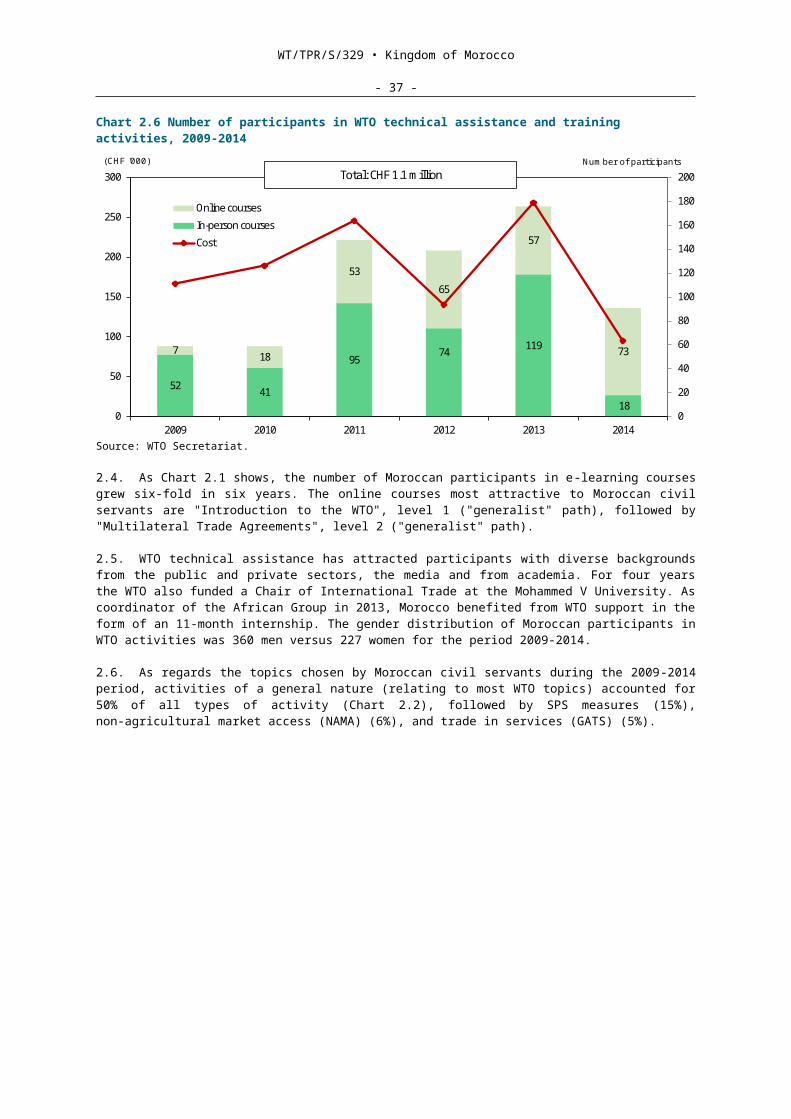
WT/TPR/S/329 • Kingdom of Morocco
- 37 -
buildings, and the purchase of capital goods by enterprises operating in certain industrial sectors. Those eligible to benefit are new investment projects (creation or expansion) submitted by investors whose overall investment exceeds DH 10 million, excluding taxes, and provided that the amount invested in capital goods is more than DH 5 million, excluding taxes.50
2.2. The financial input from the Hassan II Fund is 30% of the cost of commercial buildings (based on a maximum unit cost of almost DH 2,000/m2, excl. taxes), and a maximum of 15% of the cost of purchasing new capital goods (compared to 10% in 2009) (excl. import duties and taxes). Nevertheless, the financial contribution from the Hassan II Fund to any single project may not exceed 15% (versus 10% in 2009) of the overall amount of the investment and is capped at DH 30 million (as against DH 20 million in 2009).
2.3. An Industrial Development Fund worth €2 billion has been set up to finance priority industrial sectors (Section 4.5.2). From this Fund the State contributes 10% to the amount being invested in projects worth DH 200 million or more in eligible sectors (e.g. clothing, automotive, etc.). In principle, this aid cannot be cumulated with aid from the Hassan II Fund.
2.4.5 International investment agreements and conventions
2.1. Morocco has signed some 60 bilateral agreements on the promotion and protection of investments, of which 48 have entered into force. Three of these agreements were signed on a regional basis with the Arab Maghreb Union (AMU), the Member States of the Organisation of the Islamic Conference and OPEC, respectively, but only the first two have taken effect. The free trade agreement with the United States includes a chapter on investment. These agreements are essentially intended as a means of promoting inward foreign investment insofar as they protect investors from policy reversals. The negotiations on a Deep and Comprehensive Free Trade Agreement (DCFTA) between the EU and Morocco include an investment component.
2.2. Morocco is a member of International Centre for Settlement of Investment Disputes (ICSID) and of the Multilateral Investment Guarantee Agency (MIGA). In terms of international arbitration, an investor may, in the event of a dispute, take recourse to the ICSID or to an ad hoc tribunal set up under the Arbitration Rules of the United Nations Commission on International Trade Law (UNCITRAL). Almost all of these treaties contain investor-state dispute settlement provisions.2.3. Morocco also has 50 international agreements for the avoidance of double taxation in force. These agreements contain provisions on import duties, corporate or income tax, VAT, the business tax and the exchange rate regime.51 In May 2013 Morocco signed the OECD Convention on Mutual Administrative Assistance in Tax Matters.52
49 The Hassan II Fund for Economic and Social Development was established by Dahir No. 1-02-02 of 29 January 2002, enacting Law No. 36-01.
50 Tax free means exempt from customs duties and taxes.51 For further details, see the AMDI website.52 Viewed at:
http://www.oecd.org/fr/ctp/echange-de-renseignements-fiscaux/conventionconcernantlassistanceadministrativemutuelleenmatierefiscale.htm.
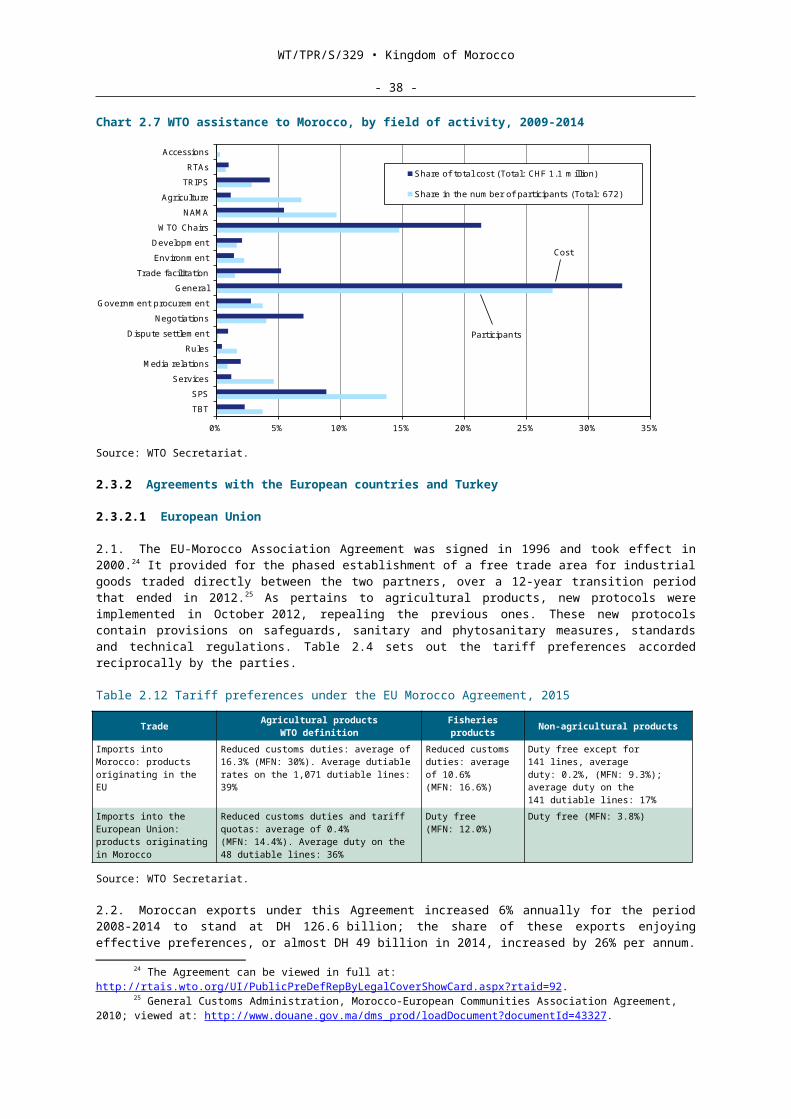
WT/TPR/S/329 • Kingdom of Morocco
- 38 -
3 TRADE POLICIES AND PRACTICES BY MEASURE
3.1 Measures directly affecting imports
3.1.1 Customs procedures
3.1. Since the previous review of its trade policy (TPR) in 2009, Morocco has continued to take measures to facilitate trade and shorten the time during which goods remain in customs zones and in ports. New measures streamlining customs procedures have been introduced with a view to speeding up and computerizing customs clearance, notably by putting in place the BADR (computerized online customs database), which has been in operation since January 2009. Morocco has notified its Category A measures under the Agreement on Trade Facilitation.
3.2. The purpose of the BADR is to make the customs clearance procedure for both imports and exports totally paperless from the time goods come under customs control until they are released or definitively shipped.53 Through the BADR, operators have online access to all useful data informing them how their customs procedures are progressing, and also have online support available if needed.54 These services enable operators to carry out some 30 operations remotely, for example, requests to amend online declarations, remote printing of payment slips and viewing how the declaration is progressing. The measures taken to computerize the customs clearance route include digital signature of customs declarations and the adoption of a standard procedure with the banks for endorsing bank guarantees using the BADR computer system. Since 2012, it has also been possible to obtain release and customs clearance remotely.
3.3. A detailed declaration called the Single Declaration of Goods (DUM) is required for commercial imports, placing them under a customs regime. The DUM has to be forwarded to the Customs and Excise Administration (ADII) electronically using the BADR. Advance customs clearance is encouraged as a result of the introduction of an obligation on the carrier to file a summary declaration before the goods arrive.55 Pursuant to the new provisions, the summary declaration has to be filed electronically within the time-limits specified according to whether the goods are imported by sea or by air.56 For users, the cost of using the BADR computer system is: DH 500 for each summary declaration, DH 100 for each DUM for imports, DH 50 for each DUM for exports, and DH 6 for each page of status reports or management statements.
3.4. To lessen the time during which goods remain in customs zones, manifests are accepted in the original language (Arabic, English, French, Spanish) and since 2010 have been recorded electronically without any need for a hard copy. In 2015, electronic payment was incorporated into the customs clearance process by introducing a service allowing customs debits to be paid by credit card through the BADR. A national clearance credit is available and covers all transactions irrespective of the bureau of import. Other measures already in place at the time of Morocco's previous TPR have been generalized, for example, allowing the goods to be released simply by submitting the release order edited at the operator's domicile; and the opportunity given to operators to choose a customs bureau as the bureau of domiciliation for completing customs formalities.
3.5. The obligation to register importers and import documents has not seen any major changes since the previous review of Morocco's trade policy. Natural or legal persons wishing to engage in international trade activities must be registered in the Commercial Register.
3.6. Moreover, as part of the facilitation of foreign trade procedures, Morocco has established a virtual foreign trade single window known as "PortNet", which is managed by the company PortNet SA created by Decree No. 2-10-146 of 26 April 2010. PortNet's main goal is to make a common computer tool available by operating and managing the hub for the exchange of computerized data and information systems between the various stakeholders and port and foreign trade operators.
53 Circular No. 5221/312 of 17 June 2010.54 Dahir No. 1-07-129 of 30 November 2007 enacting Law No. 53-05 on the electronic exchange of legal
data and enacting Decree No. 2-08-518 of 21 May 2009 implementing Articles 13, 14, 15, 21 and 23 of Law No. 53-05.
55 Article 3 of Finance Law No. 22-12 for the 2012 financial year.56 The time-limits for goods imported by sea or by air are indicated in Circular No. 5353/312 of
31 December 2012.
WT/TPR/S/329 • Kingdom of Morocco
- 39 -
3.7. Although all imports of goods remain contingent upon the signing of an import indenture domiciled with an approved Moroccan bank, since 1 June 2015, this indenture and its debit by the customs services has been conducted electronically through the single window (PortNet), in accordance with the provisions in the order of the Minister responsible for foreign trade No. 1675-15 of 19 May 2015 determining the conditions for issuing import documents and export licences.57
3.8. The declarant must provide the customs with a written copy of the declaration no later than the day following registration of the DUM. The time-limit is five days for transactions under customs regimes (REDs). The copy must be accompanied by invoices, ownership or transport documents and, where applicable, packing lists, certificates of origin and any other documents required for application of the various customs and non-customs regulations at the border.58
3.9. Imported goods may be withdrawn after payment of or posting of security for the duty and taxes and, where applicable, after completing other formalities carried out by the ADII on behalf of other authorities.59 It is also possible to use clearance credits or to pay by a secured bond, the two procedures enabling payment to be deferred for up to 180 days. A new form of security has been introduced to cover transit operations between free zones and between these and entry and exit bureaux.
3.10. To facilitate customs clearance, economic operators may set up customs clearance warehouses and bays (MEADs) within or outside customs zones in ports or airports. Introduced in 2000, the MEADs are open to all and allow goods in bond to be provisionally stored in these approved premises upon import or export, pending the assignment of a definitive customs regime. Pursuant to the 2014 Finance Law, MEADs may now only be set up by legal persons whose main activity is logistics or international transport in order to place the activity on a more professional basis. It makes the operation of MEADs subject to compliance with specifications laid down by the administration, defining the obligations and conditions to be met in order to engage in this activity. In May 2015, 67 MEADs were in operation.
3.11. In 2012, measures were taken to allow the temporary admission of containers60 without the operator filing any declaration or guarantee, subject to observance of the labelling requirements for their identification.61 If there are doubts, however, concerning compliance with the obligation to re-export the container, the customs services take other precautions such as requiring submission of a bond-note together with the declaration assigning a customs regime to the goods transported or a simplified declaration. As of May 2015, 26 operators had been authorized to benefit from this procedure.
3.12. In partnership with the private sector and following implementation of the WCO's SAFE standards, the customs introduced a programme for the approval of economic operators allowing candidate companies which pass an extremely strict audit to benefit from the administration's trust and from certain customs facilities. An approved economic operator (AEO) may be given the status of AEO-Customs Simplifications Category "A" or "B". In addition, AEO-Security and Safety status is also granted to Category "A" AEO-Customs Simplifications AEOs which comply with appropriate standards concerning security and safety. At the legal level, "AEO" status is attributed by means of the provisions in Article 73 bis of the Customs and Excise Code and its implementing texts.62 As of May 2015, 367 operators had "AEO-Customs Simplifications" status, of which a certain number classified in Category "A" had applied for "AEO-Security and Safety" status. Customs audits are being conducted for around a dozen of them. The framework agreement between the ADII and the
57 Order of the Minister responsible for foreign trade No. 1675-15 of 19 May 2015, published in Official Journal (OJ) No. 6365 of 1 June 2015.
58 Ministry of the Economy and Finance, online information, "Entreprises, Déclaration en détail"; viewed at: http://www.douane.gov.ma/web/guest/23.
59 Ministry of the Economy and Finance, online information, "Entreprises, paiement ou garantie des droits et taxes"; viewed at: http://www.douane.gov.ma/web/guest/23.
60 Circular No. 5334/312 of 17 August 2012.61 Circular of the Ministry of the Economy and Finance of September 2012. This circular specifies that
containers which have been subject of a sale, lease-purchase or similar agreement signed by a person established in regulated territory are excluded from the temporary admission procedure, in principle only granted for goods which remain in foreign ownership.
62 The conditions for granting AEO status are determined in the following regulatory texts: Decree No. 2-10-121 of 6 July 2010 (OJ No. 5862 of 5 August 2010); orders of the Minister of the Economy and Finance No. 690.11 of 22 July 2011 (OJ No. 5987 of 17 October 2011) and No. 691.11 of 22 July 2011 (OJ No. 5985 of 10 October 2011); Circulars No. 5087/313 of 1 February 2008, No. 5142/313 of 23 February 2009, No. 5336/313 of 12 September 2012 and No. 5517/313 of 17 February 2015.

WT/TPR/S/329 • Kingdom of Morocco
- 40 -
Directorate-General of Taxation (DGI) gives AEOs the same fiscal benefits, as well as the advantages of exchanging information electronically and coordinating control to prevent multi-invoicing.
3.13. There is a forum for ongoing dialogue in the form of framework agreements signed between the customs and professional associations representing various sectors of activity. These framework agreements provide for regular meetings with professional circles in order to identify ways of improving customs procedures. The areas for improvement identified are set out in a road map and progress is regularly evaluated. As of May 2015, seven framework agreements had been signed. In order to combat informal traffic, since 1 May 2014, drivers of private vehicles used to transport commercial goods have been called on to comply with the regulations and conditions applicable to international road transport and customs declarations (Section 1.2).
3.14. The risk assessment system in effect automatically places imports and exports into one of two categories ("approved for import/export" or "physical inspection"). According to the ADII, some 90% of import transactions (and 85% of export transactions) are approved and only the documents are checked.63 Since 2005, the ADII has also been using scanners to inspect containers and "road trains" (lorries).
3.15. In Morocco, the most frequent disputes relating to customs concern the classification of goods and customs valuation. An operator may appeal to the ADII, then to regional commissions, the National Commission and the World Customs Organization (WCO). According to the authorities, disputes are extremely rare, despite the regulatory provisions giving compensation to customs officers having discovered infringements.
3.1.2 Customs valuation
3.1. Morocco confirms that it has been applying the WTO Customs Valuation Agreement since 5 October 1998 and the provisions in Article 6 on the method for calculating value have been incorporated into domestic legislation (Finance Law No. 45-02 of 2003).64 If there is any doubt concerning the value, the customs has to invite the importer or the declarant in writing to present the additional supporting documents proving the value declared within a period of one month.65 If no reply is received within this period or if the supporting documents do not suffice, the customs rejects the value declared and adjusts it using the methods prescribed in the WTO Customs Valuation Agreement.
3.2. Since 2010, the General Confederation of Moroccan Enterprises (CGEM), the DGI and the Foreign Exchange Board have joined together to set up an ad hoc public/private committee with the aim of drawing up an action plan to combat under-invoicing. A technical committee to examine short-, medium- and long-term action and a monitoring committee to analyse foreign trade databases and facilitate the preparation of indicators for estimating value have also been established.
3.3. A list of "sensitive" products that could give rise to trade fraud was drawn up in 2004. Among the products listed are: products for which it has been found that the values declared do not correspond to production costs or have been substantially reduced; products which present various risks of unfair competition with identical imports; and products for which the import statistics show significant decreases in the unit price. This list is updated regularly and includes food products, cosmetic and household products, as well as clothing, footwear and spare parts for vehicles. The products thus identified are systematically subject to prior control of their value by the competent authority. According to the authorities, however, the transaction value is used for most imports.
63 Ministry of the Economy and Finance, ADII, online information, "La douane vous propose des solutions diversifiées" in Prospectus/Mesures de simplification mises en place par la douane au profit des entreprises; viewed at: http://www.douane.gov.ma/web/guest/nos-publications .
64 Customs Code, as amended by Finance Law No. 12-98 for the 1998-1999 financial year, and WTO document G/VAL/N/1/MAR/2 of 17 February 2003.
65 Customs and Excise Administration, Note No. 21487/231 of 23 November 2001.
WT/TPR/S/329 • Kingdom of Morocco
- 41 -
3.1.3 Customs levies
3.1.3.1 Overview
3.1. Imported goods are subject to customs duty, the parafiscal tax on imports, value added tax (VAT), internal consumption tax (TIC) and various other duties and taxes (Sections 3.1.3.2 to 3.1.3.5 below). The revenue earned from these various duties and taxes levied at the customs rose slightly between 2008 and 2014 (Table 3.1) as a result of higher VAT and TIC. The increased revenue from VAT, occupying first place in total fiscal revenue, is attributable to the increase in the value of taxable imports and in imports of energy products. The rise in TIC revenue is the result of greater imports of manufactured tobacco and energy products.
Table 3.13 Revenue from duties and taxes levied on imports, 2008-2014(DH million)Duties and taxes 2008 2009 2010 2011 2012 2013 2014Import dutya 13.7 11.8 12.2 10.3 9 7.7 7.7Internal consumption tax (TIC) including: 18.7 19.6 21.1 21.9 22.7 22.9 23.8
TIC on energy products 10.6 11.7 12.3 12.9 13.1 13.3 13.9TIC on manufactured tobacco 7 6.9 7.5 7.5 8.2 8.0 8.5TIC on other products 1.1 1.1 1.3 1.4 1.5 1.5 1.5
VAT including: 35.4 32.6 38.4 44.1 46.8 46.3 46.4VAT on energy products 5.4 4.3 7.7 10.2 11.4 10.7 9.8Other 30 28.3 30.7 33.9 35.4 35.7 36.6
Levy on phosphate mining 0.1 0 0.1 0 0 0 0Gas pipeline levy 1.7 1.7 1.4 2.2 2.1 2.3 2.4Other revenue 0.3 0.3 0.3 0.3 0.3 0.2 0.3Total 69.9 66.0 73.6 78.7 81 79.5 80.7
a Import duty comprises the tariff, stamp duty, administrative fees and the tax on private transport.
Source: ADII (2012), Rapport d'activité, and information provided by the authorities.
3.2. Morocco currently uses the 2012 version of the Harmonized Commodity Description and Coding System (HS). Since 2000, the nomenclature has comprised ten digits, and the number of tariff lines has remained stable at 17,735 in 2009 and 17,784 in 2015. With the exception of 28 lines subject to variable custom duty, duty on all the other lines is ad valorem, levied on the c.i.f. value of the imports.
3.1.3.2 Applied most-favoured-nation (MFN) tariff
3.1. The applied tariff comprises 18 different rates for the lines subject to ad valorem duty. Since the previous review in 2009, the number of rates applicable to products of HS Chapters 25 to 97 fell from 7 to 5 in 2012, usually: 0; 2.5; 10; 17.5; and 25. Products of HS Chapters 01 to 24, on the other hand, are subject to rates of up to 200%, as well as variable duty. The list of products subject to variable duty has become somewhat shorter since 2009 with 28 HS 10-digit lines.66 Variable duty also currently applies to certain cereals, sugar (cane or beet) and chemically pure sucrose.
3.2. Two types of variable duty apply, one for sugar and sucrose and the other for certain cereals. For sugar and sucrose, one (lower) rate applies to the customs value and an additional (higher) rate to the difference between the threshold fixed and the declared value (if this is below the threshold fixed) (Table 3.2). In principle, as was the case in 2002 and 2009, for values declared below the threshold fixed, the ad valorem equivalent of the duty (in reverse proportion to the import price) may range from the constant rate (minimum) to infinity. The authorities have indicated, however, that they ensure that the ad valorem equivalent of the variable duty stays below the WTO bound rate.
66 The products removed from the list were in HS Chapter 10 (durum wheat for the period 1 August to 31 May, barley other than for brewing, maize, rice and sorghum).
WT/TPR/S/329 • Kingdom of Morocco
- 42 -
Table 3.14 Variable customs duty applicable to sugar, 2015
HS Code Rate applied to the customs value (%)
Threshold price(DH/tonne)
Additional rate applied (%)a
HS 1701 Cane or beer sugar and chemically pure sucrose, in solid state1701120010 35.0 3,500 1231701120090 35.0 3,500 1231701130010 35.0 3,500 1231701130090 35.0 3,500 1231701140010 35.0 3,500 1231701140090 35.0 3,500 1231701911011 42.0 4,050 1241701911012 42.0 4,050 1241701911019 42.0 4,050 1241701911091 42.0 4,050 1241701911092 42.0 4,050 1241701911099 42.0 4,050 1241701912011 47.0 4,450 1291701912012 47.0 4,450 1291701912019 47.0 4,450 1291701912091 47.0 4,450 1291701912092 47.0 4,450 1291701912099 47.0 4,450 1291701999110 42.0 4,050 1241701999191 42.0 4,050 1241701999199 42.0 4,050 1241701999210 47.0 4,450 1291701999291 47.0 4,450 1291701999299 47.0 4,450 129
a The additional rate is applied to the difference between the threshold price and the declared value only if the declared value is below the threshold price.
Source: Customs tariff; viewed at: http://www.douane.gov.ma/web/guest/tarif#http://www.douane.gov.ma/tarif/tarif/init.jsf; and 2015 tariff information provided by the authorities.
3.3. For the cereals concerned (wheat, meslin and barley for brewing), Morocco's tariff provides for variable duty according to the import price (Table 3.3); there are two rates for each tariff line: a high rate for values declared below the threshold fixed and a lower rate for values above this threshold. The Moroccan authorities define this as "two-rate duty". In practice, customs duty on common wheat is determined by decree according to the volume of the domestic harvest and global prices; since 2008, this rate has been seasonal and has fluctuated sharply (Chart 3.1).
Table 3.15 Variable customs duty applicable to cereals, 2015HS Code Description Rate for the 1st tranche Rate for the 2nd trancheHS 1001 Wheat and meslin 1001190010a Durum wheat 170% for the ≤ 1,000 DH/t tranche 2.5% for the > 1,000 DH/t tranche 1001990019 Common wheat 17.5% for the ≤ 1,000 DH/t tranche 2.5% for the > 1,000 DH/t tranche 1001990090 Other 17.5% for the ≤ 1,000 DH/t tranche 2.5% for the > 1,000 DH/t trancheHS 1003 Barley 1003900010 For brewing 35% for the ≤ 1,000 DH/t tranche 2.5% for the > 1,000 DH/t tranche
a The rates indicated for durum wheat are for the period 1 June to 31 July; an ad valorem rate applies for the remainder of the year.
Source: Customs tariff; viewed at: http://www.douane.gov.ma/web/guest/tarif#http://www.douane.gov.ma/tarif/tarif/init.jsf. Tariff information for 2015 provided by the authorities.
WT/TPR/S/329 • Kingdom of Morocco
- 43 -
Chart 3.8 Import duty on common wheat, 2008-2015
-100
102030405060708090
100110120130140150
01/01/08 -31/07/08
01/08/08 -31/05/09
01/06/09 -31/12/09
01/01/10 -31/05/10
01/06/10 -16/09/10
16/09/10 -30/04/11
01/05/11 -30/09/11
01/10/11 -28/05/12
01/06/12 -30/09/12
01/10/12 -30/04/13
01/05/13 -08/08/13
08/08/13 -31/10/13
01/11/13 -31/07/14
01/08/14 -30/04/15
01/05/15 -31/10/15
Source: Information provided by the authorities.
3.4. Morocco lowered its MFN tariff rates as part of the reform that took place in 2013 with the aim, inter alia, of narrowing the difference in taxation between the preferential regimes and the ordinary law regime (MFN) in order to limit the deviation of trade to less efficient preferential partners. The maximum ad valorem rate of 304% in 2009 fell to 200% in 2015. The simple average of MFN customs duties thus dropped to 12.5% in 2015, a reduction of 7.7 percentage points from the simple average rate in 2009 (Table 3.4).67 The coefficient of variation of 1.4 also indicates relatively dispersed rates (from zero to 200%).
3.5. The average duty on agricultural products (WTO definition) fell from 44.5% in 2009 to 30% in 2015. For non-agricultural products, the simple average dropped from 16.3% in 2009 to 9.5% in 2015. As far as the ISIC (Rev.2) definition is concerned, agriculture is still the most highly protected sector (with an average tariff of 16.5%), followed by manufacturing (12.3%) and mining (4.2%).
3.6. The modal rate (the most common) is 2.5% and applies to 9,479 lines (53% of all tariff lines), followed by 25% for 3,330 lines. The highest ad valorem customs duty (200% compared to 304% in 2009) applies to agricultural products (live sheep and goats and their meat) (Table 3.5). As was the case in 2009, the zero rate applies to ten lines, or 0.06% of all lines (Chart 3.2), specifically to the categories of sulphur of HS Chapter 2503.
Table 3.16 MFN tariff structure, 2009 and 20152009 2015 Bound tariff ratea
1. Bound tariff lines (% of all tariff lines) 100 100 1002. Simple average of applied MFN rates 20.2 12.5 42.2
Agricultural products (WTO definition) 44.5 30.0 58.0Non-agricultural products (WTO definition) 16.3 9.5 39.6Agriculture, hunting, forestry and fishing (ISIC 1) 29.0 16.5 41.5Mining and quarrying (ISIC 2) 9.1 4.2 36.8Manufacturing (ISIC 3) 19.9 12.3 42.3
3. Duty-free tariff lines (% of all tariff lines) 0.1 0.1 0.14. Simple average rate (dutiable lines) 20.2 12.5 42.35. Non-ad valorem tariffs (% of all tariff lines)b 0.21 0.16 0.06. Non-ad valorem tariffs with no AVEs (% of all tariff lines) 0.21 0.16 0.07. Tariff quotas (% of all tariff lines) 1.7 1.5 1.5
67 For the purposes of the analysis, the maximum rates of variable duty were used.

WT/TPR/S/329 • Kingdom of Morocco
- 44 -
2009 2015 Bound tariff ratea
8. Domestic tariff peaks (% of all tariff lines)c 1.5 6.2 1.89. International tariff peaks (% of all tariff lines)d 47.3 32.9 99.410. Overall standard deviation of applied rates 22.8 17.9 21.411. "Nuisance" applied rates (% of all tariff lines)e 0.0 0.0 0.0
a The final bound rates are based on the WTO's database of consolidated tariff schedules (CTS) (HS 2002).
b The calculations in the report are based on the out-of-quota ad valorem rates at domestic tariff line (10-digit) level provided by the authorities.
c Domestic tariff peaks are defined as rates exceeding three times the overall simple average applied rate.
d International tariff peaks are defined as rates exceeding 15%.e Nuisance rates are rates greater than zero, but less than or equal to 2%.Note: The 2015 tariff is composed of 17,784 tariff lines (at 10-digit level, according to the HS 2012
nomenclature).The 2009 tariff is composed of 17,735 tariff lines (at 10-digit level, according to the HS 2002 nomenclature).
Source: WTO Secretariat calculations, based on data provided by the authorities, and WTO database of consolidated tariff schedules (CTS).
Table 3.17 Brief analysis of the MFN tariff, 2015Number of
linesSimple average
rate (%)Range of rates
(%)CVa
Total 17,784 12.5 0-200 1.4Harmonized system (HS)Chapters 1 to 24 2,770 29.7 2.5-200 1.2Chapters 25 to 97 15,014 9.3 0-25 1.0By WTO definitionAgriculture 2,556 30.0 2.5-200 1.2Animal products 340 71.0 2.5-200 1.0Dairy produce 163 63.7 2.5-100 0.6Fruit, vegetables, plants 657 27.4 2.5-40 0.6Coffee, tea 68 17.7 2.5-32.5 0.5Cereals and other preparations 389 22.2 2.5-170 0.9Oilseeds, fats and oils 232 11.3 2.5-50 1.2Sugar and confectionery 122 21.1 10-.. 0.7Beverages and tobacco 154 38.8 2.5-49 0.3Cotton 11 2.5 2.5-2.5 0.0Other agricultural products 420 7.3 2.5-49 1.2Non-agricultural products 15,228 9.5 0-50 1.0Fish and fish products 446 16.6 2.5-50 0.7Metals and minerals 2,919 9.6 0-25 1.0Chemicals 3,075 7.3 2.5-25 1.1Wood, paper, etc. 1,000 14.1 2.5-25 0.7Textiles 2,948 8.3 2.5-25 0.8Clothing 522 23.8 2.5-25 0.2Leather, footwear, etc. 691 13.1 2.5-25 0.8Non-electrical machinery 1,164 5.2 2.5-25 1.3Electrical machinery 664 8.2 2.5-25 1.2Transport equipment 648 11.3 2.5-25 0.9Other manufactures n.e.s. 1,106 7.4 2.5-25 1.2Petroleum 45 8.2 2.5-25 1.1By ISIC sectorb
Agriculture, hunting, forestry and fishing 952 16.5 2.5-200 1.8Mining and quarrying 181 4.2 0-25 1.5Manufacturing 16,650 12.3 2.5-200 1.4
a Coefficient of variation (CV).b International Standard Industrial Classification of All Economic Activities (ISIC) (Rev.2), excluding
electricity, gas and water (one tariff line).Source: WTO Secretariat calculations, based on data provided by the authorities.
WT/TPR/S/329 • Kingdom of Morocco
- 45 -
Chart 3.9 Breakdown of applied MFN tariff rates, 2015Number of tariff lines
(0.06)
(67.3)
(7.8)
(18.9)
(3.8)(1.3) (1.2)
0
2,000
4,000
6,000
8,000
10,000
12,000
14,000
0% 0-10 10-20 20-30 30-40 40-50 >60
Note: The figures in brackets correspond to the percentage of total lines.Source: WTO Secretariat calculations, based on data provided by the authorities.
3.7. The level of protection nevertheless increases sharply for some products when the other import duties and taxes (namely, the parafiscal tax on imports and other taxes (Section 3.1.3.3)) are taken into account.
3.8. Customs duty escalates for all manufacturing industries, with only slightly higher rates at the second stage of processing compared to the first (from 7.4% at the first stage to 7.9% at the second), but with a distinct escalation from the second to the third stage, for which the average rate is 16.3%. With the exception of industries manufacturing non-metallic mineral products and other manufacturing industries, for which escalation is mixed, customs duties escalate for all other industries (Chart 3.3).
3.9. Overall, the tariff structure does not tend to encourage certain types of local processing. The high taxation on some inputs (particularly in agro-industry and industries manufacturing non-metallic mineral products) raises the cost of production and decreases the competitiveness of the finished goods produced. In addition, the clear-cut escalation of duty in other industries masks a fairly high level of effective protection which does not encourage efforts to improve the international competitiveness of the domestic products in question.
3.1.3.3 Other duties and charges levied solely on imports
3.1. A 0.25% parafiscal tax is levied on imported goods, including those under preferential regimes, but not those under the suspensive or export free zone regimes. It does not apply to imports under customs regimes; capital goods, equipment and tools, together with their parts, spare parts and accessories needed to promote investment; and duty-free goods or those on which import duties and taxes have been totally suspended, or those benefiting from exemption from import duties and taxes under agreements or conventions signed with certain countries. Likewise, firms making large-scale investment (over DH 200 million in 2014) are eligible for exemption from the parafiscal import tax on capital goods, equipment and tools, as well as parts, spare parts and accessories, needed to carry out their projects.68
68 Ministry of the Economy and Finance, ADII, online information, viewed at: http://www.douane.gov.ma.
WT/TPR/S/329 • Kingdom of Morocco
- 46 -
Chart 3.10 Escalation of applied MFN rates by manufacturing industry, 2015
0.0
5.0
10.0
15.0
20.0
25.0
30.0
35.0
40.0
45.0%
Not a
pplic
able
Unprocessed products
Semi-processedproducts Finished products
Aver
age
appl
ied
rate
in
man
ufac
turin
g in
dust
ry
Food
pro
duct
s,
beve
rage
s an
d to
bacc
o
Text
iles
and
cloth
ing
Woo
d an
d ar
ticle
s of
wo
od
Pape
r and
arti
cles
of p
aper
; prin
ting
and
publ
ishin
g
Chem
icals
Non-
met
allic
m
iner
al
prod
ucts
Basic
met
al
indu
stry
Artic
les
of m
etal
, m
achi
nery
and
eq
uipm
ent
Othe
r m
anuf
actu
ring
indu
stry
Not a
pplic
able
Note: Product groups in accordance with the two-digit ISIC definitions.Source: WTO Secretariat calculations, based on data provided by the authorities.
3.2. A number of other duties and taxes or levies apply to imports. These include the storage tax (4 to 14% depending on how long the goods remain in the customs warehouse); the flat-rate computer tax of DH 150; a tax for the control and stamping of imported handmade carpets (5%); and administrative fees for endorsing the manifest (DH 0.50 or 0.75 per deadweight tonnage – the lower fee applies to Moroccan ships – with a maximum of DH 1,500 or DH 3,000, respectively; DH 0.20 or DH 0.50/tonne if the tonnage of the goods loaded is less than one quarter of the deadweight; and DH 3.5 per passenger boarding Moroccan or foreign ships going to Morocco (with a maximum of DH 1,500).
3.1.3.4 Bindings
3.1. Morocco finished binding all its tariff lines during the Uruguay Round, including 156 headings in the Nomenclature of the Customs Co-operation Council (CCC), which had been bound when Morocco acceded to the GATT in 1987.69 Morocco bound its duties at exclusively ad valorem rates ranging from zero to 380%. Duty on non-agricultural products was bound at 40%, except for those bound in 1987. For agricultural products, Morocco undertook gradually to lower the bound rates by equal annual tranches, thus reducing the maximum bound rate to 289% in 2004. Since then, the simple average bound rate has been 42.2% (Table 3.3).
3.2. Over 24% of the lines bound in 1994 were bound at rates of 100% or more. The highest rate (originally 380% and then 289% since 2004) is on certain live animals and meat. For 374 lines, Morocco has reserved the right to invoke the special safeguard clause provided by Article 5 of the WTO Agreement on Agriculture. By October 2015, however, it had never made use of this right (Table 2.2). The simple average bound rate is 58% for agricultural products and 39.6% for non-agricultural products. Other duties and taxes on the majority of products have generally been bound at 15%, except for those on certain goods, bound at 7.5%.70
3.3. The tariff quotas in Morocco's schedule of commitments do not in practice apply to cereals, oilseed products and sugar. In fact, at the end of their reduction period (1995-2004) following the Uruguay Round, out-of-quota customs duties on these products became the same as or less than the duties applicable to quotas, making the quotas redundant. On the other hand, the quotas do in principle apply to animal products (Section 4.1.3).
69 The transposition of the 156 tariff headings bound in 1987 from the CCC nomenclature to the Harmonized System was certified in 1997 (WTO document WT/LET/168 of 5 September 1997).
70 WTO, Schedule LXXXI - Morocco, 15 April 1994.

WT/TPR/S/329 • Kingdom of Morocco
- 47 -
3.4. In all, the rate of customs duty applied remains above the bound rate for 792 tariff lines (compared to 1,373 in 2009) (Table 3.6). Bound rates are mostly exceeded for chapters relating to the agricultural sector, corresponding to over 50% of tariff lines of the following HS chapters: milk and dairy produce (HS 04), vegetables and plants (HS 07), edible fruit (HS 08), preparations of vegetables (HS 20) and beverages (HS 22). This analysis does not, however, take account of the products for which Morocco has signed the Information Technology Agreement (ITA) and which should be bound at zero, which could worsen the situation. Morocco's ITA schedule had not yet been notified to the Secretariat by October 2015. Moreover, imposing variable duties does not guarantee observance of commitments, neither in terms of customs valuation nor as regards tariff binding.
Table 3.18 Tariff lines for which the applied rate exceeds the bound rate, 2015
HS Description
Tota
l nu
mbe
r of
tar
iff
lines
Lines for which the applied rate exceeds the bound rate
Number of lines (%)
Average variation
(%)01 Live animals 99 7 7.1 15.002 Meat and edible meat offal 206 76 36.9 11.904 Milk and dairy produce; birds' eggs; natural honey; edible products
of animal origin, not elsewhere specified or included 188 98 52.1 12.1
07 Edible vegetables and certain roots and tubers 181 110 60.8 6.008 Edible fruit and nuts; peel of citrus fruit or melons 135 70 51.9 6.011 Products of the milling industry; malt; starches; inulin; wheat gluten 144 8 5.6 6.015 Animal or vegetable fats and oils and their cleavage products;
prepared edible fats; animal or vegetable waxes140 30 21.4 7.7
16 Preparations of meat, of fish or of crustaceans, molluscs or other aquatic invertebrates
102 35 34.3 8.1
19 Preparations of cereals, flour, starch or milk; pastrycooks' products 117 26 22.2 6.020 Preparations of vegetables, fruit, nuts or other parts of plants 258 218 84.5 6.021 Miscellaneous edible preparations 78 26 33.3 6.322 Beverages, spirits and vinegar 88 83 94.3 14.123 Residues and waste from the food industries; prepared animal
fodder61 2 3.3 15.0
25 Salt; sulphur; earths and stone; plastering materials, lime and cement
146 2 1.4 2.5
48 Paper and paperboard; articles of paper pulp, of paper or of paperboard
261 1 0.4 15.0
Total 17,784 792 4.5 8.4
Source: WTO Secretariat calculations, based on data provided by the Moroccan authorities, and WTO consolidated tariff schedule (CTS) database.
3.5. According to the authorities and their replies to written questions in connection with Morocco's previous TPR, the "other duties and taxes" (more specifically, the 15% fiscal levy) were amalgamated with customs duty in July 2000. The authorities thus consider that applied and bound rates cannot be compared without taking into account this amalgamation; by this reasoning, a single tariff line (fresh or chilled foie gras, HS code 0207600030) shows an applied customs duty in excess of the bound rate, namely an applied rate of 100% and a bound rate of 49%.
3.6. Morocco's schedule of concessions was transposed into the 1996 version of the HS and certified in 2005 (see document WT/LET/497 of 13 May 2005). Transposition into the 2002 version of the HS, prepared by the WTO Secretariat in collaboration with Morocco, was certified in 2010 (see document WT/LET/665 of 17 February 2010). As regards transposition into the 2007 version of the HS, Morocco has promised to prepare the transposition document. In a communication dated 8 October 2014, Morocco requested the WTO Secretariat to allow it to notify its schedule of concessions directly in the 2012 version of the HS. By October 2015, however, the 2012 HS version of Morocco's schedule of concessions had not yet been notified to the Secretariat.
3.1.3.5 Internal duties and taxes
3.1.3.5.1 Value added tax (VAT)
3.1. VAT applies to both imported and domestically produced goods and services. For imports, it is levied on the customs value, plus any duties and taxes imposed, including the TIC. For domestically produced goods, it is calculated on the selling price. As indicated below, the sale of some agrifood products is exempt from VAT with no right of deduction. The General Tax Code defines two different VAT regimes: an "internal" regime and an import regime.
WT/TPR/S/329 • Kingdom of Morocco
- 48 -
3.2. The VAT reform initiated in 2014 was intended to introduce a lower 10% rate and a standard 20% rate. The 10% reduced rate was extended to water and sanitation services and to loan operations linked to social housing. The 20% rate applies to consumer products such as tea, flours and semolina of rice and other starch flours, raisins and dried figs, edible fats, commercial vehicles and highway tolls. Two other reduced rates apply, so there are four rates in all 71, including: a standard 20% rate; and three reduced rates of 14% (with or without right of deduction); 10% (with right of deduction), and 7% (with right of deduction).72 There are special VAT rates on wine other than sparkling wine (DH 100/hl); on platinum or gold articles (DH 5/g); and silver articles (DH 0.1/g). The General Tax Code provides for two separate lists of products that are VAT exempt: one (fairly lengthy) includes products and services exempt "internally" and the other (shorter) exemptions for imports. This profusion of rates and exemptions makes the VAT regime highly complex (Table 3.7).
Table 3.19 Some products for which there is a difference between the internal VAT and the import VAT, 2015Product Internal VAT (%) Import VAT (%)Powdered milk 0 0 (babies), 7 (food), 20 (other)Dates packaged in Morocco 0 20Virgin olive oil 0 10 (food), 20 (other)Oils other than edible oils .. 20Cereals, grains and straw 0 0 (food), 20 (other)Fresh, chilled or frozen fish 0 20
.. Not available.Source: WTO Secretariat based on data on the ADII website, viewed at:
http://www.douane.gov.ma/web/guest/rdii#http://www.douane.gov.ma/content/rdii/titres.jsf.
3.3. The following, inter alia, also appear on the list of exemptions from internal VAT: essential goods (bread, couscous, flour, semolina, milk, raw sugar, packaged dates grown in Morocco, fishery products, fresh meat, and olive oil); straight feeding stuffs such as cereals, grains and straw; medical services and some medical products and equipment; medicines for certain diseases (cancer, hepatitis B and C, cardiovascular disease, AIDS, diabetes, asthma); fertilizers, equipment solely for agricultural use; fishing gear and fishing nets for professional use; capital goods, equipment and tools purchased by certain non-profit-making associations; newspapers, books, and CD-ROMs containing printing and typesetting programmes, cultural and educational books; documentary or educational films; offshore banks for interest and commission, and for new capital goods purchased locally; and holding companies for some of their transactions.
3.4. The Finance Law introduced new measures as of 1 January 2014, including elimination of the VAT exemption for a certain number of agricultural capital goods.73
3.5. The list of goods exempt from import VAT includes essential goods such as flour (except for rice flour), semolina, couscous, milk, farm butter, eggs, raw sugar and other goods; live animals of several species including cattle, pigs, sheep and goats; Moroccan sea fishery products; paperback or bound books, newspapers and periodicals; printed music and CD-ROMs reproducing publications and books; imported educational, scientific or cultural materials; imports by certain institutions or companies (for example, buses, lorries and capital goods purchased by international road transport companies); capital goods, equipment and tools needed to carry out investment projects of an amount of DH 200 million or more; ships, boats and liners; goods donated to the State, to local authorities, public institutions and recognized associations; medicines for certain diseases; and products and equipment for haemodialysis.
3.1.3.5.2 Internal consumption tax (TIC)
3.1. The TIC applies at the same rates to some types of goods whether imported or domestically produced, for example, non-alcoholic beverages (DH 7 to 83/hl); beer (DH 900/hl); wine (DH 700/hl); ethyl alcohol or other alcohol to be used to receive ethyl alcohol applications (DH 20,000/hl of pure alcohol); manufactured tobacco (DH 11.34/packet)74; energy products (DH 33.50 to DH 357.20/hl) or DH 228/100 kg for lubricants, crude petroleum oil or bituminous
71 The list of products subject to reduced VAT rates can be viewed on the ADII website at: http://www.douane.gov.ma/web/guest/rdii#http://www.douane.gov.ma/content/rdii/titres.jsf.
72 Right of deduction (granted under the internal VAT regime) allows VAT paid on the purchase of goods, materials, services, general costs and equipment to be deducted from the VAT collected.
73 See the provisions in Articles 99-2nd and 121-2nd of the General Tax Code and the list of agricultural equipment subject to internal and import VAT at the reduced rate of 10%.
WT/TPR/S/329 • Kingdom of Morocco
- 49 -
minerals, DH 4.60/100 kg for liquefied gas, DH 341.40/hl for "premium grade NGP 27-07 petrol" and DH 2/1,000 m3 for natural gas); bitumen, asphalt and bituminous mixtures (DH 90/100 kg); and platinum and gold articles (DH 100/hg) and silver articles (DH 15/hg). In 2010, the customs services introduced special fiscal marking for beverages (alcoholic or non-alcoholic) and manufactured tobacco subject to payment of the TIC. In 2015, the TIC was DH 0.16 per bottle of beer, DH 1.30 per bottle of wine, DH 2 for spirits, 0.8 centimes per bottle of water, 2.4 centimes for soda and DH 0.35 per packet of cigarettes.
3.1.3.5.3 Other internal taxes
3.1. Other taxes are levied on imports and domestic production: the special tax on cement (DH 150/tonne; two new taxes on rebar (DH 100/tonne) and sand (DH 30/tonne); an environmental tax on wood and articles of local and imported wood (12% or 6%75); a parafiscal tax on imports and the production of wine and beer (DH 5/hl); and a tax on the sale of dried beet pulp (DH 10/kg net weight).
3.2. There are levies on the services rendered by the National Food Safety Board (ONSSA) for the control and sanitary and phytosanitary inspection of imports or exports and at the domestic level (Section 3.1.3.7).
3.1.3.6 Duty and tax exemptions and concessions
3.1. Exemptions are granted under the Investment Charter and in connection with large-scale investment under investment agreements signed with the Government76 (Sections 2.5 and 4.1). During Ramadan or periods of drought, duty and tax on the import of food products may be reduced or suspended within or outside the quota limits. Since Morocco's previous TPR, the following products have benefited from such measures: milk, common wheat and durum wheat. Morocco also gives exemption and suspension of duties and taxes pursuant to the Vienna Convention on diplomatic relations.
3.1.3.7 Tariff preferences
3.1. Morocco grants preferential treatment on a reciprocal basis for imports from countries with which it has signed regional or bilateral trade agreements (Table 3.8, see also Section 2.3).
Table 3.20 Applied MFN rates and preferential rates, 2015
Total Agricultureby WTO definition
Non-agricultural products by WTO
definition
Sim
ple
aver
age
rate
(%
)
Rang
e (%
)
Dut
y-fr
ee
tari
ff li
nes
(%)a
Sim
ple
aver
age
rate
(%
)
Rang
e (%
)
Dut
y-fr
ee
tari
ff li
nes
(%)a
Sim
ple
aver
age
rate
(%
)
Rang
e (%
)
Dut
y-fr
ee
tari
ff li
nes
(%)a
MFN 12.5 0-200 0.1 30.0 2.5-200 0.0 9.5 0-50 0.1EFTA 4.4 0-200 84.5 26.7 0-200 16.1 0.7 0-50 96.0Agadir 0.9 0-100 91.5 3.4 0-100 90.4 0.5 0-25 91.6Algeria 0.0 0.0 100.0 0.0 0.0 100.0 0.0 0.0 100.0Kingdom of Saudi Arabia 6.4 0-200 39.7 20.3 0-200 31.3 4.1 0-50 41.1Egypt 7.0 0-200 61.5 29.2 0-200 8.1 3.3 0-50 70.5United Arab Emirates 0.9 0-100 91.4 3.4 0-100 90.3 0.5 0-25 91.6United States 1.6 0-200 95.5 10.0 0-200 75.7 0.2 0-40 98.8Greater Arab Free Trade Area 0.9 0-100 91.4 3.4 0-100 90.3 0.5 0-25 91.6Guinea 12.3 0-200 1.7 29.3 0-200 5.1 9.4 0-50 1.1Iraq 0.0 0.0 100.0 0.0 0.0 100.0 0.0 0.0 100.0Jordan 7.2 0-200 61.4 29.3 0-200 7.6 3.4 0-50 70.4Libya 0.0 0.0 100.0 0.0 0.0 100.0 0.0 0.0 100.0Mauritania 10.4 0-200 17.1 22.1 0-200 25.7 8.4 0-50 15.7
74 The TIC on manufactured tobacco came into force on 1 January 2003. It was revised in 2013, introducing, inter alia, special taxation. This rose from DH 10.66/packet in 2014 to DH 11.34/packet in January 2015 and the Ministry of Finance is considering the possibility of imposing a new tax in 2016. VAT of 20% is also payable on manufactured tobacco.
75 The reduced rate of 6% applies only to untreated rough Okoumé wood in logs, with a butt circumference of 60 cm or more.
76 Investment agreements signed with the Government in accordance with the provisions in Article 7.I of Finance Law No. 12-98.
WT/TPR/S/329 • Kingdom of Morocco
- 50 -
Total Agricultureby WTO definition
Non-agricultural products by WTO
definitionSenegal 10.3 0-200 16.8 25.2 0-200 15.4 7.7 0-50 17.1Tunisia 5.3 0-200 74.7 25.0 0-200 21.0 2.0 0-50 83.7Turkey 4.5 0-200 85.0 28.5 0-200 14.5 0.5 0-50 96.8European Union 2.7 0-200 91.1 16.3 0-200 58.1 0.5 0-35 96.6LDCs 12.4 0-200 1.4 29.4 0-200 5.9 9.5 0-50 0.6
a Percentage of total lines.Source: WTO Secretariat calculations, based on data provided by the authorities.
3.2. Whilst the average applied MFN rate is 12.5%, the average applied preferential tariff ranges from zero for Algeria, Libya and Iraq to 12.3% and 12.4% for Guinea and LDCs, respectively (Table 3.8). Preferences under the Agadir Agreement, with the Greater Arab Free Trade Area and with the United Arab Emirates show an average tariff of 0.9%. EFTA, Turkey and the EU are also given an average preferential rate of less than 1% on non-agricultural products. Goods must be covered by a certificate of origin in order to be eligible for preferential treatment (Section 3.2.1 below).
3.1.4 Rules of origin
3.1. Morocco applies two types of rules of origin: non-preferential and preferential. Pursuant to the relevant domestic legislation77 and without prejudice to agreements signed with other States, goods are deemed to originate in a particular country if they have been wholly obtained there or obtained there using products and raw materials of foreign origin (within the meaning of Article 16 of the Customs and Excise Code), after undergoing full-scale processing that has meant that they have lost their original characteristics. Full-scale processing means working or processing that results in value added at least equivalent to the import value of the inputs in the processing country (i.e. local upgrading of at least 50%). Special rules78 apply to textile goods and articles of clothing (weaving, printing and making up are deemed to be full-scale processing that confers origin).
3.2. Preferential rules of origin are defined in bilateral or regional agreements or arrangements (Table 3.9 and Section 2.3). All these agreements or arrangements require direct transportation. For goods imported from EU and EFTA countries, Turkey or countries belonging to the Agadir Agreement (Tunisia, Egypt, Jordan), a EUR1 or EURMED certificate for the movement of goods or a declaration on the invoice or on the EURMED invoice is required. The status of "approved exporter" gives the beneficiary enterprise the possibility of certifying the origin of goods covered by preferential agreements itself by means of a declaration on the invoice or on the EURMED invoice. For other imports a standard certificate of origin is required.
Table 3.21 Preferential rules of origin
Agreement Rules Comments/cumulationAssociation Agreement with the EU
EU rules: Wholly obtained;Sufficient processing based on special rules for each product requiring a change in tariff classification, a level of value added or a specific manufacturing process.The list of working does not confer origin.Tolerance for the incorporation of non-originating materials provided that their total value does not exceed 10% of the product price.
Bilateral cumulation of origin for materials and working among the contracting parties; and pan-Euro-Mediterranean diagonal cumulation.
77 Customs and Excise Code and Decree No. 2-77-862 of 9 October 1977 adopted to implement the Code.
78 Decree No. 2-98-387 of 5 January 1999, amending and supplementing Decree No. 2-77-862 of 9 October 1977.
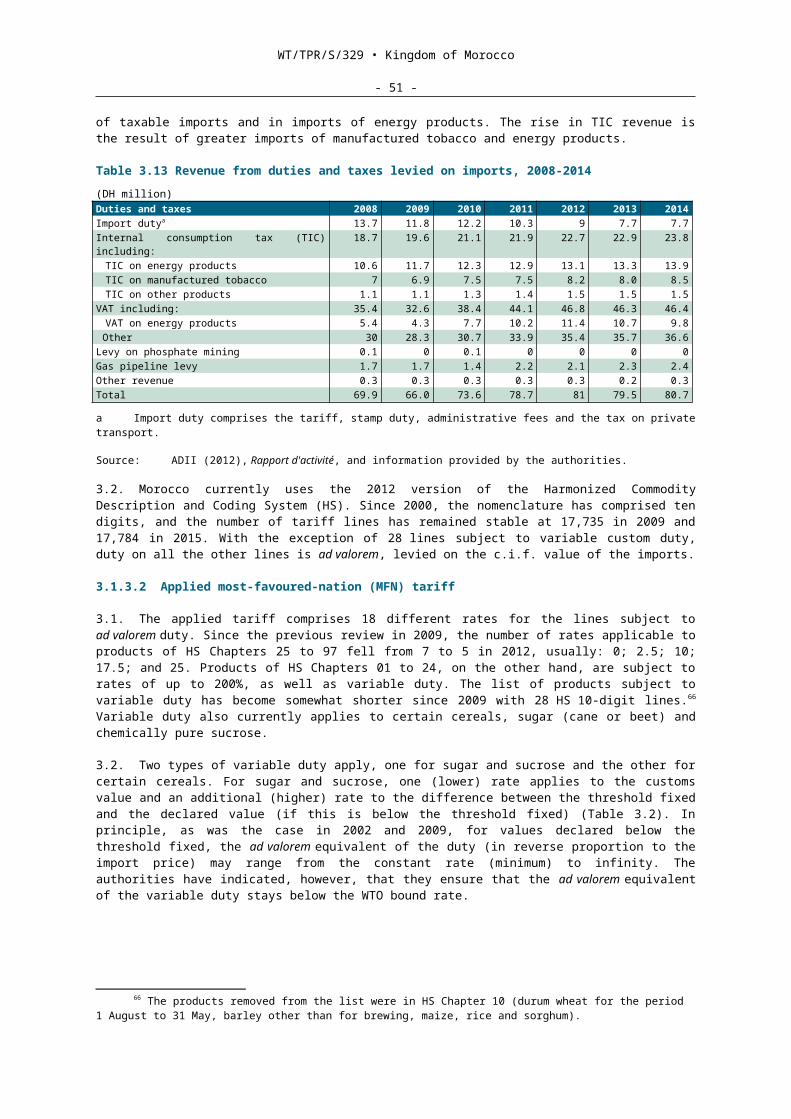
WT/TPR/S/329 • Kingdom of Morocco
- 51 -
Agreement Rules Comments/cumulationFree Trade Agreement (FTA) with EFTA
For industrial products
For agricultural products
Wholly obtained;
Sufficient processing based on special rules for each product.Negative list of operations conferring origin.Tolerance for incorporation of non-originating materials provided that their total value does not exceed 10% of the product price.
Special rule
Bilateral cumulation of origin for materials among the contracting parties; and pan-Euro-Mediterranean diagonal cumulation.
Neither bilateral nor diagonal cumulation.
FTA with the United States Wholly obtained; Product must meet the definition of "a new or different article of commerce that has been grown, produced or manufactured in the territory of one or both of the Parties" and have a local content value of at least 35%; orspecial rules for textile products (Annex 4-A) and some other goods (Annex 5-A).
Total bilateral cumulation.
FTA with Turkey EU rules Bilateral cumulation of materials; Cumulation of materials between Morocco, Turkey and the EU for textile goods; and pan-Euro-Mediterranean diagonal cumulation.
Trade facilitation and promotion agreement among Arab countries (the Arab League countries)
Wholly obtained; Sufficient processing based on special rules for each product.Local upgrading of at least 40% for some agricultural products.
Cumulation of materials among Member countries.
Agadir Agreement
FTAs with Tunisia, Egypt and Jordan
EU rules
Wholly obtained; Sufficient processing involving local upgrading of at least 40%.
Bilateral cumulation of materials among the contracting parties; and pan-Euro-Mediterranean diagonal cumulation of working.
Bilateral cumulation of materials among the contracting parties.
FTA with the United Arab Emirates Wholly obtained; Sufficient processing based on special rules for each product.Local upgrading of at least 40% for some agricultural products.
Bilateral cumulation of materials among the contracting parties.
Tariff and trade agreements with other Arab and African countries (Algeria, Libya, Iraq, Kingdom of Saudi Arabia, Mauritania, Guinea and Senegal)
Wholly obtained; Sufficient processing involving local upgrading of at least 40%, except for:- Iraq: local upgrading of at least 41%, and- Senegal: no preferential rule specified.
Cumulation of materials applicable only in the case of the agreements with Algeria, Libya and Guinea.
Source: Agreements and conventions viewed on the ADII's website: http://www.douane.gov.ma/web/guest/accords and http://www.douane.gov.ma/accords/detailsAccord.jsf. Information provided by the Moroccan authorities.
3.3. Pan-European cumulation of origin, which encompassed the EC and the EFTA member countries, has been extended to several Mediterranean countries, including Morocco. The extended system (pan-Euro-Mediterranean cumulation of origin) now includes the EU and EFTA member countries, Turkey, the Faroe Islands and the signatories to the Barcelona Convention79, namely, Algeria, the Palestinian Authority, Egypt, Israel, Jordan, Lebanon, Morocco, Syria and Tunisia. It is based on a network of preferential agreements and allows diagonal cumulation if the agreements provide for identical rules of origin. Currently, for Morocco, pan-Euro-Mediterranean cumulation applies to its relations with the EU, the EFTA and Agadir Agreement member countries and Turkey. Trade largely takes place within the framework of the pan-Euro-Mediterranean agreement. The ADII, which issues certificates of origin, highlights the problem of managing and controlling origin because the following: the profusion of rules and model certificates of origin for the same product, the numerous preferential regimes for the same product under the various agreements signed with the same country, and the complex rules which lead to differences of interpretation.
79 The 1995 Barcelona Declaration established a Euro-Mediterranean partnership based on three chapters for cooperation: political dialogue; economic relations (including free trade); and human, social and cultural relations.
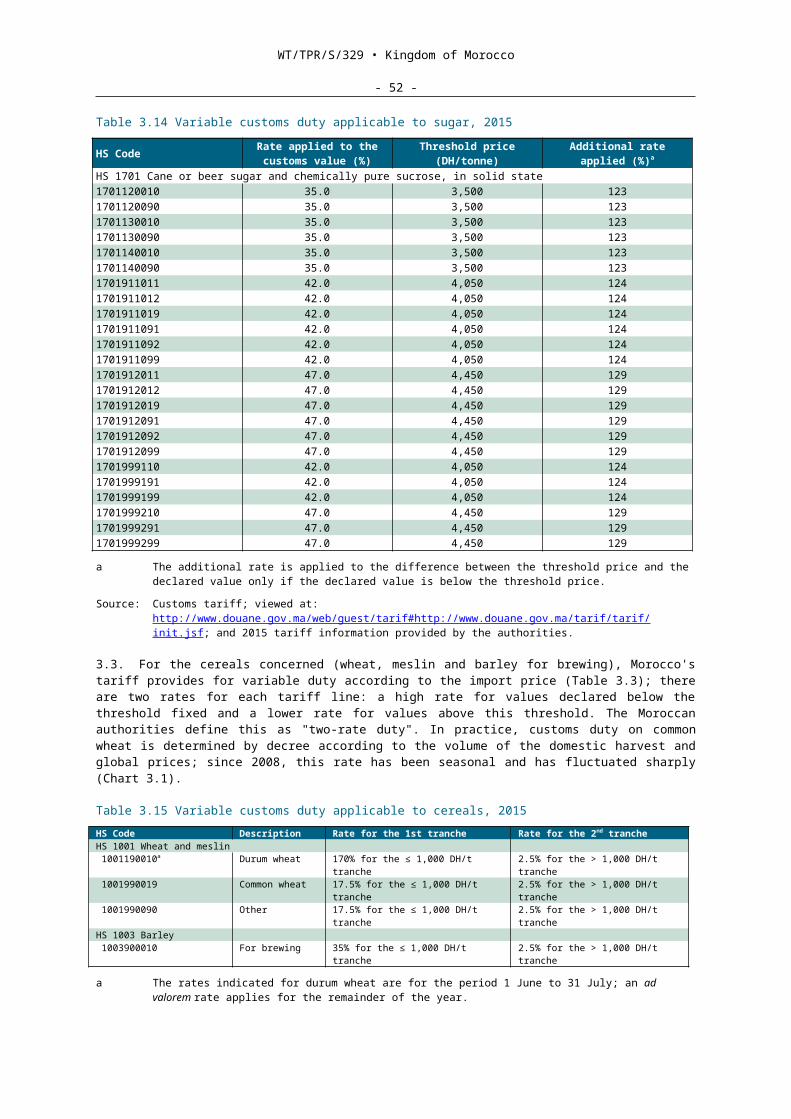
WT/TPR/S/329 • Kingdom of Morocco
- 52 -
3.1.5 Import prohibitions, quantitative restrictions, licensing and prior authorization
3.1. Imports are subject to various regulations, grouped by ADII on its website, by Harmonized System (HS) tariff line (ADIL system).
3.2. Some products are subject to administrative formalities and special regulations in order to "safeguard public morals, public safety and order, human health or to protect fauna and flora, the national historical, archaeological and artistic heritage or to maintain the country's external financial position".80 An import licence is required for the purpose. Import licences are granted by the Ministry responsible for foreign trade, but applications have to be made to the authority directly concerned by the product (Table 3.10).
Table 3.22 Some products whose import is restricted, 2015Products MeasureArms and ammunition Import licence (authorization from the National Security
services)Explosives and substances that could be used to manufacture arms and ammunition
Import licence (authorization from the Department of Mines)
Articles for publication Import licence (permit from the Ministry of Communication - MINCOM)
Mineral water Import licence (prior authorization from the Ministry of Health)Industrial products subject to technical regulations Import licence (conformity certificate from the Ministry
responsible for industry)Plants and plant products Import licence (authorization from the services responsible for
plant protection)Animals and animal products Import licence (veterinary sanitary inspection certificate from
the veterinary inspector responsible at the border post)Products for human or animal consumption Import licence (notification of the conclusions of the
suppression of fraud control, issued by the competent fraud suppression services)
Ceruses and compounds of lead Import licence (authorization from the Ministry responsible for employment)
Videograms Import licence (permit from the Moroccan Cinematographic Centre)
Telecommunications equipment Import licence (approval from the National Telecommunications Regulatory Agency)
Undenatured sulphur and sodium nitrate Import licence (import authorization from the local control authority)
Carrier pigeons Import licence (authorization from the authority responsible for national defence)
Radioactive sources Import licence (authorization from the Ministry of Health)Poisonous substances Import licence (authorization from the Ministry of Health)Toxic waste Import licence (authorization from the authority responsible for
the environment)Foodstuffs to be used for a particular food Import licence (authorization from the Ministry of Health)Cereals and leguminous plants Import licence (receipt for submission of the import declaration
and performance bond issued by the ONICL) Discs and phonographic recordings Import licence (permit from MINCOM)Certain halogenated hydrocarbon byproducts (CFCs) Import licence Refrigeration equipment using halogenated byproducts Import licence Worn clothing Import licence Used or retreaded tyres Import licence Wheels equipped with retreaded or used tyres Import licence Used chassis for motor vehicles Import licence Knives Import licence Ferrous and non-ferrous metals Import licence Drones Import licence Other products Import licence (Montreal Protocol of 16 September 1987 on the
sale and use of ozone-depleting substances) - Environment Endangered species and their products/waste CITESa, Stockholm Conventionb and Rotterdam Conventionc -
Environment (authorization from the competent authority or import ban)
Waste Basel Convention - Environment (import ban for list A; authorization from the department responsible for the environment for list B)
Food products ONSSA – Sample taken for each importSeeds and seedlings Authorization from the Ministry responsible for agriculture –
May only be sold by organizations approved by an order from the Ministry responsible for agriculture
Plants and plant products Technical inspection by the competent services of the Ministry responsible for agriculture – Must comply with the phytosanitary and technical regulations in force
Medicines and pharmaceuticals Pharmaceutical establishments authorized by the General Secretariat of the Government
80 Dahir No. 1-91-261 of 9 November 1992 enacting Law No. 13-89 on foreign trade.
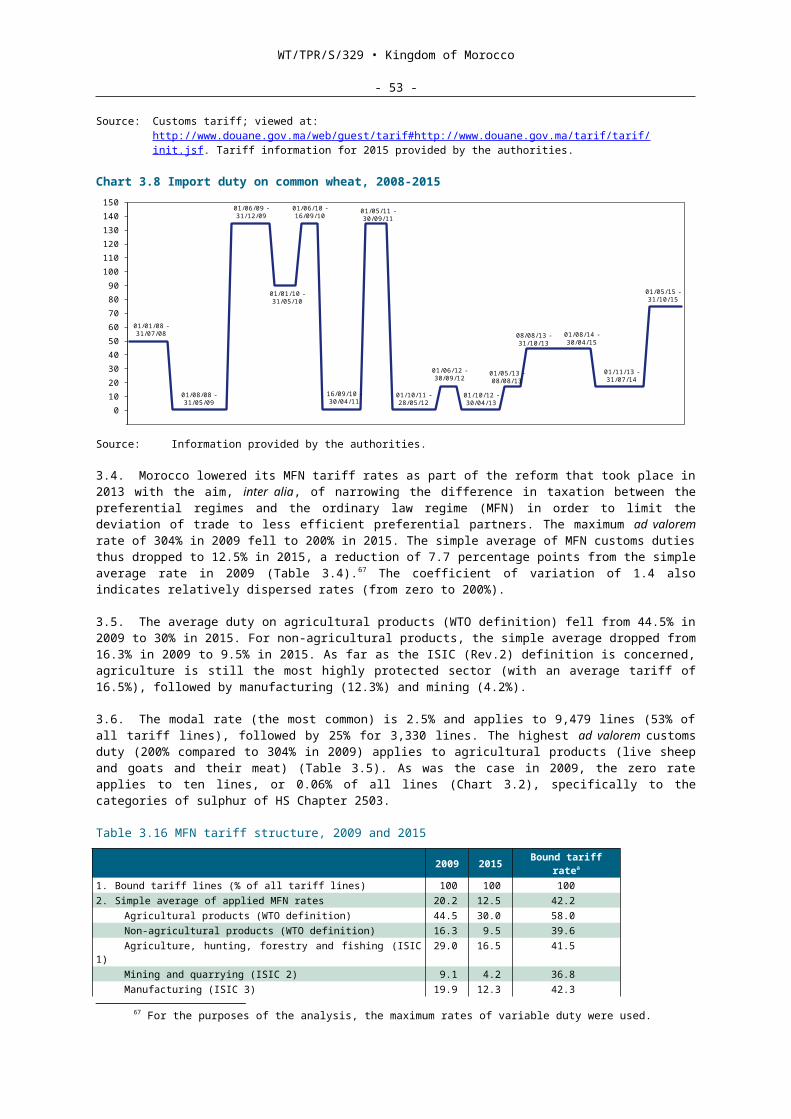
WT/TPR/S/329 • Kingdom of Morocco
- 53 -
a The Convention on International Trade in Endangered Species of Wild Fauna and Flora was incorporated into Morocco's legislation by means of Dahir No. 1-75-434 of 17 December 1976 and published in the OJ of 3 December 1980.
b The Stockholm Convention on Persistent Organic Pollutants was approved by Morocco by means of Dahir No. 01-04-4 of 21 April 2004.
c The Rotterdam Convention on the Prior Informed Consent Procedure for Certain Hazardous Chemicals and Pesticides in International Trade was incorporated into Morocco's legislation by means of Dahir No. 1-09-136 of 2 August 2011.
Source: WTO Secretariat, based on information transmitted by the authorities.
3.1.6 Contingency measures
3.1. Since its previous TPR, Morocco has adopted a legal framework establishing and defining rules and procedures governing trade defence measures. The novel feature of Law No. 15-0981 resides in the fact that it transposes the provisions found in the WTO Agreements into domestic law. Previously, contingency measures were governed by Law No. 13-89 of 1992 (as amended in 1997) on foreign trade82, which defined the basic principle without identifying the type of measures envisaged to deal with such practices. The new Law sets out the criteria for determining the existence of dumping, subsidization83, a massive increase in imports84, and injury or threat of injury85, together with the methods for implementing anti-dumping, countervailing and safeguard measures. It also provides for the creation of an Import Monitoring Commission responsible for giving the Ministry of Foreign Trade an opinion on all matters relating to implementation of trade defence measures.86
3.2. The new Law provides all the details concerning the procedures to be followed for investigations and applying measures. An investigation is initiated and conducted following a request submitted in writing in order to determine if there is dumping, a specific subsidy or a massive increase in imports of a product, material injury or threat of material injury and a causal link between the dumping, the subsidy or such an increase in imports and the injury or threat of injury. The request must be accompanied by objective and substantiated data. The acceptance or rejection of the request is notified to the applicant within ten days and the competent authority may decide to open an investigation within 21 days, after hearing the Commission's views. Notice of initiation of an investigation is published by the competent authority in at least two national newspapers. Any person interested has 30 days as of the date of publication of the notice in which to forward comments.
3.3. Once the request has been accepted, imports of the product at issue may be monitored, involving, where applicable, prior declaration of imports. Once the investigation has been initiated, the competent authority forwards questionnaires to all interested parties in order to collect the information needed for the investigation. A period of 30 days (37 days for exporters) is given for replies. This time-limit may be extended once only by a further 21 days when the situation so requires. After receiving the replies to the questionnaires, the competent authority assesses the information provided and may, after hearing the opinion of the Commission, apply a provisional measure to imports of the product concerned. Provisional measures are published in the Official Journal. At the conclusion of the investigation, the authority assesses the information collected and may, after hearing the opinion of the Commission, impose a definitive anti-dumping duty, a definitive countervailing duty or a definitive safeguard measure, which must also be published in the Official Journal.
3.4. The provisions on trade defence measures in the new Law No. 15-09 also apply in the same way to parties to trade agreements.
1.1.1.1 Safeguard measures
3.5. Any import to be put on sale in Morocco may be subject to a safeguard measure following an investigation if it is found that there is a massive increase in imports of the product in question
81 Dahir No. 1-11-44 of 2 June 2011 enacting Law No. 15-09 on trade defence measures, published in the OJ of 30 June 2011.
82 Dahir No. 1-91-261 of 9 November 1992 enacting Law No. 13-89 on foreign trade; Dahir No 1-97-63 of 12 February 1997 enacting Law No. 3-96; and Implementing Decree No. 2-93-415 of 2 July 1993, as amended by Decree No. 2-99-1261 of 4 May 2000.
83 Articles 6 to 12 of Section I of the Law.84 Articles 52 to 54 of Title III of the Law.85 Articles 13 to 15 of Section II of the Law.86 Articles 3 and 4 of Chapter II of the Law.
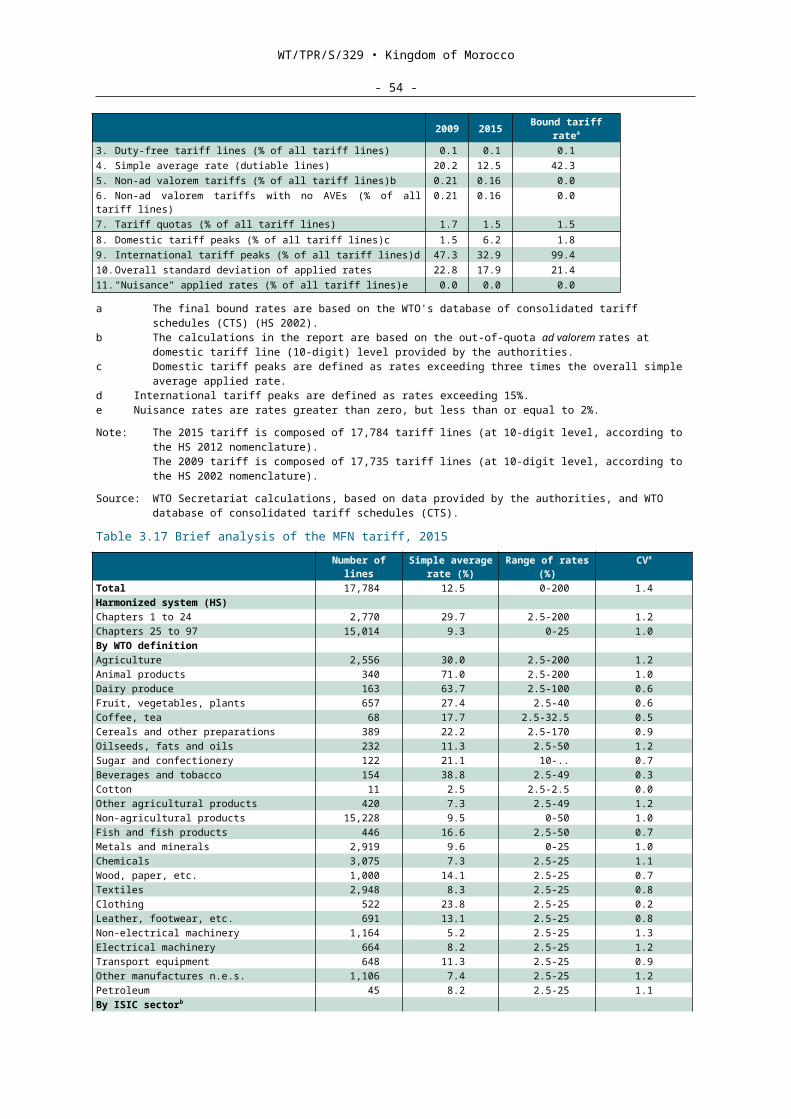
WT/TPR/S/329 • Kingdom of Morocco
- 54 -
relative to domestic production and that this increase causes or threatens to cause material injury to the domestic industry producing the like or competitive product.87
3.6. Since its previous TPR, Morocco has imposed new safeguard measures on imports of ceramic tiles, wire rod and rebar, cold-rolled sheets and plated or coated sheets. Firstly, in June 2009, a definitive safeguard measure in the form of a specific additional duty of DH 1.5/kg on imports above a quota of 7,596,000 m2 was extended until 31 December 2010 for ceramic tiles (HS code 6908).88 Imports within the limits of quotas fixed for groups of countries were not, however, affected. WTO developing country Members whose share of imports did not exceed 3% were not subject to this safeguard measure.
3.7. In May 2013, a provisional safeguard measure in the form of a specific additional import duty of DH 0.55/kg was imposed for a period of 200 days on wire rod of iron or non-alloy steel (national subheading 7213919000) and rebar (national subheadings 7214209000 and 7214999100). Following the investigation, a definitive safeguard measure in the form of a specific additional import duty of DH 0.55/kg was imposed in 2014 until 31 December 2015. This measure applies to imports above a quota of 100,000 tonnes for wire rod and 60,000 tonnes for rebar. These quotas are increased by 10% annually.89 A provisional safeguard measure in the form of an additional ad valorem import duty of 25% was imposed from 23 October 2014 on cold-rolled sheets and plated or coated sheets for a period of 200 days. The definitive measure, for a period of four years, was in the form of an additional duty of 22%, which will gradually be phased out (20% in 2016; 18% in 2017; 16% in 2018; then 0% in 2019) with a tariff quota of 36,000 tonnes not subject to the additional duty.
3.8. In June 2015, Morocco notified the WTO Committee on Safeguards that it had initiated a safeguard investigation regarding paper in rolls (national heading for HS 4802.55.90.00) and paper in reams (national subheading for HS 4802.57.90.00).90 A communiqué from the Ministry responsible for foreign trade concerning the initiation of the investigation was made available to the public.91
3.9. The safeguard measures imposed on imports of ceramic tiles92, wire rod and rebar93, and cold-rolled sheets and plated or coated sheets94 have been notified to the WTO.
3.1.6.2 Anti-dumping and countervailing measures
3.1. When imports cause or threaten to cause material injury to an established domestic industry, or materially retard its establishment, countervailing or anti-dumping duties may be imposed in specific cases. Imports may become subject to a countervailing duty if it is found that the product imported has benefited from a subsidy for its manufacture, production or export in its country of origin or source and that this financial contribution gives it an advantage.95 An anti-dumping duty may be levied if the import price is below the product's "normal value".96 The two duties may be imposed provisionally as an emergency measure until the adoption of definitive measures.
3.2. Producers, their associations, or authorities acting on behalf of a domestic industry may request that such duties be applied. The requests must be filed with the Ministry of Foreign Trade
87 Article 52, Title III, of the Law.88 Order of the Minister of the Economy and Finance No. 2973-09 of 4 December 2009, published in OJ
No. 5802 of 7 January 2010.89 Joint Orders of the Minister of Industry, Trade, Investment and the Digital Economy and the Minister of
the Economy and Finance No. 732-14 of 21 March 2014 and No. 1616-14 of 6 May 2014, published in OJ No. 6244 of 3 April 2014 and OJ No. 6262 of 5 June 2014.
90 WTO document G/SG/N/6/MAR/9 of 11 June 2015.91 Viewed at: http://www.maroc-trade.gov.ma.92 WTO documents G/SG/N/8/MAR/2/ - G/SG/N/10/MAR/2/ - G/SG/N/11/MAR/1 of 2 September 2005, and
G/SG/N/8/MAR/2/Suppl.1 - G/SG/N/10/MAR/2/Suppl.1 - G/SG/N/11/MAR/1/Suppl.1 of 6 March 2006, G/SG/N/8/MAR/2/Suppl.2 - G/SG/N/10/MAR/2/Suppl.2 - G/SG/N/11/MAR/1/Suppl.2 of 3 July 2009, and G/SG/N/8/MAR/2/Suppl.3 - G/SG/N/10/MAR/2/Suppl.3 - G/SG/N/11/MAR/1/Suppl.3 of 3 September 2010.
93 WTO documents G/SG/N/7/MAR/2 - G/SG/N/8/MAR/3 - G/SG/N/11/MAR/2 of 2 May 2013, G/SG/N/8/MAR/3/Suppl.1 - G/SG/N/10/MAR/3/ - G/SG/N/11/MAR/2/Suppl.1 of 20 December 2013, G/SG/N/8/MAR/3/Suppl.1/Corr.1 - G/SG/N/10/MAR/3/Corr.1 - G/SG/N/11/MAR/2/Suppl.1/Corr.1 of 26 May 2014, and G/SG/N/8/MAR/3/Suppl.2 - G/SG/N/10/MAR/3/Suppl.1 - G/SG/N/11/MAR/2/Suppl.2 of 11 April 2014.
94 WTO documents G/SG/N/7/MAR/3 and G/SG/N/11/MAR/3 of 22 October 2014.95 Law No. 15-09 on trade defence measures, enacted by Dahir No. 1-11-44 of 2 June 2011.96 The normal value is defined as the price of a like product destined for consumption in the exporting
country or, in its absence, the highest price for export of a like product to a third country, or the production cost of a product in the country of origin, plus a "reasonable" amount for selling costs and for profits.
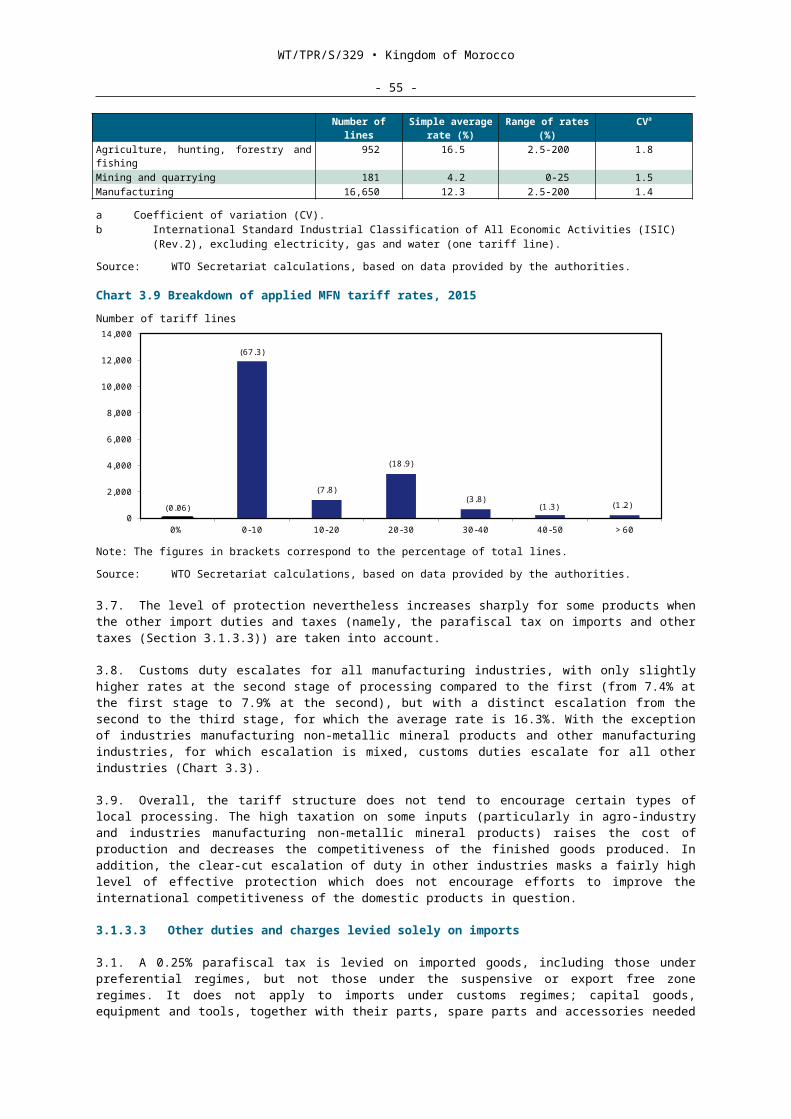
WT/TPR/S/329 • Kingdom of Morocco
- 55 -
and contain evidence of the existence of dumping or a specific subsidy and the injury caused, as well as the causal link between the imports and the injury caused. The new Law No. 15-09 also contains provisions concerning certain situations such as price undertakings, which may be offered by exporters or demanded by the Ministry responsible for foreign trade. For example, an anti-dumping or countervailing duty may not be applied to a dumped or subsidized product if the exporter undertakes to revise its prices sufficiently to remedy the injury.
3.3. The amount of the anti-dumping duty must not exceed the margin of dumping and that of the countervailing duty the amount of the subsidy. Once imposed, the measure remains in effect for as long as the practices which justified it persist. The period of application may not, however, exceed five years and the measure may be reviewed at the end of the five-year period according to the terms and criteria set out in the national Law. These provisions may also apply to parts or components to be used to assemble a product subject to an anti-dumping or countervailing duty or to the product's final working, after an anti-circumvention investigation has taken place according to the terms and criteria set out in the national Law.
3.4. Morocco, which had not taken any countervailing or anti-dumping duty action at the time of its previous TPR, has since introduced anti-dumping measures on imports of plywood, polyvinyl chloride (PVC), hot-rolled steel plate, A4-size paper and insulin. In February 2013, a definitive anti-dumping duty of 25% was imposed for a period of five years on imports of plywood (HS subheadings 44121391, 44121399, 44121491, 44121499, 44121991, 44121999, 44122291, 44122299, 44122991 and 44122999) originating from China.97 In January 2014, a definitive anti-dumping duty depending on the exporter was imposed98 for a period of five years on imports of PVC in primary form, not mixed with other substances (national subheading for HS 3904109000), originating from the United States.99
3.5. In 2013, a provisional anti-dumping duty of up to 22% was imposed on imports of hot-rolled steel plate (HS heading 7208, except for certain subheadings) originating from the EU and Turkey. In June 2014, following the conclusion of the investigation, some European companies saw their duty divided in half whereas for Turkish companies the duty is now 11%. These measures will remain in effect for five years.100 Hot-rolled steel plate used to build and repair ships is not, however, subject to the definitive anti-dumping duty.
3.6. In 2014, a definitive anti-dumping duty of 10.6% was imposed for a period of five years on imports of A4-size paper (297 mm x 210 mm) (national subheading for HS 4802569000) originating from Portugal.101 In November 2014, a definitive anti-dumping duty of 13.89% was imposed for a period of five years on imports of human insulin in 10-ml bottles (national subheading for HS 3004311000) originating from Denmark.102 This duty was suspended following the exporter's undertaking to change its export price to Morocco.
3.7. As regards countervailing measures, Morocco has not initiated any investigation and has not applied any such measure.
3.1.7 Standards and other technical requirements
3.1.7.1 Standards, testing and certification
3.1. According to the authorities, Morocco's standards and technical regulations are based on international standards, including those of the International Organization for Standardization (ISO) (to which Morocco belongs), the Codex Alimentarius for food products, and European standards,
97 Order of the Minister of the Economy and Finance No. 4231-12 of 21 December 2012, published in OJ No. 6124 of 7 February 2013.
98 The anti-dumping duty applicable (by exporter) is: ICC Chemical Corp. (42.4%); Intracon Corp. and Shintec (43.6%); Mareubini (31.9%); Mitsubishi Corp. (37.5%); Oxyde Chemicals (38.7%); Snetor (22.9%); Tricon Energy (43.1%); Vinmar Overseas Ltd and other exporters (56.2%).
99 Joint Order of the Minister of Industry, Trade, Investment and the Digital Economy and the Minister of the Economy and Finance No. 3035-13 of 4 November 2013, published in OJ No. 6218 of 2 January 2014.
100 Joint Order of the Minister of Industry, Trade, Investment and the Digital Economy and the Minister of the Economy and Finance No. 3024-14 of 27 August 2014, published in OJ No. 6296 of 2 October 2014.
101 Joint Order of the Minister of Industry, Trade, Investment and the Digital Economy and the Minister of the Economy and Finance No. 3399-14 of 7 October 2014.
102 Joint Order of the Minister of Industry, Trade, Investment and the Digital Economy, the Minister of Health and the Minister of the Economy and Finance No. 3574-14 of 15 October 2014, published in OJ No. 6306 of 6 November 2014.
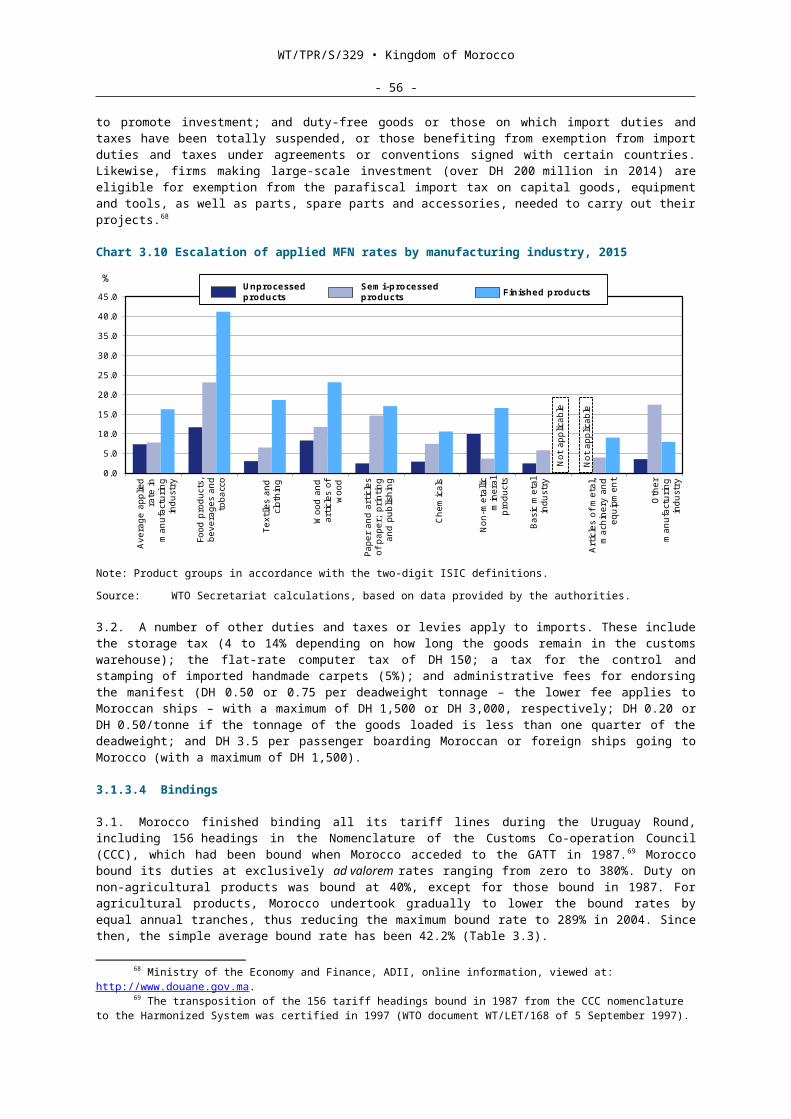
WT/TPR/S/329 • Kingdom of Morocco
- 56 -
notably those transposed by the French Association for Standardization (AFNOR).103 The reorganization of the national standards system led to the enactment of Law No. 12-06 in March 2011 (which came into force in 2013) on standardization, certification and accreditation, and the creation of the Moroccan Standards Institute (IMANOR). The latter has taken over the activities of the Moroccan Industrial Standardization Service (SNIMA), which was set up in 1970 under the Ministry responsible for industry with the task of providing Morocco's economy with a series of technical standards to enhance the competitiveness and quality of Moroccan products. The ONSSA, under the aegis of IMANOR, is responsible for laying down agrifood standards.
3.2. IMANOR drafts and promotes Moroccan standards, issues certificates of conformity with standards and normative references, provides training in standards and implementation techniques and represents Morocco in international and regional standardization organizations.104
IMANOR is a public institution and is financially autonomous; it is administered by a governing board composed of representatives of the public and private sectors, consumers' associations, laboratories and research and training institutions. In July 1997, Morocco accepted the WTO Code of Good Practice for the Elaboration, Adoption and Application of Standards. IMANOR is also the national enquiry point for standards, technical regulations and conformity assessment procedures.
3.3. Since 2013, the Moroccan Accreditation System (SEMAC) in the Ministry responsible for industry has been in charge of accreditation and evaluating the technical competence of certification, testing and qualification bodies in terms of conformity assessment with other similar bodies. IMANOR represents Morocco at ISO and the International Electrotechnical Commission (IEC). Likewise, since July 2009, Morocco, represented by IMANOR, has been affiliated to the European Committee for Standardization (CEN) and the European Committee for Electrotechnical Standardization (CENELEC). The Ministry responsible for industry is also an associate member of International Laboratory Accreditation Cooperation (ILAC), which defines the criteria for accreditation of product calibration, testing and control laboratories. Morocco signed a mutual recognition agreement with Tunisia in 2008 and in December 2009 signed a memorandum of understanding on mutual recognition of the results of conformity assessment of products traded between Morocco, Tunisia, Egypt and Jordan. Proposals have been drawn up for its implementation.
3.4. Standards are drafted on the basis of needs expressed by economic and social operators and by the technical standards commissions (CTN) established by IMANOR in the Ministries responsible for the products to be standardized or in other interested professional organizations. The professionals and departments concerned are consulted through a public enquiry lasting one to three months.105 Draft standards are included in the general standardization programme, which is drawn up on the basis of government guidelines taking into account the opinion of the Supreme Council for Standardization, Certification and Accreditation (CSNCA). The relevant orders are published in the Official Journal.
3.5. Around 12,000 Moroccan standards have been listed.106 Compliance is mandatory in the clauses, criteria and specifications for procurement by the State, by local authorities, public institutions and companies holding concessions for public services or services subsidized by the State. Standards may be converted into technical regulations by means of ministerial orders for reasons such as health and safety. There are now some 300 technical regulations concerning products that may affect the health and safety of users.107 Technical regulations apply to both imported and domestically manufactured products; imports are subject to authorization from the Ministry responsible for industry before being placed on the market. Technical regulations currently apply to goods such as iron and steel products, gas products, electrical equipment, textile
103 Among the most important recent texts which form the legal basis for standardization are: Decree No. 2-12-502 of 13 May 2013 taken to implement the first title of Law No. 24-09 on the safety of products and services, supplementing the Dahir of 12 August 1913 comprising the Code of Obligations and Contracts, enacted by Dahir No. 1-11-140 of 17 August 2011; and Decree No. 2-10-252 of 20 April 2011 implementing Law No. 12-06 on standardization, certification and accreditation. The regulatory framework is described on IMANOR's website as follows: http://www.imanor.ma/index.php/Normalisation/Informations-generales.
104 Online information from IMANOR; viewed at: http://www.imanor.ma.105 Some 100 technical commissions have been created in various ministries. The list of technical
standardization commissions (CTN) can be viewed at: http://www.imanor.ma/index.php/Normalisation/Commissions-Techniques-de-Normalisation.
106 The "2014 Catalogue of Moroccan Standards" was viewed at: http://www.imanor.ma/index.php/Information/Catalogue-des-normes-marocaines.
107 The new Law No. 24-09 on the safety of products and services introduces a general safety obligation by providing exact safety specifications with which certain products or services should comply, and requires operators to prove that their products or services comply with essential safety requirements.
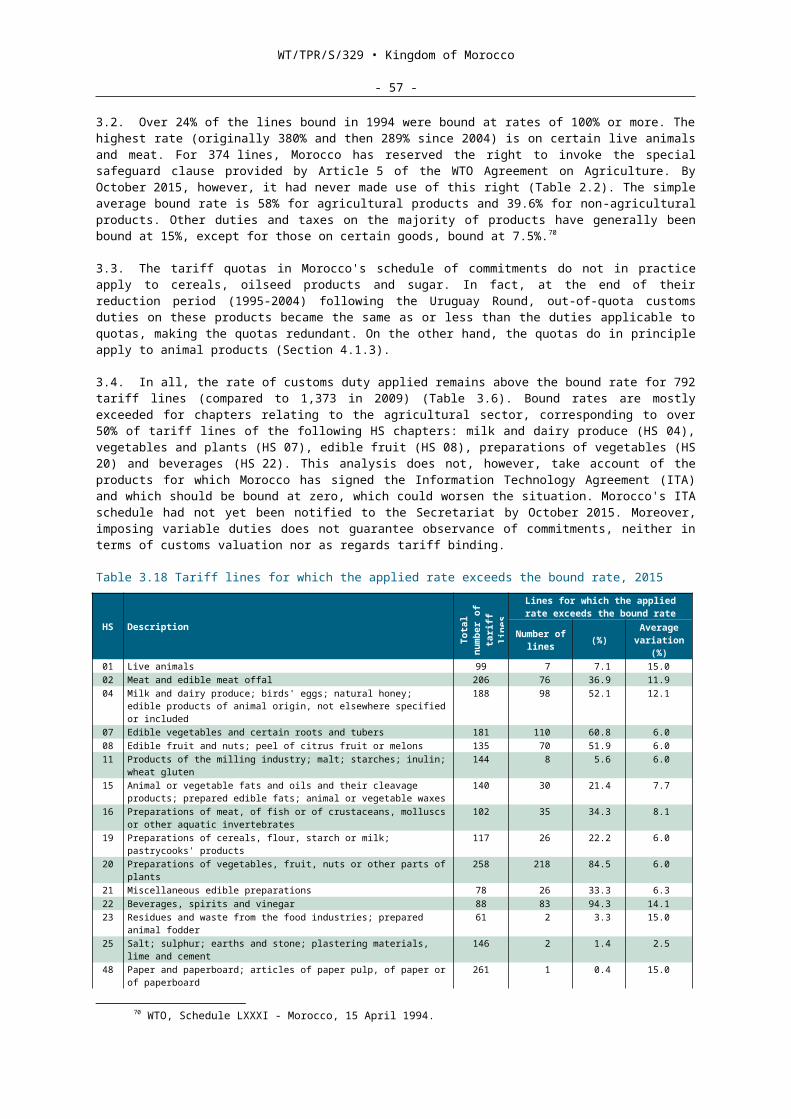
WT/TPR/S/329 • Kingdom of Morocco
- 57 -
products, household electrical goods, and toys.108 In 2014, imported goods worth DH 22.2 million (compared to DH 5.4 million in 2007) were declared not to be in conformity with technical regulations and were turned back at the border
3.6. The NM mark for products is managed according to ISO/IEC international guide 17065.109 In order to be eligible for an NM mark, an application must be made to IMANOR, which examines the technical documents and appoints an advisory committee. Samples are taken for tests, which are entrusted to an independent laboratory selected by IMANOR. Depending on the results, the committee decides to grant the NM mark to the applicant or to refuse it.110 In order to ensure that Moroccan standards are consonant with scientific and technological progress, they are periodically reviewed at intervals not exceeding five years.
3.7. Morocco also has a system for certifying business management based on NM ISO 9001 standards (quality systems), NM ISO 14001 (environmental management systems), NM 00.5.801 (management of health and safety at work), NM HACCP (HACCP111 system for food industry companies), NM ISO 22000 (food safety), NM ISO 50001 (energy management), NM ISO 27001 (security of information systems) and a system for accrediting testing and calibration laboratories, managed in accordance with the requirements of international guide ISO/IEC 17011.112 IMANOR has undertaken to introduce a national Halal trademark attesting to conformity with Moroccan standard NM 08.0.800 specifying the criteria for Halal foodstuffs.
3.8. IMANOR is also responsible for managing activities related to certification of cosmetics and active substances used to manufacture medicines. For medicines for human use, manufacturers must comply with the good manufacturing practice (GMP) standards contained in Ministry of Health Circular No. 36 of 31 July 1995.
3.9. By end June 2015, around 54,000 controls had been carried out on imports and 10,000 on domestically produced products. During these import controls, 7,753 samples were taken. According to the authorities, the choice of which imports to inspect is based on criteria such as the origin of the goods, the nature of the product or the operator (it is usually a case of a new origin, a new product or a new operator) or if special problems arise. These controls affected products subject to technical regulations and concerned the safety aspect in particular. If there is a mutual recognition agreement, the terms of the agreement are observed. As far as the cost is concerned, the authorities do not currently require any fee for processing documents on imports subject to control.
3.1.7.2 Sanitary, phytosanitary and environmental measures
3.1. Since its previous TPR, Morocco has reorganized its system for food control and safety. It has created the ONSSA, which has been given responsibility on behalf of the State for the protection of consumer health and the protection of animal and plant health. The ONSSA was set up in January 2010 by means of Law No. 25-08113; it comes under the Ministry responsible for agriculture and has its own legal status and financial autonomy. Its role is to provide support for the strategic approaches set out in the Green Morocco Plan with a view to transforming the agrifood system and to ensure food safety, thus making food products more competitive on national and international markets.
3.2. The ONSSA's principal tasks are to monitor and protect the health of farmed animals and plants; guarantee food safety (from the raw materials up to the final consumer), including fishery products and animal feed; to approve and control agricultural inputs (seed, pesticides, fertilizer) and veterinary medicines; and to apply the legislation and regulations on veterinary and phytosanitary health control. The ONSSA takes a sample and issues a certificate of analysis for
108 The full list of technical regulations was viewed at: http://www.mcinet.gov.ma/EspPratique/Documents/Liste%20des%20normes%20d%27applications%20Obligatoires%207-2015.pdf.
109 The NM mark may be affixed to all products and apply, if appropriate, to services, and is managed by IMANOR.
110 The committee may also propose a further visit or call on the applicant to improve the manufacture or control of the product before giving a final opinion.
111 Hazard Analysis Critical Control Point.112 Laboratories are evaluated on the basis of one of the NM ISO 17025 references, which reproduce,
respectively, international standard ISO/IEC 17025 on the general requirements for the competence of testing and calibration laboratories.
113 Law No. 25-08 establishing the National Food Safety Board, enacted by Dahir No. 1-09-20 of 18 February 2009 and published in OJ No. 5714 in March 2009.
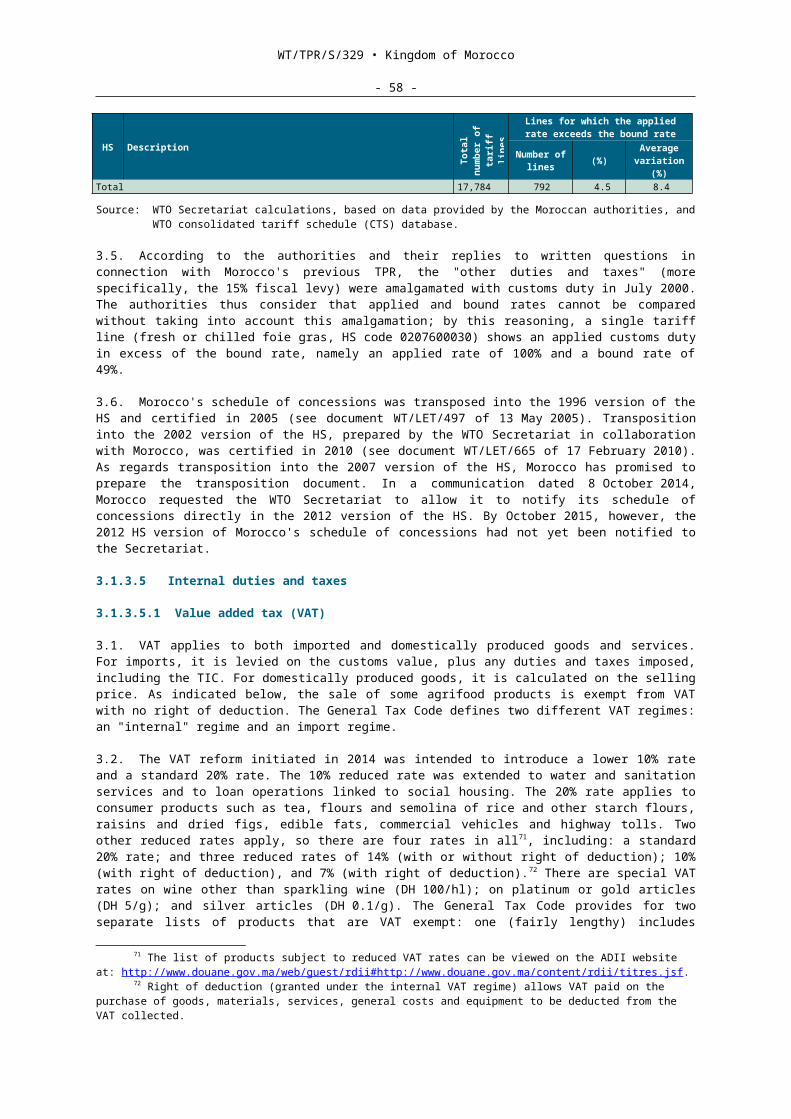
WT/TPR/S/329 • Kingdom of Morocco
- 58 -
each import of food products. It has both regional and provincial structures responsible for providing a local service throughout Morocco.
3.3. The ONSSA was created simultaneously with the adoption of a new Law in March 2010 on the protection of animals and animal health, the health safety of food of animal origin, animal feed and animal byproducts.114 Law No. 28-07 is the outcome of a joint Morocco-European Union project on sanitary and phytosanitary (SPS) measures.115 Its provisions cover all stages of production, handling, treatment, processing, packaging, presentation, transport, storage, distribution, sale and export of primary products, food products for human consumption and animal feed.
3.4. Changes to the SPS legislative framework include a number of new decrees and orders.116
Decree No. 2-10-473 of 6 September 2011 specifies that, in order to guarantee that a primary product, a food product or animal feed imported for sale on the domestic market entails no risk for human or animal life or health, the importer must first ensure that the product or food: is from a country, a zone or region not subject to any sanitary or phytosanitary restrictions; meets the hygiene and health requirements laid down in the Decree and other special regulations for the product or food; comes from a facility or company that has an HACCP self-control or other equivalent system in place; is accompanied by documents or other certificates required by special regulations for the product or food, issued by the competent authority in the country of export and certifying in particular that it entails no risk for human or animal life or health. The importer must also have a recall plan so that if there is a sanitary emergency affecting the product or animal feed imported, it can be recalled after it has entered Morocco.
3.5. Law No. 28-07 sets out general requirements on the sale of safe products; for example, it lays down general rules for hygiene and health, use of cleaning products and disinfectants and the admissible contamination thresholds. No primary or food product or animal feed may be sold in Morocco, imported or exported if it is not safe for human or animal life or health. Facilities and companies must have sanitary authorization or approval from the competent authorities before they may operate, according to the requirements and methods determined in the regulations. Where one or more of the requirements for issuing a sanitary authorization are no longer being met, the authorization is suspended for a specified period during which the beneficiary must take the necessary measures to ensure that the requirements are fulfilled. If the necessary measures have not been taken at the end of this period, the authorization is withdrawn.
3.6. For imports, sanitary measures regarding animal health and animal products are governed by Law No. 24-89 of 10 September 1993, its implementing decree and decrees and ministerial orders concerning specific products.117 The import of animals, animal feed, products of animal origin, animal reproduction products, and marine and freshwater products, with the exception of those in international transit which are not unloaded, is subject to sanitary inspection at the expense of the importer118, conducted at customs inspection posts by the ONSSA's veterinary services. Following the inspection, a veterinary sanitary certificate, which is mandatory for customs clearance, is issued. For live animals to be placed in quarantine, a sanitary permit is given. Sanitary inspection is
114 Law No. 28-07 on food safety, enacted by Dahir No. 1-10-08 of 11 February 2010 and published in the OJ of 18 March 2010.
115 Law No. 28-07 is based on Regulation (EC) No 178/2002.116 Decree No. 2‐10‐473 of 6 September 2011 implementing certain provisions of Law No. 28‐07 on food
safety, as notified in document G/SPS/N/MAR/31 of 25 July 2011; and Decree No. 2‐12‐389 of 22 April 2013 laying down the terms and conditions for the labelling of food products, including imported food products. As regards additives authorized for food products, Joint Order No. 1795-14 of 14 May 2014 establishes the list of food additives that may be used in primary products and food (WTO documents G/SPS/N/MAR/33 and G/SPS/N/MAR/33/Add.1). With regard to the maximum limits authorized for pesticide residues, Joint Order issued by the MAPM and the Ministry of Health No. 156-14 of 17 January 2014 establishes maximum residue limits for phytosanitary products in or on foodstuffs and animal feed (G/SPS/N/MAR/30).
117 Dahir No. 1-89-230 of 10 September 1993 enacting Law No. 24-89 prescribing veterinary sanitary control measures for the import of animals, animal feed, products of animal origin, animal reproduction products, and marine and freshwater products; Implementing Decree No. 2-89-597 of 12 October 1993; Decree No. 2-05-84 of 23 November 2005 on the import of milk to be used for cattle feed; and Ministerial Orders defining the following: requirements for the introduction of fish and crustaceans into inland waters within the public domain (1994); animal health standards for the import of breeding animals of the bovine species (1994), sheep, goats and equine animals; health requirements and treatments required for the import of animal products to be used in the animal byproducts industry (1994); animal health standards for the import of cocks and hens for reproduction, of a weight not exceeding 185 g. (1998); and sanitary requirements for the import of certain live animals and certain products of animal origin (1996).
118 Decree No. 2-94-76 of 22 November 1996 fixing the fee for veterinary sanitary inspection of imports of animals, animal feed, products of animal origin, animal reproduction products, and marine and freshwater products.
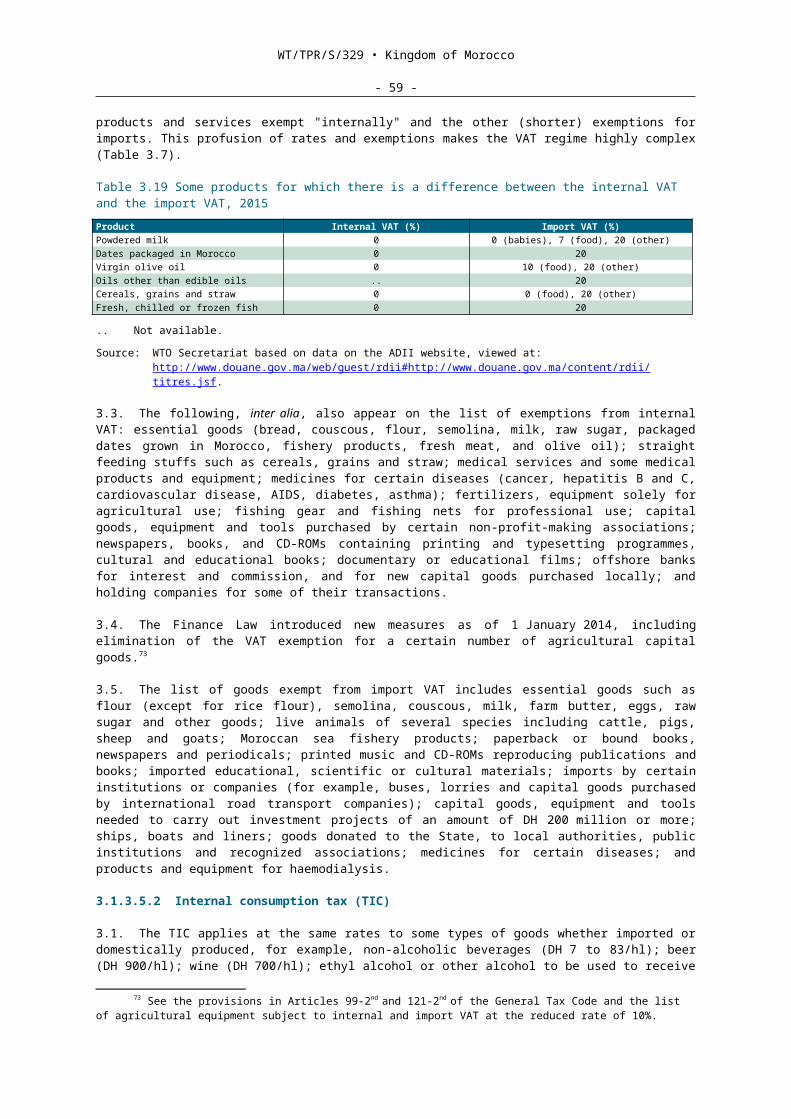
WT/TPR/S/329 • Kingdom of Morocco
- 59 -
systematic for all such imports, which, in addition, must be accompanied by the sanitary documents issued by the country of origin, and, where applicable, countries of transit.119 A sanitary certificate issued at the border post of the country of origin is also required for animals.120 In 2005, the content of sanitary certificates was modified.121 Henceforward, certificates must also indicate the health guarantees established by common agreement between Morocco's central veterinary health authority and the official health authority of the exporting country. The sanitary certificate must conform to the model certificate jointly agreed prior to import by the Moroccan authorities and those of the country of origin. The documents are checked by the veterinary services after unloading (except in the case of live animals, irrespective of their country of origin, and animal products in their raw state from countries not recognized as free of contagious disease).
3.7. Imports of the aforementioned products are banned, by order of the Minister responsible for agriculture, when they come from a country not recognized as free of contagious disease, unless they have undergone special treatment and no longer present any danger of contagion.122
3.8. The import of veterinary medicines is governed by Law No. 21-80 on private exercise of medicine, surgery and veterinary pharmacy and its implementing Decree No. 2-82-541 of 15 March 1983. Only medicines that have been authorized may be imported (marketing authorization, AMM) and exclusively by establishments having received prior approval. The labelling requirements for veterinary medicines can be found in Decree No. 2-82-541. The details to appear on the label are the name of the medicine, the number of the manufacturing batch, the expiry date, the pharmaceutical formula, the qualitative and quantitative composition of the active ingredients, the species of animals to be treated and the dosage, the adverse effects and counter-indications, the wait time, the name of the manufacturer, the AMM number, and any special indications (veterinary use, etc.).
3.9. Phytosanitary measures for imports are governed by the 1927 Dahir on plant health control regulations (as amended and supplemented in 1949, 1950 and 1954), and several orders governing the import of specific products.123 This legislation defines the plants and plant products subject to phytosanitary inspection conducted by the ONSSA's plant protection services and lists the products prohibited for import or subject to particular requirements or to obtaining a prior technical import authorization (permit).124 Special requirements apply to the import of certain plants or plant products.125 Seasonal bans apply to the import of plant reproduction material belonging to the seeded Rosaceae family, which is authorized between 1 November and 15 February for that coming from the northern hemisphere, and between 1 May and 15 October for that from the southern hemisphere.126 The cost of inspection, as well as rejection or destruction of any shipment of banned products, must be met by the importer.
119 Morocco has signed mutual recognition agreements on sanitary measures with the following countries: Angola, Argentina, Brazil, Bulgaria, China, Egypt, France, Germany, Guinea, Hungary, India, Islamic Republic of Iran, Japan, Jordan, Lebanon, Libya, Mauritania, Mexico, Netherlands, Poland, Portugal, Russian Federation, South Africa, Spain, Sudan, Syria, Tunisia and Turkey; it has proposed or is considering agreements with a further 15 countries.
120 The health certificate must conform to the model certificate jointly agreed prior to import by the Moroccan authorities and the competent authorities of the country of origin. Examples of certificates by imported product and by country of origin can be viewed on the ONSSA's website at: http://www.onssa.gov.ma/fr/index.php?option=com_content&view=article&id=231&Itemid=186 .
121 Order of the Minister of Agriculture, Rural Development and Marine Fisheries No. 603-05 of 16 March 2005, amending the veterinary health certificates specified in Article 3(a), (b), (c) and (d) of Decree No. 2-89-597 of 12 October 1993 implementing Law No. 24-89; and WTO document G/SPS/N/MAR/25 of 10 May 2005.
122 The products that may be subject to treatment are mainly intended for industry, for example, hides and skins or gelatine.
123 Dahir No. 1-69-169 of 25 July 1969 regulating the production and marketing of seeds and seedlings, as amended; Order of the Minister of Agriculture and Agrarian Reform No. 467-84 of 19 March 1984 regulating the import of plants or parts of plants liable to be infested by certain harmful species of animals or plant pests; Order of the Minister of Agriculture and Agrarian Reform No. 1306-85 of 22 December 1986 on sanitary control of imported plants or plant products; Order of the Minister of Agriculture and Agrarian Reform No. 823-93 of 20 April 1993 regulating the import of sugar cane cuttings or seed (Fuzz) into Morocco; Order of the Minister of Agriculture and Agrarian Reform No. 824-93 of 4 June 1993 on the sanitary requirements for the import of certain fruit and ornamental species belonging to the Rosaceae family; Order of the Minister of Agriculture, Public Works and the Environment No. 2730-97 of 31 October 1997 on the import and release of alien biological control agents; Order of the Minister of Agriculture, Rural Development and Marine Fisheries No. 207-05 of 11 November 2005 on phytosanitary requirements for the import of plant material of the Genus Vitis.
124 A prior technical import authorization is required for products such as certain fruit and ornamental species belonging to the Rosaceae family and plant material of the Genus Vitis (L.).
125 Order of the Minister of Agriculture and Agrarian Reform No. 824-93 of 4 June 1993 on sanitary requirements for the import of certain fruit and ornamental species belonging to the Rosaceae family.
WT/TPR/S/329 • Kingdom of Morocco
- 60 -
3.10. Following the decision of January 2015127, all the taxes and fees introduced for sanitary and phytosanitary control of imports were abolished by Decree No 2-15-24 repealing certain texts on the fees for sanitary inspection of plants and animals, as well as fees for the fumigation of plants and plant products.128
3.11. The import or export of seeds and seedlings requires prior authorization from the Ministry responsible for agriculture. Only entities approved by means of an order from the Ministry responsible for agriculture may sell seeds and seedlings. Fruit seeds and seedlings must also be certified and belong to varieties approved in Morocco. The import of plants and plant products is subject to technical inspection by the competent services of the Ministry responsible for agriculture and must comply with the phytosanitary and technical regulations in force.
3.12. Plant products or parts of plants whose import requires a phytosanitary certificate issued by the plant protection service in the exporting country are listed in Ministerial Order No. 832-02 of 2002.129 The certificate must comply with the model laid down in the FAO's 1951 International Plant Protection Convention (IPPC), as amended. Imports of potato seedlings, and tomato and eggplant seeds must also be accompanied by an additional declaration from the country of origin certifying that they are free from certain parasites and diseases and have been screened, cleaned and placed in new sacks. Prior authorization from the Ministry responsible for agriculture is required.
3.13. With regard to plant protection, Morocco has signed the FAO's IPPC and is a member of the European and Mediterranean Plant Protection Organization (EPPO); the Near East Plant Protection Organization (NEPPO); the FAO/WHO Codex Alimentarius Commission; and the International Union for the Protection of New Varieties of Plants (UPOV). Import restrictions may also be imposed under other agreements signed by Morocco (for example, in the case of CITES) (Section 3.1.5).
3.14. As regards the control of agricultural pesticides, imported products must be approved pursuant to Law No. 42-95 on the control and organization of trade in pesticides for agricultural use in order to assess their effectiveness and safety for humans, animals and the environment. Any pesticide used, sold or imported in Morocco must be approved and must meet the quality and labelling conformity requirements. Control of these products upon importation consists of systematic inspection of the accompanying documents (documentary control) and a physical inspection to verify their general condition and their labelling (control of identity and physical state), using purposive sampling according to risk analysis that takes into account objective elements such as the origin of the goods, the importer's record, the relevance of the accompanying documents, etc.
3.15. Among the new measures affecting imports adopted since Morocco's previous TPR, since November 2009 the entry into Morocco of live bovine animals, animal feed, products of animal origin and animal reproduction products derived from bovine animals originating in or coming from certain countries130 has been banned, namely: since March 2012, the import of animal products, products of animal origin and animal feed from Egypt131; since August 2014, the import of live animals and animal products from Algeria132; since December 2014, the import of all species of birds, poultry, poultry meat and poultry meat products unless treated thermally, and eggs and egg products from Canada, Italy, the United States, the Netherlands, the United Kingdom and Germany133; since April 2015, suspension of the import of seedlings of Pierce's disease host species (olive trees, citrus fruit trees, rosaceous (stone fruit) plants, oak trees, grapevines) from Italy.134
126 According to the authorities, this is because in winter, bees (potential carriers of disease) are absent or inactive.
127 Decision of the Minister of Agriculture and Marine Fisheries and the Minister of the Economy and Finance of 1 September 2014, as amended by the decision of 16 January 2015.
128 Decree published in OJ No. 6344 of 19 March 2015. This decree lists the texts repealed as of 1 January 2015.
129 These are: shipments of seedlings, layers, cuttings, grafts, crowns, flower bulbs, flowers and buds of cut flowers, branches, leaves and foliage, fresh fruit, fruit stones, fresh vegetables, tubercles, bulbs, rhizomes, roots, plant fibre, hay and forage, oil-cake, straw and bran, pollen, and seeds; grains; substrates to be used for growing crops, without soil or organic matter, either alone or together with the plants (with the exception of dead plant material, manure and compost, which are banned); bark, not dried, and wood of any type.
130 Order of the Minister of Agriculture and Marine Fisheries No. 2543-09 of 29 October 2009 banning the entry of live bovine animals, animal feed, products of animal origin and animal reproduction products derived from bovine animals, originating in or coming from certain countries, WTO document G/SPS/N/MAR/29 of 10 May 2010.
131 WTO document G/SPS/N/MAR/32 of 29 March 2012.132 WTO document G/SPS/N/MAR/38 of 14 August 2014.133 WTO documents G/SPS/N/MAR/39 of 15 December 2014 and G/SPS/N/MAR/40 of 7 January 2015.134 WTO document G/SPS/N/MAR/41 of 10 April 2015.
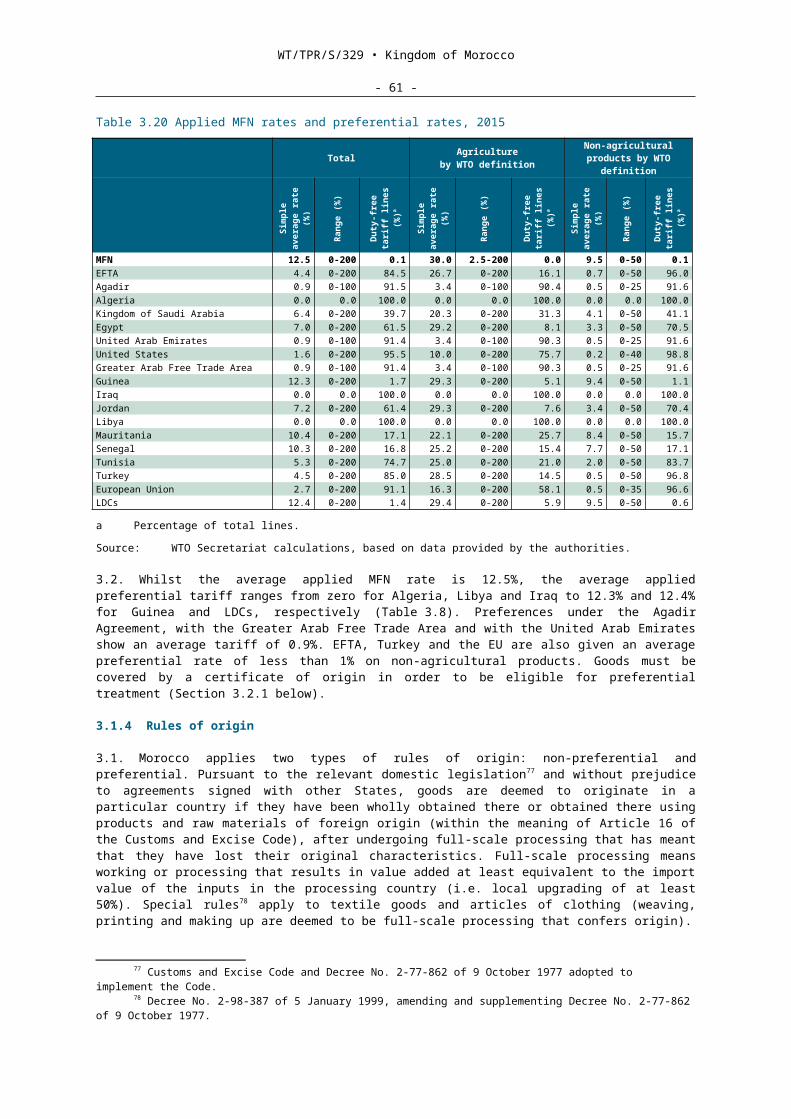
WT/TPR/S/329 • Kingdom of Morocco
- 61 -
3.16. Since its previous TPR, Morocco has notified the WTO of a series of other sanitary and phytosanitary measures. They include the draft order establishing maximum residue limits for pesticides in or on foodstuffs and animal feed135; the decree implementing Law No. 28-07 on food safety136; the order establishing the list of food additives that may be used in primary products and food137; the decree regulating the marketing of olive oils and olive pomace oils138; the order concerning the mark affixed to wood packaging used in international trade139; the order establishing the list and maximum limits of substances considered undesirable in animal feed and the list and limits for the use of additives, pre-mixes and supplementary foodstuffs destined for animal feed.140
3.17. In September 2010, Morocco informed the WTO that the ONSSA was Morocco's official authority responsible for implementing the WTO Agreement on the Application of Sanitary and Phytosanitary Measures and was the SPS enquiry point.141 In March 2014, Morocco, Chile, the European Union and Norway forwarded to the WTO the communication concerning the fourth review of the operation and implementation of the Agreement on the Application of Sanitary and Phytosanitary Measures – Transparency under the SPS Agreement (Article 7 and Annex B).142
3.18. Under its preferential agreements, Morocco has embarked upon negotiations with the EU on a deep and comprehensive free trade agreement (DCFTA) containing a chapter on SPS measures. The aim of this chapter is to protect human and animal life and health and plants in each party's territory while at the same time facilitating trade among the parties in the sanitary and phytosanitary sphere and ensuring transparency of the sanitary and phytosanitary measures applicable to trade through more in-depth implementation of the principles of the WTO SPS Agreement.
3.1.7.3 Marking, labelling and packaging
3.1. Morocco does not have any special regulations on the marking of containers. The Moroccan Packaging and Processing Institute (IMEC) has authority for processing and packaging standards. The Ministries of Agriculture and Health have responsibilities as regards agricultural products and those intended for human consumption.
3.2. Decree No. 2-12-389 also applies to imported food products and was adopted to implement Law No. 28-07 on food safety. Its purpose is to provide consumers with useful and more detailed information on the appellation, composition, nutritional characteristics and shelf-life of food products through clear and comprehensive labelling.143 It defines the constituent elements, the features and form of the indications and wording to be displayed on labels for food products, together with the requirements for nutrition-related labelling. It indicates the mandatory information that must appear on labels for food products in order to enable consumers to take an informed and responsible purchasing decision. It also requires that the presence of substances or ingredients that may cause allergic reactions be indicated. It specifies that all indications on the labelling must be in Arabic, easily understandable, and appear in an obvious place so that they are visible, clearly readable and indelible. Under an order of the Minister responsible for agriculture, however, some imported products or those intended for a certain type of customer and some domestically produced beverages may be exempt from the requirement to use Arabic. The labels on pre-packaged products must show, inter alia, the exact name of the product, the list of ingredients, the name of each ingredient or substance liable to cause an allergy or intolerance, the
135 WTO document G/SPS/N/MAR/30 of 15 July 2011.136 Decree No. 2-10-473 of 6 September 2011 implementing certain provisions of Law No. 28-07 on food
safety; and WTO document G/SPS/N/MAR/31 of 25 July 2011.137 Joint Order No. 1795-14 of 14 May 2014 establishing the list of food additives that may be used in
primary products and food; WTO documents G/SPS/N/MAR/33 of 25 July 2012 and G/SPS/N/MAR/33/Add.1 of 25 September 2012.
138 WTO document G/SPS/N/MAR/35 of 24 April 2013.139 Order of the Minister of Agriculture and Marine Fisheries concerning the mark affixed to wood
packaging used in international trade; and WTO document G/SPS/N/MAR/34 of 5 February 2013.140 Order No. 1490-13 of the Minister of Agriculture and Marine Fisheries of 3 May 2013 establishing the
list and maximum limits of substances considered undesirable in animal feed, and the list and maximum limits of additives, pre-mixes of additives and supplementary foodstuffs destined for animal feed; WTO documents G/SPS/N/MAR/36 of 14 August 2013 and G/SPS/N/MAR/37 of 20 September 2013.
141 WTO document G/SPS/GEN/1039 of 6 September 2010.142 WTO document G/SPS/W/277 of 10 March 2014.143 Decree No. 2-12-389 of 22 April 2013 laying down the conditions and terms for the labelling of food
products, published in OJ No. 6152 of 16 May 2013; entered into force on 16 May 2014.
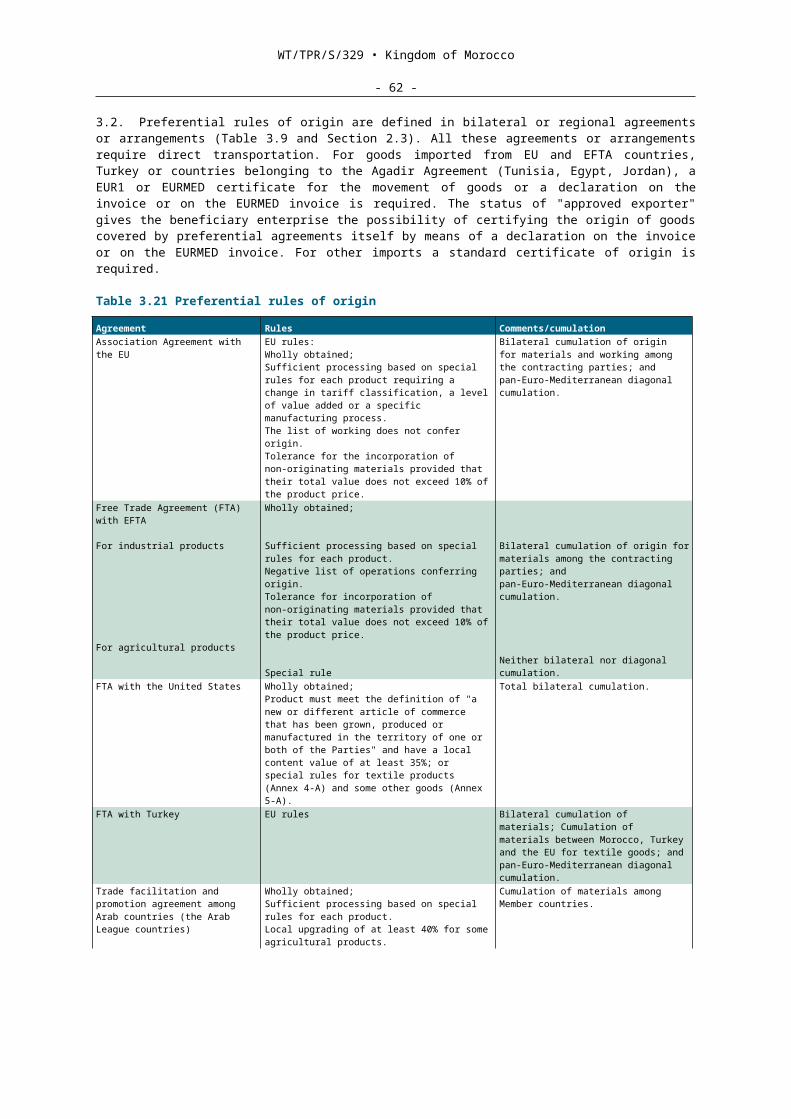
WT/TPR/S/329 • Kingdom of Morocco
- 62 -
sell-by date and, where appropriate, the address of the importer, manufacturer or packaging enterprise.144
3.3. Similar requirements apply to pharmaceuticals (including medicines) and, if they are compounds, the name and percentage of each compound must also be indicated. Decree No. 2-10-473 of 6 September 2011, implementing certain provisions of Law No. 28-07, specifies in Article 14 that the number of the authorization or approval given to the relevant establishment must be mentioned on the documents and on any correspondence, as well as on any advertising for the product and on its packaging.
3.2 Measures directly affecting exports
3.2.1 Procedures
3.1. In general, natural or legal persons wishing to engage in export activities must be listed in the Commercial Register.145 Exporters of agricultural produce and marine products, as well as any facilities manufacturing, processing or packaging food products for export, must obtain approval (renewable annually) from the Autonomous Export Control and Coordination Agency (EACCE), a government body attached to the Ministry of Agriculture and Marine Fisheries. The EACCE controls the quality of products according to the standards of the country of destination. It also participates in IMANOR's food standards commissions (Section 3.1.7.1). Craft exporters must be registered in the relevant register.
3.2. A Single Goods Declaration (DUM) is required for any goods sent for export. This must be accompanied by an export licence in the case of goods subject to quantitative restrictions (Section 3.3.3).146 An export licence is issued by the Ministry responsible for foreign trade. The foreign exchange undertaking (linked to the repatriation obligation), which was compulsory for all freely exportable goods, has no longer been required since 28 March 2014. In addition to its positive impact in terms of streamlining procedures, the elimination of this measure has helped improve Morocco's ranking in the Doing Business 2015 report (31st compared to 37th in 2014).
3.3. Other documents may also be required for export, namely prior authorization from the competent agencies for certain products147, the packing list, the international transport document, the certificate of origin, the control certificate depending on the type of product, the wharfage, receipt or deposit documents, or any other proof that the goods have been presented to the customs for the purpose of export.
3.4. The export of some products of animal or plant origin148, pharmaceuticals and cosmetics or products of the crafts industry is subject to technical control carried out by the EACCE, the Ministry of Health and the Ministry responsible for crafts, respectively. Craft products do not qualify as such without the quality control technical endorsement of the Crafts Department. The new Law No. 61-12 gives the EACCE new tasks and clarifies its control responsibility. It is responsible in particular for conducting inspections to ensure that Moroccan agricultural produce and marine products for export comply with the legislative and regulatory requirements applicable in the foreign market of destination. An inspection certificate is issued following these inspections. The EACCE is accredited by the EU for the control of fresh fruit and vegetables exported to the EU; a conformity certificate is issued once the control procedure has been carried out. The EACCE is also responsible for sectoral committees specializing in the coordination of exports of agricultural produce and seafood products; ensuring strategic monitoring on export markets, including
144 The other compulsory indications are: net quantity of the product and of certain ingredients; special instructions on conservation; name or company name of the importer, producer or packaging enterprise; country of origin or source; instructions for use (where necessary for correct use of the product); the percentage of alcohol for beverages exceeding 1.2% of alcohol by volume; nutritional information where this is compulsory; the number of the batch of production, manufacture or packaging to which the pre-packaged product belongs; the additional mandatory indications appearing on the list in Annex II to Decree No. 2-12-389; and the number of the authorization or approval mentioned in Article 14 of Decree No. 2-10-473.
145 Some exporters are exempt, for example, those exporting on an occasional basis, natural persons, cooperative associations, self-entrepreneurs, farmers and artisans.
146 Article 19 of Law No. 13-89 on foreign trade, enacted by Dahir No. 1-91-261 of 9 November 1992, as amended and supplemented by Law No. 3-96, enacted by Dahir No. 1-97-63 of 12 February 1997.
147 These are: works of art and antiques (authorization from the Ministry of Culture); vehicles purchased with loans (authorization from the loan entity financing the purchase of the vehicle concerned); products of endangered species of wild fauna and flora (CITES permit issued by the department responsible for water resources and forests); and potassium (authorization from the Ministry responsible for mining).
148 In principle, all products are concerned, including rice.
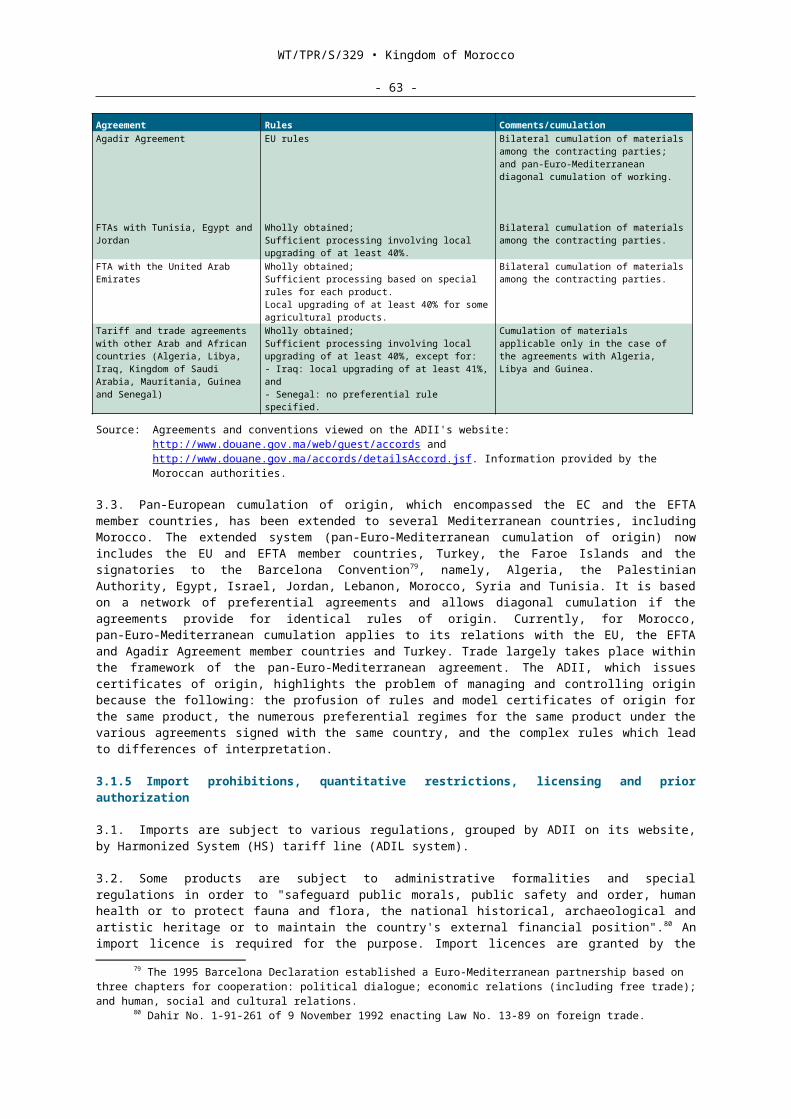
WT/TPR/S/329 • Kingdom of Morocco
- 63 -
monitoring non-tariff measures and disseminating this information to exporters; acting as an interface between operators and public and private Moroccan and foreign institutions in relation to the export of agricultural produce and marine products. As the control body, the EACCE participates regularly in the work of various international food standardization organizations, including European ones (UN/ECE, Codex, OECD, IOC) with the aim of harmonizing standards so as to facilitate trade in this area.
3.5. In order to benefit from the preferences accorded under bilateral or multilateral agreements and treaties, exporters must obtain the proper certificate of origin from the ADII.
3.2.2 Export taxes
3.1. The last export taxes were eliminated in 2005 and 2008.149 The export of products subject to EACCE technical control has not been subject to any inspection tax since 1991.
3.2.3 Export prohibitions, licensing and control
3.1. Pursuant to current legislation, exports of goods and services may be subject to restrictions in order to safeguard public morals, security, public order and human health; to protect fauna and flora and the national historical, archaeological and artistic heritage, and to maintain the country's external financial position.150
3.2. Since Morocco's previous TPR, several changes have been made to the list of products subject to authorization, quantitative restrictions and export licensing. The list includes cereals (except rice), charcoal, collections and specimens for various zoological, botanical, mineralogical and archaeological collections, antiques over 100 years old, ozone-depleting substances and equipment151, wheat and meslin, rye, barley, oats, maize, rice, grain sorghum and other cereals, as well as groats and semolina of wheat and barley.152
3.3. The following products have been added to the list since 2009: bulbs, including saffron bulbs, grains, almonds and argan trees (including seed), crude algae and modified agar-agar, candy sugar and other sugars in packages of less than 50 kg, asbestos, metal waste and debris153, insecticides containing methyl bromide, compressors, refrigerators and freezers using R12 or R115 and extinguishers containing halon gases.154 Tanned hides and skins or crust leather of bovine animals, sheep and goats were removed from the list in December 2006. Export licences are issued by the Minister responsible for foreign trade and are valid for six months.155 The decision on whether or not to grant a licence is notified to the applicant within a maximum period of 30 days and the reasons for rejection of any application must be given.156 In practice, the time taken to notify the decision on granting an export licence is less than eight days.
3.4. Under multilateral agreements such as CITES and the Basel Convention, some products, waste and/or species are subject to an export permit, certificate or ban. For example, endangered species of wild fauna and flora (Annexes I, II and III to the CITES) require an export permit or a re-export certificate.157 These permits or certificates are issued by the Water Resources and Forestry Department. The export of waste in list A of the Basel Convention requires prior authorization from the Department responsible for the environment.
149 For further details, see Morocco's previous TPR (2009).150 Dahir No. 1-91-261 of 9 November 1992 enacting Law No. 13-89 on foreign trade.151 These are some organic chemicals (HS Chapter 29) and pharmaceuticals (HS Chapter 30) and some
insecticides, fungicides, herbicides, disinfectants and like products (HS Chapter 38).152 Order No. 1308-94 of the Minister of Foreign Trade, Foreign Investment and Handicrafts of
19 April 1994 determining the list of goods subject to quantitative restrictions upon importation and exportation, as amended.
153 These are metal waste and debris of HS Chapters 72, 74, 75, 76, 78, 79, 80 and 81.154 The full list of goods subject to export licensing can be viewed at:
http://www.mce.gov.ma/ministere/arretes/arrete1308-94.pdf.155 Order No. 1675-15 of the Minister responsible for foreign trade of 19 May 2015.156 Article 8, Title II, of Decree No. 2-93-415 of 2 July 1993 implementing Law No. 13-89 on foreign trade,
as amended and supplemented by Decree No. 2-99-1261 of 4 May 2000.157 CITES; viewed at: https://www.cites.org/sites/default/files/eng/app/2013/E-Appendices-2013-06-
12.pdf.
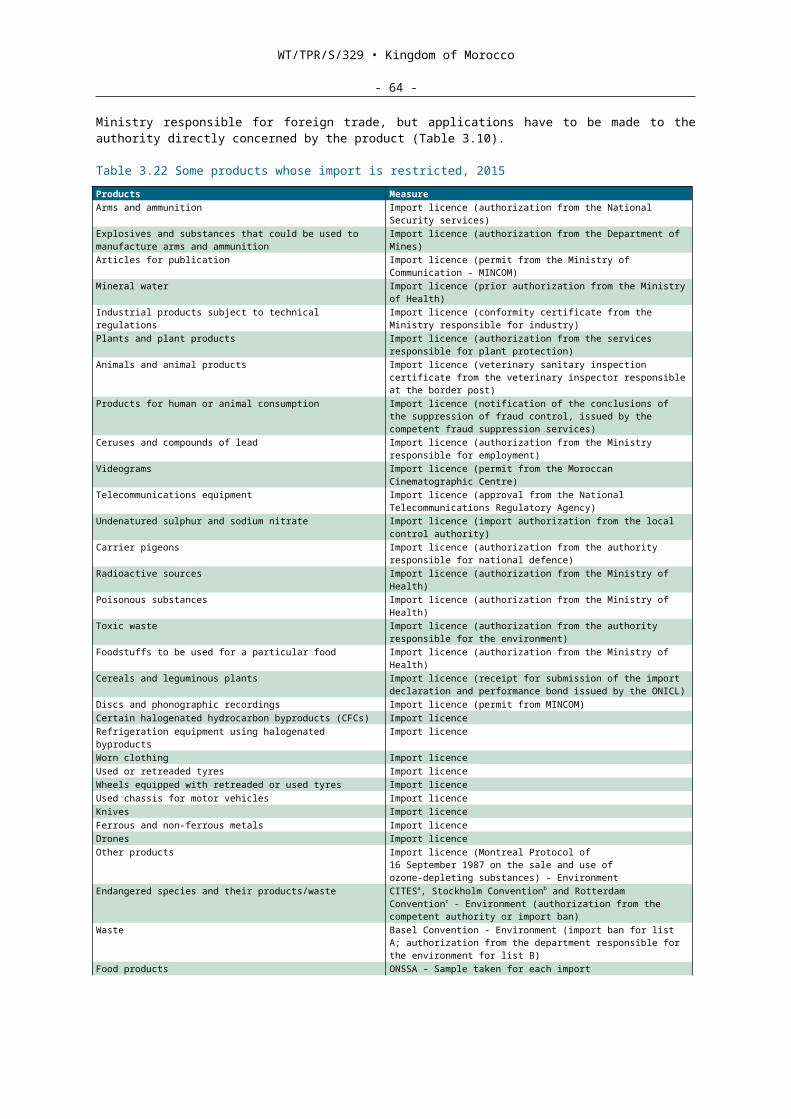
WT/TPR/S/329 • Kingdom of Morocco
- 64 -
3.2.4 Exports subsidies, promotion and support
3.1. Morocco's latest notification pursuant to Article XVI:1 of the GATT 1994 and Article 25 of the Agreement on Subsidies and Countervailing Measures dates back to 2003.158 No notification has been made to the WTO since then.159 Morocco nevertheless gives a variety of incentives to enterprises whose activities are export-oriented. These include incentives under the export free zones (ZFEs) regime and the customs regimes (REDs), as well as exchange facilities (i.e. accounts in convertible DH or in foreign currency) and export insurance. All the fiscal provisions provided under the Investment Charter have been repealed and are currently governed by the General Tax Code. Special incentives are given to exporting mining enterprises (Section 4.3).
3.2. Incentives (particularly export subsidies) are still available for agricultural products (Section 4.1).
1.1.1.1 Export free zones
3.3. Concessions for the development and management of export free zones (ZFEs) are granted following an invitation to bid or by direct agreement, under certain conditions (pursuant to Article 7 of Law No. 19-94, as amended), to a public or private law body on the basis of specifications defining the concessionaire's rights and obligations. The latter is responsible for developing, managing and maintaining the export free zone as a whole and for presenting applications from investors to a local ZFE commission for approval. It also acts, inter alia, as a single window for applications for status as a ZFE enterprise. Morocco currently has several ZFEs, of which the largest is in Tangiers (ZFT) (Table 3.11).
3.4. Transactions abroad by companies established in ZFEs benefit from totally free foreign exchange.160 Goods entering or leaving ZFEs are exempt from all duties and taxes on imports, exports, production, movement or consumption. A number of other fiscal measures are available (Section 2.4.2). Eligibility for ZFE status does not require companies to export a minimum share of their output; and there is no ceiling on the percentage of their sales in Moroccan national territory. The requirements for export and sale in Moroccan national territory by ZFE companies are specified on a case-by-case basis by the ZFE Commission responsible for approving applications. According to the authorities, sales on the domestic market are, however, considered to be imports with the ensuing imposition of the applicable duties and taxes.
Table 3.23 Free zones operating in 2015
Free zone Sectors of activity Area (hectares)
Total cost (DH million)
Jobs recorded/companies established in 2015
Tangiers (ZFT)a Automobiles; aeronautics; agro-industry; textiles and leather; chemicals and parachemicals; metalworking, mechanical, electrical and electronics industries; and related services
345(100-hectares
extension planned)
740 44,210 jobs / 415 companies
Tangiers Automotive City (TAC)
Mainly the automotive sector; Other activities: agro-industry; textiles and leather industry; metalworking, mechanical, electrical, electronics, chemical and parachemical industries
178 1,181.7 1,020 jobs / 4 companies (with 10 setting up)
Nouaceur Mainly aeronautical and space industry; Other activities related to security and detection systems, medical industries and metal, metalworking, electrical and electronics industries, as well as precision systems
78 887.6 5 companies (with 3 setting up)
Kenitra Automotive industry 199 1,214 11,245 jobs planned / 7 companies
Technopolis Very hi-tech industrial activities, and specialized scientific and technical activities and/or research and development such as electronics, nanotechnology, biotechnology, chemical and parachemical, renewable energy and energy efficiency activities
61(of which 20 have been developed)
158 WTO document G/SCM/N/95/MAR of 23 July 2003.159 WTO document G/SCM/W/546/Rev.6 of 14 April 2015 on notification requirements under the
Agreement on Subsidies and Countervailing Measures.160 Settlement of transactions within free zones can only be made in convertible foreign currency.

WT/TPR/S/329 • Kingdom of Morocco
- 65 -
Free zone Sectors of activity Area (hectares)
Total cost (DH million)
Jobs recorded/companies established in 2015
Technopole d'Oujda
Equipment for sustainable development and industrial renewable energy and energy efficiency activities
96(of which 40 have been developed)
160
Tétouanshore Services: banking, insurance, accountancy and finance, human resources, general administration, client relations management
6
Casanearshore Services: banking, crèche, shops, MedZ Sourcing single window, restaurants
53 26,000 jobs (ultimately) / 70 companies
Technopolis Services: banking, crèche, shops, MedZ Sourcing single window, restaurants
107 30,000 jobs / 76 companies
Fès Shore Services: banking, crèche, shops, MedZ Sourcing single window, restaurants
22 15,000 jobs
Oujda Shore Services: banking, crèche, shops, MedZ Sourcing single window, restaurants
22 2,000 jobs
a The ZFT was established by Decree No. 2-96-511 of 10 November 1997 and its rules of procedure approved by a ministerial order of 5 June 2000. It was set up as part of the priority infrastructure programme, which also envisaged the creation of the 300-hectares ZFE at Nador (Decree No. 2-96-512 of 10 November 1997). ZFT; viewed at: http://www.tangerfreezone.com.
Source: Table drawn up by the Secretariat on the basis of data received from the authorities; viewed at: http://www.medz-sourcing.com/nos-parcs-offshore.
3.5. In addition to fiscal benefits, companies setting up in the ZFT benefit from streamlined procedures (i.e. single window), which allows them to circumvent red tape - a benefit that is not negligible in Morocco, ranked 71st out 189 countries in terms of ease of doing business (Section 2.4.2).161
3.2.4.2 Customs regimes
3.1. In order to boost the competitiveness of its enterprises, Morocco has various customs regimes (REDs), comprising a total of nine procedures that allow importation with suspension of duties and taxes (Table 3.12), a prior exportation procedure, and a drawback procedure. These promote the storage, processing, use and movement of goods. In the case of industrial free warehouses, the companies benefiting from this procedure may sell on the domestic market up to 15% of the volume exported the previous year. The prior exportation procedure (i.e. special application of temporary admission for inward processing) allows the exportation of products obtained from goods of foreign origin on which import duties and taxes have been paid and the re-importation of an equivalent volume of raw materials and semi-processed products virtually duty free. The latest procedure introduced is entitled "temporary exportation for outward processing using standard exchange", and allows defective goods to be exported for repair and, pursuant to a contractual or legal guarantee obligation, the importation of replacement goods provided free of charge without payment of the applicable duties and taxes.162 Unless there is a waiver, operations under the REDs must be covered by security guaranteeing fulfilment of the relevant commitments.
Table 3.24 Suspensive procedures, 2015Title Benefits BeneficiariesCustoms or storage warehousing
Goods are placed for a fixed period in a warehouse controlled by the ADII.
Natural or legal persons engaged in storing or warehousing goods on behalf of third parties (normal private warehouse); beneficiaries of an authorization to open a warehouse (special private warehouse); city or chambers of commerce (public warehouse)
Temporary admission for inward processing (ATPA)
Suspension of duties and taxes on goods imported in order to be processed, worked or for further treatment and certain goods, listed in an order issued by the Minister responsible for finance, which are not identified in the compensating products but allow them to be obtained even though they totally or partially disappear when used in the manufacturing process.
Enterprises possessing the equipment needed for the activity
161 World Bank (2015).162 Article 152 bis of the Customs and Excise Code.
WT/TPR/S/329 • Kingdom of Morocco
- 66 -
Title Benefits BeneficiariesProcessing under customs control
Suspension of duties and taxes on goods imported for the purpose of undergoing operations that modify their type or state with a view to putting on sale the products resulting from these operations, called processed products. The latter must be eligible for total or partial exemption from import duties and taxes or reduced tariffs in comparison with the goods to be utilized.
All companies under Moroccan law
Temporary exportation for outward processing
Provisional export of products or goods of Moroccan origin, with suspension of duties and taxes, prohibitions or other restrictions on exit, which entered the country after payment of import duties and taxes or were imported under the temporary admission for inward processing procedure for the purpose of being worked or processed abroad before being re-imported.
All companies under Moroccan law
Temporary exportation for outward processing using standard exchange
Export of defective goods for repair and, pursuant to a contractual or legal guarantee obligation, import of replacement goods provided free of charge, with exemption from the duties and taxes payable. Prior import of replacement goods may be authorized before the dispatch of the defective goods.
All companies under Moroccan law
Temporary admission
Import (for a period of 6 months to 2 years, unless otherwise provided), with suspension of duties and taxes, of goods and various products (exportable in the state in which they were imported) such as: equipment that remains foreign property to be used to carry out works for a limited period of time or to be used occasionally for industrial purposes; films or cinematographic recordings; packaging, containers and their accessories; samples and models; goods to be presented or used for trade or other events; articles for tests and experiments; professional equipment and animals; frames and containers; commercial vehicles used for TIR.
Industrial enterprises; enterprises carrying out major works (dams, etc.); organizers of fairs and exhibitions; exporters of packaging
Temporary exportation
Temporary export of goods with suspension of duties and taxes with a view to their use abroad, for example, equipment that remains Moroccan property to be used to carry out works for a limited period of time or to be used occasionally for industrial purposes; films or cinematographic recordings; packaging, containers and their accessories; samples and models; goods to be presented or used for exhibitions, fairs or other events; articles for tests and experiments; professional equipment and animals; frames and containers; commercial vehicles used for TIR.
Persons in possession of the goods presented for export; industrial enterprises; enterprises carrying out works abroad; organizers of fairs and exhibitions abroad; individuals (painters, craftsmen, sports teams)
Industrial free warehousing
Suspension of duties and taxes on the import of materials, equipment, parts and spare parts, and goods to be used with a view to export of the compensating products obtained.
Enterprises which intend to invest either in a new creation or an expansion for a minimum amount of DH 50 million
Transit Suspension of duties and taxes, prohibitions or other restrictions normally applicable.
All transport companies and operators
Source: Ministry of Finance and Privatization, Customs and Excise Administration (ADII), La douane vous propose des solutions diversifiées (The customs offers you a variety of solutions); viewed at: http://www.douane.gov.ma/dms_prod/loadDocument?documentId=43406. Ministry of Finance and Privatization (2006), Les régimes économiques en douane (Customs regimes), January; viewed at: http://www.douane.gov.ma/brochures/NEW edition/B2 Fr.pdf.
3.2. The drawback procedure permits the refund (according to a standard fixed rate) to exporting enterprises of duties and taxes paid on the exportation of certain goods or on the products contained in the goods exported or consumed (including energy products) in the course of their manufacture. Only the products determined in a decree are eligible for this procedure.
3.2.4.3 Export financing
3.1. Exporters may make use of special financing tools such as pre-financing of exports, raising of credit abroad, "factoring" and "forfaiting".
3.2. Credit abroad may be raised from a Moroccan bank or from a foreign correspondent through a Moroccan bank. In the latter case, the remaining time-limit for payment must be 30 days or more. The reference interest rate applicable to export credits (pre-financing credits and credit raised abroad) is fixed in relation to the basic bank rate for export credits plus a risk premium (14.4% in 2015).163
3.3. Credits raised abroad in order to finance or pre-finance exports, as well as loans to re-finance existing commitments, do not require prior authorization by the Foreign Exchange Board. The
163 Bank Al-Maghrib, Research Directorate, Quarterly Bulletin No. 142, December 2014,.
WT/TPR/S/329 • Kingdom of Morocco
- 67 -
exchange regulations also allow other financing formulas such as "forfaiting" and "factoring". "Forfaiting" consists of purchasing discounted receivables without recourse against the exporter in the case of non-payment. "Factoring" allows an exporter's receivables to be transferred to a foreign institution, which undertakes to collect payment while at the same time assuming the risk of non-payment.
3.4. In August 2013, the State also introduced three new guarantee and co-financing tools in support of exporting enterprises, namely: DAMANE EXPORT, intended to guarantee (70%) of short-term credits granted to such enterprises by banks, security for export markets guaranteeing up to 70% of the security given by banks for export markets, and MEZZANINE EXPORT, intended to co-finance the investment projects of exporting enterprises together with banks and on concessionary terms.
3.2.4.4 Insurance
3.1. Morocco's credit insurance sector is expanding as a result of the presence of three large companies in the market, the Moroccan Export Insurance Company (SMAEX), COFACE MAROC and EULER HERMES ACMAR, in addition to the major commercial banks which propose services similar to credit insurance through factoring.
3.2. The SMAEX164, a parastatal company (the State holds nearly 35% of its capital), specializes exclusively in export credit insurance. It offers two types of export insurance, namely, market credit insurance and public export insurance. The latter is managed by the SMAEX on behalf of the State. Market credit insurance covers 90% of the cost of the credit insured against risk of non-payment, owing either to an extended failure to pay or the insolvency of the foreign client following a judicial settlement, and proposes two appropriate policies depending on the export turnover: a "Simplified Policy" for exporters whose export turnover does not exceed DH 5 million, and a "Personalized Policy" for exporters whose export turnover exceeds DH 5 million.
3.3. Public export insurance, managed by the SMAEX on behalf of the State, covers the following: guarantee against political risks, disasters and non-transfer165; special commercial risks for companies which export capital goods, carry out public works, or supply services lasting over one year; and risks relating to market surveys and fairs.
3.4. To support exporters in diversifying their markets, the authorities have significantly lowered premiums for the cover of political, disaster and non-transfer risks. The decrease was around 66% for coverage of risks related to private buyers and 83% for government buyers.
3.5. Market survey insurance guarantees exporters seeking new outlets the reimbursement of up to 50% of the costs incurred if their action turns out to be unsuccessful or insufficient. There are two types of market survey insurance: normal market survey insurance ("APN") for established exporters seeking to consolidate their market shares and/or win others, and simplified market survey insurance ("APS") for SME/SMIs whose export turnover does not exceed DH 1 million. Fairs insurance covers up to 50% of the costs committed for unsuccessful participation in an international trade event. For fairs and market survey insurance, the exporter keeps all of the indemnity paid out if there is no export turnover.
3.6. Exporters of goods may enter into contracts with foreign factoring agencies under which the latter undertake to collect all or part of the cash or term commercial debts from foreign clients for the Moroccan exporter.166
164 The SMAEX was set up pursuant to the Dahir containing Law No. 1-73-366 of 23 April 1974, as supplemented by the Dahir containing Law No. 1-92-282 of 29 December 1992 and amended by the Dahir containing Law No. 1-04-09 of 21 April 2004.
165 In the following cases: insolvency of the foreign private buyer following a judicial settlement or liquidation; failure on the part of a private or public debtor; moratorium declared by the administrative authorities of the foreign country; a war or natural disaster in the buyer's country; and political or administrative problems preventing or delaying the transfer of funds.
166 Articles 349 and 350 of the General Instruction for Foreign Exchange Operations of 31 December 2013; viewed at: http://www.oc.gov.ma/portal/fr/content/instruction-générale-des-opérations-de-change-du-31-décembre-2013.
WT/TPR/S/329 • Kingdom of Morocco
- 68 -
3.2.4.5 Promotion
3.1. Since 2008, a strategy for the development and promotion of exports has been implemented by the Ministry responsible for foreign trade. The aim is to triple the volume of exports (excluding phosphates and their byproducts) and to create 380,000 jobs by 2018. Exports are expected to increase from DH 114 billion in 2008 to DH 327 billion in 2018. This strategy should help support the commercial development of exporters on strategic, traditional or emerging markets. The Ministry responsible for foreign trade has targeted seven strategic sectors and 30 priority markets: textiles and leather, agrifood industries, processing of seafood products, electrical and electronics industries, automotive and aeronautics industries, offshoring and information and communications technologies. In order to facilitate implementation of this strategy, Maroc Export's resources have been greatly increased in order to diversify its forms of intervention. The new measures are financed by the Export Development Fund provided in the 2009 Finance Law.
3.2. Maroc Export is a public institution167 under the supervision of the Ministry of Foreign Trade and is responsible for promoting and developing exports of industrial, agricultural and agro-industrial products, as well as services. Each year, it conducts the programme for the promotion of Morocco's activities abroad, decided upon by its governing board.168 Maroc Export supports and assists companies that export or have export potential; undertakes studies and surveys and tests products on foreign markets; disseminates economic and trade information on these markets, as well as on Morocco's exportable offer; gives advice; and organizes export training programmes. It also organizes Morocco's participation in special events and multi-sectoral fairs, as well as missions and meetings between Moroccan businessmen and foreign partners. It is financed in part through the 0.25% parafiscal import tax (Section 3.1.3.3).
3.3. The Ministry of Foreign Trade also supervises other bodies such as the Marketing and Export Board (OCE) which export agricultural and food industry products by grouping together small and medium-sized producers. The Casablanca Fairs and Exhibitions Board (OFEC) organizes professional events of international scope in order to make Morocco an international destination for strategic sectors (clothing, automotive, offshoring, electronics). The National Foreign Trade Council (CNCE) makes suggestions on enhancing the competitiveness of export sectors, both as regards production and operations that are part of the export process.
3.4. Since 2007, exporters and approved intermediary banks have been authorized to grant supplier or buyer credit to foreign customers.169 These loans may cover up to 85% of the value of exports of goods or works and the supply of services to be provided abroad by Moroccan companies. They may be granted for short or medium terms for all categories of goods and for a long term (e.g. eight years) for capital goods.
3.3 Measures affecting production and trade
3.3.1 State trading, State-owned enterprises and privatization
3.1. In March 1996, Morocco notified the WTO170 of its State-trading enterprises within the meaning of Article XVII of the GATT. No notification has been received since then; according to the authorities only the Moroccan Phosphates Board (OCP), a State monopoly since 1921, currently meets this definition. In 2008, the OCP became a public limited company in which the State had the largest holding with 95% of the shares, the remainder being held by the private sector. The OCP is one of the world's leading exporters of crude phosphate, phosphoric acid and phosphate fertilizer.171
3.2. The other State-trading enterprises appearing in the notification include the Tobacco Board, the National Tea and Sugar Board (closed down) and the National Electricity Board (Section 4.4.4). The Tobacco Board, a State-owned company which had a general monopoly on the growing, manufacture, sale, purchasing, import and export of tobacco and tobacco products, has been privatized in two stages. Nevertheless, the State's monopoly on the import and wholesale
167 Maroc Export (Moroccan Export Promotion Centre (CMPE)) was created by Dahir No. 1-76-385 of 17 December 1976.
168 The governing board is composed of representatives of the public and private sectors and is chaired by the Ministry responsible for foreign trade.
169 Foreign Exchange Board Circular No. 1722 on export credits (1 August 2007).170 See WTO document G/STR/N/1/MAR of 21 March 1996.171 Viewed at: http://www.ocpgroup.ma/fr.
WT/TPR/S/329 • Kingdom of Morocco
- 69 -
distribution of raw and manufactured tobacco was extended until 31 December 2010.172 In January 2011, the Ministry of the Economy and Finance authorized two operators to enter the market: British American Tobacco Maroc (BATM) and North Africa Tobacco Company (NATC). Decree No. 2-13-27 of 30 January 2013 specifies that applications for authorization for the wholesale distribution of manufactured tobacco must be filed with the Ministry responsible for industry, which issues an order setting out the conditions for its storage, preservation and transport in order to guarantee regular supplies. This Decree lays down the criteria for approving the consumer price, establishing a commission responsible for giving an opinion on applications for approval of the price of manufactured tobacco products.
3.3. According to the Ministry of Finance, there was no privatization between 2007 and 2011, except for the sale of the Mohammedia Salt Company in 2011 and in 2013 that of the last State holding in the capital of the People's Central Bank (BCP). Subsequently, the Renault-Nissan factory in Tangiers, 52.4% owned by the Renault Group and 47.6% by the Deposit and Management Fund (CDG), became wholly owned by the Renault Group after the CDG sold its share at the end of 2014.
3.4. The privatization process has enabled Morocco to channel a large volume of foreign direct investment (FDI) to the industrial, energy and services sectors (particularly telecommunications, tourism and financial services). Table 3.13 gives a list of some companies in which the State has a holding, several of them being engaged in import/export.
Table 3.25 Some companies with a State holding operating in 2015
Company
State's share of
the capital
(%)
Activity
Agence de dédensification et de réhabilitation de la médina de Fès
100 Construction of sites and execution of programmes related to activities for the safeguard of Fez
Société nationale des autoroutes du Maroc 99 Construction, maintenance and operation of motorways Société pour l'ingénierie des industries agricoles et alimentaires
24 Research and engineering, design offices
Asma Invest 50 Investment projects for development Barid Al Maghrib 100 Post and savings Al Barid Bank BankingSociété de productions biologiques et pharmaceutiques vétérinaires
100 Manufacture and marketing of veterinary, pharmaceutical, chemical or biological medicines
Crédit agricole du Maroc 87 Banking Société Casablanca transports SA 100 Development of an urban public transport system in the city of
Casablanca Caisse de dépôt et de gestion BankingCrédit immobilier et hôtelier BankingDiyar Al Madina 100 Urban planning and house buildingFonds d'équipement communal BankingFonds marocain de développement touristique
100 Establishment of or holding in any company with a venture project
Foncière université internationale de Rabat
83 Construction, rental, management and operation of buildings used by Rabat International University
Holding d'aménagement Al Omrane 100 Urban planning and housing construction Itissalat Al Maghrib 30 Telecommunications Idmaj Sakan 88 Integration of slums and under-developed districts in the
Greater Casablanca Region Jardin zoologique national SA 100 Research, design, development and construction of the zooLaboratoire métallurgique d'études et de contrôle
11 Industrial analysis and quality control laboratory
Méditel Telecommunications Maroclear 56 Abolition of paper certificates for shares (securities) and their
conservation, management and administration Moroccan Agency for Solar Energy 100 Programme of integrated projects for generating electricity from solar
energy Morocco Investment Authority 100 Support for the country's economic development by investing in
several sectors La marocaine des jeux et des sports 100 Organization and operation of betting on sports competitions in
Morocco and abroad Office chérifien des phosphates (OCP) 95 Phosphate miningOffice national de l'électricité et de l'eau potable (ONEE)
100 Electricity and drinking water
Société Rabat région aménagements 85 Planning and development of the region
172 Decree Law No. 2-06-386 of 28 July 2006 amending and supplementing Law No. 46-02 on the raw and manufactured tobacco regime. Decree No. 2-13-27 of 30 January 2013 amending and supplementing Decree No. 2-03-199 of 22 May 2003 implementing Law No. 46-02. Law No. 46-02 determined the timetable for gradual elimination of the monopolies for these products. Since January 2005, they have been freely produced and exported.
WT/TPR/S/329 • Kingdom of Morocco
- 70 -
Company
State's share of
the capital
(%)
Activity
Compagnie nationale de transport aérien Royal Air Maroc
98 Air transport
Société d'aménagement et de développement de MAZAGAN
98 Planning and development of the MAZAGAN tourism zone
Société arabe libyo-marocaine holding 24 Investment and shares, businessesSociété d'aménagement pour la reconversion de la zone portuaire de Tanger ville
100 Conversion of the port area in the city of Tangiers
Société d'aménagement Ryad 100 Planning and marketing of the Ryad development in RabatSociété d'investissements énergétiques 100 Development of renewable energies and improving energy efficiency
and economy Société marocaine d'assurance à l'exportation
41 Export insurance and reinsurance
Société marocaine d'ingénierie touristique 100 Research and promotion of tourism development with investorsSociété nationale d'études du détroit de Gibraltar
100 Studies on a permanent link between Europe and Africa
Société nationale de la radio et de la télévision
100 Public service missions in order to meet the public's cultural, educational, information and entertainment needs
Société nationale des transports et de la logistique
100 Commissioning services in the area of national and international goods transport
Société d'exploitation des ports 100 Port management and operationSociété Maroc-Émirats arabes unis de développement
33 Investment in the hotel industry, real estate, industry and trade, automobiles, education, agrifood industry and fisheries
Société nationale de commercialisation de semences
96 Purchase, import, export, packaging and sale of seeds, seedlings and trees
Société nationale d'aménagement communal
98 Urban reconstruction and rehabilitation
Société nationale de réalisation et de gestion des stades
100 Works and maintenance for stadiums
Société d'études et de réalisations audiovisuelles "SOREAD" SA
76 Public service missions in order to meet the public's cultural, educational, information and entertainment needs
Société royale d'encouragement du cheval 100 Construction and development of infrastructure and horse racing; management of betting on horse racing in Morocco and France
Société tangéroise d'exploitations commerciales
40 Creation, purchase, management or operation of bookshops, stationery shops, printing works, publishing houses, libraries, etc.
Société d'aménagement de la vallée de Oued Martil
100 Planning, development, operation, management and marketing of the Oued Martil valley project
Agence spéciale Tanger méditerranée 100 Planning, development, operation and management of the Tanger Med port complex
Tanger Med 2 100 Planning and development of Terminal 2 at the Tanger Med port complex
Source: Information provided by the authorities.
3.5. By the end of June 2015, Morocco had 212 public institutions and 44 companies in which the Treasury held a direct share, with annual turnover amounting to DH 198 billion and investment of DH 72 billion.173 Some of these businesses and public institutions had subsidiaries or holdings amounting to a total of 442 entities at the end of December 2014, of which 236 were majority State-owned.174 In 2014, 79 State-owned enterprises were being liquidated. The sectoral distribution of State-owned enterprises and public institutions (EEPs) underlines the importance of the social, educational and public health sectors, which account for 29% of the government portfolio, followed by 21% for housing and urban planning, 12% for agriculture and fisheries, and 15% for water, energy and mining resources.175
3.6. In Morocco, privatization is governed by Law No. 39-89, as amended and supplemented by Law No. 34-98.176 The Law defines three methods of privatization: through the financial market (Casablanca stock exchange), bidding or direct sale. Bidding is the method most commonly used (over 50% of the revenue generated, as was the case in 2009), followed by direct sale177 (30%) and public offer of sale on the stock exchange (19%). Privatization transactions are subject to
173 Viewed at: http://www.finances.gov.ma/fr/Pages/Gestion-entreprises-publics.aspx?m=NOS%20METIERS&p=34.
174 In Morocco, these entities are designated "state-owned companies" if all the capital is held by government bodies; "government-owned subsidiaries" if over 50% of the capital is held by government bodies; and "semi-public companies" if up to 50% of the capital is held by government bodies (Source: Dahir No. 1-03-195 of 11 November 2003 enacting Law No. 69-00 on State financial control of State-owned enterprises and other bodies). Government holdings of less than 5% are not included in the portfolio.
175 Ministry of the Economy and Finance; viewed at: http://www.finances.gov.ma/fr/Pages/Gestion-entreprises-publics.aspx?m=NOS%20METIERS.
176 Law No. 39-89 authorizing the transfer of State-owned enterprises to the private sector, enacted by Dahir No. 1-90-01 of 11 April 1990, as amended and supplemented by Law No. 34-98, enacted by Dahir No. 1-99-131 of 13 May 1999.
WT/TPR/S/329 • Kingdom of Morocco
- 71 -
post-transfer follow-up of the buyer's contractual undertakings on investment and job protection throughout the period fixed in the contract of sale, usually five to ten years. At the operational level, follow-up takes the form of a regular exchange on the state of progress in the investment programmes and visits to the site of the company concerned.
3.7. The legislation allows a maximum of 10% of the capital of enterprises to be privatized to be reserved for employees when an enterprise is sold or 20% of the shares up to a ceiling of 10% of the capital when shares are sold. Employees may be given a maximum reduction of 15% on the selling price.178 In order to boost regional development, priority may be given to natural persons resident, born in or engaged in an economic activity in the region where the enterprise is situated, to Moroccan citizens belonging to the region, to companies whose objective is to develop the regional economy and which have their headquarters in the region, or to cooperative associations having their headquarters there. In the case of sale of state holdings in companies marketing cotton, oilseeds or selected seeds or companies that process sugar beet and cane, fruit and vegetables, or engage in cotton ginning, priority is given to agricultural cooperative associations. In such cases, the procedure followed is limited competitive tendering.179 The Ministry responsible for effecting the transfers, an inter-ministerial Commission composed of five members (Transfer Commission) and an Evaluation Body supervise the transactions.
3.8. The most notable developments in recent years include the entry into force of Law No. 86-12 on public-private partnership contracts, adopted unanimously by the Chamber of Representatives in February 2014180; the introduction of a new strategic partnership for Maroc Telecom following the withdrawal of Vivendi from the company's capital; the introduction of new regulations on government procurement, reaffirming the harmonization of contracting procedures for government procurement by extending their scope to regional authorities and some public institutions; continued gradual generalization of the conclusion of contracts through the signing of programme agreements between the State and EEPs, seven of which are currently in force181; these are the subject of evaluation and regular follow-up in accordance with the contractual clauses in each particular case; and extension of the scope of the Code of Good Governance to EEPs.
3.3.2 Incentives
3.1. There are currently numerous incentives under the Investment Code (Section 2.4) or available to specific sectors, including export (Section 3.2.4). At sectoral level, there is the Hassan II Fund for Economic and Social Development, created in 2000182, which, inter alia, promotes investment through financial contributions (in the form of financial holdings, refundable advances or loans and non-refundable financial contributions)183 to any project that helps to promote investment and employment. Since its foundation up until 2014, the resources accumulated by the Hassan II Fund amounted to DH 49 billion, of which DH 38.69 billion contributed by the State and DH 9.21 billion in the form of financial products.
177 Direct sale is used to exercise pre-emptive rights among shareholders following unsuccessful invitations to tender, in order to respect pre-emptive rights or priority, or for reasons of regional development or job protection.
178 Decree No. 2-90-577 of 16 October 1990 implementing Article 7 of Law No. 39-89 authorizing the transfer of State-owned enterprises to the private sector, as amended and supplemented by Decree No. 2-99-125 of 14 May 1999.
179 Decree No. 2-90-402 of 16 October 1990 on the enabling power conferred by Article 5 of Law No. 39-89 authorizing the transfer of State-owned enterprises to the private sector, as amended and supplemented by Law No. 35-98, enacted by Dahir No. 1-99-132 of 13 May 1999.
180 Law No. 86-12 on public-private partnership contracts, adopted in February 2014 and published in the OJ of 22 January 2015, and its implementing Decree of 7 May 2015, published in the OJ of 1 June 2015.
181 The contracts currently in force have been signed between the State and the National Electricity and Water Board (ONEE) (2014-2017), the Agency for the Development of the Bouregreg Valley (AAVBR) (2014-2018), Barid Al Maghrib (2013-2017), the Marrakesh Water and Electricity Distribution Authority (RADEEMA) (2013-2016), the national airline Royal Air Maroc (RAM) (2011-2016), the National Railway Board (ONCF) (2010-2015) and the Moroccan National Highway Company (ADM) (2008-2015).
182 Decree No. 2-00-129 of 16 March 2000 establishing trust fund No. 3.1.04.04, called the Hassan II Fund for Economic and Social Development; Dahir No. 1-02-02 of 29 January 2002, enacting LawNo. 36-01 creating the Hassan II Fund for Economic and Social Development and its implementing DecreeNo. 2-02-93 of 12 March 2002.
183 As a general rule, the purpose of the Fund is to provide financial support for the following programmes: housing, highway infrastructure, irrigation, forest management, structures for industrial and tourism investment, building of sports and cultural centres, creation of infrastructure for small fishing ports and for developing information technology; activities to promote employment, particularly through micro-credit associations; and, in general, all projects helping to promote investment and employment.
WT/TPR/S/329 • Kingdom of Morocco
- 72 -
3.2. The portion of the Fund allocated to large-scale infrastructure has been used to finance several major projects: ports, roads, highways, railways, development of irrigated and wooded perimeters, and large urban constructions. The contributions used to promote investment went mainly to industry (programme to set up integrated industrial platforms, investment support mechanisms), tourism (tourist resorts under the Azur Plan, Moroccan Tourism Development Fund) and transport (development of RAM). By late 2014, 137 projects had been completed out of a total of 207 projects approved by the Fund and distributed between the automotive subcontracting (44%), textiles and clothing (29%) and aeronautical subcontracting (14%) sectors. A large part of the Fund's resources come from privatization revenue (Section 3.4.1).
3.3. At the end of 2014, programmes and projects of national scope accounted for 31% of the total amount of the Fund's cumulative commitments, with investment accounting for 12.3% of total investment. Regional projects took up 69% of the Fund's cumulative commitments and represented 87% of total investment. For 2014, the social impact of the Fund's action has been evaluated, notably through the creation of direct and indirect jobs, estimated to be over 7,000 after completion of the 24 contracts signed during the year, most of which concerned the automotive industry.184
3.4. Consumer prices are still subsidized for Moroccan common wheat flour and sugar (Section 4.1.4), and butane gas until December 2015 in principle (Section 4.4.2).
3.5. Since 2003, Morocco has been implementing a policy aimed at vitalizing its industrial fabric, based in particular on initiatives to benefit SMEs.185 It should be noted that 95% of Moroccan enterprises are SMEs.
3.6. In 2009, the State introduced financing mechanisms managed by the Central Guarantee Fund (CCG).186 These mechanisms mainly cover guarantee products and, secondly, co-financing products introduced in support of sectoral policies (TAMWIL, RENOVOTEL, etc.), as well as some specific investment capital products. The new national guarantee system introduced in 2009 has led, in particular, to a broader range of guarantee products for micro, small and medium-sized enterprises (MSMEs).187
3.7. In support of SMEs, the National Agency for the Promotion of Small and Medium-sized Enterprises (ANPME), created in November 2002, for example offers assistance in implementing business plans for investment programmes and conducting strategic and financial analyses for rescheduling SMEs' bank debts; in upgrading accounting systems to enhance the transparency of SMEs; and in signing agreements with banks. In June 2012, the ANPME once again launched the "Information Technology" programme, which proposes informatics solutions to companies, tailored to their operational needs and respective professional spheres in order to give them a useful tool for improving their productivity.
3.3.3 Competition policy and price controls
3.1. With the enactment of Morocco's new Constitution in July 2011, the legislation on competition and pricing moved to a new stage188, marked by the publication of Law No. 104-12 on free pricing
184 Ministry of the Economy and Finance, Report on State-owned enterprises and public institutions; viewed at: http://www.finances.gov.ma/Docs/2014/db/depp_fr.pdf.
185 According to Dahir No. 1-02-188 of 23 July 2002 enacting Law No. 53-00 containing the small and medium-sized enterprise charter, an SME is any enterprise managed and/or administered directly by natural persons who own it, co-own it or have shares in it, provided that not more than 25% of its capital or voting rights are held by non-SMEs. This ceiling may be exceeded, however, if the enterprise is owned by a collective investment fund, capital investment company, risk capital entity or financial body authorized to make use of public savings. In addition, the maximum permanent payroll in existing SMEs must not exceed 200 and annual turnover (excluding tax) over the previous two financial years must not have exceeded DH 75 million, or the total annual balance sheet must not have been more than DH 50 million. Newly created SMEs (those in existence for less than two years) must undertake an overall initial investment programme not exceeding DH 25 million and must comply with an investment/job ratio not exceeding DH 250,000.
186 Viewed on the CCG's website at: http://www.ccg.ma/fr/index.php.187 A micro enterprise is defined as one whose turnover does not exceed DH 3 million; a small enterprise
has turnover of DH 3 to 10 million; and a medium-sized enterprise has a turnover of DH 10 to 200 million. MSMEs group all these categories together.
188 Article 166 of Dahir No. 1-11-91 of 29 July 2011 enacting the text of the Constitution (OJ No. 5964 bis of 30 July 2011): "The Competition Council is an independent institution responsible, in connection with the organization of free and fair competition, for ensuring transparency and equity in economic relations, notably by analysing and regulating competition on markets, controlling unfair trade practices and economic merger operations and monopolies."
WT/TPR/S/329 • Kingdom of Morocco
- 73 -
and competition and Law No. 20-13 on the Competition Council in August 2014. These laws confirm the tasks of the Competition Council.189 Henceforward, the Council may itself deal with any matters affecting competition in Morocco. Businesses may also approach the Competition Council directly, without having to involve the professional chambers.
3.2. Law No. 104-12 requires that all notifications of proposed mergers above a specified threshold should no longer be forwarded to the head of government but directly to the Competition Council. The latter now has decision-making power as regards mergers. The Law reserves to the head of government the right to decide on an operation for reasons of general interest.190 Economic concentration projects which meet certain criteria set out in Article 12 of Law No. 104-12 must be notified to the Competition Council by the businesses and parties concerned before they may be carried out.191 Article 11 of the Law regulates mergers; they are not prohibited as such, but have to be controlled. The Law and its implementing Decree have also added other alternative notification criteria to the sole restrictive requirement that prior notification has to be given if the companies party to the transaction have a 40% share of the market.
3.3. Law No. 104-12 sets out the substantive rules and legal principles on free pricing and competition, whereas Law No. 20-13 deals specifically with the Competition Council, whose opinion is necessary for any matter concerning competition, at the Government's request. It may be consulted by Parliament, by businesses, regional authorities, chambers of commerce, industry and services, professional chambers, trade unions and professional associations or consumers' associations.192 It is now authorized to take preventive measures and to impose monetary sanctions of up to 10% of the global or national turnover of the offending company (or interested parties). The Competition Council's opinion is forwarded to the parties concerned and its decisions are published on the Council's website. There is also an Interministerial Pricing Commission193, an advisory body responsible for examining price control issues submitted to it for an opinion.
3.4. Some sectors have their own regulatory authorities responsible for competition. These include the National Telecommunications Regulatory Authority (ANRT), the BAM for the banking sector, the Council for Ethical Standards in the Securities Market for the stock exchange, the High Authority for Audiovisual Communication (HACA), and the National Ports Agency (ANP). Only the ANRT, however, has the exclusive right to deal with competition issues in its sector.
3.5. Law No. 104-12 lists three anti-competitive practices: understandings, abuse of a dominant position, and predatory pricing. It prohibits all concerted action, agreements, understanding or collusion and abuse of a dominant position when the objective is to prevent, restrict or distort competition. Exceptions may apply to SMEs and agreements allowing farmers to market their products, or practices that make a sufficient contribution to "economic progress" to offset the restrictions and give users a fair share of the benefits.
3.6. The Law applies to natural or legal persons whose activities affect competition on the Moroccan market; production, distribution and services (including those of government officials if they are acting as economic operators); and understandings among exporters that affect competition on the domestic market. "Agreements of minor importance which do not noticeably restrict competition" (the so-called de minimis rule) have now been excluded from the control of anti-competitive practices, together with agreements among SMEs.
3.7. Moroccan law also now recognizes the offence of predatory pricing of products or services sold to consumers. The exception to the principle of free competition concerning a list of products and services whose selling price is controlled has, however, been maintained, despite the 2010
189 Decree No. 2-14-652 of 1 December 2014 implementing Law No. 104-12 on free pricing and competition. They replace Law No. 06-99 on free pricing and competition.
190 Anti-competitive practices and economic concentration are defined in Articles 6, 7, 8 and 11 of Law No. 104-12 on free pricing and competition.
191 Article 12 provides as a threshold for notification to the competition authority, one of the following three conditions: total global turnover of DH 750 million or more, excluding tax, for all the businesses or groups of natural or legal persons party to the merger; total turnover of DH 250 million or more, excluding tax, in Morocco, for at least two of the businesses or groups of natural or legal persons concerned; a minimum 40% share of the market.
192 It is mandatory for it to be consulted on regulatory texts which may restrict competition; prior to determining prices and terms of sale, and the grant of State or local authority assistance.
193 It comprises: the Prime Minister (or the government authority delegated by him or his representative) (chair); the government authorities responsible for the interior, finance, agriculture, industry and trade, employment, planning, economic and general affairs (or their representatives); and representatives of the government authority with competence for the sector being addressed by the Commission.
WT/TPR/S/329 • Kingdom of Morocco
- 74 -
amendment to Law No. 06-99 intended to limit to four years the establishment of a list of products and services whose prices would be controlled.
3.8. Law No. 104-12 lays down the principle of pricing freedom and pricing based on free competition, which is nonetheless restricted by the exceptions that give the State the right to intervene after consulting the Competition Council. This is the case for monopolies; ongoing supply difficulties; legislative or regulatory provisions; large-scale disasters or abnormal market situations; and excessive price fluctuations. At the request of professional organizations or at the initiative of the Government, prices may be made subject to approval.
3.9. Pursuant to Law No. 104-12, free pricing does not apply to products and services on a list fixed in the regulations. Since its previous TPR, Morocco has removed postal services from the list. The production price for raw tobacco has also been liberalized. The following prices continue to be controlled by the State194: subsidized goods (Moroccan common wheat flour, sugar and petroleum products), basic services (drinking water, liquid sanitation, electricity, passenger road transport, urban passenger transport, school books), health products and services (pharmaceuticals, medical acts and services in the private sector, acts by midwives and nurses in the private sector), products and services under a monopoly (manufactured tobacco), as well as acts by bailiffs, acts in Hebrew (i.e. legal acts drawn up by Hebrew-speaking notaries) and acts by notaries.
3.10. A new system for determining the price of medicines has been adopted pursuant to Decree No. 2-13-852 of 18 December 2013 on the conditions and terms for determining the selling price of domestically manufactured or imported medicines to the public. The new system is based on a comparative analysis of manufacturers' prices, excluding tax, in countries used as a benchmark, namely, France, Spain, Portugal, Belgium, Kingdom of Saudi Arabia and Turkey. The selling price to the public corresponds to the sum of the manufacturer's price, excluding tax, the wholesaler's margin, the pharmacist's margin, and VAT. At the meetings of the Interministerial Pricing Commission held in 2014 and in January 2015, there was therefore a global review of the prices of 5,407 medicines.
3.11. In May 2014, new measures on the rates and invoicing of electricity, drinking water and sanitation were adopted pursuant to the provisions in the programme agreement between the State and the National Electricity and Water Board for the period 2014-2017.195 Maximum profit margins have also been fixed for certain food products (refined sugar) and pharmaceuticals.
3.12. In January 2013, new provisions were introduced by Law No. 138-12 concerning the consumer price of manufactured tobacco.196 The minimum price requirement for new brands of manufactured tobacco introduced into the market has thus been eliminated. In parallel with this measure, the system for taxing manufactured tobacco was overhauled in 2013 in order to introduce a degree of competition. The consumer price of manufactured tobacco products is fixed freely by the manufacturers or wholesale distributors declared or authorized, respectively. The consumer price only applies after being approved according to the conditions set out in the regulations.
3.13. The price of liquid fuels, including diesel fuel, premium petrol, No. 2 fuel oil and special fuel for generating electricity has to be approved. Approval takes place on the 1st and 16th of each month, pursuant to the provisions in the agreement on approval of petroleum product prices between the Government and the petroleum products sector197, taking into account the following: prices on Rotterdam's international market, the US$/DH exchange rate, and the structure of the redemption and selling prices attached to Order No. 4554-14.
194 Order No. 3086.14 of 29 December 2014 of the Minister attached to the Prime Minister's Office responsible for economic and general affairs, determining the list of price-controlled products and services.
195 Ministry of General Affairs and Governance; viewed at: http://www.affaires-generales.gov.ma/index.php/fr/2014-11-10-11-16-26/2014-11-19-12-02-39/2015-01-16-13-52-18.html.
196 Dahir No. 1-13-01 of 30 January 2013 enacting Law No. 138-12 amending and supplementing Law No. 46-02 on the regime for raw and manufactured tobacco.
197 Agreement on approval between the Moroccan Government and the petroleum products sector signed on 26 December 2014 and Order of the Minister attached to the Head of Government responsible for general affairs and governance No. 4554.14 of 29 December 2014 on the determination of the ex-refinery redemption price and the selling price of liquid fuel.
WT/TPR/S/329 • Kingdom of Morocco
- 75 -
3.3.4 Government procurement
3.1. Morocco is neither a party nor an observer to the WTO Plurilateral Agreement on Government Procurement.
3.2. Government procurement accounts for around 15% of GDP and a large share of turnover in sectors such as construction (70%) and engineering (80%). The General Treasury of the Kingdom (TGR) is responsible for monitoring the legality of the operations and for prior verification of the availability of financial credits and resources. Contracts awarded by EEPs have to be approved by State comptrollers and paymaster generals pursuant to the provisions of Law No. 69-00 on State financial control of EEPs. The Court of Audit and the regional courts of audit also play a role in monitoring government procurement. The Procurement Commission, which is attached to the General Secretariat of the Government, has competence, inter alia, for giving an opinion on draft legislative or regulatory texts on government procurement, drawing up instructions for the procurement services, proposing provisions to supplement the regulations, and codifying and updating the latter.198
3.3. Morocco does not have any central government procurement board or any single authority responsible for awarding contracts. Ministries, State-owned enterprises and local authorities award contracts themselves. The Ministers are the authorizing officers and have the authority to approve contracts. They may delegate the procedure (organization and award of contracts) to their deputies (those awarding the contracts). For local authority contracts, the authorizing officers are: the governors; the presidents of the local councils and of regional councils; the president of the inter-regional cooperation committee; and the Wali (prefect) of Rabat-Salé.
3.4. On 1 January 2014, a new Government Procurement Code came into force in Morocco following the adoption of Decree No. 2-12-349199, repealing Decree No. 2-06-388 of 2007.200 The new text revises a certain number of provisions in the 2007 Decree and makes significant amendments to the procedure for awarding government procurement contracts. The first new feature is to make the Government Procurement Code applicable (in addition to all government and regional authorities) to the public institutions listed in an order of the Minister of the Economy and Finance.201 The second is the redefinition of the most economically advantageous bid. According to the new regulations, the most economically advantageous bid is that acceptable as regards technical and operational quality and offering the lowest price taking into account the economic assessment of the cost of use and/or maintenance.
3.5. Lastly, the new Code institutionalizes design and execution contracts by defining the design of a project and the execution of the works, or the design, supply and execution of a complete installation as a single contract with a service supplier. The new Code thus has a large number of articles defining the regime for the supply of architectural services. Under Moroccan law, however, it is mandatory to employ an architect for the design, granting of a building permit and overseeing the construction of buildings situated in certain zones, including urban zones. In such cases, the government client commissioning the work must enter into a contract with an architect and set aside the corresponding fees, ranging from 3% to 5% of the amount of the work (excluding tax).
3.6. The entry into force of Decree No. 2-12-349 of 20 March 2013 on government procurement gave competitors for government contracts more equal access, more equitable treatment of bidders and firmer guarantees of the rights of competitors and contractors, along with increased automation of procedures so as to make the administration of contracts more transparent and effective. The amendments to the Code have several objectives such as transparency, harmonization of procedures, close involvement of Moroccan industry in government procurement, protection of the environment and sustainable development goals. The legal and regulatory framework comprises other legislative texts in addition to this Decree.202
198 Decree No. 2-78-840 of 30 December 1975 on reform of the Procurement Commission.199 Decree No. 2-12-349 of 20 March 2013 on government procurement; Decree No. 2-06-388 of
5 February 2007 determining the requirements and methods for awarding government procurement contracts, and certain rules concerning their administration and monitoring.
200 For further details on the regime applicable until 2013, see WTO (2009).201 List of EEPs determined by an order of the Minister responsible for finance and provided in Article 19
of Law No. 69-00, as amended and supplemented.202 Other legal texts apply to government procurement, for example: Decree No. 2-99-1087 of
4 May 2000 approving the general administrative conditions for contracts for works; Decree No. 2-01-2332 of 4 June 2002 approving the general administrative conditions for design and project management contracts; Law No. 61-99 enacted by Dahir No. 1-02-25 of 3 April 2002 on the liability of authorizing officers, comptrollers and public accountants; Decree No. 2-03-703 of 13 November 2003 on time-limits for payment and interest
WT/TPR/S/329 • Kingdom of Morocco
- 76 -
3.7. Decree No. 2-12-349 on government procurement lays down the requirements and methods for awarding contracts for works, supplies or services on behalf of the State, regional authorities and public institutions. The following, however, remain outside the scope of the Decree: agreements or contracts awarded according to the methods and rules of ordinary law203 (for example, contracts for the supply of water, electricity and telephone services); contracts for public service and works concessions; sale of goods between government services or between the State and the regions, prefectures, provinces and communes; services rendered between government services governed by the legislation and regulations in force; contracts for financial transactions on the international financial market and related services and contracts awarded in connection with agreements or conventions concluded by Morocco with international organizations or foreign governments where these expressly specify the application of special requirements and methods for awarding contracts. The institutions covered by the government procurement legislation include government departments, local authorities and some public institutions
3.8. As was the case for the preceding decree, Decree No. 2-12-349 provides for the following methods for awarding contracts: call for bids (open or limited, and with prequalification), competition, negotiated contracts, and purchase orders. A call for bids is most commonly used (accounting for 93% of contracts, which amounted to DH 30.8 billion in 2014) (Table 3.14). It is open if all candidates may submit bids and limited where only those candidates which the contracting agency has decided to consult may submit bids.204 A call for bids with prequalification means that only candidates that have sufficient capacity, from the technical and financial point of view, are authorized to submit bids, after an eligibility commission has given its opinion.
3.9. The competition method is used if special considerations so justify, for example, for technical, aesthetic or financial reasons. The contract negotiated allows the contracting agency to negotiate the terms of the contract with one or more candidates.205 Purchase orders may be used for particular services up to a maximum of DH 200,000 and at least three candidates must now be consulted (unless otherwise provided). As an exceptional measure, the head of government may authorize the DH 200,000 ceiling to be raised but it may not exceed DH 500,000.
Table 3.26 Principal methods for awarding government procurement contracts, 2010-2014
YearCall for bids Negotiated procedure Competitive bidding Purchase orders Total value
Number % of total value Number % of total
value Number % of total value Number % of total
value (DH million)2010 10,400 88.7 273 2.4 8 0.0 50,522 8.9 20,2782011 9,970 87.6 215 2.9 5 0.1 45,713 9.5 17,1652012 10,878 87.0 357 6.7 3 0.0 45,383 6.3 25,8942013 8,917 87.7 213 2.1 1 0.0 42,130 10.2 15,7462014 12,560 92.9 342 1.8 13 0.1 45,634 5.3 33,225
Source: Information provided by the Moroccan authorities.
3.10. The Bids Commission is responsible for public opening of the bids and for evaluating them. For government contracts, it is composed of a representative of the contracting agency (chair); two other representatives of the contracting agency; a representative of the General Treasury of the Kingdom; and a representative of the Ministry responsible for finance if the estimated amount of the contract exceeds DH 50 million, including tax. For contracts awarded by public institutions, the Commission comprises the director of the public institution or the person specially designated by him (chair), two representatives of the contracting agency appointed by the director of the public institution, the representative of the Minister responsible for finance in accordance with the legislation on government financial control applicable to the institution, the person responsible for
rates in relation to government procurement and Order of the Minister of Finance No. 617-04 of 31 March 2004 on its implementation; and the Decree on the National Government Procurement Commission of 28 September 2015, to enter into force on 1 January 2016.
203 The list of services which may be the subject of contracts or agreements under ordinary law is attached as Annex 1 to Decree No. 2-12-349. The list may be amended or supplemented by means of an order from the Minister responsible for finance following a proposal by the Minister concerned and after hearing the opinion of the Procurement Commission.
204 Limited calls for bids apply solely to services that can only be carried out by a limited number of contractors, suppliers or service suppliers because of their nature, their complexity, or the level of skills and resources to be mobilized, the means and equipment to be used, and the amount of which does not exceed DH 2 million, including tax.
205 The cases in which contracts may be negotiated, after notification and a call for competition, or without notification or a call for competition, are listed in Article 86 of Decree No. 2-12-349 on government procurement.
WT/TPR/S/329 • Kingdom of Morocco
- 77 -
the institution's procurement service or his representative, and the person responsible for the institution's financial service or his representative. In both cases, the contracting agency may call on any other person, expert or technician whose participation is deemed useful.
3.11. Decree No. 2-12-349 reaffirmed the preference that may be given to Moroccan enterprises for contracts for works and related design contracts, which remains limited to 15%. When groups comprising Moroccan and foreign enterprises bid, the percentage applies to the share of the foreign enterprises.
3.12. To enhance transparency and boost competition, the new Decree reaffirms the amendments introduced in 2007. A call for bids must be published in at least two national newspapers (one of which must be in Arabic and the other in a foreign language) and on the government procurement website, which has been operating since January 2007. It may also be published simultaneously in the official gazette of legal, judicial and administrative announcements, in specialized publications or by any other means, in particular, electronically. The new Decree also provides for publication of the estimate for the contract by the contracting agency in its call for competitive bids. The main purpose of this publication is to allow bidders to focus on the quality of the bids, in addition to enhancing transparency of the government procurement process.
3.13. The new Decree introduces some changes concerning the threshold values for large-scale procurement, for which the 21-day time-limit for notification is increased to 40 days. For contracts for works awarded on behalf of the State, regional authorities and public institutions, the minimum estimated amount is DH 63 million, excluding tax, and DH 1.6 million, excluding tax, for contracts for supplies and services. For the procurement of goods and services for public institutions and the regions, prefectures, provinces and communes, the minimum estimated amount is DH 8.7 million, excluding tax. These thresholds may be amended by means of an order from the Minister responsible for finance, after hearing the opinion of the Bids Commission.
3.14. The introduction of the government procurement website has allowed procedures to be automated. In addition to consulting a government procurement database, it allows online bidding. The website also includes the legislative and regulatory texts applicable to government procurement, future government procurement plans, calls for expressions of interest, notifications and the deadline for the various methods of awarding contracts, the results of bidding and the contracts negotiated, as well as reports on fulfilment of contracts. Bid documents can be downloaded from the government procurement website free of charge. The following are also published on the website: notification of postponement, modifications (in the invitation to bid or postponement of the date for opening the bids), announcement of the date of the meeting or onsite visit organized for competitors and the ensuing record, as well as any clarification or information provided by the contracting agency to a competitor, an extract from the record of the meeting examining the bids and the decision to annul the procedure.
3.15. The reasons for rejecting bids must automatically be communicated to bidders. A system of appeals has been introduced which allows bidders to raise the matter with the contracting agency if there is a dispute. The latter must respond within five days following the receipt of the appeal. If the bidders are not satisfied, they may bring the matter to the attention of the Minister or the Chair of the Governing Board of the public institution concerned, who may, inter alia, decide to remedy the irregularity or annul the procedure. Competitors may approach the Procurement Commission directly without involving the contracting agency or the Minister concerned if they find that one of the government procurement rules of procedure has been breached or if the Minister concerned fails to reply.
3.16. Like its predecessor, Decree No. 2-12-349 clarifies the criteria for allotment and regulates subcontracting (which must not exceed 50% of the amount of the contract or concern the main lot or works). The new Decree maintains renewable contracts allowing the contracting agency to receive supplies uninterruptedly from the same supplier over a maximum period of three or five
WT/TPR/S/329 • Kingdom of Morocco
- 78 -
years depending on the services covered.206 The term for framework contracts is three years, except those for archive management, which is five years.207
3.17. The new Decree maintains the obligation to monitor fulfilment of the contract and carry out internal audits of contracts for amounts exceeding DH 5 million, including tax, and introduces a threshold of DH 1 million, including tax, for negotiated contracts. These contracts must be the subject of a report sent to the Minister responsible or the director of the public institution concerned, as applicable; an extract is published on Morocco's government procurement website.
3.3.5 Intellectual property rights
3.1. Morocco is a member of the World Intellectual Property Organization (WIPO) and is party to the following conventions or arrangements: Paris Convention for the Protection of Industrial Property; Berne Convention for the Protection of Literary and Artistic Works; Universal Copyright Convention; Patent Cooperation Treaty (PCT); Madrid Agreement Concerning the International Registration of Marks and its Protocol; Brussels Convention Relating to the Distribution of Programme-Carrying Signals Transmitted by Satellite; Nairobi Treaty on the Protection of the Olympic Symbol; and the International Union for the Protection of New Varieties of Plants (UPOV). In December 2008, Morocco accepted the Protocol amending the TRIPS Agreement.208 This Amendment incorporated the new provisions in the Doha Declaration on the TRIPS Agreement and Public Health concerning compulsory licensing.
3.2. Since 2009, Morocco has embarked upon the process of acceding to a number of treaties, namely: the Singapore Treaty on the Law of Trademarks; the Geneva Act of the Hague Agreement on the International Registration of Industrial Designs; the Locarno Agreement Establishing an International Classification for Industrial Designs; the Strasbourg Agreement Concerning the International Patent Classification; and the Vienna Agreement Establishing an International Classification of the Figurative Elements of Marks. In 2013, the laws approving these international instruments were published in Official Journals. In April 2011, Morocco became party to the Budapest Treaty on the International Recognition of the Deposit of Microorganisms for the Purposes of Patent Procedure. In addition, Morocco is among the 54 countries and intergovernmental organizations that signed the Final Act on Appellations of Origin and Geographical Indications, adopted in Geneva on 20 May 2015. An agreement between Morocco and the European Patent Organisation on the validation of European patents was signed on 17 December 2010.209
3.3. There have been important changes to the legislative framework for intellectual property since Morocco's previous TPR.210 For example, Law No. 23-13 supplementing and amending Law No. 17-97211 on the protection of industrial property came into force on 18 December 2014.212
The purpose of the new law is to raise the level of industrial property protection in Morocco and to bring the legislation into line with international commitments, notably the TRIPS Agreement and the Trademark Law Treaty. Law No. 23-13 contains provisions intended to further strengthen the national anti-counterfeiting mechanism and to increase the level of protection by making the terms of imprisonment and the fines more dissuasive. The new amendment allows right holders to choose between civil or criminal proceedings in order to defend their rights. The amount of damages to remedy the injury caused to the right holder, for example, has increased from a minimum of DH 50,000 to a maximum of DH 500,000.
206 A maximum period of three years for the following services included in paragraph A of Annex 3 to the Decree: care and maintenance of green areas; acquisition of climate data; insurance against occupational injury and the civil liability of personnel, students and pupils; explosions and fires in buildings, storage areas and warehouses and water damage; insurance of equipment, rolling and floating stock serving ports, insurance of aircraft and passengers; insurance and costs for maritime or air transport of goods; care and maintenance of informatics, technical, electrical, electronic, scientific, medical and telecommunications equipment; maintenance of building machinery and equipment; maintenance and repair of furniture; maintenance, cleaning, security and supervision of administrative buildings. A maximum period of five years for the following services included in paragraph B of the same Annex: hosting and management of information systems; automobile rental; rental of software licences.
207 Framework contracts cover recurrent supplies whose quantities are not necessarily known. They may be awarded when the amount and timetable for the supply of a service cannot be determined in advance.
208 WTO document WT/LET/638 of 12 December 2008.209 This is a technical agreement on the validation system introduced by Law No. 23-13.210 WTO document IP/N/1/MAR/3 of 7 April 2008.211 Dahir No. 1-00-91 of 15 February 2000 enacting Law No. 17-97 on the protection of industrial
property.212 The Decree implementing Law No. 23-13 amending Law No. 17-97 on the protection of industrial
property was approved by the Council of the Government on 15 January 2015.
WT/TPR/S/329 • Kingdom of Morocco
- 79 -
3.4. The Moroccan Industrial and Commercial Property Office (OMPIC), a public institution set up in 2000213 within the Ministry of Industry, Trade, Investment and the Digital Economy, is responsible for administering industrial property titles (trademarks, patents and industrial designs) and keeps the Central Commercial Register. Copyright and related rights are administered by the Moroccan Copyright Bureau (BMDA)214, supervised by the Ministry of Communication, and the protection of new plant varieties by the Ministry responsible for agriculture.
3.5. The new legislation has given the ADII increased responsibility for combating counterfeiting and piracy. It allows automatic suspension of the release into circulation of goods suspected of being counterfeit or pirated or their automatic confiscation at the border. They may be seized at the written request of the owner of a protected trademark, the owner of a geographical indication or a controlled appellation of origin215, the beneficiary of an exclusive right of exploitation or the holder of copyright or a related right. Since 2006, the BMDA has also been authorized to seize pirated articles automatically.
3.6. The National Industrial Property and Anti-Counterfeiting Committee (CONPIAC) started to operate in April 2008, bringing together the government bodies concerned216 and private operators sponsored by the General Confederation of Moroccan Enterprises (CGEM). Its purpose is to strengthen cooperation and coordination among the different stakeholders in order to combat counterfeiting.
3.7. The most commonly encountered infringements of intellectual property rights in Morocco are counterfeiting and piracy of audio and audiovisual media, trademarks, followed by industrial designs. A study commissioned by the CONPIAC in 2012 endeavoured to analyse and estimate the extent of counterfeiting on the Moroccan market. It was calculated to be DH 6 to 12 billion each year in the following major sectors: textiles and leather, spare parts for motor vehicles, electrical appliances and hygiene and cosmetic products. Informal production and distribution markets help to supply the domestic market in the same way as imports of counterfeit products.
3.8. Parallel imports are authorized, with the exception of patents.
3.3.6 Industrial property rights
3.1. December 2014 saw a significant reform of Morocco's legislative and regulatory framework for industrial property following the publication of Law No. 23-13 amending and supplementing Law No. 17-97, already amended in 2006.217 The aim of the new reform is to consolidate the national trademark system, improve the patent system, modernize the national system for industrial designs, step up enforcement of industrial property rights, and streamline application procedures for industrial property rights by creating, among other things, an electronic filing service for applications and shortening the time-limits for opposition.
3.2. Law No. 17-97 protects trademarks or service marks consisting of denominations of all kinds, as well as figurative signs and, following the adoption of Law No. 31-05, also sounds or olfactory marks. Ownership of a trademark is acquired through its effective registration and remains valid for a period of ten years, renewable indefinitely. Trademark holders may lose their rights if they do not make "proper" use of the mark for a period of five years. Law No. 23-13 provides for the introduction of a system for dividing applications to register trademarks in conformity with the Singapore Treaty and reduction of the time-limit for filing the documents from four to three months.
213 Dahir No. 1-00-71 of 15 February 2000 enacting Law No. 13-99 creating the Moroccan Industrial and Commercial Property Office, and Implementing Decree No. 2-99-71 of 16 March 2000.
214 Decree No. 2-64-406 of 8 March 1965 creating the Moroccan Copyright Bureau.215 These provisions are contained in Title VI, Chapter II, of Law No. 23-13.216 These are: Ministry responsible for foreign trade (International Trade Relations Directorate); Ministry
of Justice (Civil Affairs Directorate); Ministry of the Economy and Finance (ADII); Ministry of the Interior (Economic Affairs Coordination Directorate and Directorate-General of National Security); Royal Police Force; Ministry of Agriculture (Plant Protection, Technical Control and Suppression of Fraud Directorate); Ministry of Tourism and Crafts (Directorate for Protection of the National Heritage, Innovation and Promotion); and OMPIC.
217 Law No. 31-05 amending and supplementing Law No. 17-97 on the protection of industrial property, enacted by Dahir No. 1-05-190 of 14 February 2006; and Decree No. 2-05-1485 of 20 February 2006 amending and supplementing Decree No. 2-00-368 of 7 June 2004 implementing Law No. 17-97 on the protection of industrial property.
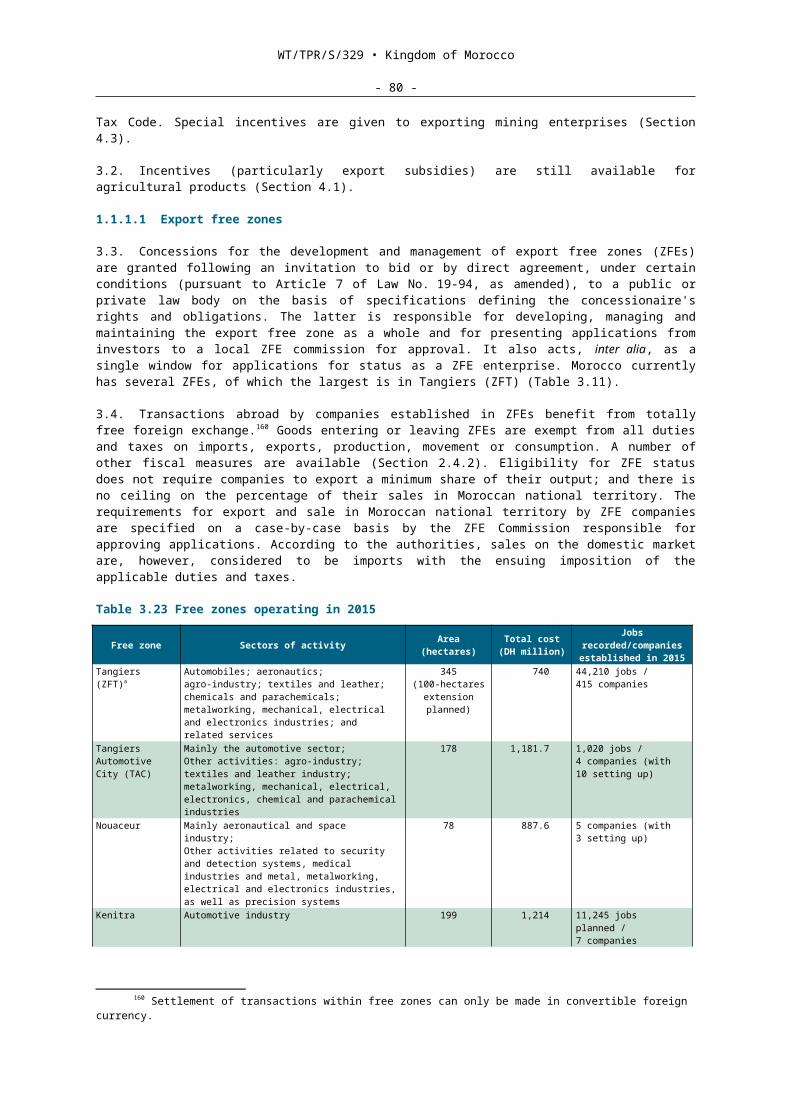
WT/TPR/S/329 • Kingdom of Morocco
- 80 -
3.3. The main novelty as far as patents is concerned has been the introduction of a system for examining applications according to patentability criteria (novelty, inventive step and industrial application). The OMPIC is responsible for preparing a search report giving an opinion on the product's patentability.
3.4. In order to achieve a balance between the interests of inventors and those of third parties, the new Law introduces exceptions to the rights conferred by a patent. In addition to the provisions already to be found in Law No. 17-97, which allowed compulsory or ex officio licensing in special situations (excessively high prices, shortages on the domestic market, public health interests) for patents for medicines by means of an administrative act, the so-called "Bolar" provision authorizes use of a patent in connection with studies or trials required in order to obtain a marketing authorization. These measures have been extended to exports to countries whose production capacity is insufficient.
3.5. Pursuant to Law No. 17-97 (as amended), the term of patent protection is 20 years.218
Law No. 31-05 provides for extending the term for medicines if there are delays in issuing the patent or the AMM. Compulsory licences may also be requested three years after the issue of a patent or four years after the date of filing the application if the owner has not started to work the invention, has not marketed the product or has given up working or marketing the patent in Morocco for more than three years. Ex officio licences to work a patent may be granted for reasons of public health219 or national defence.
3.6. The term of protection for layout-designs of integrated circuits is ten years. Law No. 23-13 introduces a change to the length of renewal of the term for industrial designs for four additional successive periods of five years each, giving a total term of protection of 25 years instead of 15 years as previously. As regards the protection of trade names, Law No. 17-97 refers to the provisions of Law No. 15-95 (Commercial Code).220 It also prohibits the use of false or misleading indications concerning the origin of a product or service, the identity of the producer, manufacturer or trader, and punishes use of a false or misleading appellation of origin or its imitation.
3.7. Law No. 25-06 on distinctive signs of origin and quality of foodstuffs and agricultural and fishery products was enacted in June 2008221 and came into force upon publication of its implementing texts in December of that year.222 It supplements Law No. 17-97 (as amended), which established the register of geographical indications at the OMPIC. Law No. 25-06 created a legal framework for the recognition and protection of the specific quality of agrifood products, particularly local products (Section 3.3.5) and determines the relevant sanctions. It also provides for the establishment of the National Commission on Distinctive Signs of Origin and Quality. It does not cover wines and spirits, which remain subject to the former regulations dating from 1977.
3.8. In the case of trademarks, the penal sanctions include terms of imprisonment of two months to one year and fines ranging from DH 50,000 to DH 1,000,000. The system of opposition established by Law No. 31-05 in 2006 has been consolidated with the new provisions in Law No. 23-13, which include the introduction of a system for rejecting applications to register trademarks on absolute grounds. For example, in a reasoned decision, the OMPIC may refuse applications to register trademarks if it considers that the sign has no distinctive character or is likely to mislead the public as to the nature, quality or geographical origin of the product or service. The holder of an exclusive exploitation licence also has the right of opposition, unless otherwise stipulated in the licensing agreement. Appeals may be made to the Commercial Court of Appeal against the OMPIC's decisions. In 2014, the OMPIC received 898 requests opposing the registration of trademarks, compared to 737 in 2013, i.e. a 22% increase.
218 Decree No. 2-00-368 of 7 June 2004 implementing Law No. 17-97 on the protection of industrial property.
219 For example, when the quantity or quality of medicines placed on the Moroccan market is insufficient or if prices are excessively high.
220 The Central Commercial Register approves the sign or name chosen by the trader or business. It issues a negative certificate indicating that the sign or name requested did not previously exist. The practical use of a sign or name is necessarily subject to the issue of a negative certificate. Certificate holders lose the protection, however, if they are not entered in the Commercial Register within a period of one year, or do not make practical use of the sign or name for a period of three years after registration.
221 Dahir No. 1-08-56 of 23 May 2008 enacting Law No. 25-06 on distinctive signs of origin and quality of foodstuffs and agricultural and fishery products.
222 Decree No. 2-08-403 of 5 December 2008 implementing Law No. 25-06 and Decree No. 2-08-404 of 5 December 2008 on the composition and functioning of the National Commission on Distinctive Signs of Origin and Quality.
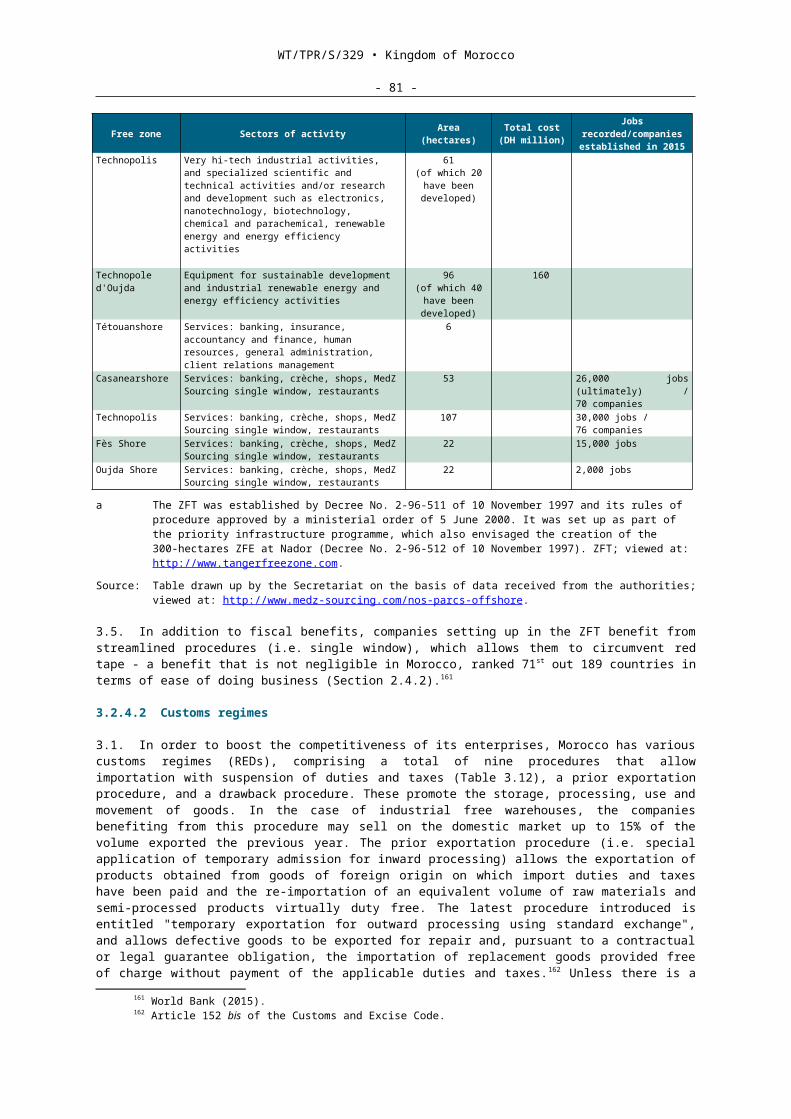
WT/TPR/S/329 • Kingdom of Morocco
- 81 -
3.9. Any infringement of patent rights is liable to civil and penal sanctions ranging from civil proceedings with a view to terminating the illegal acts and the payment of damages, to a term of imprisonment of two months to two years, and a fine of DH 50,000 to DH 500,000. If the offence is repeated, the penalties may be doubled and the term of imprisonment may be up to five years if the infringement affects national defence. The commercial courts have sole competence to hear proceedings resulting from application of the law, with the exception of certain administrative decisions. Their rulings may be appealed before the Commercial Court of Appeal, whose decisions in turn may be the subject of a final appeal to the Supreme Court.223
3.10. Law No. 17-97 imposes sanctions against any disclosure of information relating to an invention, and the penalties include fines of up to DH 500,000 and a term of imprisonment of up to two years.
3.11. In the Global Innovation Index 2014 report and the indicators published by the World Intellectual Property Organization in October 2014 on the filing of industrial property rights, Morocco was in 51st position for national patents, 44th for national trademarks and 18th for industrial designs.
1.1.1.1.1 New varieties of plants
3.12. There have been no changes to Morocco's legislative framework for the protection of new plant varieties since its previous TPR224 and they remain governed by Law No. 9-94.225 Since this law came into force, 603 applications for protection of the rights of breeders of new varieties of plants have been filed, leading to the protection of 314 varieties, with 238 varieties under examination. The remaining 51 varieties relate to applications withdrawn or abandoned or to varieties whose protection has expired.
3.3.6.1.2 Copyright and related rights
3.1. There have been some important changes to Moroccan copyright legislation since 2009, particularly developments regarding copyright and more especially the operation of the BMDA. The Ministry of Communication (the supervisory ministry) has drawn up a strategy to upgrade the BMDA under a programme agreement implemented between 2010 and 2013, and renewed for 2014-2016. The main objective is to bolster the existing structures with a view to effective implementation of the law governing copyright in Morocco, in compliance with international treaties and conventions, and to conduct communication and awareness-raising campaigns for the protection of copyright and to combat the piracy of protected works.
3.2. At the legislative level, since 2009 Morocco has ratified four treaties, namely: the WIPO Performances and Phonograms Treaty (WPPT) in December 2011; the WIPO Copyright Treaty (WCT) in December 2011; the Beijing Treaty on Audiovisual Performances in May 2014; and the Marrakesh Treaty to Facilitate Access to Published Works for Persons Who Are Blind, Visually Impaired or Otherwise Print Disabled in February 2015. At the domestic legislative level, on 20 May 2014 the BMDA adopted Law No. 79-12 on private copying, which reinforces the rights of authors and performers in Morocco.226
3.3. Law No. 2-00 on copyright and related rights (in force since 15 February 2000), amended by Law No. 34-05227 in 2006, then in 2014 by Law No. 79-12 on private copying, still governs copyright and related rights. It protects, inter alia, literary and artistic works, written works, computer programs, musical, dramatic or choreographic works, audiovisual works, works of fine art, architectural and photographic works, works of applied art, and the expressions of folklore, designs for creations of the clothing industry, and databases. Protection is conferred on the author for his lifetime and 70 years after his death (compared with 50 years previously). The Law also guarantees the author, in addition to his economic rights and moral rights with no time-limit, the
223 Law No. 53-95 establishing the commercial courts, enacted by Dahir No. 1-97-65 of 12 February 1997 (Articles 18-25).
224 WTO (2009).225 Decrees No. 2-01-2324 and No. 2-01-2325 of 12 March 2002 implementing Law No. 9-94 on the
protection of new varieties of plants, and its seven implementing Orders published in September 2002.226 Law No. 79-12 supplementing Law No. 2-00 on copyright and related rights was enacted by
Dahir No. 1-14-97 of 20 May 2014. According to the authorities, it will be accompanied by two decrees and could be implemented as of June 2016.
227 Dahir No. 1-05-192 of 14 February 2006, enacting Law No. 34-05 amending and supplementing Law No. 2-00 on copyright and related rights.
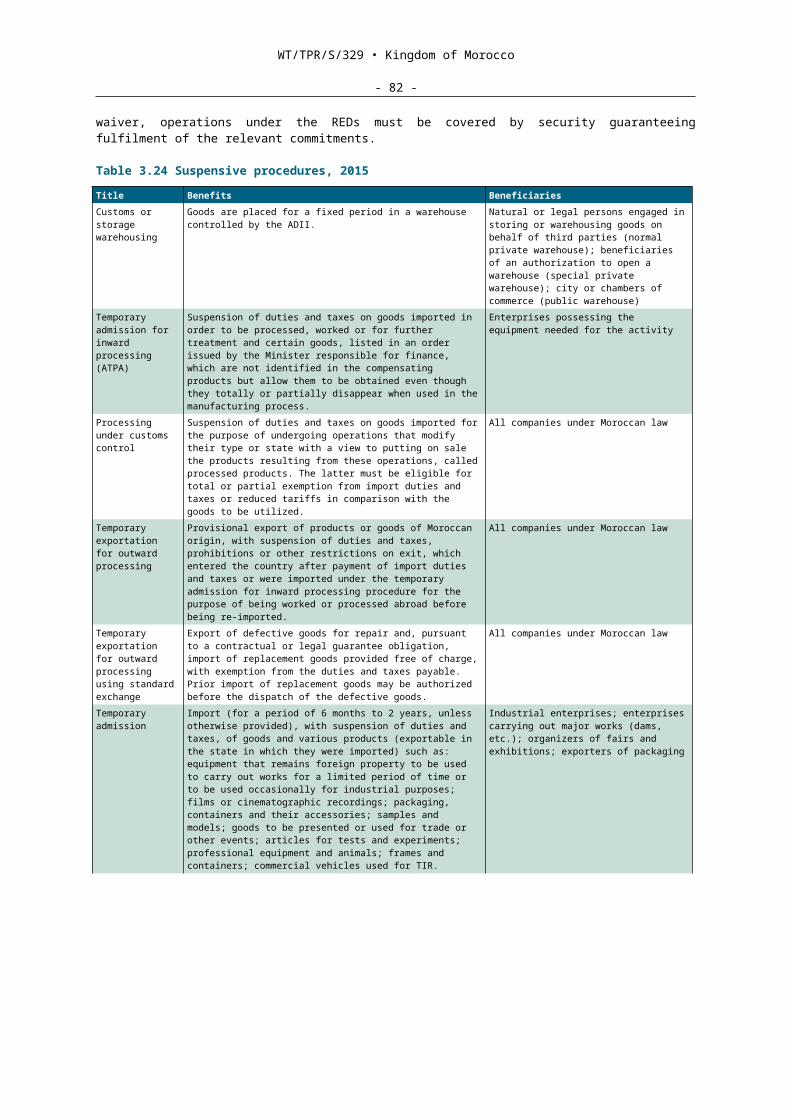
WT/TPR/S/329 • Kingdom of Morocco
- 82 -
right to claim authorship of his work, to remain anonymous or use a pseudonym, and in general to oppose any infringement of his work that would be prejudicial to his honour or reputation. Regarding related rights, the law guarantees their protection for 70 years in the case of performances and phonograms (as against 50 years previously) and broadcasts (compared with 25 years previously).
3.4. Infringements of copyright are subject to civil penalties such as payment of damages and the destruction of unlawful copies and materials used for illegal reproduction. Penal sanctions may be ordered in the form of a fine of DH 10,000 to DH 100,000 (compared with fines of up to DH 20,000 previously) and/or a term of imprisonment of two to six months. In the case of "habitual" offences (offences that are repeated but have not yet been judged), the penalties may be doubled. If the offence is repeated (i.e. a new act committed less than five years after the first judgment), a fine of DH 60,000 to DH 600,000 and/or a term of imprisonment of one to four years may be imposed.
3.5. Pursuant to Law No. 79-12, any infringement of the rights of a holder of copyright or related rights may be the subject of proceedings ordered ex officio by the office of the public prosecutor without the need for a complaint by a private party or a right holder. Civil judicial proceedings are brought before the courts of first instance. Appeals may be brought against their rulings. In the last instance, the parties in dispute may appeal to the Supreme Court.
3.6. The law gives responsibility for the protection and exploitation of copyright and related rights to the BMDA, which administers the interests of the various foreign societies of authors in Morocco under conventions or agreements with them, in compliance with the relevant international conventions and the WTO TRIPS Agreement. Law No. 34-05 has given the BMDA the right to bring action to defend the interests entrusted to it. As soon as an infringement is found, BMDA officials may now seize phonograms and videograms and any other usable recording media, as well as all materials used for illegal reproduction, without going through the King's Prosecutor. The government authorities now have to assist and support the BMDA and its officials.
3.7. Piracy remains a widespread phenomenon in Morocco. Since 2009, the BMDA has conducted more than 70 operations against the piracy of CDs and DVDs throughout the country, in the course of which it brought proceedings against several people, in implementation of the Copyright Law. A text is being prepared with a view to establishing a national anti-piracy committee, which will be responsible for introducing a strategy and a plan for consistent action in combating this serious problem.
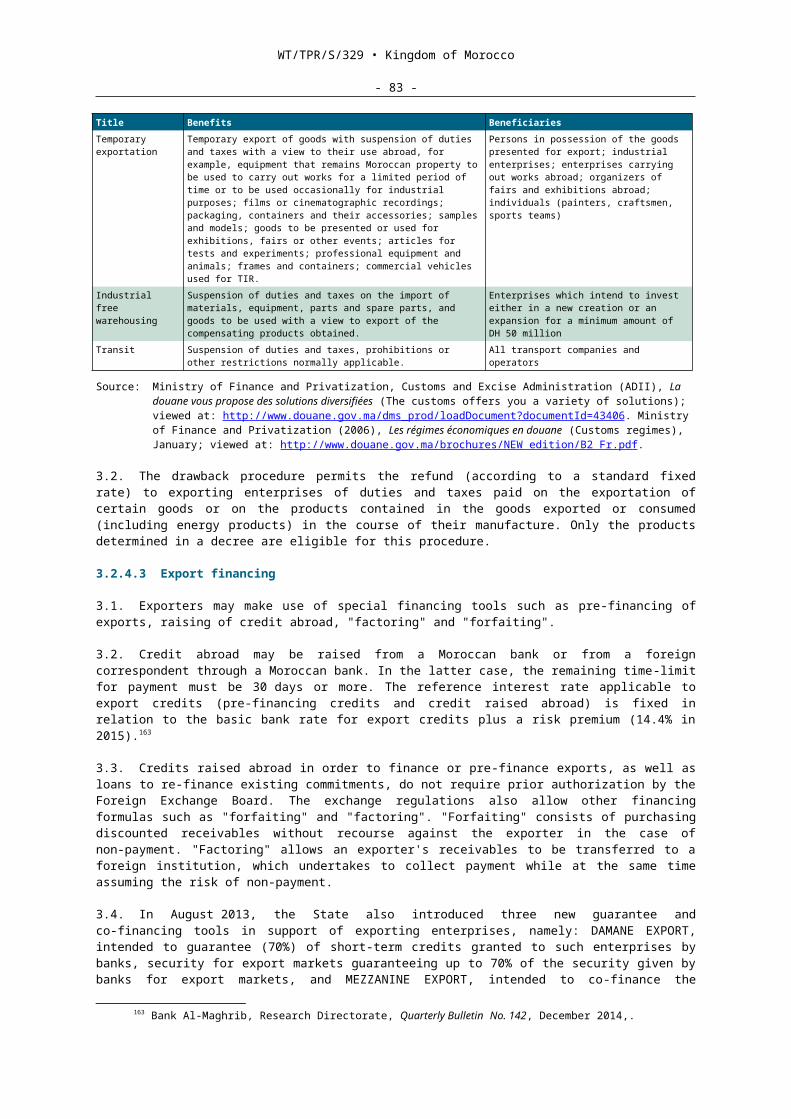
WT/TPR/S/329 • Kingdom of Morocco
- 83 -
4 TRADE POLICIES BY SECTOR
4.1 Agriculture and agro-industry
4.1.1 Overview
4.1. Morocco is a major producer and exporter of agrifood products. Olive production is estimated at almost US$1 billion, followed by wheat and tomatoes, and market gardening. For some products, Morocco accounts for a substantial part of world production and exports (Table 4.1). There has been strong overall growth in the production of cereals, vegetable crops and meat since 2008. Cereal production doubled between 2008 and 2014, in part thanks to the use of certified seed. Citrus and olive production has increased remarkably.
Table 4.27 Main agrifood products, 2008 and 2010-2013
Products 2008 2010 2011 2012 2013aWorld
share in 2013 (%)
2013Net production
(constant 2004-2006million Int. $)
Agricultural crops and processed harvests, output ('000 tonnes)Wheat 3,769 4,876 6,018 3,878 6,934 1.0 847Barley 1,353 2,566 2,318 1,201 2,723 1.9 202Sugar, beet 2,926 2,436 3,035 1,627 2,142 0.9 92Potatoes 1,537 1,605 1,721 1,657 1,929 0.5 302Fresh tomatoes 1,312 1,434 1,218 1,219 1,293 0.8 478Olives 765 1,506 1,416 1,316 1,182 5.8 946Dried onions 662 821 861 856 930 1.1 195Oranges 732 849 859 962 759 1.1 147Melons, cantaloupes 737 567 778 718 700 2.4 129Tangerines, mandarins 337 473 753 877 664 2.3 164Sugar, cane 913 632 764 541 620 0.0 20Watermelons 651 453 580 575 611 0.6 70Apples 404 445 512 486 583 0.7 247Carrots and turnips 281 264 428 707 509 1.4 127Grapes 291 344 382 342 436 0.6 249Raw centrifugal sugar 510 413 398 269 405 0.2 ..Fresh vegetables n.e.s. 283 274 561 317 318 0.1 60Bananas 215 289 277 222 302 0.3 85Pumpkins, squash, etc. 234 207 220 257 224 0.9 39Fresh peppers 232 225 143 181 180 0.6 85Broad beans, dry 109 149 171 148 157 4.5 27Green beans 182 214 121 134 155 8.2 147Leguminous plants 116 216 106 118 154 9.4 53Fresh beans 182 202 121 134 147 0.7 52Strawberries 130 141 111 140 145 1.9 197Molasses 190 152 188 108 138 0.2 ..Fresh peas 117 140 160 131 125 0.7 42Beer of barley 86 82 80 72 120 0.1 ..Apricots 113 135 159 122 120 2.9 66Maize (corn) 121 279 221 90 118 0.0 ..Virgin olive oil 75 147 134 120 114 4.0 ..Dates 73 101 103 102 108 1.4 38Figs 70 110 115 103 102 9.1 61Unshelled almonds 87 87 96 99 97 3.3 285Mint 65 72 55 99 88 92.1 ..Plums and sloes 66 79 65 75 87 0.8 52Peaches and nectarines 75 85 75 71 78 0.4 42Aubergines (eggplants) 35 38 35 50 72 0.1 15Artichokes 60 45 43 64 62 3.5 45Fresh fruit n.e.s. 43 49 49 50 52 0.2 18Livestock production (reserves)Poultry (million head) 168 179 185 190 195 0.9 ..Chickens (million head) 160 170 175 180 185 0.9 ..Turkeys (million head) 8 9 10 10 10 2.2 ..Sheep (thousand head) 17,07
818,02
318,737 19,006 19,956 1.7 ..
Goats (thousand head) 5,178 5,686 5,991 5,602 6,236 0.6 ..Bovine animals (thousand head)
2,814 2,896 3,038 3,029 3,173 0.2 ..
Asses (thousand head) 968 951 950 947 944 2.2 ..Mules (thousand head) 515 149 465 457 453 4.4 ..Horses (thousand head) 159 155 140 138 139 0.2 ..Camelids (thousand head) 45 52 55 57 57 0.2 ..Pigs (thousand head) 8 9 8 8 8 0.0 ..
WT/TPR/S/329 • Kingdom of Morocco
- 84 -
Products 2008 2010 2011 2012 2013aWorld
share in 2013 (%)
2013Net production
(constant 2004-2006million Int. $)
Beehives (thousand) 350 360 360 365 370 0.5 ..Primary livestock production and processed livestock productsSheep meat (thousand) 8,520 9,720 10,050 10,350 10,500 2.0 320Eggs in the shell (106) 3,700 4,700 5,100 5,100 5,245 0.4 ..Goat meat (thousand head) 1,979 2,049 2,150 2,200 2,363 0.5 62Cow's milk (thousand tonnes)
1,700 1,900 2,200 2,500 2,300 0.4 718
Bovine meat (thousand head)
944 929 988 1,030 1,278 0.4 677
Skimmed milk (thousand litres)
705 788 912 1,043 960 0.8 ..
.. Not available.a The main products are identified by volume of production in 2013.Source: FAOSTAT, http://faostat3.fao.org [May 2015]; and statistics provided by the Moroccan authorities.
4.2. The performance of Morocco's agricultural sector largely depends on weather conditions and access to irrigation. Livestock farming has benefited from favourable weather conditions, which have also led to a good cereal output and satisfactory plant cover in the main grazing areas. The bovine population therefore expanded from 2.8 to 3.2 million between 2008 and 2014, and that of small ruminants from 22.1 to 25.3 million, a 14% increase for each one. In contrast, insufficient rainfall in 2011/2012 adversely affected the output potential of some crops such as autumn cereals, industrial crops and fruit farming.
4.3. Table 4.2 shows imports of agricultural products (WTO definition) for the period 2008-2014; they declined sharply in 2009 and 2010, then recovered strongly in 2011 and 2012, finally returning to their 2008 level in 2013, or some US$5 billion per annum. Per product performance was also very uneven, with a sharp decline in imports of cereals, especially wheat. In contrast, imports of sugar and animal feed increased substantially, as did products such as tea, etc.
Table 4.28 Main imports of agricultural products, 2008-2014(US$ million)Products 2008 2009 2010 2011 2012 2013 2014Total imports 42,322 32,882 35,379 44,263 44,790 45,186 46,035Agriculture 5,191 3,809 4,197 5,797 5,773 5,042 5,811
% of total 12.3 11.6 11.9 13.1 12.9 11.2 12.6Main productsHS 1001 Wheat and meslin 1,614 683 878 1,440 1,400 978 1,506
Other (100190) 1,390 402 710 1,131 1,050 695 1,228Durum wheat (100110) 224 281 168 309 350 283 278
HS 1005 Maize (corn) 530 358 445 591 636 484 504HS 1701 Cane sugar 289 425 392 596 592 442 342HS 1507 Soya-bean oil and its fractions 485 337 353 535 475 380 389HS 2304 Oil-cake and other residues 61 77 176 244 271 266 219HS 0902 Tea, whether or not flavoured 101 108 111 174 167 190 189HS 2303 Residues of starch manufacture 176 89 103 159 164 175 178HS 0901 Coffee, whether or not roasted 78 77 68 95 115 108 98HS 0404 Whey 47 41 58 69 67 104 86HS 0405 Butter and other fats 132 68 95 131 99 100 137HS 0804 Dates, figs, pineapples, avocados, etc. 69 71 85 76 91 89 115HS 0406 Cheese and curd 60 48 55 57 66 79 81HS 0504 Guts, bladders and stomachs 43 47 48 64 79 78 66HS 5201 Cotton, not carded or combed 76 49 71 123 79 71 73HS 2306 Oil-cake and other solid residues 56 25 39 42 48 71 103HS 1209 Seeds, fruit and spores of a kind for sowing 61 59 63 70 66 70 70HS 2401 Unmanufactured tobacco 26 53 56 61 68 69 54HS 2402 Cigars and cigarettes 80 61 24 19 16 59 92HS 2106 Food preparations, nesoi 36 39 43 53 55 57 67HS 0202 Meat of bovine animals, frozen 35 40 22 59 25 54 49HS 2302 Bran, sharps and other residues 36 36 40 49 64 52 52HS 1003 Barley 105 49 41 82 165 51 105HS 0602 Other live plants 38 33 31 40 43 46 49HS 1516 Animal fats and oils 25 29 19 40 45 45 44HS 1201 Soya beans, whether or not broken 190 142 94 30 60 39 79HS 1901 Malt extract; food preparations of flour 33 31 29 36 40 38 40HS 1512 Oils 39 19 25 33 41 38 44HS 0102 Live bovine animals 34 34 73 72 35 36 51
WT/TPR/S/329 • Kingdom of Morocco
- 85 -
Products 2008 2009 2010 2011 2012 2013 2014HS 2208 Alcohol < 80% vol.; spirits, etc. 35 33 28 35 29 36 33HS 0701 Potatoes 31 24 20 33 27 33 23HS 1806 Chocolate and other preparations 27 28 20 23 29 33 42HS 1509 Olive oil and its fractions 23 48 7 11 9 32 17HS 2308 Vegetable materials and vegetable waste 8 1 11 16 31 25 28HS 1511 Palm oil 22 20 23 33 38 25 32HS 2309 Preparations for animals 18 17 21 21 23 24 31HS 1905 Bakers' wares 18 20 18 17 16 22 29HS 0105 Live poultry, that is to say, fowls of the species
Gallus domesticus, ducks, geese, etc.21 19 22 22 19 20 25
HS 1207 Other oil seeds and oleaginous fruits 21 24 19 25 21 19 17HS 0713 Dried leguminous vegetables 31 45 28 18 19 18 26HS 1805 Cocoa powder 5 7 13 20 19 17 16HS 1206 Sunflower seeds 10 17 19 34 5 17 12HS 2009 Fruit juice 12 8 15 17 14 17 11HS 2204 Wine of fresh grapes 17 20 13 13 14 17 15HS 2002 Tomatoes prepared or preserved 3 7 21 10 10 16 11HS 0402 Milk and cream, concentrated 40 29 27 20 17 16 62HS 2202 Waters, including mineral waters 10 10 11 13 10 15 14HS 1902 Pasta 9 9 9 12 12 14 16HS 2403 Other manufactured tobacco and tobacco
substitutes 8 6 7 12 12 14 18
HS 3501 Casein, caseinates 12 9 10 14 13 13 18HS 2004 Other vegetables prepared or preserved 6 7 7 10 10 13 13HS 0803 Bananas, including plantains 9 12 12 11 12 13 12HS 2005 Other vegetables prepared or preserved 7 8 10 14 15 13 12HS 3505 Dextrins and other starches 10 9 9 12 15 13 14HS 0703 Onions, shallots, garlic 4 7 8 8 6 13 17HS 0909 Seeds of anise 9 12 7 11 9 12 9HS 1006 Rice 5 11 10 2 18 12 2HS 0802 Other nuts 5 8 7 11 8 11 12HS 2103 Preparations for sauces 5 5 7 9 7 11 12HS 1904 Cereal products 9 10 9 11 11 11 12HS 0808 Apples, pears and quinces, fresh 5 13 12 12 10 10 18HS 1514 Oils of rape, colza, etc. 4 0 0 0 0 10 1HS 0910 Ginger, saffron, turmeric, thyme, bay leaves,
curry and other spices 5 6 4 7 9 10 11
HS 1704 Sugar confectionery not containing cocoa 6 7 5 5 6 10 13HS 1302 Vegetable saps and extracts 4 5 5 6 8 9 9HS 2008 Fruit and other edible parts of plants 7 6 6 8 8 8 11HS 1702 Other sugars 4 4 4 6 5 8 7HS 1602 Other prepared or preserved meat, meat offal
or blood4 4 5 5 6 7 9
HS 2102 Yeasts (active or inactive) 4 4 3 3 5 5 7HS 1502 Fats of animals 10 8 16 24 12 5 13
Note: Agriculture by WTO definition.Source: WTO Secretariat calculations based on data from the UNSD Comtrade database; statistics from the
Moroccan Foreign Exchange Board for 2014.
4.4. On the other hand, Morocco considerably increased and diversified its agricultural exports over the review period (Table 4.3). In 2015, Morocco was Africa's fourth largest exporter of agrifood products and the world's leading exporter of capers, green beans and argan oil; the third exporter of preserved olives; and the world's fourth largest exporter of clementines and tomatoes, the latter being its main agricultural exports. Cheese exports, mainly to the Middle East and Africa, also increased to US$140 million.
Table 4.29 Exports of agricultural products, 2008-2014(US$ million)
2008 2009 2010 2011 2012 2013 2014Total exports 20,306 14,069 17,765 21,650 21,417 21,965 23,821Agriculture 1,982 1,835 1,982 2,385 2,126 2,497 2,665
% of total 9.8% 13.0% 11.2% 11.0% 9.9% 11.4% 11.2%Main productsHS 0702 Tomatoes, fresh or chilled 265 304 300 431 402 429 479HS 0805 Citrus fruit, fresh or dried 421 313 381 492 359 407 373HS 0709 Other vegetables fresh or chilled 94 101 99 106 104 151 142HS 0708 Beans and fresh leguminous
vegetables 125 132 133 137 96 147 140
HS 2005 Olives and other prepared vegetables
165 140 150 150 137 143 172
HS 0406 Cheese and curd 95 95 93 90 114 140 125HS 0811 Frozen fruit 90 50 51 68 81 99 94HS 0810 Other fruit, fresh 38 43 50 99 76 92 107
WT/TPR/S/329 • Kingdom of Morocco
- 86 -
2008 2009 2010 2011 2012 2013 2014HS 1101 Wheat or meslin flour 35 24 32 47 67 78 68HS 0807 Melons, watermelons, papayas 66 71 57 57 57 63 70HS 1212 Beet and sugar cane 35 32 29 36 45 47 45HS 1302 Vegetable saps and extracts 36 33 39 36 37 46 50HS 0711 Vegetables provisionally preserved 28 25 25 30 36 41 45HS 1211 Plants, seeds and fruits 32 27 31 36 31 37 42HS 3301 Essential oils 35 24 30 33 29 34 29HS 1704 Sugar confectionery not containing
cocoa15 14 14 18 24 34 46
HS 2106 Other food preparations 18 21 23 20 18 30 33HS 2101 Extracts of coffee, tea or maté 30 33 27 27 30 25 26HS 1902 Pasta 10 9 9 12 18 24 29HS 2008 Fruit and other parts of plants 24 23 22 25 20 24 26HS 1515 Other vegetable fats and oils 11 12 13 16 16 22 25HS 1509 Olive oil and its fractions 10 10 55 80 31 22 40HS 2402 Cigars and cigarettes 13 16 15 22 2 21 58HS 0902 Tea, whether or not flavoured 10 9 12 20 17 20 24HS 0504 Guts, bladders and stomachs 26 56 53 28 31 19 23HS 1507 Soya-bean oil and its fractions 11 10 15 25 15 17 22HS 2202 Mineral waters and juices 8 9 7 8 12 16 18HS 0701 Fresh potatoes 24 5 10 10 8 15 17HS 2001 Preserved vegetables, fruit 13 12 11 11 13 13 15HS 0806 Grapes, fresh or dried 19 18 16 10 13 12 11HS 0703 Onions, shallots, garlic, fresh 4 4 4 5 6 11 12HS 1005 Maize (corn) 0 0 0 0 0 11 0HS 2403 Other manufactured tobacco 0 0 0 0 2 11 13HS 0909 Seeds of anise, coriander 11 8 8 9 7 9 14HS 1510 Other oils 5 3 6 8 4 9 10HS 2204 Wine 11 9 9 11 6 8 12HS 0910 Ginger, saffron, and other spices 4 9 6 6 7 8 8HS 0809 Fresh stone fruit 7 9 7 5 6 8 10HS 1806 Chocolate and other preparations 2 4 4 4 7 7 5HS 2009 Fruit juice 2 3 3 5 8 6 10HS 0802 Other nuts 5 6 5 6 5 6 7HS 0603 Cut flowers and flower buds 3 4 5 5 5 6 8
Note: Agriculture by WTO definition.Source: WTO Secretariat calculations based on data from the UNSD Comtrade database.
4.1.2 Agricultural policy
4.1. Since the previous review of Morocco's trade policy in 2009, the Ministry of Agriculture and Marine Fisheries (MAPM) has launched the Green Morocco Plan 2008-2020 (PMV), designed to make Morocco's agriculture a driver of economic and social development.228 This programme is intended, inter alia, to enhance agricultural productivity and the availability of high-quality food products, boost employment and rural incomes, slow the pace of urbanization, increase international competitiveness, and improve the sustainability of agricultural practices and environmental protection, in particular by using water more economically and combating desertification. To implement this programme, the share of the Moroccan Government's investment budget allocated to agriculture increased from 4% in 2008 to 13% in 2014 and 2015.
4.2. The three main components of the programme are: first, government investment in production infrastructure such as land development schemes and irrigation projects; second, incentives for private investment and exports; and third, programmes for the training of farmers in new techniques. The programme furthermore distinguishes between small-scale family farming in disadvantaged regions and modern, high value-added agriculture, and attempts to promote contractual relations between large and small farmers. These measures are being introduced against the backdrop of robust protection against foreign competition, intended to keep small farmers engaged in wheat growing and household-based livestock production in rural areas.
4.3. In implementing the PMV, two "agropoles" were created in Meknès and Berkane with a view to enhancing the value of agricultural production in these regions. They are public-private partnerships under which an agro-industrial park has been set up to host processing and support activities, logistics and service platforms, as well as research, quality control and training laboratories. To promote these projects among domestic and foreign investors, the Department of Agriculture is partnering with the planner-developer and other stakeholders to provide annual funding for promotional activities (including participation in international fairs). The Agricultural Development Agency (ADA) was set up in 2010 to oversee and implement the PMV. It possesses
228 Viewed at: http://www.agriculture.gov.ma.
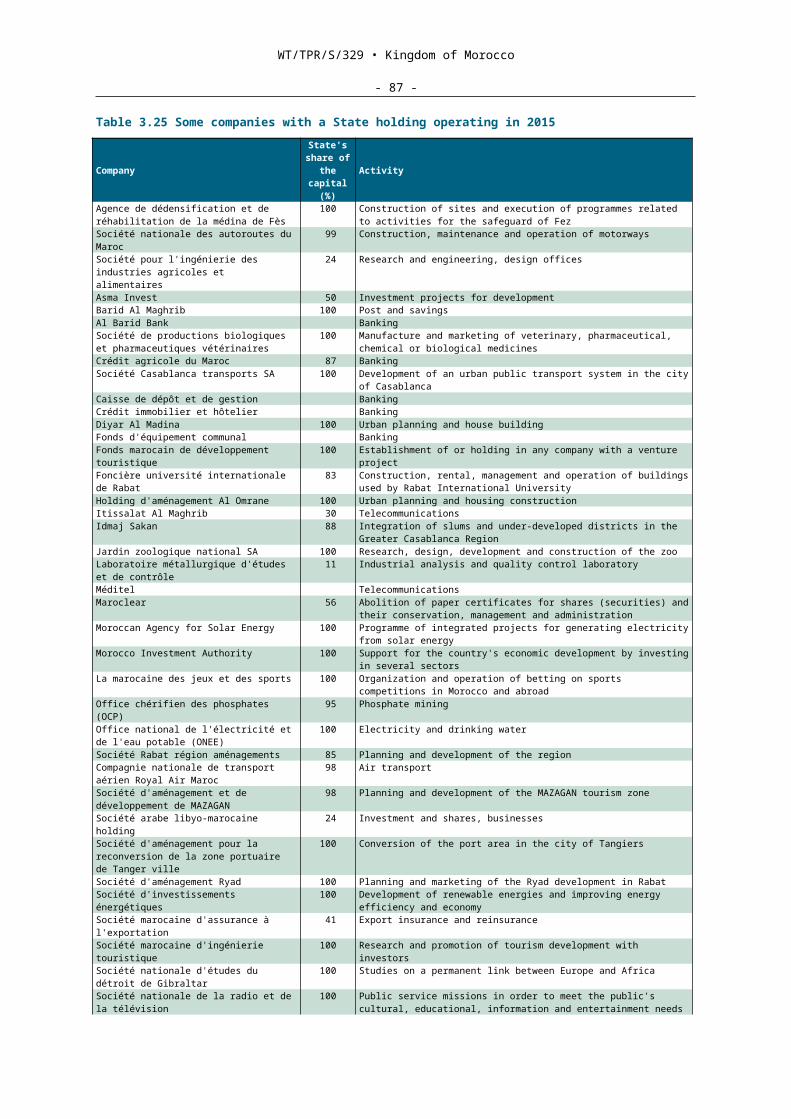
WT/TPR/S/329 • Kingdom of Morocco
- 87 -
the requisite information regarding these agriculture projects and acts as the contact point within the MAPM for private investors in the agricultural sector.229
4.4. Under Moroccan regulations, foreigners are not allowed to purchase agricultural land but may take out land leases. The ADA therefore uses tendering procedures to make state-owned farmlands available to Moroccan and foreign investors, whether legal or natural persons, in the form of long-term leases under public-private partnerships. This partnership programme entails reciprocal commitments on the part of the State and the investor.
4.5. The mid-term evaluation of the PMV undertaken by the Government in 2015 reveals that farmers' incomes have already increased substantially. Thanks to combined efforts in the agricultural and fisheries sectors, the number of people suffering from hunger declined from 4.6% of the population in 1990 to less than 0.5% as of 2011. According to the authorities, private-sector investment in agriculture doubled between 2008 and 2014.
4.1.3 Border measures
4.1. The authorities introduced an extensive tariff reform in 2013, reducing the average tariffs on agricultural imports by almost one third, from 44.5% in 2009 to 30% in 2015 (Table 3.4). This new policy strives to foster the competitiveness of agricultural products, one of the stated aims of the PMV. Another objective is to encourage local production using imported inputs, thereby replacing imports of finished goods, in order to narrow the trade deficit. The reform also places an emphasis on tariff escalation (depending on degree of processing - from inputs, through semi-finished to finished goods).
4.2. Despite the substantial tariff reductions introduced under this reform, tariff protection remains high in the agricultural sector, with rates of at least 30% for a total of 210 tariff lines (Table 4.4). The effect of these tariffs on Morocco's trade is to strongly deter imports of these products and push up their cost to consumers.
Table 4.30 MFN agricultural tariffs of at least 30%, 2009 and 2015
HS Description2009 2015 Imports in 2013
(US$'000)MFN(%)
MFN(%)
010410 Live sheep 153.3 101.3 0010420 Live goats 153.3 101.3 0020110 Beef, carcasses or half-carcasses 254.0 200.0 0020210 Frozen beef, carcasses or half-carcasses 254.0 200.0 43,598020230 - Boneless 194.9 152.5 10,360020312 Hams 49.0 49.0 2020410 Carcasses of lamb, fresh or chilled 304.0 200.0 0020450 - Meat of goats 304.0 200.0 0020500 Meat of horses, asses, mules or hinnies 254.0 200.0 0020622 -- Livers 254.0 136.7 0020711 Meat of poultry 116.0 100.0 0.4040110 Milk and cream 102.0 100.0 107040210 Powdered milk 93.1 87.8 12,490040310 - Yogurt 95.0 93.2 2.9040630 - Processed cheese, not grated or powdered 50.0 50.0 10,520040900 Natural honey 49.0 40.0 2,310070200 Tomatoes, fresh or chilled 49.0 40.0 0070310 - Onions and shallots 49.0 40.0 16070320 - Garlic 49.0 40.0 12,698070390 - Leeks and other alliaceous vegetables 49.0 40.0 1070610 - Carrots and turnips 49.0 40.0 6071120 - Olives 49.0 40.0 9080410 - Dates 49.0 40.0 78,290080440 - Avocados 49.0 40.0 6,391080520 - Mandarins; clementines, wilkings and similar citrus hybrids 49.0 40.0 1080810 - Apples 49.0 40.0 5,171080940 - Plums and sloes 49.0 40.0 63081010 - Strawberries 49.0 40.0 298081310 - Apricots 32.5 30.0 170081320 - Prunes 32.5 30.0 12081330 - Apples 32.5 30.0 0.1090230 - Black tea (fermented) and partly fermented tea 40.0 32.5 1,157100610 - Rice in the husk (paddy or rough) 94.2 34.2 1,418100620 - Husked (brown) rice 99.2 34.2 512
229 Viewed at: http://www.ada.gov.ma.
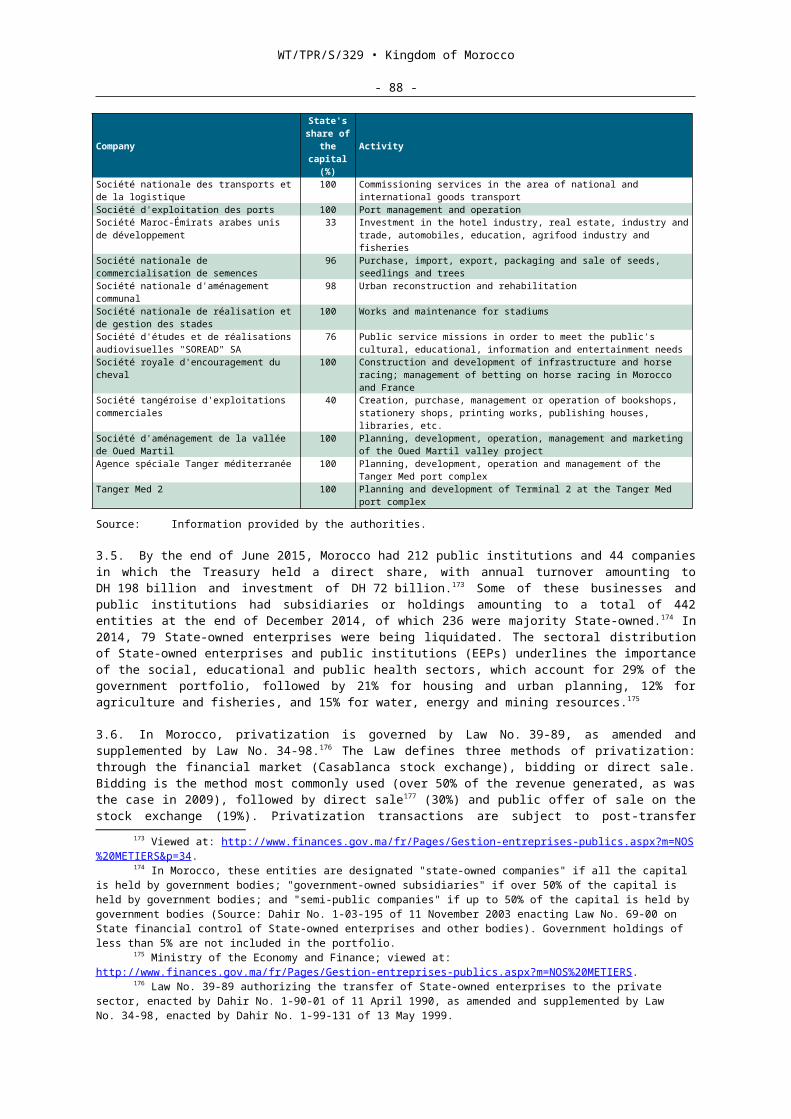
WT/TPR/S/329 • Kingdom of Morocco
- 88 -
HS Description2009 2015 Imports in 2013
(US$'000)MFN(%)
MFN(%)
100630 - Semi-milled or wholly milled rice, whether or not polished or glazed 156.0 50.0 9,790100640 - Broken rice 90.0 50.0 3110100 Wheat or meslin flour 69.5 68.0 103110311 Cereal meal (of wheat) 73.0 70.0 80110710 Coffee 40.0 40.0 3,085110812 -- Maize (corn) starch 32.5 30.0 1,505121010 - Hop cones, neither ground nor powdered nor in the form of pellets 32.5 30.0 0 150910 Olive oil 49.0 40.0 16,795151710 Margarine 50.0 50.0 207170191 Sugar, containing added flavouring or colouring matter 49.7 46.3 33190220 Pasta 49.0 33.8 27190240 - Couscous 67.0 47.5 4190510 Crispbread 49.0 40.0 0200520 - Potatoes 39.3 32.5 7,061200570 - Olives 49.0 40.0 334210320 - Tomato ketchup and other tomato sauces 49.0 40.0 2,433210330 - Mustard flour and meal and prepared mustard 49.0 32.5 791210500 Ice cream and other edible ice, whether or not containing cocoa 49.0 40.0 4,652220210 Mineral waters 49.0 40.0 1,518220300 Beer made from malt 49.0 49.0 2,715220410 Wine 49.0 49.0 4,756220710 Ethyl alcohol 49.0 49.0 768220820 - Spirits obtained by distilling grape wine or grape marc 10.0 49.0 377220830 - Whiskies 10.0 49.0 19,364220840 - Rum and other spirits obtained by distilling fermented sugar-cane
products 10.0 49.0 624
220860 - Vodka 10.0 49.0 10,358220900 Vinegar 49.0 40.0 1,888
Note: The tariffs are averaged at HS six-digit level, out-of-quota tariff rates only.Source: WTO Secretariat calculations based on data provided by the authorities; and data from the UNSD
Comtrade database.
4.3. Around 13.5% of Moroccan tariff lines relating to agrifood products are covered by tariff quotas (Table 4.5). The most recent notification in this regard (in 2014) covers the five years from 2008 to 2012.230 As the Table shows, the out-of-quota bound tariffs on some products have fallen below the in-quota bound tariffs since the period over which the former were reduced (1995-2004), as in-quota tariffs were not subject to the reduction requirement. Consequently, when submitting its 2012-2015 applied tariffs to the WTO Integrated Database (IDB), Morocco did not notify any in-quota tariffs, as tariff quotas are de facto no longer being applied, and only out-of-quota tariffs apply.
4.4. In volume terms, effective imports in 2012, the last year covered by the available data, exceeded the quotas specified by Morocco to the WTO in its schedule of commitments for most products. This notwithstanding, the average quota fill rates have been substantially below the volumes specified for poultry, sheep meat, rice and colza.231 For example, total rice imports into Morocco in 2013, all grain lengths considered, amounted to US$12 million.
4.5. As shown in Section 3 (Table 3.8), Morocco grants tariff preferences to some of its trading partners, with almost total exemption from customs duty on agricultural products originating in countries members of the Greater Arab Free Trade Area (GAFTA) (Section 2.3.3) and tariff reductions (average MFN rates of 16.3% and 10%) on imports from the EU and the United States under the respective agreements. Chart 4.1 shows the trend of agricultural trade: agrifood imports and exports from and to all groups of partners, preferential or not, are on the increase.
230 WTO document G/AG/N/MAR/39 of 6 May 2014; viewed at: https://docs.wto.org/dol2fe/Pages/SS/directdoc.aspx?filename=R:/G/AG/NMAR39.pdf.
231 In its Uruguay Round schedule of tariff commitments, Morocco also specified the following: In the event of a tariff quota indicated in Section I-B of the Schedule not being used up at the tariff rate indicated for that quota, Morocco would agree to reduce that rate to a level that would ensure full utilization of the quota.
WT/TPR/S/329 • Kingdom of Morocco
- 89 -
Table 4.31 Tariff quotas notified to the WTO, 2015
CodeDescription
(number of 10-digittariff lines)
Average applied tariff rate (%) WTO
2015 Average bound tariff ratea (%)
Volume of WTO-bound
quota('000 tonnes)
2012: Import volume notified
to the WTO ('000 tonnes)
In-q
uota
Out
-of-
quot
a
In-q
uota
Out
-of-
quot
a
Animal products0201 Meat of bovine animals (15) .. 200.0 82.5 239 5.0 4.70202 Meat of bovine animals (10) .. 181.0 82.5 2390204 Meat of sheep or goats (17) .. 200.0 82.5 289 3.3 0.00207 Meat of poultry (39) .. 93.7 62.5 96 6.4 0.8040120 Milk (5) .. 100.0 96 87 38.6 51.6
Cereals100190 Common wheat (6) .. 6.8 144 75 1,555.3 3,285.11003 Barley (4) .. 10.6 113 66 2.8 551.31005 Maize (corn) (3) .. 2.5 122 53 204.4 1,781.31006 Rice (9) .. 39.4 177 148 7.2 21.41007 Sorghum (2) .. 2.5 165 100 9.2 0.71201 Soya beans (3) .. 2.5 111 80 17.7 99.71205 Rape or colza seeds (12) .. 2.5 146 113 4.4 0.0
Oils 196.1 434.01507 Oil (2) .. 13.8 215 1581508 Oil (2) .. 13.8 215 1581509 Oil (13) .. 40.0 215 341510 Oil (7) .. 40.0 215 341512 Oil (4) .. 13.8 215 1581513 Oil (4) .. 13.8 215 1581514 Oil (4) .. 13.8 215 1581515 Oil (13) .. 11.2 215 1171516 Oil (20) .. 11.5 215 1601517 Oil (12) .. 20.0 215 2361518 Oil (3) .. 10.0 215 341701 Sugar (32) .. 41.5 168 168 274.3 1,002.6
Oil-cake 1.6 171.5230641 Colza seed oil-cake (5) .. 2.5 72 72.0230649 Colza seed oil-cake (5) .. 2.5 72 72.0230610 Cottonseed oil-cake (2) .. 2.5 55 55.0230630 Sunflower seed oil-cake (2) .. 2.5 62 62.0
.. Not available.a The final bound rates are taken from the WTO's Consolidated Tariff Schedules (CTS) database
(HS 2002). Source: WTO Secretariat.
WT/TPR/S/329 • Kingdom of Morocco
- 90 -
Chart 4.11 Trade in agricultural products, 2008-2014
0
500
1,000
1,500
2,000
2,500
3,000
2008 2009 2010 2011 2012 2013 2014
Graphique 4. [Ag. trade]: Le commerce de l'agriculture, 2008-14(US$ million)
0
1,000
2,000
3,000
4,000
5,000
6,000
7,000
2008 2009 2010 2011 2012 2013 2014
Calculs du Secrétariat de l'OMC basés sur les données issues de la base de dnnées Comtrade de la DSNU et les données fournies par les autorités du Maroc pour 2014.
Source:Agriculture se réfère à l'agriculture de l'OMC.Note:
Exports
Imports
EU28 GAFTA United States Rest of the world
Note: Agriculture by WTO definition.Source: WTO Secretariat calculations based on data from the UNSD Comtrade database and data provided by
the Moroccan authorities for 2014.
4.1.4 Support for production and export
4.1. The Committee on Agriculture has received just one notification from Morocco regarding domestic support for agriculture since the country's previous TPR; it dates from 2012 and covers the years 2003-2007.232 Since 1969, when the first Agricultural Investment Code was introduced233, the Moroccan Government has been using a broad range of measures to encourage agricultural investment and production. State aid may now take several forms, such as subsidies (financial aid) or long-, medium- or short-term concessional loans; or technical and material assistance provided free of cost by government agencies (Table 4.6). These forms of support come in addition to large-scale investment in infrastructure such as irrigation programmes and land development.
Table 4.32 Overview of agricultural activities eligible for state financial aid, 2015Item or activity Type of aidProviding farms with new tractors, pedestrian-controlled tractors and agricultural equipment
Subsidy granted as a percentage of the investment cost, with a cap depending on the nature of the equipment
Hydro-agricultural developments and land improvements for farms (well digging, irrigation equipment)
Subsidy for the cost of the irrigation component, with a cap on the overall amount of the subsidy per hectare equipped
Stepping up livestock production, genetic improvement of the bovine, sheep, goat and camel population
Subsidy/head
Production of selected queen bees Subsidy/beehiveBuilding and equipping of cooperative milk collection centres Cost subsidy, with a maximum subsidy per componentAnti-insect nets to protect market garden crops grown in greenhouses
Subsidy for the purchase cost of the nets, with a ceiling per hectare equipped
Olive and almond seedlings, and certified or common fig, carob, pistachio, walnut, pomegranate, cherry and medlar seedlings
Subsidy per hectare planted with these species
232 WTO document G/AG/N/MAR/37; viewed at: https://docs.wto.org/dol2fe/Pages/SS/directdoc.aspx?filename=R:/G/AG/NMAR37.pdf.
233 Dahir No. 1-69-25 of 25 July 1969 on the Agricultural Investment Code, as amended in 2001 by Law No. 26-00; viewed at: http://faolex.fao.org/cgi-bin/faolex.exe?rec_id=001936&database=faolex&search_type=link&table=result&lang=fra&format_name=@FRALL.
WT/TPR/S/329 • Kingdom of Morocco
- 91 -
Item or activity Type of aidForestry for wood production: afforestation, restocking and reforestation
Subsidy per hectare
Use and storage of certified cereal seed Subsidy per quintal Use of sugar beet monogerm seed Subsidy per quintal purchasedConstruction and equipping of cold storage units for agricultural products and seed storage units
Aid based on a subsidy rate for the investment cost, with a ceiling for each type of unit
Laboratory analyses Subsidy covering 50% of the cost, with ceilings per type of analysis
Diversification of fresh citrus fruit exports Subsidy per tonne exported
Source: Information provided by the MAPM.
4.2. About half of the agricultural investment budget is allocated to irrigation. Permanent irrigation covers a developed area of some 1.5 million hectares, and the situation has not changed significantly since 2008. The total investment budget allocated by the State to the irrigation sector for the period 2008-2014 was on the order of DH 22 billion, or an average of DH 3.2 billion per year. These funds have gone mainly toward the modernization, refurbishment or expansion of irrigation systems and the promotion of water-saving irrigation techniques. Although irrigated agriculture covers a mere 16% of arable land, it accounts for almost 50% of agricultural value added in an average year, though its contribution could be as much as 70% in years of drought. Irrigated areas produce 75% of the volume of agricultural exports and provide almost 40% of rural employment.
4.3. The National Irrigation Water Saving Programme (PNEEI 2008-2020) provides for the introduction of new and efficient irrigation technologies, mainly through localized irrigation, at the initiative of private and/or state farms (Table 4.6). The Irrigation Expansion Programme (PEI 2008-2020) will entail expanding irrigation to almost 160,000 hectares in order to optimize the use of the water resources harnessed by means of dams already built or planned. In addition to equipping collective irrigation networks, the programme is also expected to encourage the adoption of localized irrigation techniques by farmers or their organizations (such as associations of irrigators and cooperatives). This programme receives government support through three main instruments: (i) investment in collective irrigation networks; (ii) State financial aid for water-saving irrigation techniques and the relevant support; and (iii) building the capacity of associations of irrigators and the Regional Offices for Agricultural Development (ORMVA). Imports of irrigation equipment are exempt from VAT.234
4.4. State financial aid is also provided under the Agriculture Development Fund (FDA) through the Moroccan Agricultural Credit Bank (CAM), in which the State holds a 51% stake. The CAM grants seasonal loans as well as medium- and long-term credit for the equipment and modernization of farms, at rates of about 6% (or approximately half the market rate, Section 1.2) for short-, medium- and long-term loans. In 2011, FDA assistance was just over DH 2.5 billion, while total turnover for the agricultural sector was DH 150 billion.
4.5. Comprehensive insurance covering the main weather hazards to the agricultural sector has been in place since 2011 under a public-private partnership with the Agricultural Mutual Insurance Company (MAMDA). In 2015, 17% of the total area under cereal and pulse cultivation in Morocco was insured. The insurance covers cereal, pulse and oilseed harvests against drought, hail, frost, excess water, high winds and sand. The State helps to finance this product by subsidizing farmers' premiums. In 2013-2014, the Department of Agriculture launched a second guarantee programme specifically for fruit farming (against hail, frost, excess water, high temperatures, chergui (desert wind) and high winds).
4.6. As indicated in Section 3.1.3.5, sales of agricultural products are largely exempt from VAT, with no right of deduction. This exemption together with the two VAT regimes - an "internal" regime and an "import" regime - raises national treatment problems bound up with the levying of VAT on food products (Table 3.7).
4.7. The sector was also exempt from all taxation (both corporation and income tax) between 2001 and 2015. Income and corporation tax were phased in for large agricultural undertakings (with a turnover in excess of DH 5 million) under the 2015 Finance Law, in accordance with the ordinary law regime. For the first two years, only farms with a turnover of more than DH 35 million
234 Decree No. 2-83-605 of 29 July 1983.
WT/TPR/S/329 • Kingdom of Morocco
- 92 -
will be affected. Upon expiry of the transition period (end-2019), all agricultural enterprises with a turnover in excess of DH 5 million will be subject to income and corporation tax.
4.8. Morocco has notified the WTO of export subsidies for fruit, vegetables, cut flowers and ornamental plants as well as olive oil, currently aimed at reducing the export freight cost of these products. The latest available notification covers the years 2008 to 2011.235 According to this notification, the State paid the equivalent of US$5 million in olive oil export subsidies in 2011 for example. The products and destinations eligible for these subsidies are announced by decree on an ad hoc basis.
4.1.5 Developments in some subsectors
4.1.5.1 Cereals and their products
4.1. Morocco is a major producer of cereals, which are grown on most farms. The main crops are common wheat and barley, given its suitability for arid zones and its use in the livestock sector. Cereal production plays an important economic role from several points of view: cereals account for almost one third of agricultural value added, one quarter of household spending on food, and meet 30% of the demand for fodder. However, considering their low value added, the PMV is aimed at the gradual changeover from cereal farming to higher value added crops such as fruit farming.
4.2. According to the authorities, cereals are effectively marketed in Morocco exclusively by the private sector. The storage agencies and mills that buy cereals are free to draw their supplies either from the domestic market or through imports236; however, there are MFN tariffs, as high as 130% in some cases, which vary over time and according to import prices (Section 3.1.3), to guide their choices.237 Depending on the volume of the domestic harvest and the level of global common wheat prices, for example, the State may increase, reduce or suspend customs duties in order to regulate the domestic market. Some moderation has nonetheless been observed in the extent of tariff variations since the end of 2011.
4.3. The State subsidizes the price of a quota of common wheat flour for the lowest-income communes in order to stabilize bread prices. For the production of this quota of 0.75 million tonnes per annum, storage agencies receive from or pay to the State a wheat price differential in relation to a predetermined mill entry price of DH 2,588/tonne. The State pays the mills the difference between a calculated cost price for this flour and the predetermined sale price. The cost of transporting common wheat is also borne by the State according to the rates charged by the National Transport and Logistics Company (SNTL). During the 2008-2014 period, the average annual global cost of the compensation for domestic flour was DH 1.5 billion.
4.1.5.2 Oilseeds
4.1. The Government aims to increase the area under oilseed cultivation (mainly sunflower and colza as well as groundnuts), in order to raise the level of self -sufficiency in domestic oilseed production, which rose from 18% in 2008 to almost 22% in 2013; this explains the particularly high tariffs on these products (Table 4.7). Customs duty on crude oils is 2.5% (Table 4.7).
Table 4.33 Customs duty on oil imports, by main supplier, 2009 and 2015
HS Description
2009 2015
Appl
ied
MFN
ra
te
Uni
ted
Stat
es
pref
eren
ce
Euro
pean
U
nion
pr
efer
ence
MFN
rat
e
Uni
ted
Stat
es
pref
eren
ce
Euro
pean
U
nion
pr
efer
ence
All 24.0 9.7 23.8 21.3 0.0 15.21507 Soya-bean oil and its fractions 13.8 7.5 13.8 13.8 0.0 7.51508 Groundnut oil and its fractions 13.8 7.5 13.8 13.8 0.0 0.01509 Olive oil and its fractions 49.0 10.4 49.0 40.0 0.0 40.0
235 WTO document G/AG/N/MAR/40 of 6 May 2014; viewed at: https://docs.wto.org/dol2fe/Pages/SS/directdoc.aspx?filename=R:/G/AG/NMAR40.pdf.
236 These operators must nonetheless have been declared to the National Interprofessional Cereals and Pulses Board (ONICL), which monitors the country's cereal supply trends.
237 Viewed at: http://www.agriculture.gov.ma/pages/actualites/campagne-de-commercialisation-ble-tendre-2015-le-prix-de-reference-fixe-270-dh-quintal.
WT/TPR/S/329 • Kingdom of Morocco
- 93 -
HS Description
2009 2015
Appl
ied
MFN
ra
te
Uni
ted
Stat
es
pref
eren
ce
Euro
pean
U
nion
pr
efer
ence
MFN
rat
e
Uni
ted
Stat
es
pref
eren
ce
Euro
pean
U
nion
pr
efer
ence
1511 Palm oil and its fractions 13.8 7.5 13.8 13.8 0.0 0.01512 Sunflower-seed, safflower or cotton-seed oil 13.8 7.5 13.8 13.8 0.0 2.51513 Coconut (copra), palm kernel or babassu oil 13.8 7.5 13.8 13.8 0.0 0.01514 Rape, colza or mustard oil 13.8 7.5 13.1 13.8 0.0 6.31515 Other vegetable fats and oils (including jojoba oil) 11.2 6.0 10.6 11.2 0.2 0.0151620 Vegetable fats and oils and their fractions 26.2 16.2 26.2 12.5 0.0 8.8
Source: WTO Secretariat calculations based on data provided by the authorities.
4.1.5.3 Sugar
4.1. A flat-rate subsidy of DH 2,847/tonne is granted to refineries so as to maintain the sale price of DH 4.4/kg for granulated sugar and DH 5.3/kg for sugar cubes. The annual average of this subsidy in 2008-2014 was DH 3.6 billion. The Compensation Fund pays this consumer subsidy. Variable customs duties are levied on sugar, with a base rate of 35% applied to an administratively determined import value of DH 3,500/tonne; if the customs value is below this threshold, an additional duty of 123% is applied to the difference between this amount and the declared value. The ad valorem equivalent of the duty, which is in reverse proportion to the import price, may range from the constant rate (minimum) to very high rates (Table 3.2). However, despite these high rates of duty, quantities of up to 1 million tonnes were imported in 2012.
4.1.5.4 Carbonated beverages, wine and cider
4.1. The market for non-alcoholic beverages comprises mainly beverage-producing and bottling companies, whose brands belong to the two major multinationals Coca-Cola and Pepsi Co. The bottling industry is protected against foreign competition by means of very high customs duties overall; yet there has been substantial liberalization since 2009 in favour of the United States and the European Union for these products (Table 4.8). Industrial beverage producers are required to refund the subsidy granted on the sugar they use as input.
4.2. Alcoholic beverages are subject to a multiplicity of internal duties and taxes, in addition to customs duty (Table 4.9).
Table 4.34 Customs duty on beverages, by main supplier, 2009 and 2015(%)
HS Description2009 2015
Applied MFN rate
United States
preference
European Union
preferenceApplied
MFN rateUnited States
preference
European Union
preference2009 Fruit juice 38.6 25.2 38.6 30.0 0.0 24.32201 Mineral waters 47.2 28.8 14.2 25.0 0.0 0.02202 Sweetened mineral waters 49.0 30.0 14.7 40.0 0.0 0.02203 Beer made from malt 49.0 32.2 21.7 49.0 5.6 34.32204 Wine of fresh grapes 49.0 31.2 35.8 49.0 0.0 39.02205 Vermouth 49.0 30.0 14.7 49.0 0.0 0.02206 Other fermented beverages 49.0 30.0 49.0 49.0 0.0 34.32207 Ethyl alcohol > 80% vol. 49.0 30.0 14.7 49.0 0.0 0.02208 Ethyl alcohol < 80% vol. 10.0 0.0 0.0 49.0 0.0 0.0Source: WTO Secretariat.Table 4.35 Internal taxes on domestically produced or imported alcoholic beverages, 2008 and 2015Tax 2008 2015Internal consumption tax (TIC)
Beer 550 DH/hl 900 DH/hlOrdinary wine 260 DH/hl 700 DH/hlOther wine (AOC, sparkling, old, or selected) 300 DH/hl ..Alcohol contained in vermouth and spirits 7,000 DH/hl pure alcohol 20,000 DH/hl pure alcohol
Tax for financing economic promotion 0.25% on c.i.f. value 0.25% on c.i.f. value
WT/TPR/S/329 • Kingdom of Morocco
- 94 -
Tax 2008 2015Parafiscal tax on wine and beer 5 DH/hl 5 DH/hlSpecific VAT on domestic and imported products 100 DH/hl 100 DH/hlVAT on imports only 20% 20%
.. Not available.Source: Customs and Excise Administration (ADII), viewed at: http://www.douane.gov.ma/adil.
4.1.5.5 Livestock and livestock products
4.1. The tariff rates on imports of beef, sheep and goat meat were reduced by one fifth in 2013 (Table 4.4), but were still so high in 2015 (200%) that no commercial importation is profitable. Only imports from Arab countries enjoy duty-free entry under preferential agreements. Imports of sheep or goat meat from the United States are subject to a preferential tariff of 146%. In practice, there are only limited imports of beef in circuits exclusively serving luxury restaurants.
4.2. An agreement was concluded in October 2012 in the form of an exchange of letters between the EU and Morocco regarding, inter alia, European exports to Morocco of live animals, "high quality" beef, poultry meat and prepared meat products, which must meet all the prerequisites set out in specifications agreed by both parties. There is a similar agreement with the United States. These meat imports may only be sold to four- and five-star hotels and to graded restaurants and may not be sold directly to the public.
4.3. Exports of animal products are negligible, with the exception of processed cheese and guts (Table 4.3).
4.4. Improving the traceability and quality of domestic cattle is a government priority. State aid in this sector goes towards the genetic improvement of local breeds and support for breeders, with the aim of improving and expanding production (Table 4.6).238
4.5. Poultry farming is regarded as an industrial activity and consequently did not benefit from the tax and customs concessions available to the agricultural sector until 2015.239 The average coverage of domestic demand for poultry and eggs by Moroccan production remained close to 100% for the period 2008-2015. Production has been expanding at a rate of 3.5% per annum since 2009, as it is protected from foreign competition by tariffs of 100%.
4.6. Milk production was estimated at 2.4 billion litres in 2014, up from the 1.5 billion litres recorded in 2007. This covers 90% of domestic demand for milk and dairy produce, the rest being covered by imports mainly of powdered milk, cheese and butter. Milk consumption was estimated at 66 litre-of-milk equivalents per capita in 2013. The MFN tariff rates range from 50% to 100% on milk, with preferential rates ranging from full exemption to 71%.
4.7. Honey production was 4,500 tonnes in 2013 (3,500 tonnes in the industrial sector and 1,000 tonnes in the traditional sector). The bee-keeping modernization programme has continued since the previous TPR with 4,500 modern beehives, together with technical equipment, being distributed to bee-keepers organized into 25 cooperatives. This operation is intended to help improve incomes and combat poverty among small-scale bee-keepers. Customs duty on honey has been reduced from 49% to 40%.
4.2 Fishery and aquaculture products
4.1. Since the last TPR, the fisheries sector in Morocco has been the focus of a new development strategy for the period up to 2020, known as Halieutis and aimed at modernizing the sector and improving its competitiveness, as well as ensuring the sustainability of the resource. Foreign vessels are authorized to fish in Moroccan territorial waters only within the framework of international fisheries or charter agreements, insofar as the authorities consider that the state of the resource allows. Moreover, the Moroccan authorities consider that fisheries agreements are not trade agreements.
238 Viewed at: http://www.anoc.ma.239 Law No. 49-99 of June 2002 and Decree No. 2-04-684 of 27 December 2004 on the sanitary protection
of poultry farms and control of the production and marketing of poultry products.
WT/TPR/S/329 • Kingdom of Morocco
- 95 -
1.1.1 Overview of the market and the regulations
4.2. Morocco has a 3,500 km-long coastline and an exclusive economic zone (ZEE) of 1.1 million km2, with an annual exploitable fishing potential estimated by the authorities at 1.5 million tonnes renewable. Fishery production has increased strongly, from its level of around 1.1 million tonnes in 2010 (Chart 4.2) to 1.4 million tonnes in 2014. Fishing in the Moroccan ZEE is intensive, raising questions about the sustainability of the resource. Morocco is one of Africa's largest fishery producers and 18th globally. On the other hand, with an output amounting to 468 tonnes (441 tonnes in 2007), aquaculture production remains at a low level.
4.3. A new Decree No. 2-15-285 of 10 April 2015 breaks down fishery activities as follows:
industrial fishing is carried out by commercial vessels with a catch freezing system, or with a gross tonnage (GT) of at least 150 and using refrigerated sea water (RSW) for preserving the catch;
inshore fishing is carried out by (commercial fishing) vessels with a gross tonnage of between 3 and 150, using refrigeration;
small-scale fishing is carried out by vessels with a gross tonnage of less than 3.
4.4. Production consists mainly of pelagic fish, essentially sardines for canning, representing nearly 80% of the total volume produced, and benthic species. The fishery product processing industries account for nearly half of total agrifood exports. The main markets are the EU (65% of export earnings), but also Africa (14%), Asia (9%), and the United States (5%). The figures do not show any marked upward trend (Table 4.10). The sector accounts for 10% of Moroccan goods exports. Fishing's share of GDP is quite small, about 1%, and has shown little variation (Table 1.1).
Chart 4.12 Fishery production, 2009-2014
0100200300400500600700800900
1,0001,1001,2001,3001,4001,500
2009 2010 2011 2012 2013 2014
Inshore and small-scale High sea Other activities
0
200
400
600
800
1,000
1,200
2009 2010 2011 2012 2013 2014
('000 tonnes) (US$ million)
a b c
a Including landings by Community vessels in natural ports.b Including chartered refrigerated sea water (RSW) vessels.c Other activities include: tuna fishing, ,marine algae (dry), marine aquaculture, coral and sea-urchins.Note: The production figures for 2014 are provisional for high sea-fishing and not yet complete for other
activities.Source: Information provided by the authorities.

WT/TPR/S/329 • Kingdom of Morocco
- 96 -
Table 4.36 Fishery production, 2009-2014
2009 2010 2011 2012 2013 2014aRate of growth
(2009-2014, p.a.)
ProductionVolume ('000 tonnes)Fishery production 1,161 1,138 957 1,171 1,246 1,354 3.8
Inshore and small-scaleb 884 894 675 848 855 982 3.0High seac 264 234 275 316 383 368 6.9Other activitiesd 13 9 7 7 7 4 -21.5
Value (US$ million)Fishery production 889 791 984 907 1 046 1 144 5.2
Inshore and small-scaleb 500 471 578 551 574 642 5.4High seac 356 296 382 331 449 478 6.0Other activitiesd 32 24 24 25 24 19 -11.7
ExportsVolume ('000 tonnes)Total 522 512 376 491 545 590 2.5
Frozen 210 186 145 196 258 218 0.8Preserved 126 136 96 124 130 145 2.5Flour 94 97 69 96 93 142 8.8Oil 39 42 19 26 17 40 0.1Fresh or live 30 26 23 23 22 21 -6.7Semi-preserved 17 18 19 19 18 16 0.9Algae 5 5 2 4 4 3 -9.8PSDSBe 1 1 2 2 2 2 7.7Agar-agar 1 1 1 2 1 1 -0.4Coral 0 0 0 0 0 0 5.9
Value (US$ million)Total 1,542 1,571 1,554 1,787 1,884 1,771 2.8
Frozen 603 574 666 697 771 680 2.4Preserved 457 475 379 516 545 505 2.0Fresh or live 184 187 213 202 207 198 1.5Flour 91 122 79 110 117 141 9.1Semi-preserved 144 138 151 144 156 135 -1.2Oil 29 41 31 47 36 67 18.7Agar-agar 20 23 21 48 29 24 3.2PSDSBe 5 2 7 6 7 10 17.1Algae 8 10 7 15 14 10 2.9Coral 0 1 1 1 2 1 18.7
ImportsVolume ('000 tonnes)Total 58 54 61 52 54 74 5.0
Fresh and live 18 18 22 21 20 25 7.0Frozen 24 24 30 25 30 37 9.0
Value (US$ million)Total 119 125 148 150 171 197 11.0
Frozen 41 63 76 77 93 93 18.0Fresh and live 33 35 48 58 61 66 15.0Preserved 38 12 6 2 5 13 -20.0PSDSBe 6 12 16 8 7 14 20.0
a For trade, the figures relate to the first 11 months of 2014.b Including landings by Community vessels in national ports.c Including chartered RSWs.d Other activities = tuna fishing, marine algae (dry), marine aquaculture, coral and sea-urchins.e Products salted, dried, smoked or in brine.Source: Information provided by the authorities.
4.5. Catches made in Moroccan territorial waters by foreign vessels and landed in Moroccan ports are considered to be of Moroccan origin. If made outside territorial waters, they count as imports. Imports are subject to duties ranging from 2.5% to 40%, whose levels have hardly changed during the period except where imports from the EU are concerned (Table 4.11). Molluscs and crustaceans were reclassified in Chapter 03 of the HS when it was revised in 2012.
Table 4.37 Tariffs on imported fishery products, 2009 and 2015
HS Product2009 2015
Applied MFN EU USA Applied
MFN EU USA0301 Live fish 10.0 10.0 2.0 10.0 2.2 0.00302 Fish, fresh or chilled, excluding fish fillets and other fish
meat of heading 03.0410.0 10.0 0.9 10.0 3.5 0.0
0303 Fish, frozen 10.0 10.0 0.8 10.0 4.3 0.00304 Fish fillets and other fish meat 25.0 25.0 4.0 10.0 7.0 0.0
WT/TPR/S/329 • Kingdom of Morocco
- 97 -
HS Product2009 2015
Applied MFN EU USA Applied
MFN EU USA0305 Fish, dried, salted or in brine; smoked fish 12.8 12.8 0.0 10.0 3.9 0.00306 Crustaceans, whether in shell or not, live, fresh, chilled 14.8 14.8 0.0 19.8 13.6 0.00307 Molluscs, whether in shell or not, live, fresh 10.0 10.0 0.4 16.8 9.5 0.00308 Other aquatic invertebrates N/A N/A N/A 18.6 10.0 0.00508 Coral and similar materials 4.4 0.0 4.4 2.5 0.0 0.0051191 Animal products unfit for human consumption 26.3 26.3 21.8 20.7 0.0 14.8150410.20 Fats and oils and their fractions, of fish 33.1 33.1 33.1 31.4 13.2 0.01603 Extracts and juices of meat, fish or crustaceans 49.0 49.0 36.7 16.0 11.9 11.31604 Prepared or preserved fish 50.0 50.0 12.6 40.0 35.0 0.01605 Crustaceans, molluscs, prepared or preserved 50.0 50.0 3.7 40.0 35.0 0.0230120 Flours, meals and pellets 25.0 25.0 5.0 25.0 17.5 ..
.. Not available.N/A Not applicable.Note: 2009 tariffs based on HS 2002; 2015 tariffs based on HS 2012.Source: WTO Secretariat calculations, based on data provided by the authorities.
4.6. The Ministry of Agriculture and Marine Fisheries, through its Marine Fisheries Department, is responsible for the formulation and implementation of government marine fisheries and marine aquaculture policy.240 Its subordinate agencies are: the National Fisheries Board (ONP) and the National Fisheries Research Institute (INRH) and, since 2011, the National Agency for the Development of Aquaculture (ANDA, see below).241 The task of the ONP is to develop small-scale and inshore fishing and to organize the first-sale marketing of sea fishery products.242 That of the INRH is to carry out research, studies, experiments and investigations at sea and on shore with the aim of assessing and monitoring stocks, improving them, rationalizing the management of fish and aquaculture resources, and upgrading the industry.243244,
4.7. The new Halieutis development strategy for the period up to 2020 has five fixed objectives: improvement of the fisheries on the basis of catch quotas; growth of aquaculture; development of the landing infrastructure; better fishing port management; and improvements in the competitiveness of seafood products. Halieutis aims to triple fisheries GDP by 2020, to increase fish consumption in Morocco to 16 kg/per capita/year as compared with 10 kg in 2015, and to achieve a production level of 1.66 million tonnes and exports with a value of US$3.1 billion.
4.8. Since the last TPR in 2009, additions have been made to the sector's regulatory framework to take account of strategic priorities such as the preservation of resources, the strengthening of the surveillance system for effectively combating IUU fishing245, in particular by means of a satellite system, and the development of aquaculture.
4.9. Several incentives are reserved for Moroccan-registered fishing companies. Under the March 1919 Fishing Code, these companies must be constituted under Moroccan law and have a chairman, as well as a majority of members of the board of directors, of Moroccan nationality. Fishing boats may be deemed to be of Moroccan nationality if their port of registry is in Morocco, if they customarily land their catch in Morocco, and if they are at least three-quarters-owned by Moroccan citizens. Nationality conditions also apply to the crews of fishing vessels. Thus, the proportion of sailors of Moroccan nationality who must sail on board Moroccan-flag ships is 100% of the crew (including the captain or skipper and other ship's officers, if any) in the case of fishing vessels operating in the ZEE; and eight tenths of the crew in the case of fishing vessels operating on the high seas. In the case of fishing vessels operating in the exclusive economic zone of a third State, the proportion is fixed in accordance with the provisions of the bilateral agreement between Morocco and the State in question, or the relevant regulations of that State, as the case may be.
4.10. The following tax incentives are reserved for domestic sea-fishing; foreign vessels that land their catches are not eligible:
240 Viewed at: http://www.mpm.gov.ma.241 Dahir No. 1-10-201 of 18 February 2011 enacting Law No. 52-09 creating the ANDA (OJ No. 5922
of 3/3/2011) and its Implementing Decree No. 2-10-598 of 11 April 2011 (OJ No. 5940 of 5 May 2011) as supplemented by Decree No. 2-12-269 of 30 October 2012 (OJ No. 6100 of 15 November 2012).
242 Law No. 49-95 amending and supplementing Dahir No. 1-69-45 relating to the ONP.243 Law No. 48-95 creating the INRH.244 Dahir No. 1-10-201 of 18 February 2011 enacting Law No. 52-09 creating the ANDA.245 Law No. 15-12 on the prevention and repression of illegal, unreported and unregulated (IUU) fishing
(OJ No. 6262 of 5 June 2014).

WT/TPR/S/329 • Kingdom of Morocco
- 98 -
hydrocarbons for fuelling sea-going vessels are exempt from VAT at importation, as are vessels used for sea-fishing; fishing gear and nets; salted cod's roe and bait intended for use by fishing boats; and aircraft for locating shoals of fish;
Moroccan fishery products, fresh, frozen, whole or in pieces, are exempt from VAT (without right of deduction);
fishing gear and nets for sea-fishing professionals are subject to the reduced 10% rate of internal VAT, with right of deduction;
the sale, repair and conversion of seagoing vessels are exempt from internal VAT, as are sales of products intended for incorporation in the vessels.246
4.11. Moroccan fishing companies are required to land all their catch in Morocco before exporting it and repatriating all their export earnings.
4.2.2 Fishing by foreign enterprises
4.1. Morocco has been a party to the United Nations Convention on the Law of the Sea since 2007. The authorities have said that they attach special importance to international co-operation in the area of fisheries. Fishing by foreign fishing enterprises is possible only within the framework of a fisheries agreement resulting from negotiations concerning the state of the resources, the nature of the fishing gear, the fishing zones, the species targeted, and the country's economic and social development strategy. At present, there are three international fisheries agreements in force in Morocco. It has not been possible to view the content of these agreements on an official website.
1.1.1.1 Morocco-EU fisheries agreement
4.2. The fourth fisheries agreement between Morocco and the EU was signed in 2005, entered into force in 2007, and was extended in 2013; the first such agreement was signed in 1995.247 The fishing opportunities may be reviewed by a Joint Committee by mutual agreement, provided that the review is designed to ensure the durability of Moroccan fishery resources.
4.3. In 2015, the agreement provided for fishing opportunities for some 100 EU boats, without maximum catch volumes other than for small pelagics. However, some fishing zones and some fisheries are excluded from the agreement because of the exploitation of stocks. In consideration, the EU makes an annual financial contribution of €40 million, part of which is earmarked for implementing the sectoral development strategy. Fishing licence fees are also owed, together with other fees calculated for each vessel on the basis of fishing volumes. Thus, in the case of tuna vessels, these other fees are fixed at €35 per tonne fished in the Moroccan fishing zone. In 2015, the price of a tonne of tuna on world markets fluctuated around €1,500. The vessels must embark Moroccan seamen and land part (at least 28%) of their catch in Moroccan ports.
4.2.2.2 Fisheries agreement with the Russian Federation
4.1. The sixth fisheries agreement with the Russian Federation is intended to run for 4 years as from 14 February 2013. It has not been possible to view a copy of the agreement. According to press reports, the exercise of fishing activities by Russian vessels in the Moroccan fishing zone is subject to the payment by the Russian party of an annual lump sum of US$5 million in financial compensation and to the payment by the Russian ship owners of fishing licence fees and other annual fees. It appears that a total of ten Russian trawlers have been authorized to fish under the agreement, subject to the presence of at least 16 Moroccan fishermen on board, as compared with 14 under the previous agreement. Moreover, the vessels must have a Moroccan scientific observer on board, to verify compliance with the terms of the agreement. A permanent satellite positioning system follows the movements of each vessel. A total catch quota of 100,000 tonnes of small pelagics, mainly mackerel (65%), is understood to have been specified for the first year.
246 Decree No. 2-06-574 of 31 December 2006.247 Protocol between the European Union and the Kingdom of Morocco setting out the fishing
opportunities and financial contribution provided for in the Fisheries Partnership Agreement between the European Union and the Kingdom of Morocco, Official Journal of the European Union; viewed at: http://eur-lex.europa.eu/legal-content/FR/TXT/PDF/?uri=CELEX:22013A1207(01)&rid=1.
WT/TPR/S/329 • Kingdom of Morocco
- 99 -
4.2.2.3 Fisheries agreement with Japan
4.1. The agreement with Japan offers tuna fishing opportunities to a maximum of 15 tuna long-liners. There is no provision for a financial consideration. The authorized vessels pay fishing licence fees, other fees based on the catch (US$28/tonne), and observer embarkation expenses. The fishing conditions under this agreement are reviewed annually.
4.2.3 Preservation and sustainable management of fishery resources
4.1. The Government's stated strategy for the fisheries sector is the sustainable management and exploitation of fishery resources. In fact, however, the Moroccan economic zone is subject to intensive fishing. Within the WTO, Morocco has submitted a proposal in the context of the rules negotiations on fisheries subsidies.248 According to this communication, the Government considers that special and differential treatment should permit developing country Members to be exempt from any ban on subsidies.
4.3 Mining
4.3.1 Overview
4.1. Morocco is the world's leading exporter and third-ranking producer of crude phosphate, and its second-ranking exporter of solid fertilizer, with 21% of the global market. During the period 2008-2013, the mining sector contributed 22-30% to the value of national exports and 10% of GDP. For comparison, the contribution of the extractive subsector to GDP fluctuated between 7.3% in 2008, 2.6% in 2009, 5.6% in 2011 and 3.9% in 2013.249
4.2. The decline in the performance of the extractive industries within the Moroccan economy mainly reflects the falling-off in world demand for phosphate and its byproducts since 2012, due to the sluggish global macroeconomic context and the reduced purchasing power of importing countries such as India and, to a lesser extent, Brazil, the main customers for Moroccan phosphate. As shown by Chart 4.3, domestic demand for these products has also fallen sharply; this demand relates mainly to fertilizers used in Moroccan agriculture.
Chart 4.13 Local sales and exports of mineral and processed products, 2008-2014(DH billion)
0
10
20
30
40
50
60
70
80
2008 2009 2010 2011 2012 2013 2014
Local sales
a
a Provisional.Source: Ministry of Energy, Mining, Water and the Environment (MEMEE), Rapport d'activité 2013 du secteur
des mines (Mining sector activity report 2013).
248 See, in particular, WTO document TN/RL/GEN/170 of 14 December 2010.249 Ministry of Energy, Mining, Water and the Environment (MEMEE) (2013).
WT/TPR/S/329 • Kingdom of Morocco
- 100 -
4.3. The other mineral substances extracted from Morocco's subsoil include precious metals (gold and silver), base metals (copper, lead, zinc, cobalt, manganese, iron, etc.) and industrial substances and rocks (barite, salt, fluorite, bentonite and fuller's earth).
4.4. The Ministry of Energy, Mining, Water and the Environment (MEMEE) is responsible for mining policy.250 The Government's strategy in this sector is to invest massively in upgrading the products locally prior to exportation. Except in the case of phosphate mining, which is a State monopoly, the Government is actively seeking foreign investors to develop the mining sector. To achieve this, Morocco has adopted a National Mining Sector Development Strategy for the period up to 2025.
4.3.2 Phosphates
4.1. In 2013, phosphates accounted for more than 90% of the total domestic mining output of 29 million tonnes. Since it began in 1921 phosphate exploitation has been a State monopoly managed by the Moroccan Phosphates Board (OCP). In 2008, the OCP was converted into a public limited company with the State holding 95% of the shares. The OCP, a State-trading enterprise (Section 3.3.1), is one of the world's leading exporters of crude phosphate, phosphoric acid and phosphate fertilizer.251 Since 2009, the OCP group has been pursuing a commercial strategy aimed at regulating supply and demand and controlling the prices of phosphates and their byproducts. The objective is to raise Morocco's share of the world market from 21% to 40% for all products (crude phosphate, phosphoric acid and fertilizer) under a policy aimed at extracting greater value-added from phosphate rock. Moroccan fertilizer exports rose from 2.6 million tonnes in 2006 to more than 4.3 million tonnes in 2013.
4.2. Major investments are being made to develop phosphate processing and include the chemical complex of Jorf Lasfar (DH 40 billion), owned by the OCP, which is planning to build a group of integrated fertilizer plants and a sea-water desalination unit. The OCP is offering foreign investors a turnkey infrastructure with industrial units designed to produce phosphatic products on the spot. At the same time, the Safi Phosphate Hub project envisages the investment of DH 30 billion over a ten-year period. The OCP is also planning to expand extraction capacity by about 20 million tonnes, to reach 50 million tonnes per year by 2025, as well as to develop ore treatment by building four high-technology washing plants to provide a capacity of 44 million tonnes per year.
4.3. Improved logistics and transport infrastructure and a substantial reduction in costs are envisaged following the entry into service, in 2014, of the Khouribga-Jorf Lasfar pipeline (235 km), the extension of the port of Jorf Lasfar and the construction of the new phosphate port of Safi, which will eventually handle 14 million tonnes per year.
4.3.3 Other mineral products
4.1. Unlike phosphate rock, other mineral products and their processing and phosphate processing are accessible to private (including foreign) investment. To engage in non-phosphate mineral exploration and exploitation it is necessary to obtain exploration and exploitation permits. Exploration permits can be obtained from the MEMEE.
4.2. In 2015, a new Mining Code was adopted to replace the 1951 legislation.252 The principal measures introduced by this law are as follows:
extension of the scope of the mining legislation to include other mineral substances for industrial use, such as calcite, feldspar, magnesite, and perlite, with the exception of construction and civil engineering materials;
introduction of the exploration permit offering mining enterprises the opportunity to operate within large-scale areas ranging from 100 to 2,400 km2;
a mining title to cover all the mineral products present, instead of a specified category, as is currently the case;
creation of new permits for the exploitation of underground cavities for storing natural gas and for the exploitation of tips and spoil;
250 Viewed at: http://www.mem.gov.ma.251 Viewed at: http://www.ocpgroup.ma/fr.252 Law No. 33-13 on mining, published in the OJ on 1 July 2015.
WT/TPR/S/329 • Kingdom of Morocco
- 101 -
extension of the period of validity of the mine exploitation permit and its renewal until reserves are exhausted; and
requirement of an environmental impact assessment and an abandonment plan to protect the environment and ensure sustainable development.
4.3. The mining sector benefits from the incentives offered by the Investment Charter and by the General Tax Code, as amended by the annual Finance Laws, in particular a corporation tax rate of 17.5%. Apparatus and equipment used for prospecting are not exempt from VAT. The "depletion allowance" (PRG) was abolished by the 2008 Finance Law. This allowed mining enterprises to set aside funds, free of corporation tax, up to a maximum of 50% of their taxable profits (or 30% of their turnover). These sums were used to establish a social fund (20%) and to finance prospecting for new deposits (80%).
4.4. The National Hydrocarbons and Mining Board (ONHYM), which reports to the MEMEE, is a public agency responsible for carrying out, in the authorized areas, studies, surveys and prospecting work to discover hydrocarbon and other mineral deposits (apart from phosphates), developing and exploiting them, and engaging in any other related activity.253
4.5. Small-scale mining is in process of being restructured. This activity, carried on mainly in the mining region of Tafilalet and Figuig, is governed by the Dahir of 1 December 1960, which created the Purchasing and Development Co-operative for the Tafilalet and Figuig Mining Region (CADETAF). This public institution is responsible for the collection, purchase, transport and marketing of lead, zinc and barite ores mined in the mining region of Tafilalet and Figuig. Small-scale miners are required to deliver all their production to CADETAF, which has a monopoly on the purchase of the ore extracted. It is now acknowledged that small-scale mining cannot be developed further, given the ever-increasing depth of the mineral deposits, which calls for resources and technologies far in advance of those available to the small-scale miners.
4.4 Energy
4.1. About 95% of the energy consumed in Morocco is imported (average for 2009-2014). Energy policy has a preponderant influence on the development of the Moroccan economy. Since 2000, imports of energy products have increased steadily to meet the country's energy needs (Chart 4.4); they accounted for 24% of total import value in 2014. The main suppliers are listed in Table 4.12.
4.2. In 2014, the International Energy Agency (IEA) published a first report on Morocco.254 This report stresses that Morocco's heavy dependence on fossil fuels is maintaining a relatively high level of greenhouse gas emissions and that Morocco is therefore confronted by a number of energy challenges also faced by the majority of members of the IEA, namely, how to ensure a reliable, affordable and sustainable energy supply. In 2010, Morocco sent the Secretariat of the United Nations Framework Convention on Climate Change (UNFCCC) its second national communication concerning the measures taken to reduce greenhouse gas emissions in the energy sector.
253 Law No. 33-01 creating the ONHYM; viewed at: http://www.onhym.com.254 IEA (2014).
WT/TPR/S/329 • Kingdom of Morocco
- 102 -
Chart 4.14 Imports of energy products, 2005-2014
0
2,000
4,000
6,000
8,000
10,000
12,000
14,000
2005 2006 2007 2008 2009 2010 2011 2012 2013 2014
OtherElectricityCoal and petroleum cokePetrolNatural gas and other hydrocarbonsDiesel-fuel oilCrude petroleum
(US$ million)
Source: WTO Secretariat calculations based on based on data from the UNSD Comtrade database.
Table 4.38 Imports of energy resources, 2005 and 2010-2014
(US$ million) (% of total)2005 2010 2011 2012 2013 2014 2005 2014
Coal World 360 378 474 540 437 590 100 100United States 5 105 255 424 284 215 1 36Russian Federation 19 132 173 75 60 152 5 26South Africa 244 103 13 18 41 83 68 14Ukraine 44 4 3 5 15 78 12 13EU 28 35 2 21 19 37 61 10 10
Poland 34 34 53 9 9Spain 1 2 6 4 2 8 0.4 1
Electrical energy World .. 219 349 322 347 373 .. 100EU .. 216 333 316 333 339 .. 91
Spain .. 216 333 316 333 339 .. 91Algeria .. 3 15 6 14 34 .. 9Petroleum oil (crude) ..World 2,702 2,980 3,888 4,352 4,321 3,365 100 100Saudi Arabia 1,031 1,639 2,323 2,070 2,116 1,784 38 53Iraq 60 703 1,134 1,162 1,355 855 2 25Russian Federation 1,032 437 331 775 772 636 38 19Petroleum oil (other than crude) World 652 2,633 4,197 4,608 4,533 4,260 100 100EU 28 496 1,093 1,443 2,098 2,003 1,842 76 43
Spain 95 148 588 1,413 1,197 941 15 22United States 1 511 997 705 1,438 1,213 0.1 28Russian Federation .. 284 736 924 626 500 .. 12Petroleum gas (gaseous) World 57 139 213 382 464 434 100 100Algeria 57 139 213 382 464 434 100 100Petroleum gas (liquefied) World 596 1,532 1,782 1,957 1,811 1,851 100 100Algeria 202 670 823 665 763 817 34 44EU 28 355 626 578 785 698 567 60 31
United Kingdom 36 197 255 375 231 225 6 12Spain 56 87 153 180 166 151 9 8France 234 209 125 94 138 115 39 6
United States 1 0 0 53 54 336 0.2 18
.. Not available.Note: The product groups are defined on the basis of the Harmonized System Code: Coal HS 27.01;
Liquefied gas HS 27.111; Gas in natural state HS 27.112; Petroleum oil (crude) HS 27.09; Petroleum oil (other than crude) HS 27.10; and electrical energy HS 27.16.
Source: UNSD Comtrade database; data for 2014 provided by the Moroccan authorities.
WT/TPR/S/329 • Kingdom of Morocco
- 103 -
4.3. The current energy strategy is designed to optimize the fuel mix in the electricity sector by developing renewable energies and the use of natural gas (see below); to ensure security of supply and energy availability; to manage the demand; and to preserve the environment. The reforms being introduced have considerably reduced the budgetary subsidies granted to petroleum products by the State.
1.1.1 Upstream petroleum sector
4.4. Morocco does not currently produce any petroleum. The legislation concerning the exploration and exploitation of liquid, gaseous or solid natural hydrocarbons has not changed since 2009255; it is available on the MEMEE's website.256 To carry out geological, geochemical or geophysical surveys, explore for hydrocarbon deposits and then exploit them it is first necessary to obtain a survey permit (one year, renewable), an exploration permit (eight years, renewable) or an exploitation concession (25 years, renewable for 10 years), as appropriate.
4.5. The granting of an exploration permit is subject, in its turn, to the conclusion of a petroleum agreement with the State. The State has the right to a stake (not more than 25%) in the capital relating to the exploration permit and the exploitation concession. The latter two do not confer on their holder any right of ownership of the soil or subsoil.
4.6. The issuing of exploration permits is conditional upon the payment of DH 1,000 (per permit or renewal application). Exploitation concessions are granted subject to the payment of an "annual surface rental" of DH 1,000 per km2 and a royalty. The production of the first 300,000 tonnes from concessions situated onshore or offshore at a sea water depth of not more than 200 metres, and the production of the first 500,000 tonnes from concessions situated offshore at a sea water depth of more than 200 metres, are exempt from payment of the royalty; beyond that the rate is fixed at 10 and 7%, respectively.
4.7. The Hydrocarbons Code (Law No. 21-90) provides for several incentives for exploration and exploitation. Thus, exploitation concessions are exempt from the payment of corporation tax (Section 2.4) for the first ten years from the start of production. Equipment, materials and products necessary for reconnaissance surveys, exploration or exploitation are exempt from all import duties and taxes. Goods and services purchased on the local market for the needs of these activities are exempt from VAT. Holders of an exploitation concession benefit from exemption from the taxe professionnelle (professional tax) and from the taxe d'habitation (local occupancy tax). The annual royalty and the surface rental can be deducted from taxable income. The profits and dividends of exploitation concession holders and those of shareholders in concessionaire enterprises are not taxed.
4.4.2 Downstream petroleum sector
4.1. Diesel alone accounts for 51% of the total consumption of petroleum products, partly because of the substantial subsidies it has received in the past. Liquefied petroleum gas (LPG or butane), which is still subsidized, accounts for about 20% of consumption.
4.2. Crude petroleum is refined by the Moroccan Refinery Industry Company (SAMIR), whose Mohammedia refinery supplies about 50% of the refined petroleum products market, in competition with imported products. Through its SALAMGAZ subsidiary, SAMIR also bottles LPG, supplying about 14% of the domestic market. SAMIR is a 67.3%-owned subsidiary of a company constituted under Swedish law with Saudi capital, the remaining shares being held by various shareholders. The petroleum products market, with 8 importers and some 15 distributors, appears to be competitive.
4.3. SAMIR is required to build up and maintain a safety reserve of crude petroleum equivalent to the monthly average of its total sales of refined products on the domestic market. SAMIR also stores refined petroleum products. The distribution companies must store the equivalent, per product, of twice their monthly average sales on the domestic market.257 Petroleum products must be stored by importers or distributors, or by bottling centres in the case of LPG. The
255 Law No. 21-90 on the exploration and exploitation of hydrocarbon deposits, and Law No. 27-99 amending and supplementing it; viewed at: http://www.mem.gov.ma/SiteAssets/PdfTexteReg/hydrocarb/Codehydroca.pdf.
256 Viewed at: http://www.mem.gov.ma/.257 Order No. 393-76 of 17 February 1977 concerning safety reserves of petroleum products.
WT/TPR/S/329 • Kingdom of Morocco
- 104 -
Government is seeking to develop overall LPG storage capacity, which is currently more than 275,000 tonnes, spread over terminals and the country's 37 bottling centres. The Moroccan Storage Company (SOMAS) has the largest butane storage capacity (200,000 tonnes). Several recent investment projects include a new LPG terminal at Tan-Tan, and a new LPG storage terminal in the port of Tanger-Med.
4.4. Consumption of the main liquid and gaseous petroleum products has been subsidized until recently, with maximum consumer prices for liquid fuels (super, diesel and heating oil) fixed by ministerial order. The Compensation Fund published the price structure on its website. Each month, it covered, wholly or partially, the difference between the selling price and the cost price of the products. The plan was to stop administering prices of liquid petroleum products in December 2015.
4.5. Measures were taken at the end of 2013 and in 2014 to abolish subsidies on petrol and fuel oil for industrial use and to reduce the subsidy on diesel, as well as to eliminate the subsidy on fuel oil used for generating electricity. In October 2015, only LPG was still being subsidized by the State: the selling price was DH 40 per 12-kg bottle, as compared with an ex-bottling centre cost price of DH 83.5.
4.6. These recent measures have definitely helped to reduce the budget deficit (Section 1.2) and to improve the balance of payments. In 2014, petroleum product subsidies still accounted for about two thirds of the annual budget deficit.258 The amount of these subsidies had reached DH 36 billion in 2013, as compared with DH 25 billion in 2008, before falling back to DH 27 billion in 2014 (Section 1.2). The decline in subsidies was also facilitated by the fall in prices on world markets.
4.7. In 2009, for the purpose of alignment on international standards, Morocco reduced the list of products marketable through the national service station network to diesel 50 ppm (50 parts per million sulphur) and unleaded super.
4.4.3 Natural gas
4.1. Morocco was not a large-scale natural gas producer in 2015, although discoveries have recently been made.259 Natural gas prospecting and production is in the hands of domestic and international private operators, in compulsory partnership with the ONHYM. There was no large-scale distribution of natural gas in Morocco in 2015.
4.2. Gas exploitation concessions are subject to the payment of a royalty. The production of the first 300 million m3 from concessions situated onshore or offshore at a sea water depth of not more than 200 metres, and the production of the first 500 million m3 from concessions situated offshore at a sea water depth of more than 200 metres, are exempt. Beyond that, the rate is fixed at 5% and 3.5%, respectively. The same incentives are accorded to gas production as are accorded, under the Hydrocarbons Code, to petroleum production (see above).
4.3. In 2008, the only transport activity was through the Maghreb-Europe Gas Pipeline (GME), carried out by the company Europe Maghreb Pipeline Limited (EMPL). Since its completion in 1996, the GME has supplied Morocco with a quantity of Algerian natural gas, which can amount to 750 million m3 per year, as payment in kind for the transit fee. To this should be added a volume with a maximum value of 640 million m3 per year under a 2011 ten-year contract between Sonatrach and the ONEE (see below). The volume of 1.1 billion m3 available supplies the two combined-cycle power stations at Tahaddart, built in 2005, and Ain Beni Mathar, built in 2010. The total annual transport capacity of the Moroccan stretch of the GME is 12.5 billion m3.
4.4. The GME (i.e. the 540-km stretch on Moroccan territory) is operated, maintained and monitored by the company METRAGAZ based in Tangiers, under an agreement which expires in 2021. METRAGAZ provides weekly information about the anticipated transit flows and hence about the available volumes of fee-paying gas.
258 IEA (2014).259 Viewed at: http://www.onhym.com/office/communication/communiques-de-presse/368-resultats-
positifs-des-tests-du-puits-sah-w-1-sur-le-permis-sebou-et-programme-futur.html.

WT/TPR/S/329 • Kingdom of Morocco
- 105 -
4.5. The Government's objective is to develop a gas transport network covering the entire country, as described in December 2014 in the Road Map for natural gas development. Natural gas needs are estimated at 5 billion m3 per year by 2025. A draft Gas Code has been drawn up.260
4.4.4 Electricity
4.1. Domestic electricity production covers 82% of Moroccan demand (2014). Morocco imports and exports electricity through its interconnections, with 6 TWh being imported in 2014, mainly from Spain, and 0.1 TWh being exported. Net electricity imports increased by 332% between 2002 and 2014. Moreover, since 2006, the electrical interconnection with Spain has offered a transit capacity of 1.4 gigawatts (GW). According to the authorities, the trade in electricity with Algeria (1,200 MW connection) is conducted on a non-monetary basis, with the aim of providing mutual assistance.
4.2. Morocco's goal is regional network integration, in particular through the Maghreb Electricity Committee (COMELEC), established in 1992, as well as with the European Union under the Treaty of Athens of 2003. The Spain-Morocco-Algeria-Tunisia network is the start of a Mediterranean network that could extend to Italy if the plans for interconnecting Tunisia and Italy are realized, and as far as Egypt, if the necessary reinforcement of the Libyan network can be completed.
4.3. The policy introduced in 1995 to generalize access to electricity for the whole of the rural population made it possible to serve 99% of the population in 2015, as compared with 18% in 1995, which has led to a sharp increase in electricity demand.
4.4. Although electricity continues to be generated mainly from thermal sources, hydro-electricity and wind power are making an increasing contribution (Table 4.13). The use of natural gas for generating electricity has expanded substantially since 2008.
4.5. Where renewables are concerned, conditions in Morocco are very favourable for wind, solar and hydraulic power. Numerous hydraulic, wind and solar projects have recently been launched and should be providing about 42% of their installed capacity by 2020. In 2015, there were some 30 hydraulic plants with a total capacity of 1,770 MW; various wind farms combine to provide a total capacity of 755 MW.
4.6. Electricity is generated by the National Electricity and Water Board (ONEE), private concessionaires, namely, the Jorf Lasfar Energy Company (JLEC), Theolia, and Énergie électrique de Tahaddart (EET), and self-generators such as mines and phosphate treatment plants, which generate electricity mainly for their own needs. Transport is provided exclusively by the ONEE. The State's share of national electricity generation is around 37%.
Table 4.39 Electricity generation, 2002, 2008, 2010 and 2012-2014(GWh)
2002 2008 2010 2012 2013 2014Total electricity generation, of which: 15,340 24,003 26,531 28,572 31,056 32,026
ONEE 4,537 6,689 10,315 12,940 13,282 9,863Hydraulic 842 1,360 3,631 1,816 2,990 2,033Thermal 3,681 5,758 6,410 10,791 9,905 7,755Wind power 14 146 493 582 660 594
Concessions 9,566 13,042 12,166 13,168 12,739 16,809 JLEC (coal) 9,387 10,022 9,847 10,191 9,915 13,729Compagnie Éolienne du Détroit (CED) (wind) 180 153 166 146 161 141EET (natural gas) .. 2,867 2,153 2,831 2,663 2,504Wind power - Tarfaya .. .. .. .. .. 453
Net imports 1,392 4,261 3,940 4,841 5,400 6,010Self-generators 84 40 152 139 111 137Projects developed under Law No. 13-09 .. .. .. .. 394 598
.. Not available.Source: ONEE.4.7. According to the authorities, the ONEE does not have a regulatory function, this being the responsibility of the MEMEE. The project to establish a National Electricity Regulatory Authority is said to be in process of finalization. The ONEE supplies the domestic market from its own power stations. It is the only buyer and seller of marketed electricity (except for sales under the new Law No. 13-09 (see below)), including imports and exports, and it guarantees the purchase of the electricity produced by concession-holding generators and industrial self-generators. Electricity is
260 MEMEE; viewed at: http://www.mem.gov.ma/Realisations/hydrocarbures.htm.
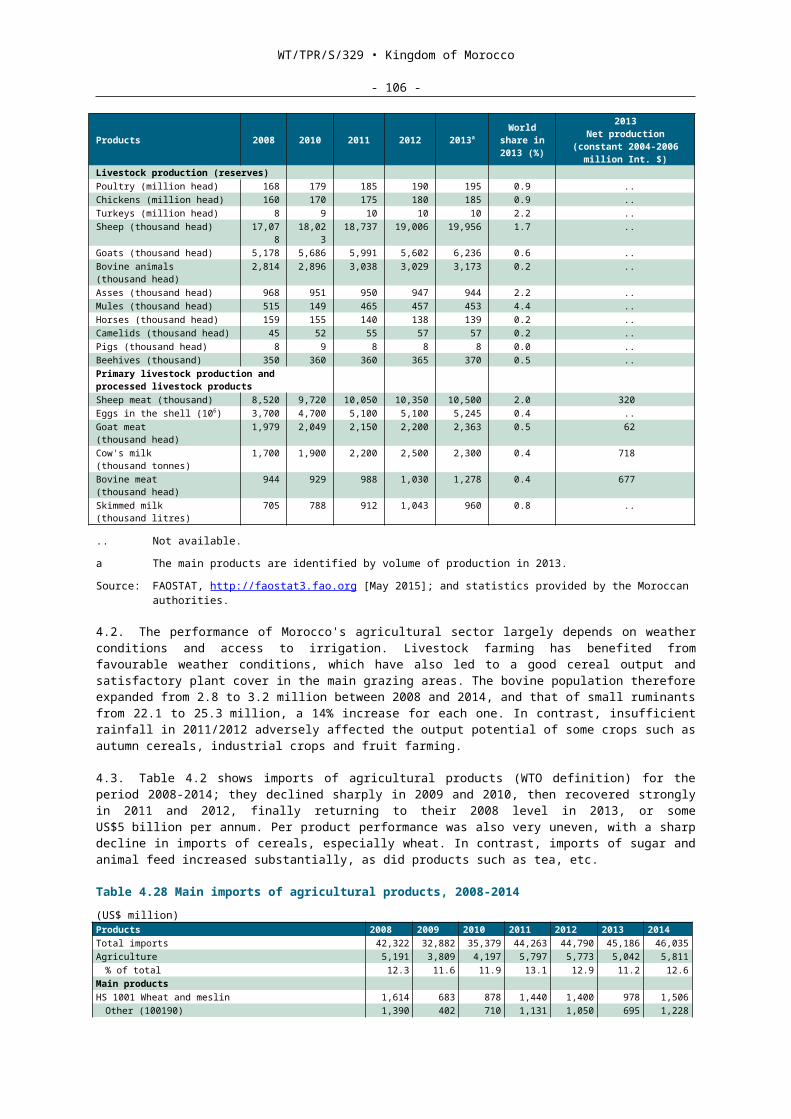
WT/TPR/S/329 • Kingdom of Morocco
- 106 -
distributed by the ONEE (58% of sales in 2014), by the municipal electricity boards, and by private distribution companies.
4.8. Law No. 16-48261, enacted in October 2008, raised the self-generation threshold from 10 to 50 MW. The ONEE still has a monopoly on power plants with a capacity of more than 50 MW. However, it is authorized to conclude agreements, in the form of concessions, with private operators for the generation of electricity at capacities in excess of 50 MW, provided that the generator supplies the power generated exclusively to the ONEE.262 In such cases, competitive tendering is compulsory. Law No. 54-14 allowed industrial firms to generate electricity for their own needs and by their own means, at capacities of 300 MW or more.
4.9. In a parallel move, Law No. 13-09 removed the upper limit on the capacity of renewable energy installations, previously limited to 50 MW, except for hydroelectric power, where the upper limit of 12 MW was retained. An operator may now generate an unlimited quantity of electricity from renewable energy sources on behalf of a consumer or group of consumers connected to the national medium-, high- and very high-voltage power grid, under an agreement in which the latter undertake to purchase and consume the electricity thus generated exclusively for their own use, any surplus being sold exclusively to the ONEE, but at a "contractual" rate.
4.10. In 2015, the VAT on solar water-heating equipment was reduced from 14% to 10%. Customs duties on certain equipment that uses renewable energy have been at the minimum rate of 2.5% since 2009.
4.11. The rates at which the ONEE sells electricity to the distributors, and the rates which the distributors charge the consumer, are fixed by regulation. The tendering procedure, in which the lowest price per kilowatt-hour (kWh) is an important factor, is used to select electricity generators, which are then tied to the ONEE by long-term power purchase agreements.
4.5 Manufacturing and crafts sector
4.1. For several decades, the development of the manufacturing sector has been a priority for the Moroccan Government, especially on account of the jobs it generates. This strategy has been closely combined with an intra-industry trade policy, especially with the European Union. Thus, Morocco is on the way to becoming one of the world's leading producers of automobile sector products, which have become its main export product thanks to European direct investment. The food industry (Section 4.1) is also very important and growing, as is phosphate processing (Section 4.3.2). The clothing industry is an important source of export earnings. At the same time, the Moroccan industrial fabric is by nature fragmented and includes a substantial informal sector. Programmes in support of very small enterprises have been introduced, as well as others specifically designed for craftspeople turning out products with a high cultural content for export.
1.1.1 Support for production, infrastructure and training
4.2. The fact that Morocco has launched three industrial strategies over the course of the last ten years illustrates the importance that the Government attaches to the development of this sector: the 2005 Emergence Plan was followed by the National Plan for Industrial Emergence in 2009, and the National Industrial Acceleration Plan (PAI), for the period 2014-2020, under the Ministry of Industry, Trade, Investment and the Digital Economy (MICIEN).263 The aims of the PAI are: (i) to generate half a million jobs, with 50% of these coming from foreign direct investment and the other 50% from the renovated domestic industrial fabric; (ii) to raise industry's share of GDP from the 2014 level of 14% to 23% in 2020; and (iii) to develop export capacity and productivity, through targeted support for industry. In particular, the Government is seeking to develop "ecosystems" consisting of several small enterprises around one large enterprise, to encourage industrial integration.
4.3. A €2 billion Industrial Development Fund (FDI) has been set up to finance the three priority measures concerned, namely, the provision of integrated production infrastructure for investors; subsidies and other incentives; and training programmes. Through the Investment Promotion Fund
261 Dahir No. 1-08-97 of 20 October 2008, enacting Law No. 16-48 amending and supplementing Dahir No. 1-63-226 of 5 August 1963 creating the ONE was adopted in July 2008.
262 Decree-Law No. 2-94-503 of 23 September 1994.263 Viewed at:
http://www.mcinet.gov.ma/ActualitesEvenements/Pages/Plan_acceleration_industrielle.aspx.
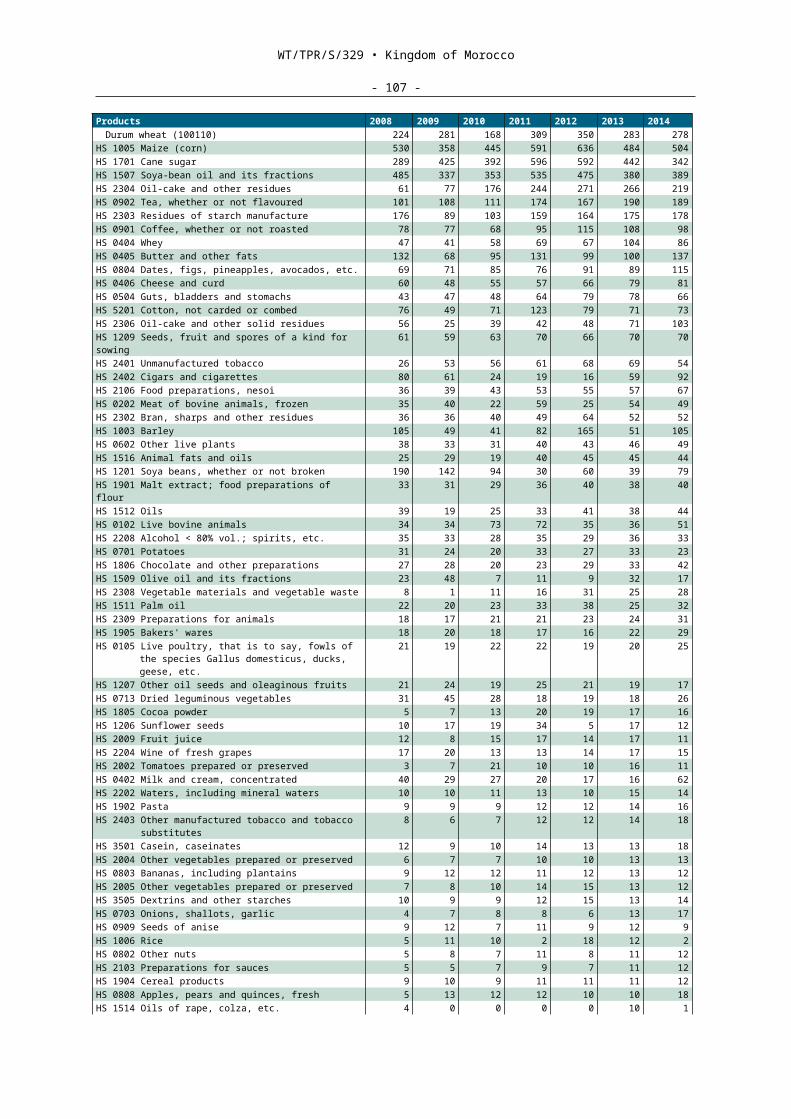
WT/TPR/S/329 • Kingdom of Morocco
- 107 -
(represented by the Industrial Development Fund in the PAI), the State contributes 10% of total investment for projects exceeding DH 200 million, in the case of investment in an eligible sector (clothing, automotive, etc.).
4.4. The PAI envisages the establishment of Integrated Industrial Hubs (P2I), covering a total area of 1,000 hectares throughout the country. These P2Is offer industrial land for rent (undeveloped or ready for use) "at competitive prices, ideally located in relation to the city and interconnected with the transport networks". An array of equipment and services is available, including catering, transport, technical maintenance, security, upkeep and cleaning, postal and financial services, etc. An administrative single window offers various key State services for investors (social security, local authority services, taxes, OMPIC, etc.). Three P2Is have already been set up, at Kenitra, Nouaceur and Tangiers.
4.5. Where training is concerned, a direct State aid system has been established for the benefit of the offshore finance, automotive, aeronautical and electronics sectors; its aim is to train new recruits and make them quickly operational: through the National Agency for Employment and Skills Development (ANAPEC), businesses are reimbursed for the training costs incurred during the first three years of employment. Moreover, the State has financed the establishment of Automotive Training Institutes (IFMIA) in Casablanca, Kenitra and Tangiers, as well as a College of Design and Fashion (ESCM) and an Aeronautical Training Institute. The Central School of Casablanca (ECC) offers a very high level of training for multi-skilled generalist engineers familiar with business and capable of supervising large development projects.
4.6. Over a three-year period, from 2009 to 2012, the Government progressively introduced tariff reforms providing for the gradual elimination of MFN customs duties on all industrial products. Although there has been a considerable decline in the level of MFN tariffs, it remains high and hardly likely to encourage the search for gains in productivity (Chart 4.5). By contrast, most of the sector's growth has taken place within the context of the entirely duty-free intra-industry trade with the European Union.
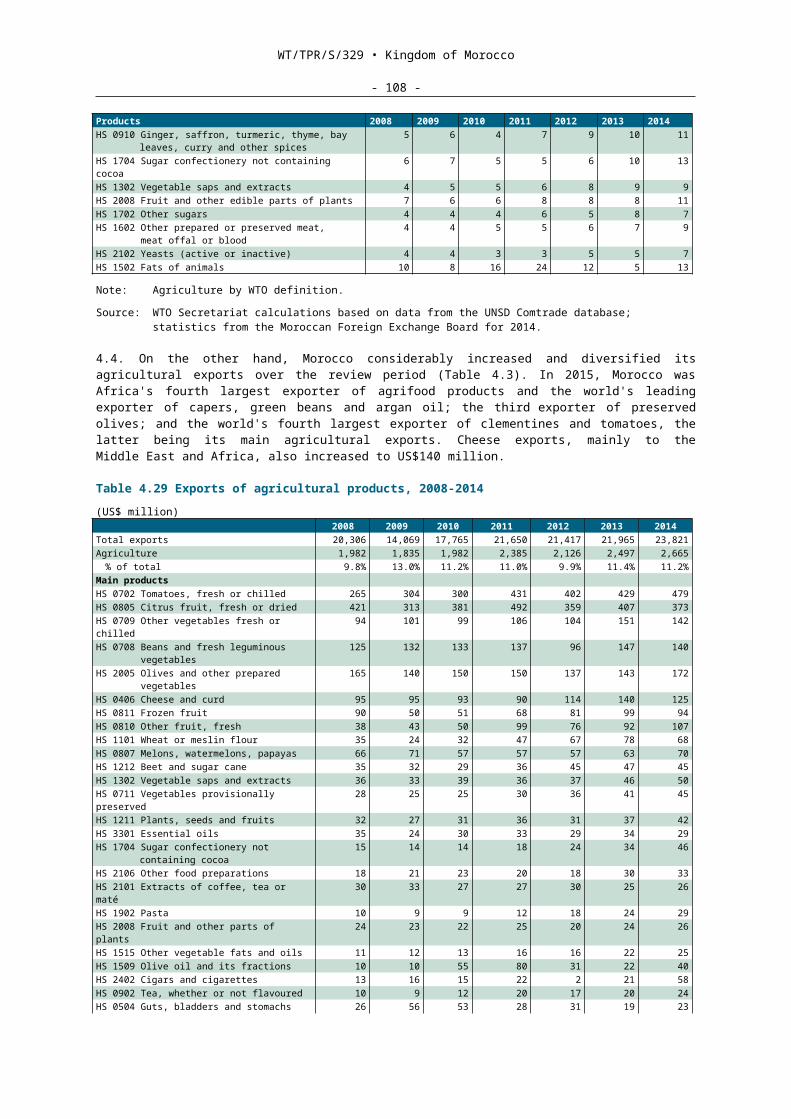
WT/TPR/S/329 • Kingdom of Morocco
- 108 -
Chart 4.15 Customs duties by manufacturing industry, 2009 and 2015(%)
0.0
5.0
10.0
15.0
20.0
25.0
30.0
35.0
40.0
45.0
50.0
Food
, be
vera
ges
and
toba
cco
Text
iles
and
wear
ing
appa
rel
Woo
d an
d wo
od
prod
ucts
Pape
r and
pap
er
prod
ucts
, prin
ting
and
publ
ishin
g
Chem
ical
prod
ucts
Non-
met
allic
m
iner
al
prod
ucts
Basic
met
al
indu
strie
s
Fabr
icate
d m
etal
pr
oduc
ts,
mac
hine
ry a
nd
equi
pmen
t
Othe
r m
anuf
actu
ring
indu
strie
s
Aver
age
rate
ap
plie
d in
m
anuf
actu
ring
indu
stry
2009
2015
Note: Product groups in accordance with the two-digit ISIC definitions.Source: WTO Secretariat calculations, based on data provided by the authorities.
4.5.2 Some activities
4.5.2.1 Craft industry and informal sector
4.1. Nearly 405,000 craftspeople are employed making craft products with a high level of cultural content; the sector's turnover is DH 22 billion and its value added exceeds DH 13 billion. Exports increased by 14% in 2014 to reach DH 415 million. In 2014, carpets and pottery maintained their positions as the leading export products. Within the context of the implementation of a Programme Agreement 2006-2015 that set the seal on the "Vision 2015" strategy for the development of crafts with a high level of cultural content, the Ministry of Crafts and the Social and Solidarity Economy has set up a guidance programme for individual craftspeople and the sector's small and medium-sized enterprises to improve their turnover and create additional jobs. This programme comprises a whole range of measures concerning raw materials, techniques and tools; support and workshops and display areas, vocational training, etc. The State is also participating in the efforts to promote the craft sector's sales on targeted foreign markets.
4.2. Craft activities are also affected by the new "self-entrepreneur" status created with a view to helping small and especially very small enterprises (TPEs) to cross from the informal into the formal sector (Section 1.2).
4.5.2.2 Clothing
4.1. The textiles, clothing and leather industry contributed 4% of GDP in 2012.264 According to the MICIEN, it accounts for 31% of industrial employment (2013) and 17% of Moroccan exports, mainly involving made-up clothing and knitwear. Clothing exports are closely linked with textile imports, as Moroccan textile production remains at a relatively modest level. On the import side, the main products are cotton and synthetic-fibre fabrics; Morocco's suppliers are very diversified and located more particularly in Europe and Asia. Production is on a "just-in-time" basis.
4.2. Most exports go to the European Union, whose imports of clothing from Morocco amounted to US$2.7 billion in 2014, without any real growth since 2008. All exports to the EU are duty free. Curiously, the values of exports to the United States vary sharply depending on the source of the data, American or Moroccan (Table 4.14). According to the authorities, this is due to the fact that
264 CCI (2012).
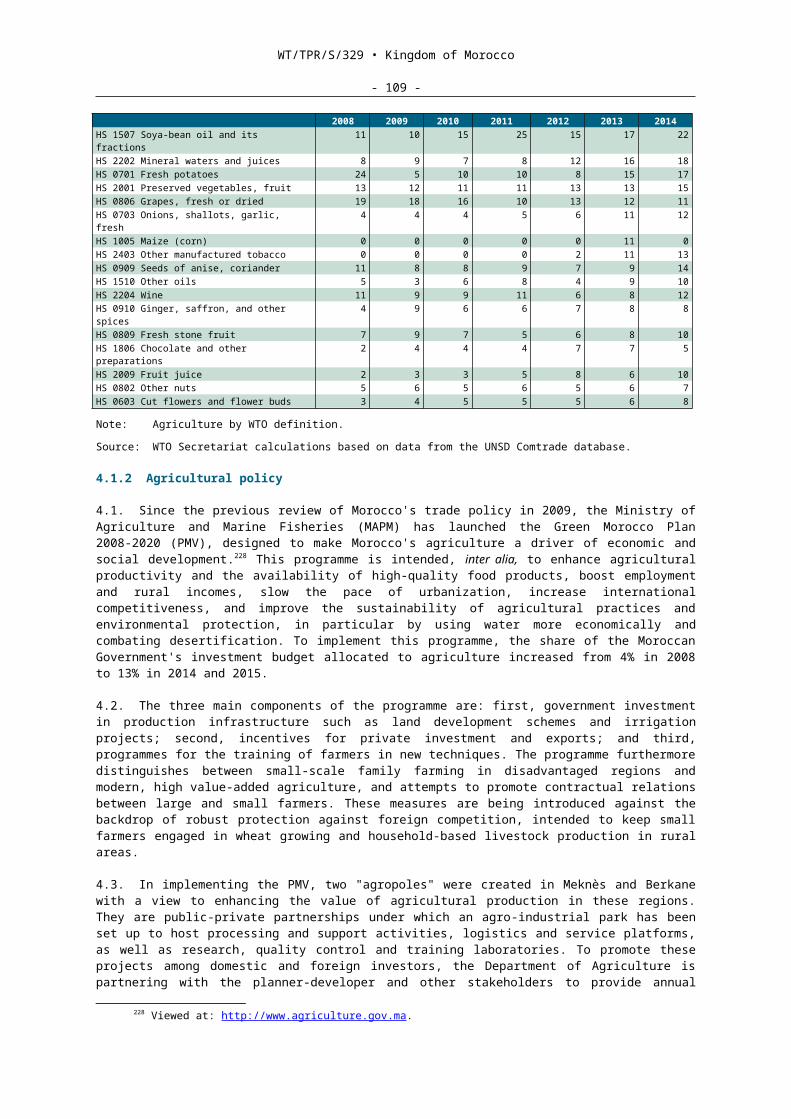
WT/TPR/S/329 • Kingdom of Morocco
- 109 -
some shipments of goods of Moroccan origin destined for the U.S. market are recorded as exported to the EU and vice versa.
Table 4.40 Clothing exports (HS 61 and 62) to the United States market, 2005 and 2010-2014(US$ million and %)
2005 2010 2011 2012 2013 2014UN Comtradea
United States 19.5 23.4 33.5 38.5 44.2 ..% Moroccan clothing exports 0.7 0.8 1.0 1.2 1.4 ..USITCUnited States 56.1 63.0 83.5 103.1 115.0 135.5Morocco-United States Free Trade Agreement .. 23.8 32.0 37.8 49.3 49.2MFN 56.1 39.2 51.4 65.3 65.7 86.4
.. Not available.a Comtrade statistics based on data from the Moroccan Foreign Exchange Board.Source: WTO Secretariat calculations, based on data from the UNSD Comtrade database and on USITC data,
viewed at: http://dataweb.usitc.gov.
4.3. In 2015, the average rate of customs duty on textile and clothing products was 10.4%, which is still high but considerably lower than the 2009 level (Chart 4.5). However, the reduction of the customs duties on raw materials and inputs to the Moroccan tariff's minimum rate of 2.5% is increasing escalation and hence the effective rate of tariff protection.
4.4. The temporary admission for processing procedure (Section 3.1.3.6) is being used intensively by the factories producing made-up garments under subcontracting arrangements. The branch also benefits from the opportunities for the refunding, by way of drawback, of the duties and taxes on the energy consumed in producing goods for export, including those produced under the temporary admission for inward processing procedure. The clothing industry is also one of the main sectors to benefit from the export free zone regime (Section 2.4.2). Moreover, textile enterprises have access to the "P2I" industrial hubs (see above), some of which benefit from free zone status.
4.5. Since 2008, through the Investment Promotion Fund (FPI, represented by the Industry Development Fund in the PAI), the State has been contributing 10% of the amount of the investment in projects exceeding DH 200 million, where investment in textile spinning, weaving or finishing is involved.265 On the other hand, the programmes for restructuring textile and clothing enterprises under the Fund for the Restructuring of the Textile and Clothing Sector (FORTEX) ended in 2010.
4.5.3 Automotive industry
4.1. The Moroccan automotive industry has recorded some remarkable growth during the last ten years and exports of automobiles alone grew from US$65 million to more than US$1.65 billion in 2013. In 2014, the total exports of the automotive sector as a whole exceeded US$4.7 billion, as a result of which it became the country's leading export sector. Morocco is now one of the world's 30 top motor vehicle builders.266 Annual imports of parts and accessories respectively amount to about US$600 million. Body imports have increased sharply (from US$12 to US$519 million between 2010 and 2013). Vehicle imports themselves remain substantial, at US$1.5 billion.
4.2. This trend partly reflects the agreement signed with the French group Renault for the Renault-Nissan Tanger-Med project, comprising €1 billion of investment. The site has been operational since 2010 and has a maximum annual production capacity of 400,000 vehicles.267
Renault-Nissan's Tangiers plant is a limited company which, up to the end of 2014, was owned 52.4% by the Renault Group and 47.6% by the Deposit and Management Fund (CDG); the CDG has since sold its stake to the Renault Group. Vehicles are also assembled in the plants of the Moroccan automobile manufacturer SOMACA, near Casablanca, in which Renault holds 80% of the capital and PSA (Peugeot-Citroën) the rest.
265 Viewed at: http://www.invest.gov.ma/?lang=fr&Id=20.266 Viewed at: http://www.medz.ma/en/your-investment/by-sector/automotive/149-secteurs/automobile/
actualites/681-automotive-industry-automotive-production-morocco-soon-in-the-world-top-20.267 Moroccan Association for Automotive Industry and Trade (MAAIT) (2013).
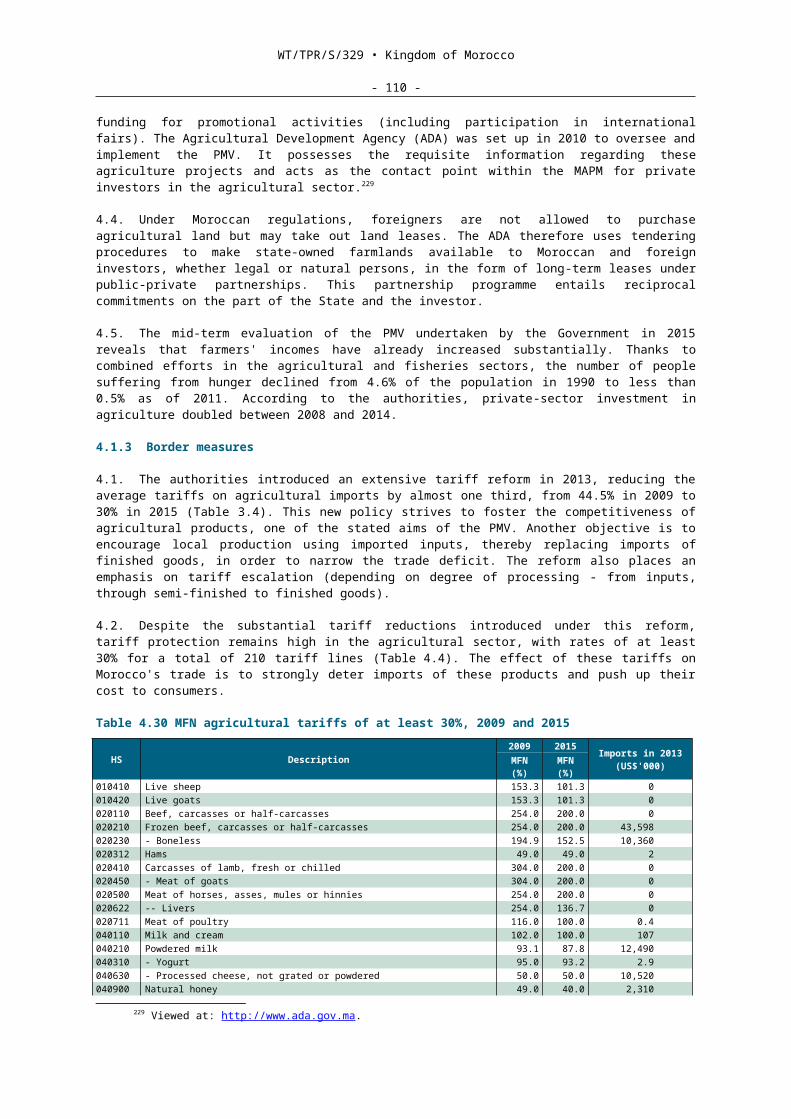
WT/TPR/S/329 • Kingdom of Morocco
- 110 -
4.3. The equipment manufacturing branch has also developed strongly in Morocco, producing components such as cable harnesses, seat covers, plastic parts, shock absorbers, filters, exhaust pipes, and tyres. There were more than 150 equipment manufacturing plants in 2014, established mainly at three sites: the Tangiers Free Zone (ZFT), Tangiers Automotive City and the Atlantic Free Zone in Kenitra.268
4.4. On the other hand, there has been a sharp fall in exports of lorries and other motor vehicles for the transport of goods, from US$110 to US$15 million between 2010 and 2013, while annual import value stands at around US$350 million. This fall is partly attributable to the fact that customs duties have been widely eliminated in bilateral trade with the European Union. Previously, the assembling was done by assembly units using parts imported almost entirely in kit form, with a low rate of incorporation of domestic parts. Consequently, this type of investment – in an assembly plant in order to benefit from the differentials between the (higher) customs duties on pre-assembled products and the lower duties on their CKD269 components – is no longer relevant. In 2014, the heavy goods vehicle assembly subsector consisted of only a single enterprise, the foreign enterprises having pulled out.
4.5. Similarly, coachwork is done mainly by domestic coachbuilders, in association with foreign enterprises, but faces severe competition. In June 2014, Morocco notified the WTO of the results of an investigation under the Agreement on Safeguards regarding imports of cold-rolled sheets and plated or coated sheets used for coachwork. Moreover, in October of the same year, a definitive anti-dumping duty was imposed on imports of rolled steel sheets originating in the EU and Turkey (Section 3.1.6).
4.6. In July 2015, to support the HGV and coachwork sector, at local as well as export level, a five-year performance agreement "HGV and industrial coachwork ecosystems" was concluded between the industry and the State. The aim is to achieve a work force of 24,000 people in the sector and an estimated annual output of 34,000 units (as compared with 6,000 in 2014), of which 30% would be for export. It has not been possible to identify the specific support measures for which this agreement provides. The Moroccan Association for Automotive Industry and Trade (MAAIT) is the sector's foremost association.
4.7. Enterprises operate mainly under the free zone regime in order to benefit from the tax incentives, including total exemption from the IS during the first five years, followed by a ceiling of 8.75%. Financial aid from the FDI is available in amounts equivalent to 10% of the total investment.
4.8. In 2009, the rates of customs duty on imported new vehicles could reach 35%, with an average of 20%. The latter figure has fallen to less than 12% in 2015, while vehicles from the United States, the EU and EFTA enter duty free under the respective trade agreements. However, economy cars and economy light commercial vehicles, together with the products, materials and sets necessary to manufacture them, are exempt from customs duty. A vehicle may not be cleared through the customs if it is more than five years old. VAT is applied at the reduced rate of 7% to economy cars and their inputs and at the reduced rate of 14% to economy light commercial vehicles (with right of deduction).
4.6 Transport services
4.1. Recognizing the need for an efficient transport system to boost its domestic and international trade and hence increase its national income, Morocco has taken steps to liberalize international trade in air, maritime, road and rail transport services, while implementing a major programme of public investment in infrastructure. This dual policy has led to an improvement in the country's logistics performance (Chart 4.6).
268 Viewed at: http://sous-traitance-automobile.com/?page_id=30.269 CKD stands for "completely knocked down".
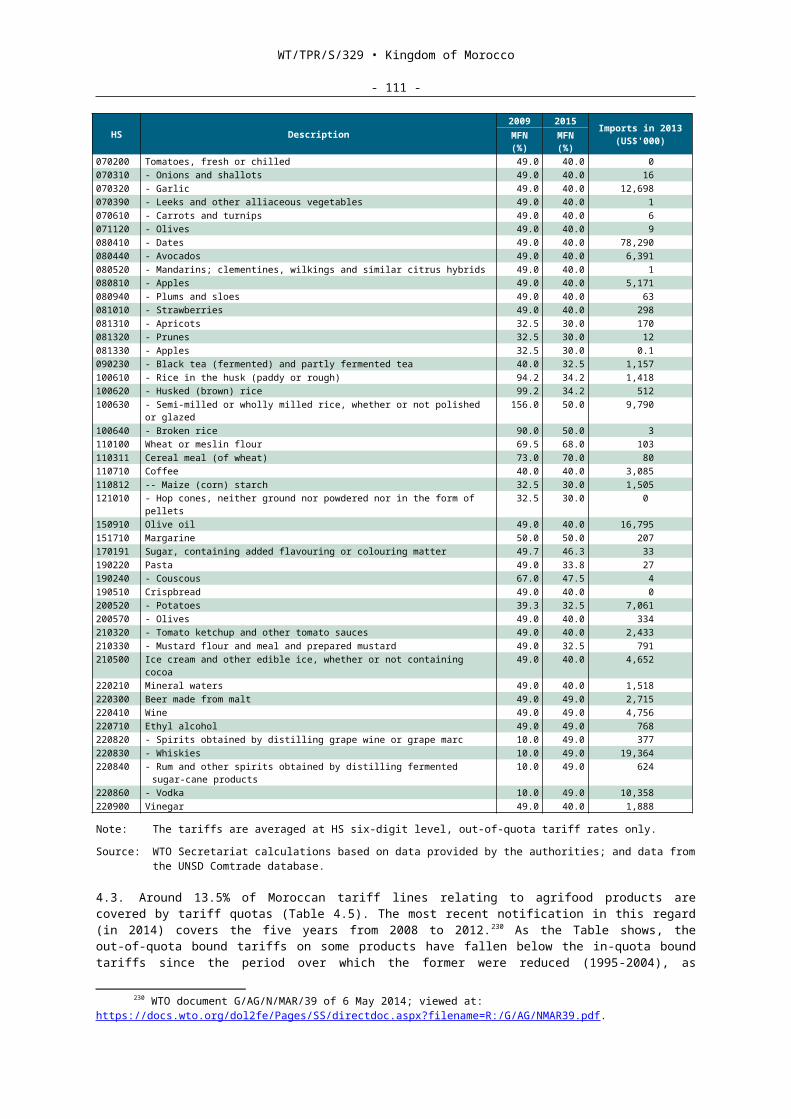
WT/TPR/S/329 • Kingdom of Morocco
- 111 -
Chart 4.16 Logistics performance index, 2007 and 2012
94101
77
64
119130
95
50
65
3946
59 58 53
0
20
40
60
80
100
120
140
Overall performanceglobale
Efficiency of thecustoms clearance
process
Quality of trade andtransport-related
infrastructure
Ease of arrangingcompetitively priced
shipments
Competence andquality of logistics
services
Ability to track andtrace consignments
Timeliness ofshipments in
reaching destinationwithin scheduled
delivery time
2007 (total: 150) 2012 (total: 155)
(Ranking)
Note: Lower ranking signifies better performance.Source: World Bank; viewed at: http://lpi.worldbank.org.
4.2. However, Morocco's international commitments have not been updated to reflect this opening up to foreign suppliers. Its commitments under the GATS are limited to a few auxiliary air transport services and a few road passenger and goods transport services, insofar as the transport company is governed by Moroccan law.270 Only a few commitments have been undertaken in a few aviation and maritime subsectors under the FTA with the United States.
4.3. The Ministry of Infrastructure, Transport and Logistics (METL) is responsible for transport services in Morocco. All the relevant regulations can be viewed on the Ministry's website.271 The transport regulations relating to VAT (General Tax Code) are particularly complex (some 15 pages on this subject alone) and would benefit from being simplified.
4.4. In March 2013, the Interministerial Transport Council of the Maghreb held its 14th Session, which dealt with the issues of speeding up goods and passenger transport operations, developing air transport and intensifying maritime transport services. As regards international road transport, Morocco had concluded a regional agreement within the AMU in May 1990 (Section 2.3.3). The authorities have explained that an updated version of that agreement was signed in 2009 and would be applied upon the opening of the borders between Morocco and Algeria.
4.6.1 Road transport
4.5. Road transport is the principal mode of domestic goods transport, with lorries being used for 75% of domestic freight (phosphates excluded).272 Road transport has developed considerably since 2008, partly thanks to the process of sectoral reform that began in 2003 and partly thanks to the major investments made. The length of the road network has increased substantially, under the impetus of the second National Rural Roads Programme (PNRR II). The highway network (1,511 km) belongs to the State and is managed by the Moroccan National Highway Company (ADM), under a 50-year concession financed by tolls.
4.6. The reform of road haulage dates from the entry into force in 2003 of the law that abolished the haulage monopoly of the National Transport Board (ONT) and liberalized the transport of goods by road.273 Road freight prices were liberalized in February 2004. In 2007, the ONT was converted into the National Transport and Logistics Company (SNTL), a 100% publicly owned joint-stock
270 WTO, I-TIP database on Morocco's commitments under the GATS.271 Viewed at: http://www.mtpnet.gov.ma/Actualites/Pages/Actualites.aspx?IdNews=921.272 MEF (2013b).273 Law No. 16-99 amending and supplementing Dahir No. 1-63-260 of 12 November 1963 relating to
motor vehicle transport by road.
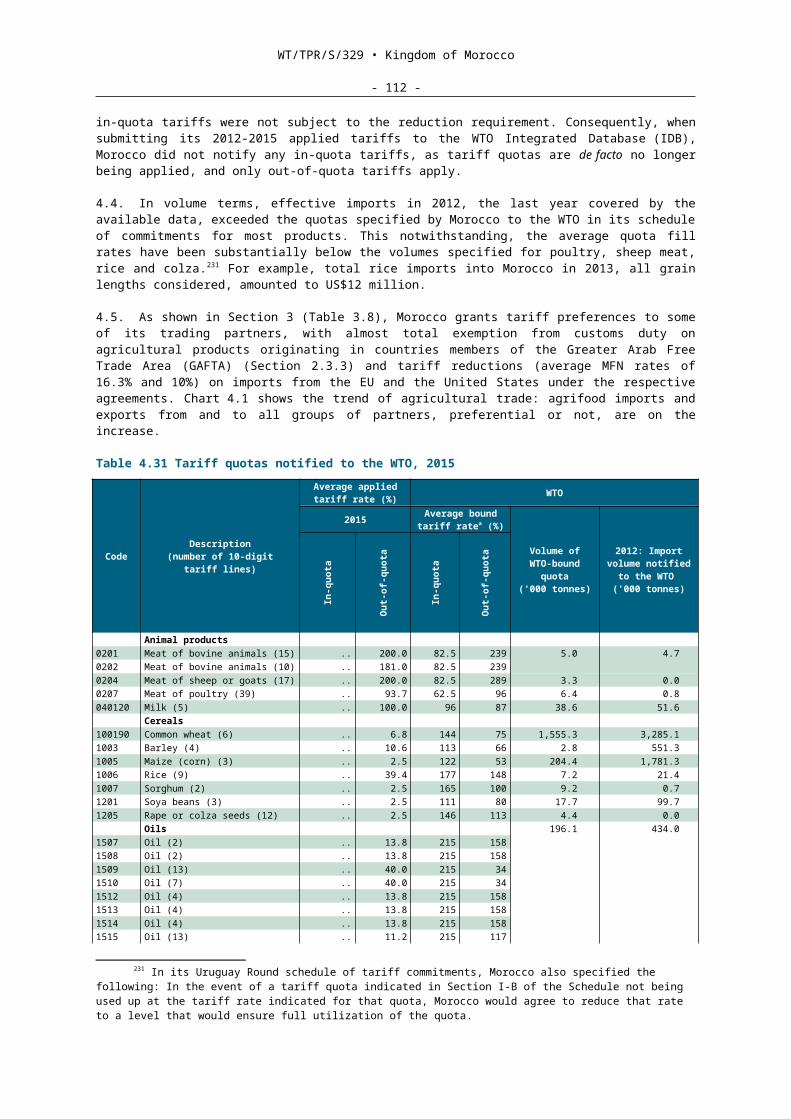
WT/TPR/S/329 • Kingdom of Morocco
- 112 -
company274 that owns a fleet of some 100 vehicles and provides, in particular, domestic and international transport services.275
4.7. The transport of goods and passengers by road, whether from one place to another within Morocco or to or from Morocco, remains reserved for companies established under Moroccan law. The same nationality requirement applies to the provision of commercial vehicle rental services and maintenance and servicing services, as well as to services related to road transport.
4.8. Foreigners wishing to provide these services must set up a company under Moroccan law, with a majority of the capital in Moroccan hands and a Moroccan manager, and register it with each regulatory body of the region in which the company wishes to offer its services. However, this provision requiring Moroccan nationality was amended in March 2006 following the FTA with the United States. Since then, these activities may also be carried on by natural or legal persons belonging to States with which Morocco has concluded a duly ratified FTA. According to the authorities, this change has not had any impact in the field.276
4.9. International agreements specify the apportionment of loads transported internationally between partner countries (Table 4.15). Quotas are fixed by joint committees and carnets authorizing movement within the national territory are issued to foreign carriers by the ADII border customs office, to cover transport to the destination of the goods declared.
4.10. TIR return loads (when foreign companies load goods for export) remains prohibited, except where authorized by the government authority responsible for transport. In 2010, such authorizations were granted to France (300) and the United Kingdom (100).
Table 4.41 Bilateral TIR agreements, 2015Partner countries Customs and tax regimeAll partners Temporary admission of vehicles, personal effects, tools and spare
parts. The temporary admission tax applies to vehicles registered abroad when entering Morocco under the temporary admission procedure. The estimated amount of this tax can be calculated on the Customs Administration's website.
France, Spain, Belgium and Luxembourg, Netherlands, Switzerland, Italy, Poland, Great Britain and Ireland, Denmark, Hungary, Romania, Portugal
Exemption from payment of the daily tax of 10 DH/tonne
Sweden, Finland, Germany, Austria Payment of the daily tax of 10 DH/tonne Source: Customs and Excise Administration, 2010.
4.11. Moroccan participation in the international road transport market for exports is still limited. In 2015, Moroccan carriers controlled only 5% of the transport market for industrial goods bound for Europe. This appears to be due, in particular, to the increasing difficulties faced by Moroccan drivers in obtaining visas and the numerous authorizations required, together with the related costs.277
4.12. In order to reduce transport costs, while providing financial support for road transport companies, since 2002 the Government has provided various forms of VAT relief such as:
exemption from VAT, with right of deduction, on all international transport operations and the supply of related repair, servicing, maintenance, conversion, chartering and rental services;
exemption from VAT on the purchase (domestic or by importation) of coaches, lorries and equipment needed for international road transport activities.
274 Dahir No. 1-05-59 of 23 November 2005 enacting Law No. 25-02 on the establishment of the SNTL and the dissolution of the ONT.
275 EuropeAid Cooperation Office (2010).276 Dahir No. 1-06-55 of 14 February 2006 enacting Law No. 48-05 supplementing Dahir No. 1-63-260 of
12 November 1963 on road transport by motor vehicle; viewed at: http://adala.justice.gov.ma/production/html/Fr/liens/..%5C120989.htm .
277 Viewed at: http://www.lavieeco.com/news/economie/le-transport-international-routier-marocain-a-l-agonie-33433.html [April 2015].
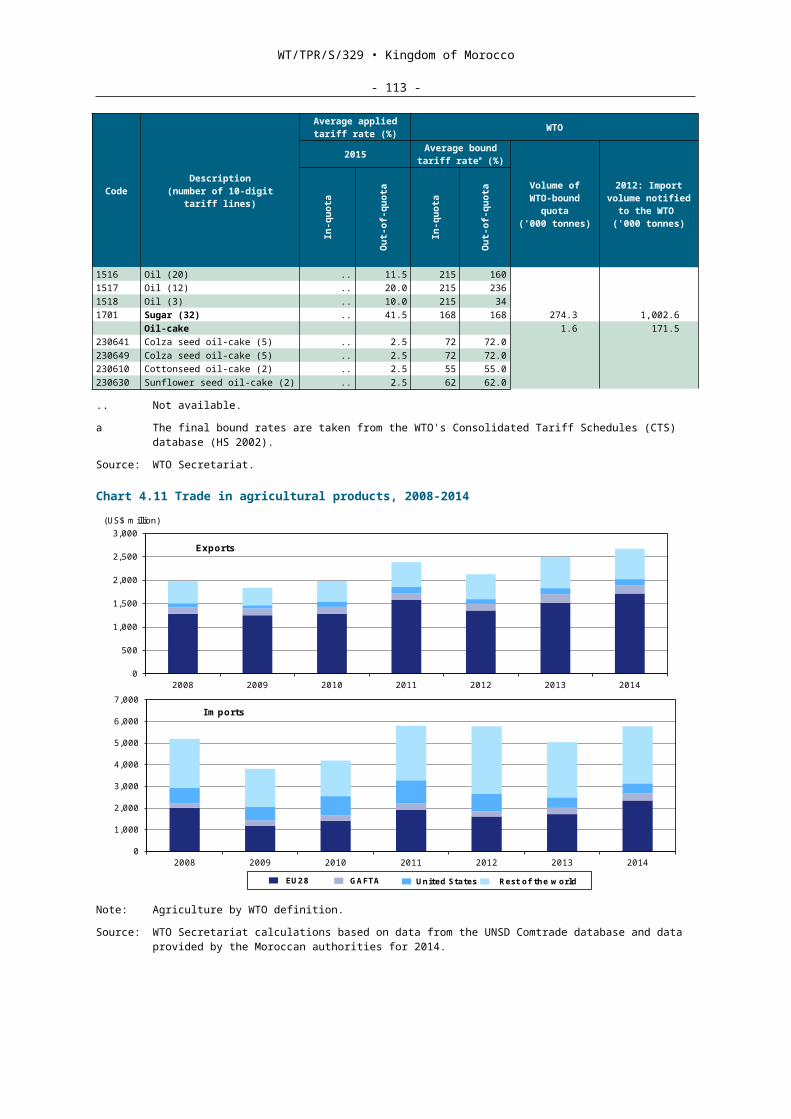
WT/TPR/S/329 • Kingdom of Morocco
- 113 -
4.13. Motor vehicles for the transport of goods and passengers are subject to the payment of an axle tax that varies between DH 800 and DH 11,000 per annum, unchanged since 2008. The other taxes currently being imposed on the transport of goods and passengers by road are the annual load tax on road vehicles for the transport of goods on own account whose TLW exceeds 3.5 tonnes (DH 20/tonne); and the urban tax on coaches for the public transport of passengers for the benefit of local authorities (depending on the nature of the coach), amounting to about DH 500 per year278; these taxes are applied in the same way to both domestic and foreign carriers.
4.6.2 Rail transport
4.1. Morocco's rail network is one of the largest in Africa. It comprises more than 2,100 km of line, of which nearly 1,300 km is electrified and 633 km dual-track; 120 stations; and 5,500 goods wagons, of which 715 were recently purchased. A public investment programme amounting to DH 33.8 billion or nearly €3 billion over the period 2010-2015 is being implemented to develop and modernize the network, including the construction of a high-speed link between Tangiers and Casablanca, via Kenitra, together with the modernization of the existing network and the construction of a network of logistics hubs with dry ports and logistical activity zones.
4.2. The State still retains a de facto monopoly on the construction, operation and management of railroads for transporting passengers and goods, through the National Railway Board (ONCF). The ONCF operates in three markets, namely, phosphate transport, freight transport and passenger transport. In 2014, the ONCF's total earnings amounted to DH 3.6 billion, an increase of 2.5% on 2012 and 56% on 2004.279
4.3. In 2015, the French National Railway Company (SNCF) and the ONCF signed an agreement to set up a joint company to maintain the future Moroccan high-speed rail service (TGV). The maintenance contract is for a 15-year term. Other projects for this joint subsidiary would involve maintenance or support for the activities of the SNCF in France. Moreover, the ONCF is also a Rail-Route operator through its subsidiary SUPRATOURS SA, which operates on road links in continuation of rail services, and the company CARRE for end-to-end freight transport.
4.4. The ONCF's vision for the development of its freight and logistics activity seeks to ensure strong growth in the current markets and to position the ONCF group in logistics (dry ports of container terminals under customs control, logistical activity zones). The Hydrocarbons Logistics Plan consists of building railway terminals dedicated to hydrocarbons at storage and transit hubs with rail connections. The Cereals Logistics Plan consists of building cereal storage silos on hubs slotted into the railway network. Other projects reflect the efforts of the ONCF to position itself in the logistics market, in particular by transporting motor vehicles in association with Renault. Vehicles produced in the future Peugeot factory will be transported exclusively by rail.
4.5. Since its enactment in 2005, Law No. 52-03 of 2005280 has opened up the sector to competition from new operators. It provides for railway activities to be entrusted to enterprises through concession agreements concluded with the State for the management of the infrastructure of a particular part of the network or its construction and/or operation. Technical and commercial operation can also be carried out under a rail transport operating licence issued by the State.
4.6. Law No. 52-03 also provided for the establishment of the Moroccan Railway Company (SMCF), a 100% State-owned joint-stock company intended to replace the ONCF. In 2015, this company had not yet been established. The authorities have explained that an institutional study is being conducted to amend Law No. 52-03 and to apply new legislation under the national strategy "RAIL 2040", which would simultaneously encompass the construction of the infrastructure, its management and the provision of transport services.
4.6.3 Maritime transport
4.6.3.1 Transport services
4.1. Following major structural changes, the Moroccan-flag international commercial fleet was reduced to seven operational vessels in 2015. In 2008, the coverage provided by Moroccan ship
278 Fees are charged for the use of and transit through coach terminal facilities, where they exist.279 Economic Foresight Institute for the Mediterranean Region (IPEMED) (2014).280 Dahir No. 1-04-256 of 7 January 2005 enacting Law No. 52-03 on the organization, management and
operation of the national rail network.
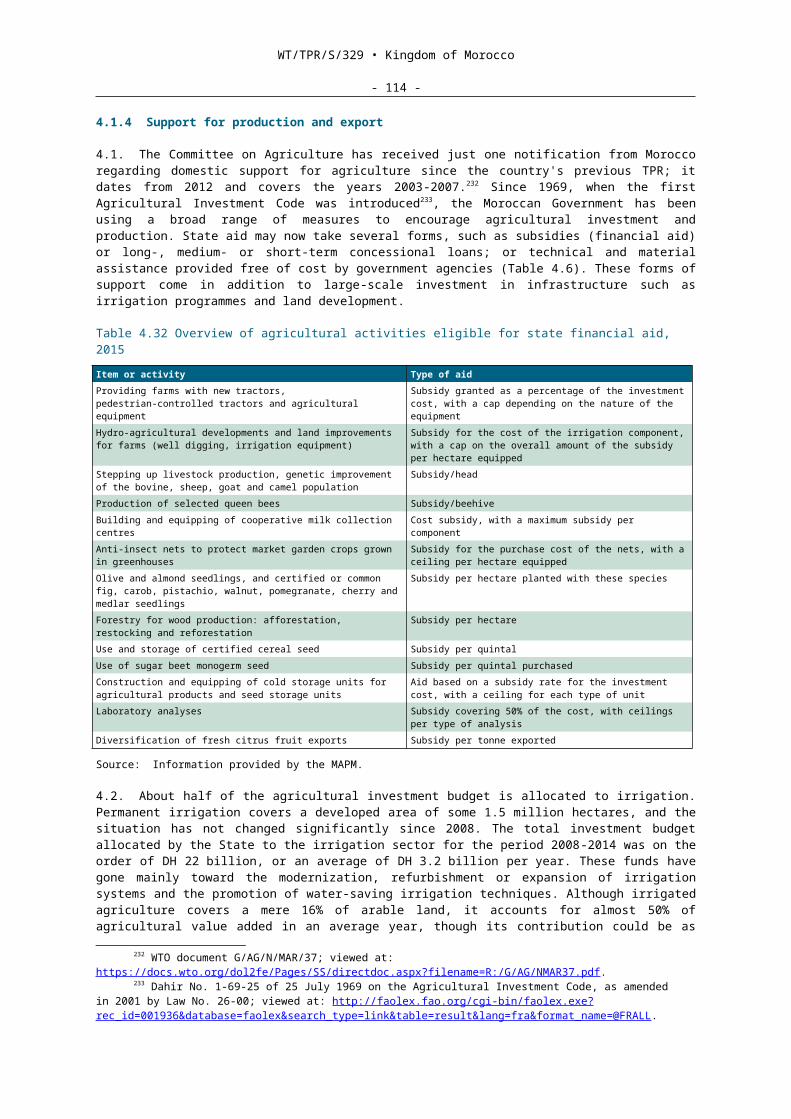
WT/TPR/S/329 • Kingdom of Morocco
- 114 -
owners was approaching 11%. The private ship owners established under Moroccan law which provided most of that coverage included: the Moroccan Shipping Company (COMANAV), the International Maritime Transport Corporation (IMTC), COMARIT and Marphocean. COMANAV has been taken over by the French maritime transport group CMA CGM, while IMTC is currently experiencing financial difficulties. COMARIT, which bought up COMANAV's passenger arm, is in administration and Marphocean has been dissolved.
4.2. In 2015, three global multinationals controlled the Moroccan market for the transport of containers by sea (CMA CGM, MSC and MAERSK), an oligopolistic situation which, as elsewhere, does nothing to encourage competition. Maersk is the concessionaire for Tanger-Med's first container terminal, which it serves with foreign vessels. For the Tangiers-Casablanca leg, the company relies on the Moroccan flag vessel Tinghir. Maersk also offers a feeder service to Casablanca from foreign ports. CMA CGM has a Moroccan vessel Ouez Ziz, which enables it to engage in cabotage between Tanger-Med and Casablanca. Apart from the solid bulk traffic, for which there are no Moroccan-registered vessels, domestic cabotage remains reserved for ships flying the Moroccan flag, and inward forwarding is treated in the same way as cabotage.
4.3. Overall, however, the number of regular container services increased from 21 to 29 routes between 2006 and 2011.281 In 2015, Morocco rose from 84th to 16th place in terms of connectivity. The port of Tanger-Med is connected to 161 ports and is one of the foremost ports in Africa.
4.4. The liberalization of goods transport, which began in 2006, involved the freight carried on regular routes, with Moroccan flag vessels being allowed to operate freely, without prior authorization, on all maritime routes serving Morocco, without restriction, and being guaranteed the right to resort to chartering at any time to respond to market opportunities. Then, in July 2006, direct international services from or to Moroccan ports were opened up to international competition. In July 2007, foreign flag vessels (self-owned or chartered) were allowed freely to operate wayport and transhipment services from or to Moroccan ports.
4.5. The conditions for flying the Moroccan flag are as follows: the vessel must use Moroccan ports and have a port of registry in Morocco; it must be 75% owned by Moroccans and a majority of the members of the board of directors must be of Moroccan nationality; and the members of the crew must be Moroccans. At present, vessels sailing under the Moroccan flag are confined to passenger and cabotage traffic.
4.6. In 2007, passenger maritime transport was also liberalized, though to a lesser degree. Ministerial Decision No. 82/1 on passenger maritime transport or mixed transport (passengers and freight) provides for specifications that establish the conditions of access to this traffic. In 2015, two new Moroccan shipping companies – Naveline and Intershipping – were authorized to operate shipping routes for transporting passengers and vehicles between Morocco and Spain. In general, however, domestic passenger maritime transport is reserved for Moroccan vessels, while international passenger transport is governed by the bilateral agreements that Morocco has signed with its foreign partners, which provide for "balanced participation in the traffic by the two parties".
4.6.3.2 Port services
4.1. Morocco has 13 international trade ports, 12 regional fishing ports, 9 local fishing ports and 6 marinas.282 The total volume of trade through Morocco's ports amounted to 115 million tonnes in 2014, i.e. 14% up on 2013 and nearly twice the volume in 2008. This increase is partly attributable to the growth of container transhipment traffic, as well as to the increase in import-export trade (Chart 4.7).
4.2. Morocco's largest port is Tanger-Med, followed by the port of Casablanca. The main ports are described in Table 4.16. Port activity has expanded with the completion of the Tanger-Med port terminal, which is now a major Mediterranean transhipment hub, partly thanks to its favourable tax regime and its geographical location close to the Straits of Gibraltar. Tanger-Med alone has increased national petroleum product storage capacity by 25%, while developing an important bunkering activity. There is now competition between the ports of Casablanca and Tanger-Med in the container import-export segment.
281 Viewed at: http://www.leconomiste.com/article/908995-transport-maritime-des-pistes-pour-renflouer-le-pavillon-marocain.
282 METL (2014).
WT/TPR/S/329 • Kingdom of Morocco
- 115 -
4.3. Tanger-Med is still the country's fourth port in import-export terms, after Casablanca, Jorf Lasfar and Mohammedia. The first part, Tanger-Med I, opened in 2007, has two container terminals. The first of these is managed by APM Terminals (EU) and the second by EUROGATE/Contship (EU). In 2014, it recorded more than 3 million TEU containers.283 The Tanger-Med II extension should enter into service in 2016 and have two additional container terminals. One of them has been put out on concession to MARSA Maroc, the main (State) port operator, which manages the country's other ports.
Chart 4.17 Trends in port traffic, transhipment excluded, 2003-2014
.0
10.0
20.0
30.0
40.0
50.0
60.0
70.0
80.0
90.0
2003 2004 2005 2006 2007 2008 2009 2010 2011 2012 2013 2014
Imports Exports
(million tonnes)
Source: METL (2014), Le METL en chiffres (The METL in figures); viewed at: http://www.mtpnet.gov.ma/Gouvernance/Chiffres-cles/Documents/METL-en-chiffres-version-francaise.pdf.
Table 4.42 Indicators for the main ports, 2015
Casa
blan
ca
Agad
ir
Moh
amm
edia
Tang
er-M
ed I
Tang
er-M
ed II
Number of vessels arriving 2,879 1,142 578 .. ..International .. .. .. .. ..Domestic cabotage .. .. .. .. ..
Storage areas (ha) 226 151 50 14 78Tonnes unloaded (million) 25.1 4.2 11.3 .. ..Containers unloaded (TEU) 846,714 159,774 .. 2,969,582 ..Passengers disembarked .. .. .. .. ..Warehouses .. .. .. .. ..Connections - Highway
- RailHighway
(Agadir-Marrakesh)- Highway- Rail
- Highway- Rail
ManagementOwner of the port State State State TMSA SA StateManager of the port ANP ANP ANP TMPA TMPAContainer terminal operator SODEP + SOMAPORT SODEP APM Terminals and
Eurogate / Contship
MARSA Maroc
Container handling SODEP + SOMAPORT SODEP .. .. ..Bulk handling SODEP + SOMAPORT
+ OCP + Mass Céréales + SOSIPO
SODEP SODEP .. ..
Certification ISO 9001 .. .. .. .. ..
.. Not available.Source: WTO Secretariat, based on information provided by the authorities.
283 ANP (2014).
WT/TPR/S/329 • Kingdom of Morocco
- 116 -
4.4. Tanger-Med mainly concentrates on container transhipment activities. It also comprises a hydrocarbons terminal and a railway terminal managed since January 2013 by the Moroccan railway operator (ONCF), under a ten-year management agreement between the Tanger-Med Port Authority (TMPA) and the ONCF.
4.5. The number of passengers transiting through Morocco's ports is around 4.4 million, including 418,000 cruise ship passengers.284
4.6. Inaugurated in 2009, the dry port (under customs control) of CASABLANCA MITA is Morocco's first dry port. Its services include handling, container storage, and rail transport to the various business centres.285
4.7. In most ports, port activities are regulated by the National Ports Agency (ANP). The port of Tanger-Med is an exception, being under the authority of the Tanger Méditerranée Special Agency (TMSA), established in September 2002.286 In 2008, with a view to optimizing the operational efficiency of TMSA's two activities, namely, the port and its zones of operation, and to increasing its development capacity, TMSA began a process of subsidiarization which led to the establishment of a subsidiary dedicated to port services, the company Tanger-Med Port Authority (TMPA). In January 2010, all the missions and public prerogatives relating to the management and development of the port complex were transferred to Tanger-Med Port Authority by decree-law, as a consequence of which it is now acting as the port authority for Tanger-Med.
4.8. The ANP is under the authority of the METL. The ANP's budget is made up, in particular, of concession and permit fees and port charges from the ports within its jurisdiction. The port charges collected by the ANP for port services include those for vessels; those for goods and passengers; and those for fishery products.
4.9. All port activities are subject to the provisions of Law No. 15-02, namely, the concession regime or the authorization regime, after invitation to tender. MARSA Maroc has a concession to operate terminals in the ports and carries out its activities concurrently with other public or private operators. The concessionary activities conducted by the port operations company SODEP include, in particular, pilotage, towage, berthing and refuelling, together with handling, storage, weighing, and container stuffing and de-stuffing, in the port of Casablanca. Port users have a choice between MARSA Maroc and SOMAPORT for container and bulk handling; Mass Céréales and SOSIPO handle grain.
4.10. For its land use management and urban planning activities around the port of Tanger-Med, TMSA is exempt from the payment of corporation tax and VAT and qualifies, together with the companies participating in the implementation of the project, for the concessions granted to export free zone (ZFE) enterprises (Section 2.4.2). The ANP does not qualify for these concessions.
4.6.4 Air transport
4.6.4.1 Transport services
4.1. Liberalization of the market for air transport services since 2004, particularly at international level, largely explains Morocco's performance with respect to connectivity (see above), as well as the considerable increase in passenger traffic. The access regime has been liberalized for air transport services and for ground handling services. Tariffs are lower and flights are more frequent. However, as in other countries, Moroccan air transport is governed by bilateral agreements which limit competition in this market.
4.2. In 2014, total passenger traffic amounted to 17.3 million passengers. Morocco has 19 international airports. In 2014, 43 airline companies, including 16 low-cost airlines, were offering scheduled links with 50 countries and 113 foreign airports. The Moroccan airlines are: Royal Air Maroc (RAM) and its low-cost subsidiary RAM Express, which are partly State-owned, and Air Arabia (Maroc), which is private.
284 ANP (2014).285 Viewed at: http://entreprise.oncf.ma/NosProjets/Pages/PlatesFormesLogistiques/
PlatesFormesLogistiques.aspx . 286 Article 32 of Law No. 15-02 of 2002 on ports.
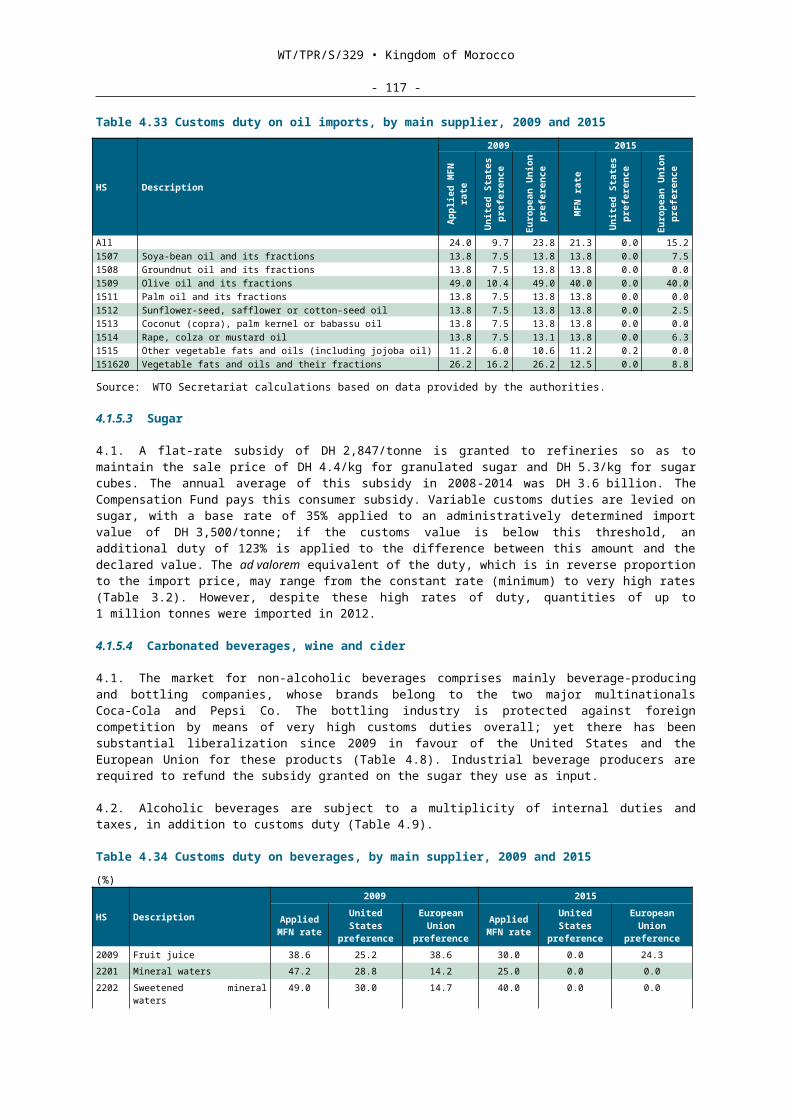
WT/TPR/S/329 • Kingdom of Morocco
- 117 -
4.3. Casablanca airport accounts for about half of the country's total international traffic and forms a main hub with over 700 flights every week. The airport of Marrakesh mainly receives tourist flights, the performance of the Moroccan air transport sector being closely linked with that of tourism.
4.4. Morocco has concluded a hundred or so air transport agreements. In particular, an Open Skies Agreement was concluded between Morocco and the United States in 2001. It provides for bilateral liberalization of air services, but not of investment in airlines. In 2008, the Euro-Mediterranean Air Transport Agreement liberalized the fares of the various operators and the capacity of the aircraft but did not provide for fifth freedom rights. In response, the low-cost companies have raised the annual number of seats for Morocco from 3 to 11 million.287 This opening up to competition created the need for a restructuring plan for RAM covering the period 2011-2013; substantial cuts were made in both its personnel and its fleet and loss-making routes were closed down. In 2012, the State began providing support in the form of an increase in capital and by taking responsibility for pilot training.
4.5. The Euro-Mediterranean Agreement envisages two phases, of which only the first has entered into effect. The second provides for the granting of fifth freedom rights, but depends on a process of regulatory convergence, in particular where safety, environmental aspects and passengers' rights are concerned.
4.6. Any enterprise wishing to set up in Morocco must meet the following requirements: 51% of the capital must be held by Moroccan nationals; all the aircraft must have their port of registry in Morocco and be listed in the Moroccan aircraft register. The company must also have its head office in Morocco and hold an operating permit issued by the METL. Under all the agreements cabotage is restricted to Moroccan companies.
4.7. For the period 2012-2016, the METL announced a new air transport development strategy288, whose objectives are to promote the introduction of new international air routes; to increase the frequency of flights on existing international links; to ensure the loyalty of the airlines present in Morocco; to facilitate access for new companies; and to encourage the development of domestic links. As part of the policy of opening up the regions and making them more attractive for business and tourism, the State is granting subsidies for the development of domestic air transport; Morocco does not grant any subsidies for international air carriers.
4.6.4.2 Airport services
4.1. Airport capacity has increased from 12 million passengers in 2004 to 23.5 million today. The infrastructure development projects are aimed at increasing airport capacity to 90 million passengers by 2035.
4.2. Since 2005, the National Airports Board (ONDA) has been pursuing an incentives policy in order to develop air traffic. A new tariff incentive system, to remain in effect from 1 October 2015 to 30 September 2018, consists in granting reductions on airport fees, without discriminating between airlines. According to the authorities, this is in order to promote the introduction of new international air links, increase international flight frequencies, and encourage the creation of new air bases in Morocco. The authorities also want to build up Casablanca Mohammed V Airport as a regional hub and encourage the development of domestic links.
4.3. Morocco's airports all belong to the State. ONDA is responsible for airport management and operation. Only ground handling, catering, aircraft fuel distribution, and air freight processing and handling activities are carried out by the private sector, at the country's main airports. In 2015, ground handling services were provided by RAM Handling, Swissport and Globalia.
4.7 Tourism services
4.1. Tourism is of central importance for the Moroccan economy. In 2014, tourism revenue was of the order of DH 59 billion or nearly 7% of GDP. Although the number of visitors has continued to increase steadily, revenue has been erratic since 2009 (Chart 4.8). In particular, the authorities have noted that tourists' budgets have shrunk, that individual tourism, with bookings made directly
287 Viewed at: http://www.medias24.com/ECONOMIE/ECONOMIE/150058-La-flotte-necessaire-pour-desservir-le-Maroc-estimee-a-226-avions-en-2033.html.
288 METL (2014).
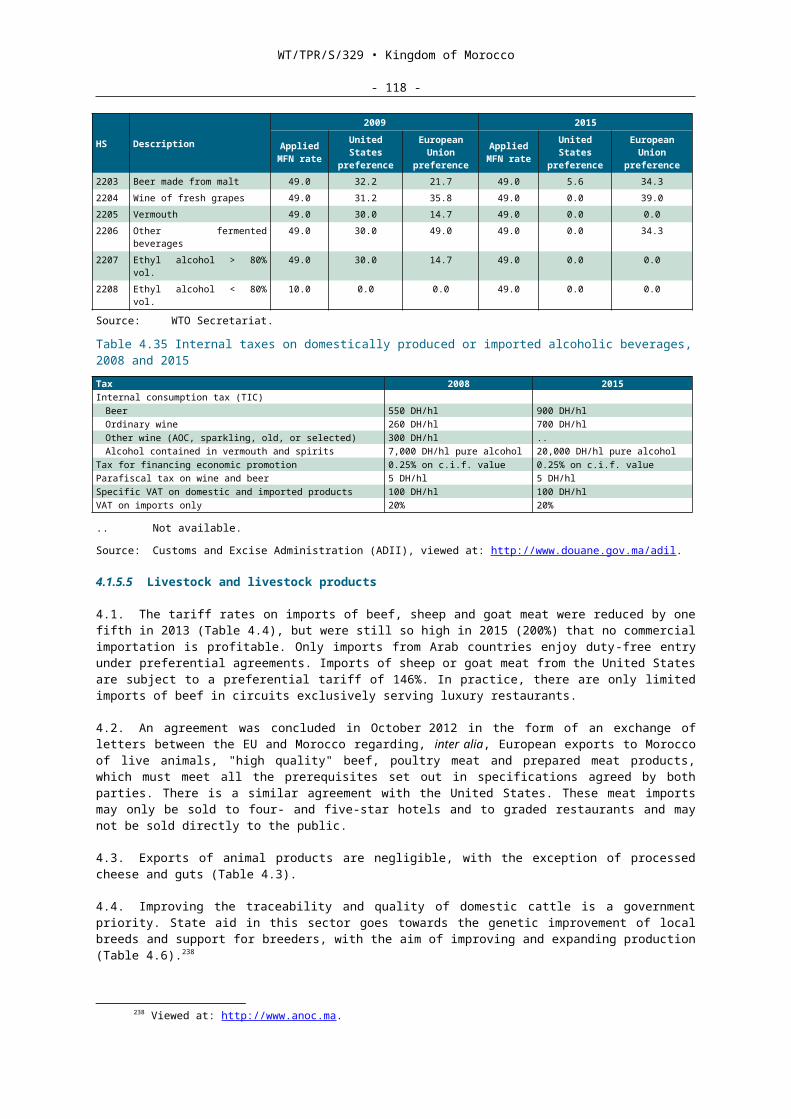
WT/TPR/S/329 • Kingdom of Morocco
- 118 -
through the Internet, has been tending to increase, and that hotel prices for overnight stays have fallen.
Chart 4.18 Tourism: number of arrivals and revenue, 2009-2014
04 04 04 04 05 05
01 01 01 0101 01
0304 04 04
04 04
6,200
6,400
6,600
6,800
7,000
7,200
7,400
0
2
4
6
8
10
12
2009 2010 2011 2012 2013 2014
European Union Other foreign touristsMoroccan nationals resident abroad Excursion revenue (US$ million)
(million) (US$ million)
Source: Information provided by the Moroccan authorities.4.2. Tourism is the country's prime source of foreign currency, generally exceeding the transfers made by Moroccan nationals resident abroad. In 2014, some 10.3 million tourists visited Morocco, as compared with 7.3 million in 2007; nearly half of these were Moroccan nationals (Chart 4.8). Among foreign tourists the French make up the largest group, followed by the Spanish. Tourism generates 420,000 direct jobs (3.8% of the labour force).
4.3. The positive trend in tourism is the combined result of the Government's policies to promote tourism and air transport (Section 4.6.4). Under the "Vision 2010" strategy, which dates from 2001, efforts have been focused on hotel capacity, air transport, the promotion of Morocco abroad, implementation of the Azur and Mada'In Plans, and the gradual liberalization of air transport. Plan Azur provides for the development of six beach resorts with a capacity of 110,000 beds (including 80,000 hotel beds), on 3,000 hectares of land, and an overall investment of DH 46 billion. Plan Mada'In (i.e. the regional tourism development programme) is aimed at repositioning the already existing destinations (Fez, Casablanca, Agadir, Tangiers, Tétouan, Meknes, Rabat, and Ouarzazate-Zagora). The objective of 10 million visitors in 2010 was almost achieved (Table 4.17). For its part, Plan Azur envisaged DH 80 to 90 billion of hotel investment and the construction of 80,000 additional rooms, 600,000 new jobs, and a contribution from tourism to GDP of nearly 20%, objectives which have not been achieved.
4.4. In May 2015, a new world classification of tourism competitiveness by the World Economic Forum (WEF) ranked Morocco 62nd in overall terms out of 141 countries analysed, nine points higher than in the 2013 edition. However, the fall in property prices in the crisis-hit European tourist areas, such as Spain and Greece, has reduced the relative competitiveness of the Moroccan destinations.
Table 4.43 Tourism: number of arrivals and revenue, 2008-2014 2008 2009 2010 2011 2012 2013 2014Number of arrivals (million) 7.9 8.3 9.3 9.3 9.4 10.0 10.3
Moroccans living abroad 3.7 4.0 4.4 4.4 4.4 4.7 4.8Foreign tourists .. 4.3 4.9 4.9 5.0 5.3 5.4European Union .. 3.4 3.9 3.9 3.9 4.0 4.1
Excursion revenue (DH million) 55,551 52,834 56,422 58,904 57,835 57,572 59,317Excursion revenue (US$ million) 7,221 6,626 6,703 7,281 6,703 6,854 6,809Classified accommodation capacity (beds) .. .. 176,630 187,827 198,211 207,566 216,386FDI in tourism (inward flows, DH million) 5,675 2,873 4,059 2,565 1,639 3,389 3,390Excursion revenue
Percentage of GDP 8.1 7.2 7.4 7.3 7.0 6.4 6.4Share of exports of goods and services (%) 21.7 25.4 22.2 20.6 19.5 19.6 ..
WT/TPR/S/329 • Kingdom of Morocco
- 119 -
2008 2009 2010 2011 2012 2013 2014Share of exports of services (%) 47.2 44.7 45.5 45.8 43.7 47.8 ..
.. Not available.Source: Information provided by the authorities. World Bank, World Development Indicators. World Tourism
Organisation, Compendium of Tourism Statistics, 2013 edition. IMF, International Financial Statistics; viewed at: http://elibrary-data.imf.org.
4.5. The tourism promotion budget varies considerably from one year to another: it rose sharply in 2013, from DH 617 million to DH 820 million, but appears to have fallen back to DH 500 million in 2014. According to the authorities, this expenditure on promotion is essential for the sector's performance.
4.6. The promotion budget amounts to DH 500 million or about 0.8% of tourism turnover (DH 60 billion). This percentage is less than the recommendations of the World Tourism Organization (UNWTO), according to which this budget should range between 1.5% and 3% of the branch's turnover. The Government has announced that the budget of the Moroccan National Tourism Board (ONMT) will be raised to DH 1 billion in 2015. The air travel tax, introduced by the 2014 Finance Law (100 DH/economy ticket and 400 DH/higher-class ticket), provides a substantial part of the State's tourism promotion budget.
4.7. Foreign direct investment (FDI) in tourism has increased considerably, from DH 332.4 million in 2001 (1% of total FDI) to DH 7,925.5 million in 2006 (31% of total FDI).
4.8. The main legal instruments governing the sector have not changed since 2009; Law No. 61-00 on the status of tourist facilities and its implementing decree both date from 2002.289 The rules for the classification of hotels and restaurants date from 2003.290 In 2008, a Law on Tourism Promotion Real Estate Developments (RIPT) was enacted to include apartment hotels, guesthouses and new forms of accommodation as classified tourist facilities.291 New specifications establishing the conditions of access to and exercise of the tourist road transport activity were signed on 10 February 2009.292 The other new instruments adopted since 2008 mainly concern tourism promotion real estate developments, tourist accommodation, tourist guides, and tourist road transport.
4.9. The Ministry of Tourism is responsible for formulating and implementing government policy in the sector. The ONMT is in charge, among other things, of promoting Morocco as a destination. The Tourism Observatory (OT) was set up in the form of a non-profit (public-private) partnership. Its main purpose is to monitor the tourism economy by collecting and publishing information, in particular on market conditions, competition, the competitiveness of the destination, and operating standards.
4.10. Moreover, to support the efforts to promote investment in tourism, Law No. 10-07 of 30 November 2007 established the Moroccan Tourism Engineering Company (SMIT), a public company whose tasks include: carrying out the studies needed to define and implement the tourism development strategy; negotiating and monitoring agreements with private tourist area developers; and measures to stimulate interest in tourism development among potential investors.
4.11. Various incentive measures are in place to promote investment in tourism. Investment is eligible for tax relief, State financing, and other concessions granted by the Investment Charter (Section 2.5), the various Finance Laws, the Hassan II Fund, or specific provisions (Table 4.18).
289 Viewed at:http://www.tourisme.gov.ma/Telechargements/TexteReglementaire/LOI%20N%2061-00%20.pdf and http://www.tourisme.gov.ma/Telechargements/TexteReglementaire/Décret%20d'aplication%20loi%2061-00.pdf. The legal texts were viewed on the Ministry of Tourism's website at: http://www.tourisme.gov.ma/fr/entreprises-et-activit%C3%A9s-touristiques/annuaire-des-textes-juridiques.
290 Order of the Minister of Tourism No. 1751-02 of 18 December 2003 establishing the rules for the classification of tourist facilities, in force since March 2004.
291 Dahir No. 1-08-60 of 23 May 2008 enacting Law No. 01-07 decreeing special measures relating to tourism promotion real estate developments and amending and supplementing Law No. 61-00 on the status of tourist facilities.
292 The specifications lay down standards such as the minimum size of the vehicle fleet (52 seats),vehicle maintenance, medical supervision for the drivers, etc.
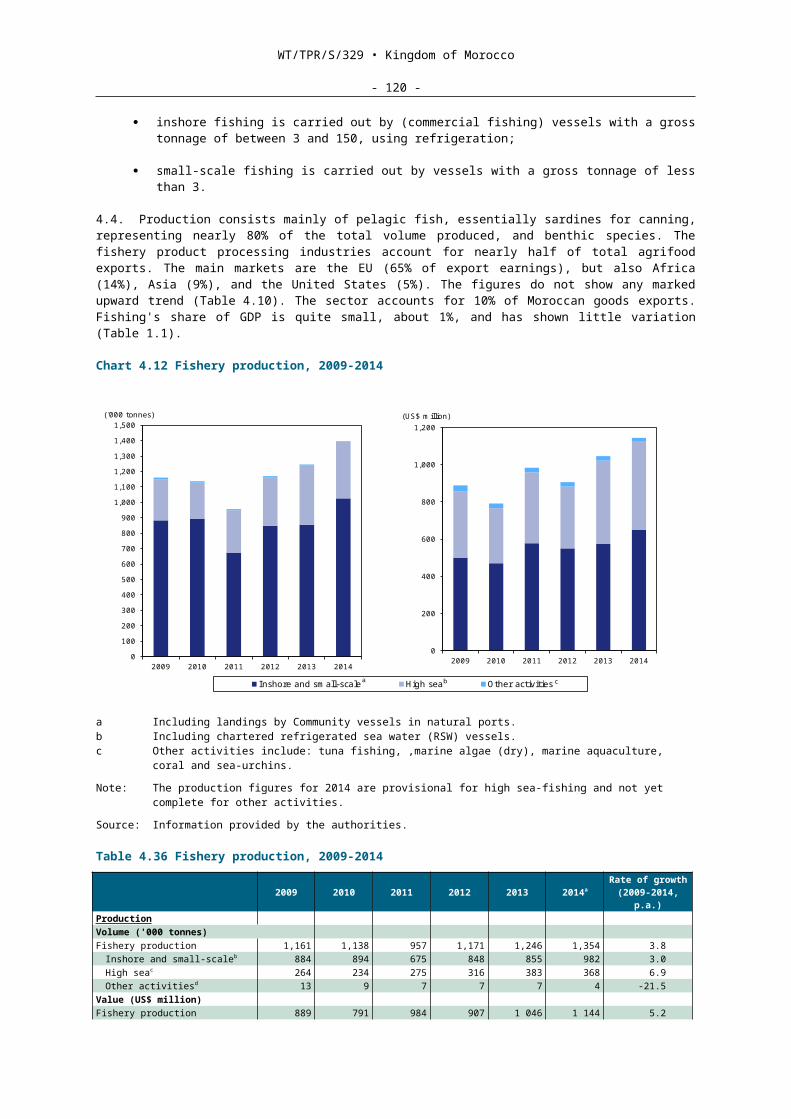
WT/TPR/S/329 • Kingdom of Morocco
- 120 -
Table 4.44 System of incentives for investment in tourismTax Description of incentiveRegistration fees Reduction in the fees for establishing tourism companies, with a rate of 1% instead of 6%
Exemption from registration fees for purchase deeds for land to be used for investment projects within a maximum period of 36 months Reduced rate of 1.5% instead of 6% for registration fees for emphyteutic leases on properties to be used for hotels and ancillary buildings Reduced registration fees for the sale of businesses
Customs duties Exemption for investments amounting to DH 20 million or more under agreements concluded with the Government
Corporation tax (IS) and income tax (IR)
Total exemption from IS or IR on the part of the tax base corresponding to the turnover of hotel companies in foreign currency over a period of five years and a 50% reduction as from the sixth year Reduction of 50% in IS for five years for all companies setting up in the following provinces: Larache, Nador, Tangiers, Asilah and Tétouan, among others Reduction of 50% in IS, without any time-limit, for any company setting up in the province of Tangiers, which can be combined with the aforementioned benefits
VAT Exemption for capital goods, equipment and tools, purchased domestically or imported, entered in a capital asset account and used for operating purposes, for 36 months Rate reduced to 10% instead of 20% for hotel enterprises, with right of deduction in respect of lodging, restaurant, and hotel and tourist facility letting operations
Professional tax and local occupancy tax
Total exemption, for a period of five years, for investment in business creation and for any additional investment or extension
Financing Partial State participation, through investment agreements, in the expenditure associated with the purchase of land, the completion of the external infrastructure and professional training for businesses whose investment programme is very considerable by reason of: the amount (more than DH 100 million), the number of jobs created, the location, the technology or its contribution to the protection of the environmentSubsidy equal to 50% of the cost of the land (with a ceiling at a maximum of DH 250/m²) for hotel investors for the purchase of sites for tourist facilities Availability to developers of land for servicing tourist resorts and areas at attractive prices, as well as the total funding or participation in the cost of off-site infrastructure needed to supply drinking water and power or create road linksCredit for renovation through the Hotel Unit Renovation Fund RENOVOTEL, at a preferential interest rate of 2% per annum (excl. VAT) (with a ceiling fixed by categories of accommodation)
Other benefits Free convertibility guaranteeing foreign investors total freedom to transfer profits net of tax (capital, capital gains and income)Reduction of 100% on dividends and other yields from holdings received by businessesReduction and exemptions for capital gains and profits made when disposing of or selling fixed assetsCeiling of DH 50 million on the basis used to calculate the rental value of taxable investmentState funding of the off-site infrastructure needed to develop new tourist areasPartial State funding of hotel staff training
Source: WTO (2009), Trade Policy Review - Morocco, and online information from the Ministry of Tourism, Axes stratégiques (Strategic Outlines); viewed at: http://www.tourinvest.ma/main.php?Id=15&lang=fr. Information provided by the Moroccan authorities.
4.12. The Moroccan Tourism Development Fund participates in the launching of tourism projects. It is financed from the State budget and by grants from foreign sovereign funds.
4.13. Morocco has concluded 52 tourism cooperation agreements and 11 others are in process of being signed.293 Morocco is a member of the World Tourism Organization and became a member of its Executive Council in September 2015. It is also a member of the Council of Arab Tourism Ministers (Arab League) and the Islamic Conference of Tourism Ministers (Organisation of Islamic Cooperation).
4.14. Within the context of the GATS, Morocco has reserved the right to require that travel agencies established outside Morocco provide their services through partners set up within Morocco; this requirement is being applied. Another requirement actually being applied is that foreign (and Moroccan) agencies may not establish a commercial presence in Morocco without an operating licence. The profession of tourist guide is reserved for Moroccan nationals. However, groups may also be accompanied by tour leaders.
293 For the complete list, see online information from the Ministry of Tourism, "Cooperation"; viewed at: http://www.tourisme.gov.ma/francais/1-Administration-tourisme/5-Cooperations/Accordsb.html.
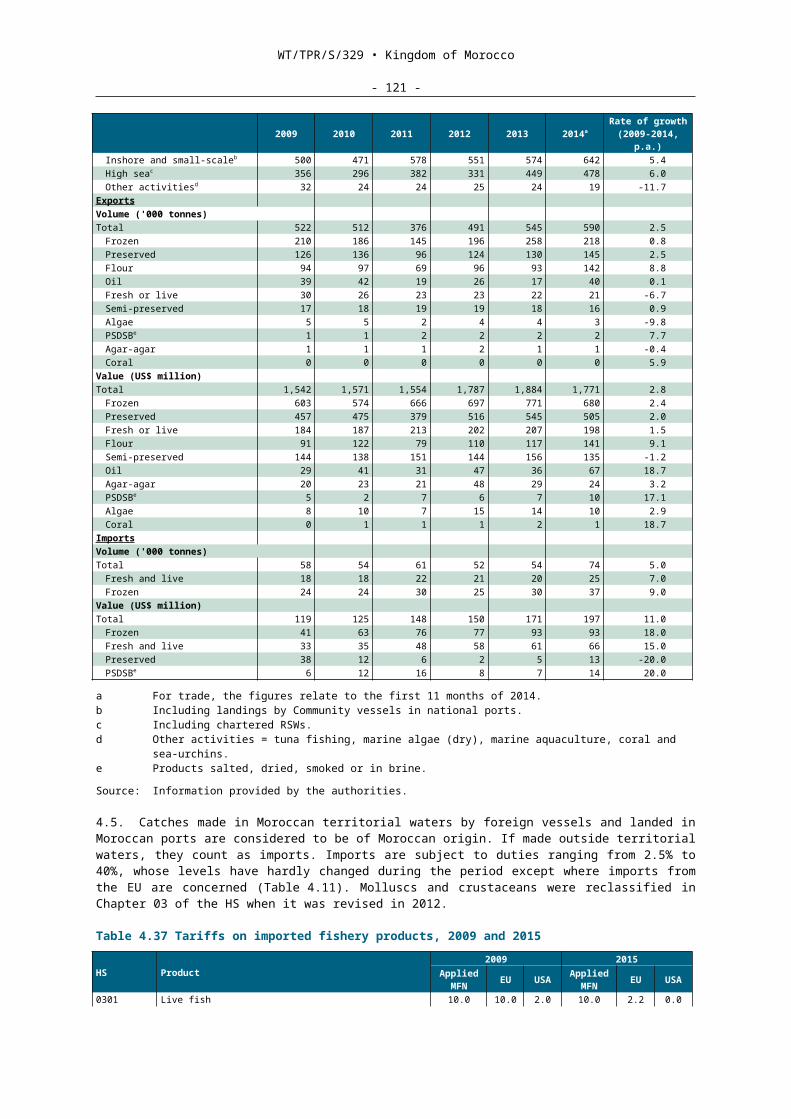
WT/TPR/S/329 • Kingdom of Morocco
- 121 -
4.15. Morocco has undertaken not to impose any limitation on national treatment, on market access or on the following services and modes of supply: hotel services (for modes 1, 2 and 3)294, restaurant services (modes 2 and 3), travel agency services (modes 2 and 3) except for an operating licence, and other tourism services (modes 2 and 3). Moreover, Morocco has bound national treatment for travel agency services (mode 1).295
4.8 Telecommunications services
4.8.1 Overview
4.1. Turnover in the telecommunications sector increased on average by 4% per annum between 2008 and 2011, before experiencing an annual decline approaching 4.6% during the years 2012 to 2014. This decline can be mainly attributed to the strong competition in the various market segments, especially the mobile segment. This competition dragged down prices, with an exponential increase in the number of users (by a factor of five between 2009 and 2014).
4.2. At the end of 2014, three global operators shared the fixed and mobile telephony and Internet market:
Maroc Telecom (Itissalat Al Maghrib (IAM SA)) is Morocco's traditional operator. The French group Vivendi Universal, which held 53% of its equity, sold its entire stake to the operator Etisalat (UAE) in May 2014. The Moroccan State holds 30% of Maroc Telecom's equity and the rest (17%) is held by the public and quoted on the stock exchange. IAM increased its share of the fixed telephony market from 33% in 2010 to 57% in 2014, and its share of the Internet market from 56% to 58%. On the other hand, its share of the mobile market fell from 53% to 41%. However, it still remains a powerful operator in the three markets and the number-one provider of Internet access via ADSL.
Médi Telecom was set up in 1999 by a consortium including, in particular, the Spanish Telefónica group (32%), Portugal Telecom (32%) and the Deposit and Management Fund (CDG). Telefónica and Portugal Telecom withdrew in September 2009, selling their shares to their Moroccan partners FinanceCom (and its subsidiary RMA Watanya) and CDG (and its subsidiary Holdco), which became shareholders on an equal footing. In September 2010, the latter two concluded with the French group France Télécom an agreement allowing it to take a 49% stake in the equity of Médi Telecom in two phases involving the acquisition of 40% in September 2010 and another 9% in the second quarter of 2015. The rest of Médi Telecom's equity is now shared between the FinanceCom Group (25.5%) and the CDG Group (25.5%). At the end of 2014, Médi Telecom held a tiny share (1%) of the fixed telephony market, 31% of the mobile market; and 26% of the Internet market (as against 14% in 2010).
Wana Corporate was the last to enter the market (in 2008). It holds 39% of the market for fixed telephony services with restricted mobility (as against 67% in 2010); 28% of the mobile market (as against 14% in 2010); and 17% of the Internet market (as against 30% in 2010). Wana Corporate is a subsidiary of the Moroccan holding company National Investment Company (SNI), which sold a 31% stake to the Kuwaiti consortium Zain Al Ajial in 2007.
4.3. Among the other operators, Cires Telecom and Moratel SA are shared resources (SHARES) radio network operators; four are operators of public GMPCS satellite telecommunications networks; and three are VSAT operators. All these operators operate in niche markets.
4.8.2 Policy
4.1. The sector is regulated by the National Telecommunications Regulatory Authority (ANRT) established in 1998.296 Its functions include processing licence requests (based on criteria that include quality, territorial coverage, etc.) and authorizations for private networks, as well as allocating frequencies and numbering blocks, auditing operators, regulating competition in the
294 The modes of supply of services relate to cross-border supply (mode 1), consumption abroad (mode 2), commercial presence (mode 3) and presence of natural persons (mode 4).
295 WTO documents GATS/SC/57 of 15 April 1994, GATS/SC/57/Suppl.1/Rev.1 of 4 October 1995 and GATS/SC/57/Suppl.2/Rev.1 of 23 July 2002.
296 Viewed at: http://www.anrt.ma.
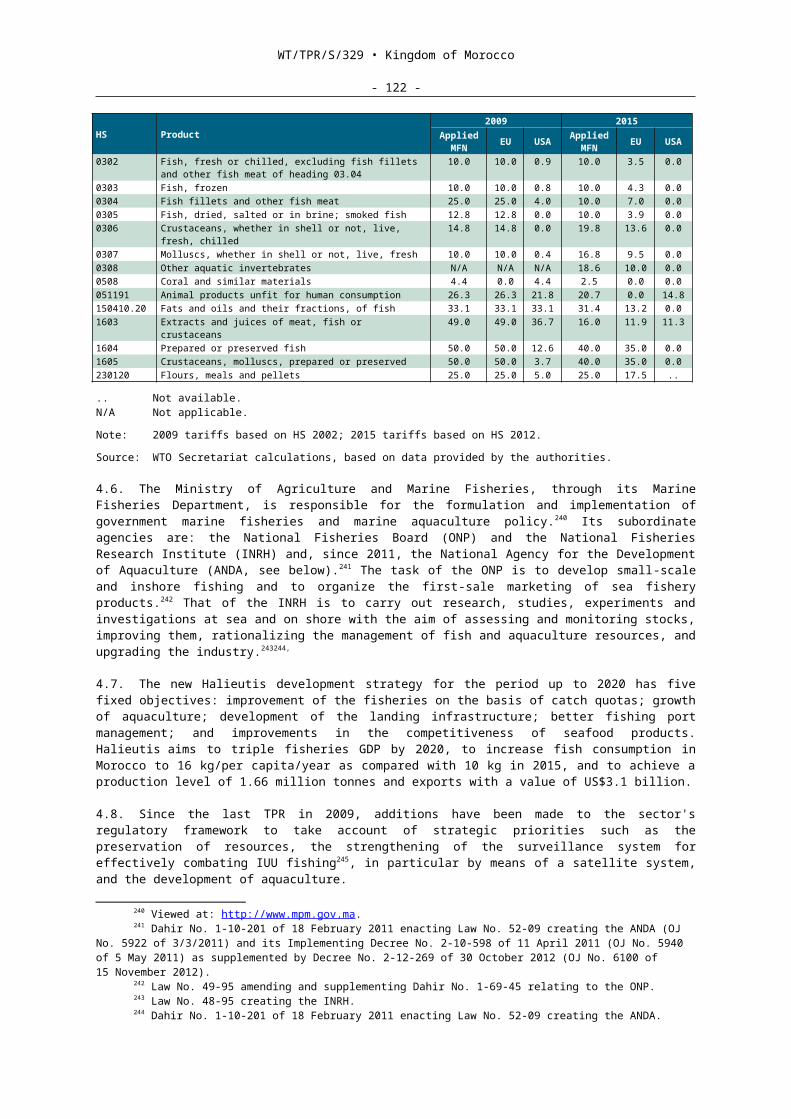
WT/TPR/S/329 • Kingdom of Morocco
- 122 -
telecommunications market, and settling disputes about telecommunications and competition in the sector.
4.2. Licences are granted by decrees issued by the head of government. A second-generation (GSM) licence was granted to Wana Corporate in 2008 and at the end of 2014 an invitation to tender for fourth-generation (4G) licences was issued and resulted in the granting of licences to the three operators in place, namely, Maroc Telecom, Médi Telecom and Wana Corporate. Invitations to tender were also issued at the beginning of 2015 for the granting of GMPCS-, VSAT- and SHARES-type licences, as a result of which two national SHARES-type licences and 3 VSAT-type licences were granted.
4.3. The ANRT is also responsible for monitoring information and communication technology development projects. Moreover, Morocco has adopted Council of Europe Convention No. 185 on cybercrime and its additional protocol, as well as Council of Europe Convention No. 108 on the protection of personal data. The ANRT also manages the domain names ".ma" and domain names in Arabic characters.297
4.4. A national strategy called "Digital Morocco 2013" was adopted in 2010 to modernize society and boost the economy. This strategy has four priorities: to make the Internet accessible to the public and promote access to information exchange and knowledge; the implementation of "e-government", the computerization of SMEs, and the development of information technologies (IT). In the latter case, the objective is to develop services with a strong export potential, such as mobile services, e-money services, web design, computer graphics, multimedia, and locally developed software packages to meet the needs of government and business. To implement this strategy, funds to support innovation and R&D have been set up, together with financing tools for start-ups (for example, Maroc Numeric Fund and the IT Cluster in the Rabat Technopolis offshore zone). Five years on, the Government considers that the main objectives have been achieved.
4.5. Several measures have also been taken to improve competition: a plan setting termination rates for the fixed and mobile network traffic of the operators in place during the period 2010-2013 led to a cumulative reduction in interconnection fees of nearly 75% for mobile networks and more than 40% for fixed networks. The new rates introduced for the year 2014 involved a reduction, relative to 2013, of nearly 22% for fixed and nearly 30% for mobile telephone services. Interconnection is established in a contract negotiated between the operators concerned. If the parties fail to reach agreement, they can appeal to the ANRT. Interconnection requests cannot be refused if they are "reasonable" in relation to the requesting party's needs and the operator's capacities. As interconnection fees have to be approved by the ANRT, all technical and price bids by operators exerting a "significant influence" (defined annually) on the market for a specific service must be submitted to it for approval. In 2014/2015, the ANRT identified the operator IAM as an operator exerting a significant influence in the fixed-line termination and leased line markets, along with IAM and Médi Telecom in the mobile voice and SMS termination segments.
4.6. Guidelines for examining operators' price bids were implemented in 2012. They established rules for examining retail tariffs and introduced the obligation not to discriminate with respect to prices between "on net" (within a single operator) and "off net" (between two operators) communications for prepaid mobile calls. The aim of this measure was also to reduce the number of local conversations making use of a foreign network in order to remain within the bounds of the same operator and thus encourage network decompartmentalization and lower prices ("club effect"). Measures to encourage effective number portability have been adopted within the framework of these decisions.
4.7. Local loop unbundling has been mandatory since 2007. The technical and pricing modalities were further clarified in 2014 and the operators which have power over this market have been obliged to publish wholesale commercial bids.
4.8. Guidelines concerning the operational, economic and contractual modalities for the sharing and mutualization of the optical fibre network infrastructure up to the subscriber (fibre to the home or FTTH) were adopted in April 2014, in order to promote competition in this market. By means of these guidelines, the ANRT aims to establish a frame of reference that favours and guarantees sharing and mutualization of the infrastructure relating to FTTH access under objective, proportionate and non-discriminatory technical and financial conditions and ensures fair
297 Dahir No. 1-07-43 of 17 April 2007 enacting Law No. 29-06 amending and supplementing Law No. 24-96 on postal and telecommunications services; viewed at: http://www.anrt.ma.

WT/TPR/S/329 • Kingdom of Morocco
- 123 -
competition. These guidelines deal with the principles underlying the regulation of wholesale bids for access to FTTH infrastructure. They address the operating conditions and the pricing and related modalities and deal with the basic contractual aspects to be respected between operators in concluding the corresponding agreements. In January 2015, the operator IAM published its first wholesale bid for access to this infrastructure.
4.9. In order to develop the infrastructure for ultra-high speed and the introduction of new mobile technology, in March 2015 fourth-generation (4G) licences were granted to the three operators in place. Regulatory arrangements were also made to enable the Wifi band to be opened up to the telecommunications operators who had begun providing access to high-speed networks in 2013.
4.10. There is an ongoing project to amend and modify Law No. 24-96 on postal and telecommunications services, in force since 1997. The objective of this draft law is to align the national regulations on international best practice in the field, encourage competition and strengthen the legal means at the disposal of the regulatory authority to enable it to improve its response to the concerns of consumers. The draft incorporates provisions setting out the conditions of deployment of the ultra-high speed infrastructure. The technical and operating specifications for connecting this infrastructure to the ultra-high speed public networks will be established by ministerial order.
4.8.3 Universal service
4.1. Draft Law No. 121-12 also aims to clarify the functions of the ANRT relating to the Universal Service. In Morocco, the Universal Service covers telecommunications services generally, including services relating to land-use management and value-added services such as the Internet. It is financed from the Telecommunications Universal Service Fund (FSUT), which relies on contributions from the telecommunications operators amounting to 2% of their turnover, net of interconnection and terminal sales costs. Operators may also carry out universal service missions decreed by the Telecommunications Universal Service Management Committee (CGSUT). In this case, the amounts retained for carrying out the missions are deducted from the amounts owed in respect of the 2% contribution. The draft law makes provision for the facilitation of infrastructure sharing, interconnection and access to telecommunications networks, domestic roaming, the promotion of services and the related tariffs; the inclusion of high-speed within the scope of the US; and compensation for operators carrying out universal service missions where the amount exceeds that corresponding to their annual contributions.
4.8.4 Morocco's commitments under the GATS
4.1. Morocco's commitments with regard to telecommunications within the framework of the GATS (and the Reference Document annexed to its Schedule) aim, inter alia, not to limit market access, neither in the case of cross-border supply of value-added services nor in the case of the consumption of bound services abroad, except for those provided over private leased circuits, for which consumption abroad is restricted by the "[n]ecessary utilization of available capacities of existing public telecommunication networks".298 However, Morocco makes access to the fixed and mobile telephony markets conditional upon obtaining licences issued following invitations to tender. The requirement to establish a commercial presence applies to the provision of all services.
4.8.5 Free Trade Agreement (FTA) with the United States
4.1. Under the FTA with the United States, Morocco has liberalized, on a reciprocal basis, the whole range of services and their modes of supply in favour of United States suppliers, including cross-border trade and resale services that were not fully bound under the GATS. For example, Chapter 13 of the FTA imposes an interconnection obligation on all suppliers, and not just major suppliers; the latter must not discriminate against other suppliers. One provision requires the regulatory body to prescribe "cost-oriented" leased circuit tariffs, rather than the "reasonable" tariffs specified in the Telecommunications Annex to the GATS.
4.2. Moreover, the major suppliers are required to provide for access to the infrastructure they control, on reasonable and non-discriminatory terms and conditions. The flexibility offered to
298 WTO documents GATS/SC/57 of 15 April 1994 and GATS/SC/57/Suppl.2/Rev.1 of 23 July 2002; viewed at: https://docs.wto.org/dol2fe/Pages/SS/directdoc.aspx?filename=R:/SCHD/GATS-SC/SC57S2R1.pdf . See also the I-TIP Services Database; viewed at: http://i-tip.wto.org/services/(S(vz2fpjqe3hu2tzgjs10ttxyf))/SearchResultGats.aspx) .
WT/TPR/S/329 • Kingdom of Morocco
- 124 -
suppliers in choosing their technologies is expressly formulated in the Agreement, which supplements the WTO requirement that spectrum management be objective, timely, transparent and non-discriminatory and includes a public consultation procedure and market-based approaches to allocating spectra for non-governmental services.
4.9 Postal services
4.1. The postal sector is only partially open to competition. In fact, the postal activities subject to the State monopoly, exercised by Barid Al Maghrib (the Moroccan postal system), encompass all dispatches up to 1 kg, including letters. International express courier services may be provided either by authorized operators or by Barid Al Maghrib. In 2015, eight operators were active in this segment of the market (DHL, Chronopost (BAM), TNT, UPS, Fedex, Aramex, Sky Net and Top Express). In June 2008, Barid Al Maghrib was authorized by Decree No. 2-08-258 of 5 June 2008 to establish a subsidiary empowered to provide restricted banking services, under the name Al Barid Bank SA, subject to the banking legislation (Section 4.11). In 2010, Barid Al Maghrib was converted into an entirely publicly owned joint-stock company.299 This was intended to enable it, among other things, to fund itself by issuing private debt or via a potential IPO.
4.10 Insurance services
4.10.1 Overview
4.1. The Moroccan insurance market is Africa's second largest in terms of turnover and contribution to GDP. Although modest, this contribution rose from 2.9% in 2008 to 3.1% in 2014. In 2015, the sector was composed of 21 enterprises (17 joint-stock companies and four mutuals). In terms of activity, the market is shared out amongst nine general insurance companies; four assistance companies; two insurers specializing in life insurance; one non-life insurance company; two credit insurance companies; two public passenger transport insurers; and two reinsurers, one of which is state-owned. All are grouped together under the Moroccan Federation of Insurance and Reinsurance Companies (FMSAR).300
4.2. In 2014, the number of approved insurance intermediaries was 1,712, a sharp increase as compared with 2007 (972) (1,301 insurance agents and 411 insurance brokers). The public sector continues to dominate the reinsurance branch through the Central Reinsurance Company (SCR), which accounts for more than 70% of the Moroccan reinsurance market and benefits from an unconditional State guarantee. The SCR is 94% owned by the Moroccan State through the Deposit and Management Fund (CDG).
4.3. The insurance market remains concentrated. In 2014, four companies accounted for 65% of the total premium turnover of DH 28.4 billion, which was sharply up on the 2007 figure of DH 17.7 billion. They were RMA Watanya (whose market share has gone from 20% to 18% since 2007), Wafa Assurance (from 20% to 21%), AXA Assurance Maroc (the 100% subsidiary of the AXA group, from 14% to 13%), and Saham Assurance (13%).301
4.4. Life and capitalization insurance is the most important branch (33% of sector turnover), followed by motor vehicle insurance (32%), and personal accident insurance (11%). In 2014, only one company reported a loss while the other 16 made profits totalling DH 3.2 billion.302
4.10.2 Policy
4.1. Under the GATS, Morocco reserved the right to require all insurance companies to have a registered place of business in Morocco; however, it also undertook not to impose any limitation on national treatment for insurance and reinsurance services.
4.2. Insurance services are regulated by the 2002 Insurance Code (amended in 2006 and in 2009) and its implementing decrees.303 A draft law amending the Insurance Code in May 2015 addresses three main issues: the establishment of a legal framework for Takaful insurance; the introduction of
299 Law No. 07-08 converting Barid Al Maghrib into a joint-stock company, OJ No. 5822 of 18 March 2010.300 Viewed at: http://www.fmsar.org.ma.301 MEF (2013a).302 MEF (2015).303 Law No. 17-99 on the Insurance Code; viewed at: http://www.finances.gov.ma/Acaps/DocsAcaps/La loi
n%C2%B0%2017-99%20portant%20code%20des%20assurances.pdf .
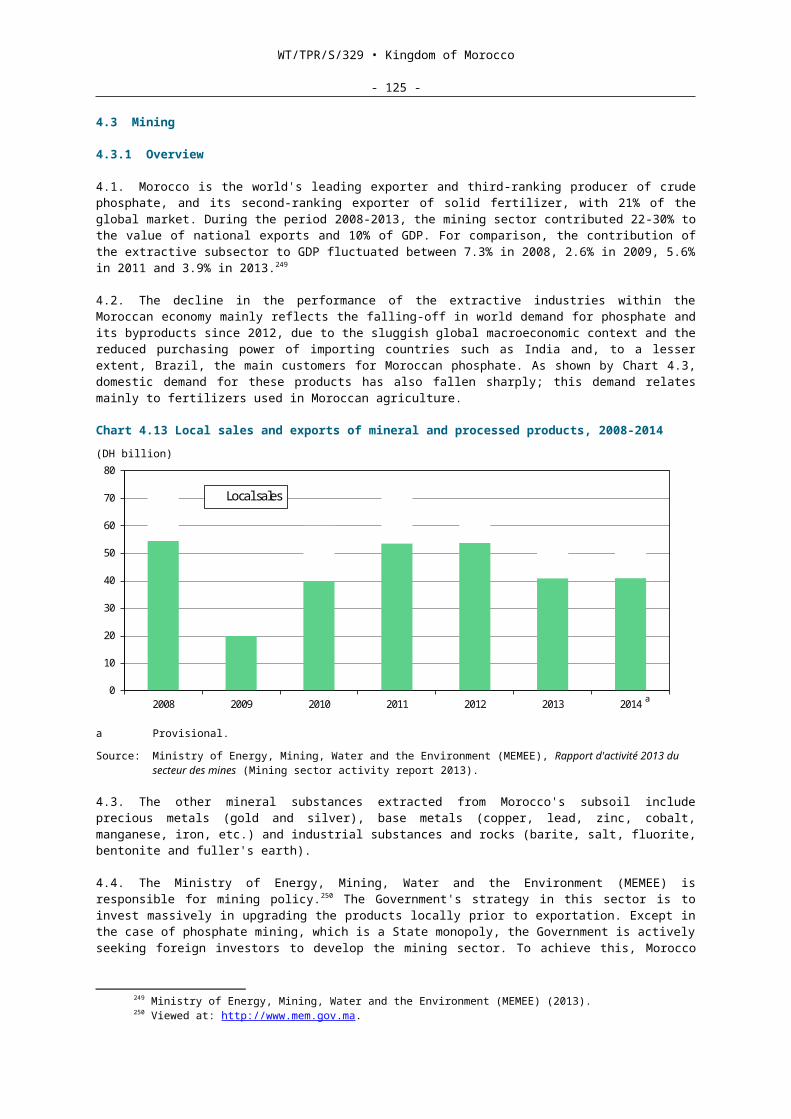
WT/TPR/S/329 • Kingdom of Morocco
- 125 -
certain forms of compulsory insurance relating to construction; and the technical revision of certain provisions of the Code, involving mainly the introduction of the principle of risk-based solvency and the strengthening of the transparency and good governance of insurance and reinsurance companies. The Code also regulates bancassurance and restricts services supplied by the banks and Barid Al-Maghrib to personal insurance and assistance and credit insurance.
4.3. The MEF's Insurance and Social Security Directorate (DAPS) is the main body responsible for regulating and monitoring the activities of the insurance, reinsurance and capitalization institutions. The DAPS will become an autonomous authority following the entry into force of Law No. 64-12 of 20 March 2014 establishing the Insurance and Social Security Supervisory Authority (ACAPS).
4.4. Any change in majority, any disposal of more than 10% of the shares and any takeover of more than 30% of the equity of an insurance or reinsurance company must have the prior agreement of the MEF. This approval process will shortly become the responsibility of the new authority. Since 2008, several authorizations have been granted within this framework, including the acquisition from the CDG of 30% of the equity and voting rights of the insurance and reinsurance company ATLANTA by HOLMARCOM.
4.5. Under the Code, approval for insurance and reinsurance companies is given, by branch, only to companies governed by Moroccan law, with their headquarters in Morocco and capital of at least DH 50 million (about €5 million). However, the amendments made to the Code in 2006 by Law No. 39-05304 now permit the establishment of branches in Morocco by insurance companies of countries with which Morocco has concluded an FTA that includes insurance services (that is to say, the United States), without the need to set up a company under Moroccan law. The FTA stipulates, however, that the operations in Morocco of a branch of a United States insurance company must be based solely on the capital actually paid in and transferred to Morocco.
4.6. Moreover, Morocco reserves the right to regulate branches, mainly in terms of capital and reserve requirements, localization of assets, placement and investment policy, product marketing and profits transfer. It may also require a person representing the branch in Morocco to be professionally qualified and empowered to validly represent the branch in its relations with third parties and to be a party to legal proceedings. It follows, therefore, that the subscription of capital is necessary to open a branch of a United States insurance company in Morocco. The difference between opening a branch and setting up a company under Moroccan law lies in the procedure to be followed and in the tax benefits. No request to establish a foreign branch has been made since the FTA entered into force in 2008.
4.7. The main criteria for approval of the establishment of insurance companies are: their technical and financial resources in relation to the stated programme of activities; the good character and qualifications of the directors; how their capital is allocated; and the status of the shareholders. These criteria do not vary with the origin of the capital or the nationality of the shareholders. The main prudential rules applicable to insurance companies are the same for domestic and foreign enterprises, namely: the constitution of technical reserves and their representation by assets that satisfy security, profitability and liquidity criteria and comply with the rules on diversification and dispersion; and a margin of solvency.
4.8. Some companies provide both "life" and "non-life" insurance services under the previous legislation. However, since the 2006 amendment of the Insurance Code, which introduced specialization, no authorization may now be given to a company to provide life insurance and capitalization services alongside other types of insurance and reinsurance. In this connection, the above-mentioned draft law on insurance would make it possible to approve insurance and reinsurance companies already providing both "life" and "non-life" insurance services to engage in other insurance operations, except for Takaful and assistance insurance.
4.9. The Code requires risks in Morocco, persons domiciled in Morocco and relevant liabilities to be insured with insurance and reinsurance companies approved in Morocco. However, the FTA with the United States allows US insurance businesses, within the context of cross-border trade, to cover risks in Morocco relating to (i) maritime shipping, commercial aviation, and space launching and freight (including satellites) with such insurance to cover any or all of the following: the goods
304 Dahir No. 1-06-17 of 14 February 2006 enacting Law No. 39-05 amending and supplementing Law No. 17-99 on the Insurance Code.
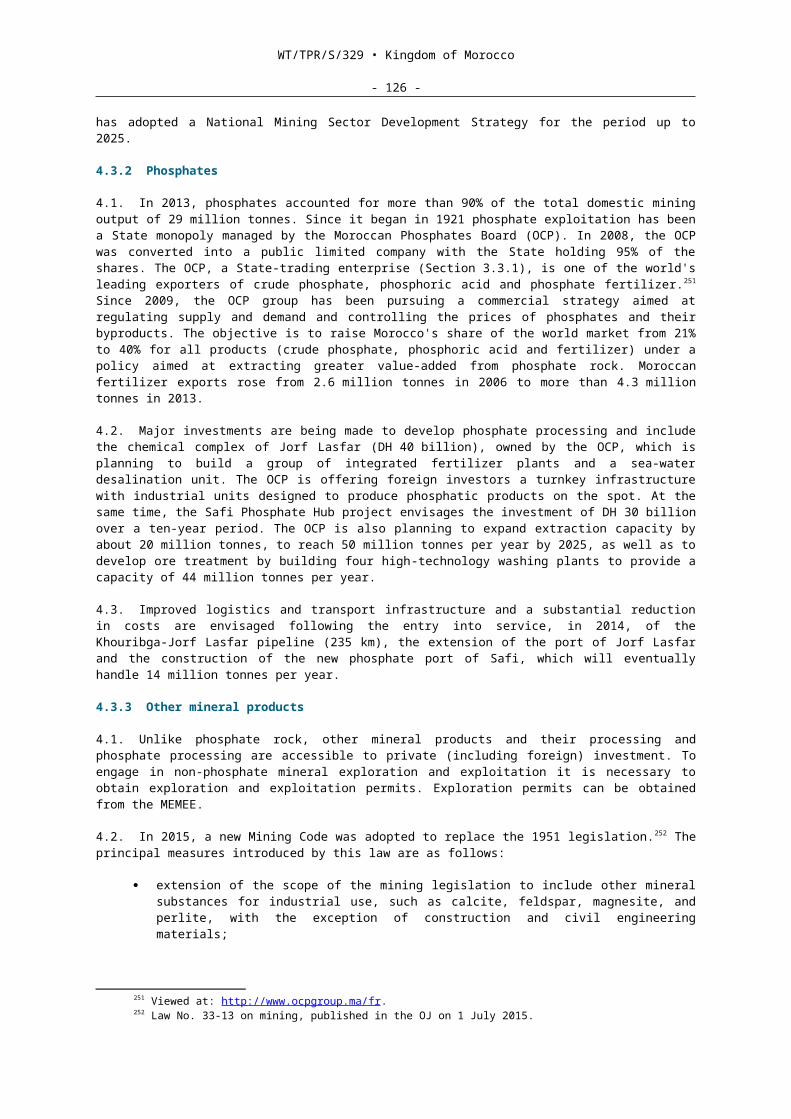
WT/TPR/S/329 • Kingdom of Morocco
- 126 -
being transported, the vehicle transporting the goods and any liability arising therefrom; and (ii) goods in international transit.
4.10. However, changes made to the Insurance Code in 2006 include the introduction of provisions that make it possible to conclude insurance contracts abroad in certain specific cases. This exemption is granted by the Government for aviation and maritime insurance and for compulsory insurance if no Moroccan insurance company can be found to cover the risks. Article 162 of the Insurance Code is also affected by the amendment in process of approval. This amendment envisages the broadening of the list of risks that may, subject to the derogating authorization of the ACAPS, be covered by insurance taken out with foreign insurance companies.
4.11. In particular, since 2006 insurance for international road transport, as well as aviation and maritime insurance, can be taken out abroad with the prior agreement of the Minister responsible for finance. These insurance operations concern: insurance of ship hulls and aircraft fuselages; insurance against civil liability risk resulting from the use of maritime vessels or aircraft, including carrier liability; and the insurance of transported merchandise.
4.12. Insurance may also be contracted abroad for imports in the case of goods imported within a framework of external financing that provides for the signing of a foreign insurance contract; capital goods and tools imported under turnkey contracts that envisage insurance abroad; crude oil, gas and diesel; heifers; wood; and goods imported by plane or parcel post. In practice, in these particular cases the derogation is sometimes granted by the Administration by taking into account the contractual aspects and the conditionalities of the external financing, especially when large-scale projects are involved. The amendment in process of approval provides a legal solution to deal with this situation.
4.13. The Code does not prohibit companies domiciled in Morocco from covering risks abroad.
4.14. Premiums are freely set by the companies and are not regulated. However, for compulsory motor civil liability insurance, the pricing criteria are established by regulation. In this case, the insurance companies are required to guarantee any vehicle owner subject to the obligation. Should an insurance company refuse to provide coverage, the administration may fix the amount of the premium in return for which the company concerned is required to guarantee the risk proposed. For other categories of insurance, pricing is free and complaints about abuse are dealt with by the administration in accordance with the regulations in force.
4.15. Brokerage services, on the other hand, can be supplied by either natural or legal persons (general agents or brokerage companies). Approval to operate as an insurance intermediary is given only to natural persons of Moroccan nationality, and only to legal entities incorporated under Moroccan law with headquarters in Morocco and at least 50% of their capital held by natural persons of Moroccan nationality or legal persons under Moroccan law; the person in charge must be a Moroccan national. Since 2006, under its FTA with the United States, Morocco has liberalized its brokerage services for US suppliers, but only for reinsurance and maritime transport-related insurance. According to the authorities, Morocco has not yet received a request of this kind.
4.16. Under the GATS, Morocco undertook not to impose any market access restriction on commercial presence for the purpose of providing reinsurance services; however, it did reserve the right to require all insurance and reinsurance companies to establish a reinsurance plan involving a mandatory transfer of operations to the Central Reinsurance Company (SCR). This provision required insurance companies established in Morocco to transfer to the SCR part of the premiums collected within the context of their activities on Moroccan territory. However, in application of the commitment made in the FTA with the United States, the mandatory transfer for the benefit of the SCR was abolished as from January 2014 for all categories of insurance.
4.11 Banking services and other financial services
4.11.1 Overview
4.1. There are two main reasons why the banking sector has a particularly important part to play in the Moroccan economy and trade. Firstly, the banks are the main source of financing for the Moroccan economy: bank loans outstanding increased from DH 500 billion in 2008 to DH 734 billion in 2014, or 87% of all lending to the economy. Secondly, the Moroccan banks have made substantial investments in African countries during recent years, thereby increasing exports
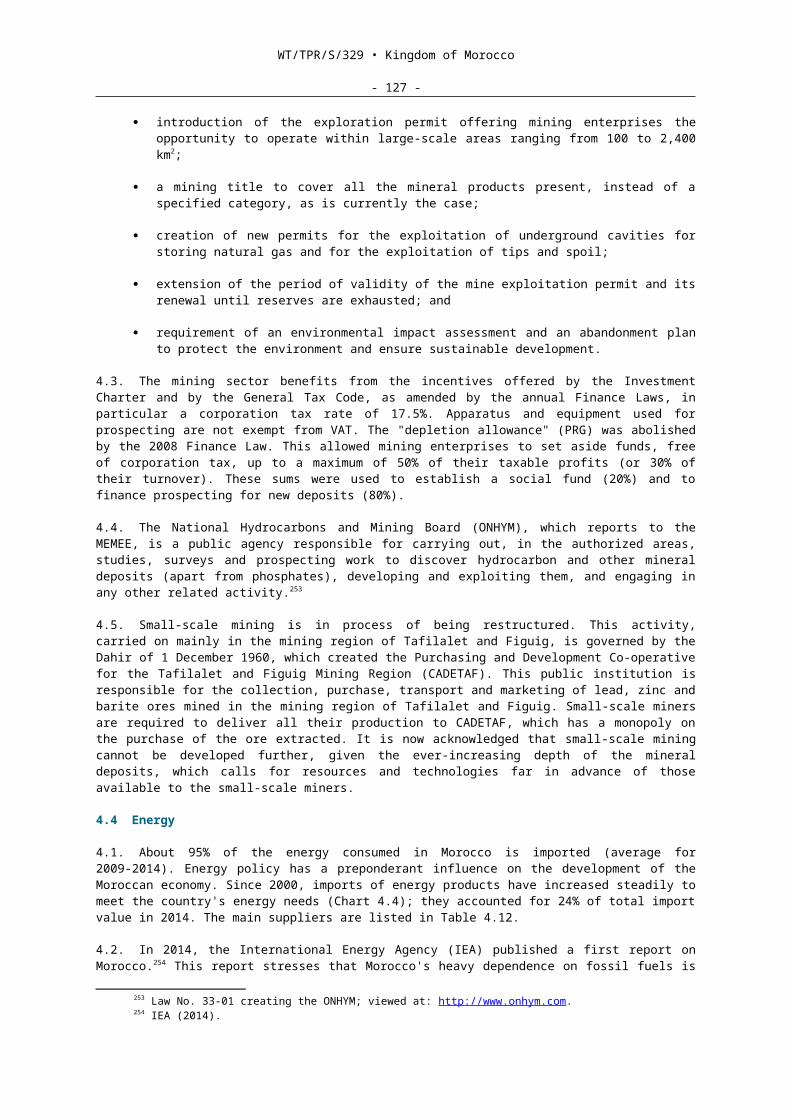
WT/TPR/S/329 • Kingdom of Morocco
- 127 -
of services under "mode 3", i.e. commercial presence. Thus, in March 2014 Attijariwafa Bank acquired 75% of the capital of the Ivorian Banking Company (SIB). Three Moroccan banks, Attijariwafa, the Moroccan Foreign Trade Bank (BMCE) and the People's Central Bank (BCP), are present in 22 African countries and are said to own about 30% of franc area branches.305 This expansion has been the subject of a study by the International Monetary Fund.306
4.2. Foreign participation in the Moroccan banking sector is still relatively weak: foreigners have majority holdings in only five banks, accounting for 17.8% of total assets, 18.5% of deposits and 20.5% of loans. In the case of finance companies, eight are controlled by foreign capital.
4.3. The public sector is a majority shareholder in the following credit institutions: Moroccan Agricultural Credit Bank (CAM), Housing and Real Estate Bank (CIH), Communal Equipment Fund (FEC), and the Deposit and Management Fund (CDG, see below).
4.4. The number of microcredit associations (13 institutions) has not changed since 2007. At the end of December 2014, their aggregate loans outstanding amounted to DH 5.44 billion (0.7% of the total).
4.5. At the end of 2014, six offshore banks were operating in Morocco, their activities amounting to about 3.4% of total cumulative bank balance sheets. This sector has developed under the impetus of a series of incentive regimes, such as the regimes for offshore banks and offshore holding companies, and the Casablanca Finance City regime, in order to provide banking services for export free zones.
4.6. The banking system is highly concentrated. Thus, between 2008 and 2014 the concentration of the three leading banks in terms of total assets stabilized at 65%, and in terms of deposits went from 68% to 65%. Their share of lending rose from 61% to 65%. If the first five banks are taken into account, then between 2008 and 2014 concentration went from 81% to 80% in terms of total assets; from 84% to 80% in terms of deposits; and from 79% to 82% in terms of loans.
4.7. A new regional bank with public/private capital is said to be on the point of being established: it appears that, 22 years after its creation was first announced (in 1991), the Maghreb Investment and Foreign Trade Bank (BMICE) is to be endowed with an initial capital of US$150 million, to which each of the five AMU countries will contribute US$30 million, with one quarter being paid up at the time of establishment of the bank. The purpose of the BMICE will be to finance projects of common interest and to further trade between the countries of the Maghreb by promoting and facilitating foreign trade; its headquarters will be in Tunis.
4.8. The proportion of overdue debt first fell to 6% in 2008, as against 19.4% in 2004, before increasing to 6.9% in 2014; it is 7% for banks under majority private ownership, and 11.8% for banks under majority foreign ownership. The improvement in 2007 has been attributed mainly to the loan portfolio consolidation processes undertaken by the banks and encouraged by implementation of the Basel II rules.
4.9. Access to banking services, as measured by the ratio of the number of accounts to the total population, has improved since Morocco's previous TPR and at the end of 2014 stood at 63%, as against 43% at the end of 2008. The banks' minimum solvency ratio was, on average, 11.2% in 2008 (above the statutory minimum of 10%). It had increased to 13.8% by December 2014 (above the new statutory minimum of 12%). The banks' liquidity ratio was, on average, 110% (above the minimum requirement of 100%) as compared with 106% at the end of 2008. It is defined as the ratio of liquid assets to outstanding liabilities due over a period of one month.
4.11.2 Policy
4.1. The entry into force of Law No. 76-03 on the Charter of Bank Al-Maghrib (BAM) and Law No. 34-03 on credit institutions and similar establishments in 2006 was followed by the entry into effect of a new banking law (Law No. 103-12 on credit institutions and similar establishments) on 22 January 2015. Moreover, a draft reform of the BAM charter is in process of adoption. The prudential regulations have also been brought into line with the provisions of the new banking law and international standards.
305 Al Huffington Post, 21 April 2015; viewed at: http://www.huffpostmaghreb.com/2015/04/21/afrique-comment-banques-marocaines-dament-pion-banque-francaises_n_7106788.html
306 IMF (2015).
WT/TPR/S/329 • Kingdom of Morocco
- 128 -
4.2. The 2015 banking law and BAM oversight also apply to "similar" establishments, namely, payment institutions, offshore banks, micro-credit associations, finance companies and the Central Guarantee Fund (CCG). Created in 1949, the CCG is a public financial institution treated as a credit institution. Its main activities include guaranteeing investment, operating, bridging and financial restructuring loans; co-financing investment projects with the banks under sectoral strategies; providing financing through investment funds and guaranteeing venture capital; and guaranteeing housing and student loans.
4.3. Credit institutions headquartered abroad may create subsidiaries or open branches in Morocco, but only those of well-known international banks, with a minimum capital or allocation, may be set up there. The Governor of the BAM alone is empowered to authorize banking establishments and equivalent institutions; banks must have a wholly paid-up minimum capital (or allocation) of DH 200 million, unless they do not accept funds from the public, in which case the minimum is DH 100 million.307 The minimum capital requirement for finance companies varies between DH 1 million and DH 50 million, depending on the nature of their operations. Since 2008, two foreign branches have been approved: La Caixa and Banco Sabadell.
4.4. Credit institutions headquartered in Morocco must be set up as joint-stock companies with fixed capital or as co-operative companies with variable capital, except for those that have a special legal status. No distinction is made with regard to the required status of credit institutions depending on whether they are foreign or domestic. Credit institutions must belong to one of two professional associations, i.e. either the Professional Association of Moroccan Banks (GPBM) or the Professional Association of Finance Companies (APSF).
4.5. A new BAM authorization is required when changes occur that affect the nationality or control of a credit institution, or the nature of its operations, and also in the case of mergers and acquisitions. During the period 2008-2014, two authorization requests were turned down by the Credit Institutions Committee.
4.6. There is an offshore financial centre, consisting of banks and holding companies, situated in Tangiers. Law No. 58-90 on offshore financial centres defines an offshore bank as any legal person headquartered in an offshore financial centre which customarily engages in banking transactions with non-residents in convertible foreign currencies. Only subsidiaries and branches of internationally well-known banks, with a minimum capital or allocation of US$500,000, may be set up there. Offshore banks have to observe the rules applicable in terms of solvency, risk diversification and liquidity. However, they may be exempted from these requirements if the BAM considers that their risk management is satisfactorily assured by their parent companies.
4.7. The Casablanca Finance City (CFC) project, launched in 2010 by Law No. 44-10 establishing CFC status, aims to make Casablanca a regional financial hub enabling large domestic and foreign financial institutions to operate out of Casablanca at regional and international level or set up their regional or international headquarters there. A system of incentives provides for tax reductions for institutions that qualify for CFC status and their employees. The institutional promotion and supervision of the CFC project as a whole have been entrusted to the Casablanca Finance City Authority. A total of 78 enterprises have qualified for CFC status: nine financial enterprises, 40 professional services providers, 27 regional headquarters, and 2 holding companies.
4.8. Attendance fees and all other remuneration paid by the banks to their board members, along with wages, emoluments and salaries paid to non-resident staff are taxable at the specific rate of 20%. Resident staff can benefit from the same 20% rate if they can show that the counterpart of their remuneration in convertible foreign currency has been surrendered to a Moroccan bank.
4.9. Offshore banks also benefit from either the optional imposition of corporation tax (IS) for the first 15 years following the date of their approval at a rate of 10%, or a fixed annual flat-rate tax of US$25,000, free of any other tax on profits or revenue. For offshore holding companies the choice is corporation tax at 8% or a flat-rate tax of US$500 for the first 15 years following their establishment, after which these offshore institutions are liable, in principle, for corporation tax under the ordinary law regime (Table 1.2).
4.10. A new Law (No. 18-14, Table 2.1) amending and supplementing Law No. 41-05 on Venture Capital Institutions (OPCR) is aimed at creating a legal framework that takes into account all
307 The requirements are set out in detail in Circular No. 1/G/2011 amending and supplementing Circular No. 20/G/2006 on the minimum capital or minimum allocation for credit institutions.

WT/TPR/S/329 • Kingdom of Morocco
- 129 -
investment capital activities and their various categories. The main innovations introduced by this amendment involve: (i) extending the scope of the Law to cover any investment capital activity, including venture capital, in order to supplement the financing offered to enterprises; (ii) making the system more secure and providing greater investor protection by strengthening the role and the prerogatives of the Moroccan capital markets authority, and introducing the obligation to have recourse to a deposit institution; (iii) improving the financial techniques employed and standardizing them on international practice; and (iv) promoting foreign investment in investment capital activities.
4.11.3 International commitments
4.1. Under the GATS308, Morocco reserved the right to limit foreign participation in the capital of large banking institutions where such participation would lead to a takeover within the meaning of the Banking Law (now Law No. 34-03 and Law No. 103-12). Morocco also undertook not to impose any limitation on the setting up of credit institutions or the opening of branches, agencies, windows or representative offices. However, these two commitments are subject to a reciprocity clause.
4.2. Morocco reserved the right to prohibit the provision of financial services (including insurance) by natural persons (mode 4). It also undertook not to impose any limitation on national treatment in the case of all financial services in its Schedule of Commitments or on market access under mode 3 (commercial presence), except for insurance services and the limitations noted above. In the case of cross-border supply of financial services, Morocco undertook not to impose any limitations on market access in the case of loans granted to finance investment in Morocco or commercial transactions with Morocco; guarantees and commitments; the provision and transfer of financial information; and financial data processing and related software.
4.3. The only banking services and other financial services liberalized by the Parties under the FTA with the United States concern, for Morocco, the provision and transfer of financial information and financial data processing and related software by providers of other financial services, and advisory and other auxiliary financial services, with the exclusion of the following services: credit rating and financial analysis, research and advice on investments and placements, and advice/intermediation in connection with acquisitions, restructurings and business strategies. Morocco has, however, undertaken to envisage liberalization measures in the following two areas309:
Morocco's current requirement that operations of banks incorporated abroad and functioning as branches in Morocco be limited by the amount of capital effectively allocated by those establishments to their operations in Morocco.
The restriction on the holding of non-Moroccan securities by Moroccan mutual funds (UCITS). Since 2007, this limit has been 10% of their portfolio (Section 1.1).
4.4. Moreover, on 30 July 2015 the London Stock Exchange Group (LSEG) signed an agreement with the Casablanca Stock Exchange to launch ELITE, the LSEG's development programme for high-growth businesses, in Morocco.
4.12 Professional services and business services
4.12.1 Overview
4.1. Professional services in Morocco are regulated by the General Secretariat of the Government (SGG) and by the Ministry of Justice in the case of the legal professions (Table 4.19).
Table 4.45 Available information concerning some regulated professions, 2014Activity/Law(National association) Market accessTax adviser ..Accountant Moroccan nationalityEngineer ..Notary and adoul Moroccan nationalityLawyer Moroccan nationalityBailiff
308 WTO document GATS/SC/57/Suppl.1/Rev.1 of 4 October 1995.309 Annex 12-B. WTO document WT/REG208/3/Rev.1 of 1 September 2008; viewed at:
http://rtais.wto.org/UI/PublicShowMemberRTAIDCard.aspx?rtaid=30.
WT/TPR/S/329 • Kingdom of Morocco
- 130 -
Activity/Law(National association) Market accessArchitect Moroccan nationality (Conventions with Algeria, Mauritania, Tunisia)Veterinary surgeon ..Doctor/acupuncturist/odontostomatologist ..Dental surgeon .. Nurse and midwife ..Pharmacist ..
.. Not available.Source: WTO Secretariat, on the basis of information provided by the authorities.
4.2. For professions regulated by the SGG, such as architecture and engineering, authorizations to practise (for both nationals and foreigners) are issued by the SGG's Directorate of Regulated Associations and Professions (DAPR). In general, membership of the relevant national professional association is required for nationals and foreigners alike. Once an authorization has been granted, foreigners must obtain a carte d'immatriculation (residence permit) valid for between one and ten years (renewable for an equal period).310
4.3. Morocco has made sectoral commitments in the WTO for a specific category of professional services, namely accounting, auditing and bookkeeping, reserving the right to restrict foreign share ownership to 25%, and to impose a Moroccan nationality requirement for access to its market; it has also undertaken not to impose any limitation on national treatment regarding commercial presence. At the horizontal level, Morocco has undertaken not to impose any restriction on national treatment for the movement of natural persons, but has not made any commitment on market access, except for personnel employed by a company and transferred to a company created in Morocco that is owned or controlled by, or is a subsidiary of the former, in certain categories. 311
Thus, directors, senior executives and specialists with essential knowledge may need a prior contract of employment to obtain a work permit, and commercial representatives may have their stay limited to 90 days.
4.4. VAT at the reduced rate of 10% applies to services provided within the context of their profession by lawyers, interpreters, notaries, adouls, bailiffs, architects, quantity surveyors, topographers, land surveyors, consulting engineers and experts in any field, and veterinary surgeons, with the right to deduction of VAT paid on their inputs. However, an exemption from VAT, without right of deduction, is available for services provided by physicians, dental surgeons, physiotherapist masseurs, orthoptists, speech therapists, nurses, herbalists and midwives.
4.12.2 Accounting and auditing services
4.1. There are two major professional accountancy qualifications in Morocco: expert-comptable (public accountant) and comptable agréé (chartered accountant). The two categories are protected by separate legislation and represented nationally by their respective associations, the Association of Public Accountants and the Moroccan Association of Chartered Accountants (ACAM).
4.2. The public accountancy profession is governed by Law No. 15-89, which regulates the profession and establishes an association of public accountants, together with its implementing decree.312 The profession can be practised either independently as an individual or within a firm of public accountants, or as a salaried employee of an independent public accountant or firm of public accountants. Some activities are exclusively reserved for public accountants. These include verification of balance sheets, income statements and accounting and financial statements; the issuing of all other certificates expressing an opinion on the accounts of firms or organizations; and performing audits.313 In 2007, there were 320 professionals and 80 firms registered with the Association of Public Accountants. In 2015, their numbers had risen to 560 professionals and 240 firms, respectively.
4.3. Membership of the Association of Public Accountants314 is compulsory to be able to practise the profession. To be admitted, candidates must, among other things, be of Moroccan nationality or nationals of a State that has signed a reciprocal treatment agreement with Morocco; and they
310 Law No. 02-03 of 2003 on the entry and stay of foreigners in the Kingdom of Morocco.311 WTO document GATS/SC/57 of 15 April 1994.312 Decree No. 2-93-521 of 30 August 1993.313 Article 1 of Law No. 15-89.314 The National Association comprises a National Council and two Regional Councils (Rabat and
Casablanca). The three Councils oversee compliance with the rules regulating the profession.
WT/TPR/S/329 • Kingdom of Morocco
- 131 -
must hold a national public accountancy qualification or recognized equivalent. Without membership of the Association, it is however possible to use the title "titulaire du diplôme d'expert comptable" (holder of the qualification of public accountant), subject to the requirement to mention the authority or institution that issued the diploma in question.
4.4. The profession of chartered accountant (CA) is regulated by Decree No. 2-92-837 of February 1993 and Finance Minister Order No. 1909-94 of 20 September 1994. Members of the profession must be registered with the ACAM. The commission responsible for reviewing applications for inclusion in the list of CAs is chaired by the Minister. To be admitted, candidates must, among other things, be of Moroccan nationality and must have practised the accountancy profession in Morocco for at least five years.315 The list of chartered accountants is published annually in the Official Journal and in 2015 comprised 513 professionals.
4.12.3 Legal services
4.12.3.1 Lawyers
4.1. The legal profession is governed by Law No. 20-08, enacted on 20 October 2008.316 It may be practised individually or in association with other lawyers, or as an assistant. Morocco has nearly 8,700 lawyers registered with one of the country's 17 bars, and about 1,300 trainee lawyers. The bars are federated within a national organization. Legal counsel is provided by lawyers, who are also empowered to draft private agreements of any nature. Legal representation is compulsory in all Moroccan jurisdictions. All pleas in Moroccan courts are made in Arabic.
4.2. To be entitled to practise the legal profession, it is necessary to be of Moroccan nationality or a national of a country with which Morocco has an agreement containing a reciprocity clause on the right to practise.317 Lawyers must also be registered with one of Morocco's bar associations, have been removed from the register of the bar association in their country of origin, and be holders of a certificate of aptitude to practise the legal profession. Failing that, they have to sit an examination to assess their knowledge of the Arabic language and Moroccan law. A certificate of aptitude is not required for former lawyers who have not practised the profession for a period of ten years but were continuously registered for at least five years in one of the bar associations in countries with which Morocco has an agreement. Such agreements are understood to have been signed with France and Spain. The lawyer must establish domicile in the jurisdiction of the Court of Appeal corresponding to his or her bar. To plead in a jurisdiction elsewhere in Morocco, the lawyer must elect domicile either at the office of a colleague established in that jurisdiction or at the office of the corresponding clerk of the court.
4.3. Lawyers practising their profession in a foreign country with which Morocco has a recognition agreement may practise in Moroccan jurisdictions provided that they elect domicile with a lawyer registered in one of the Moroccan bars and (unless this is waived by the aforementioned agreement) have been specially authorized to practise there by the Minister of Justice. A draft decree on the organization of the examination for assessing a foreign lawyer's knowledge of Arabic and Moroccan law was in the process of being finalized in October 2015.
4.12.3.2 Notaries and adouls
4.1. The notary profession in Morocco is governed by Law No. 32-09 of 22 November 2011. Morocco has about 600 notaries and 5,000 adouls (i.e. auxiliaries of the traditional justice sector) who perform notary tasks. Moroccan notaries do not have an organized professional body. At present, there is only one modern national notary chamber (membership is optional), which represents notaries in their relations with the authorities. There is no possibility of association.
4.2. To practise as a notary, it is necessary to have a degree in law, have spent four years on probation in a notary's office, and to pass two exams, at the end of each two-year period. Foreign nationals cannot work as notaries in Morocco.
4.3. The legislation governing the notary profession is under review and a draft law has been prepared. It deals, among other things, with the creation of a professional notary training institute,
315 Article 1 of Decree No. 2-92-837 of 3 February 1993.316 Law No. 28-08 of 2008 amending Law No. 1-93-162 of 10 September 1993 organizing the practice of
the legal profession.317 Article 5 of Law No. 1-93-162.
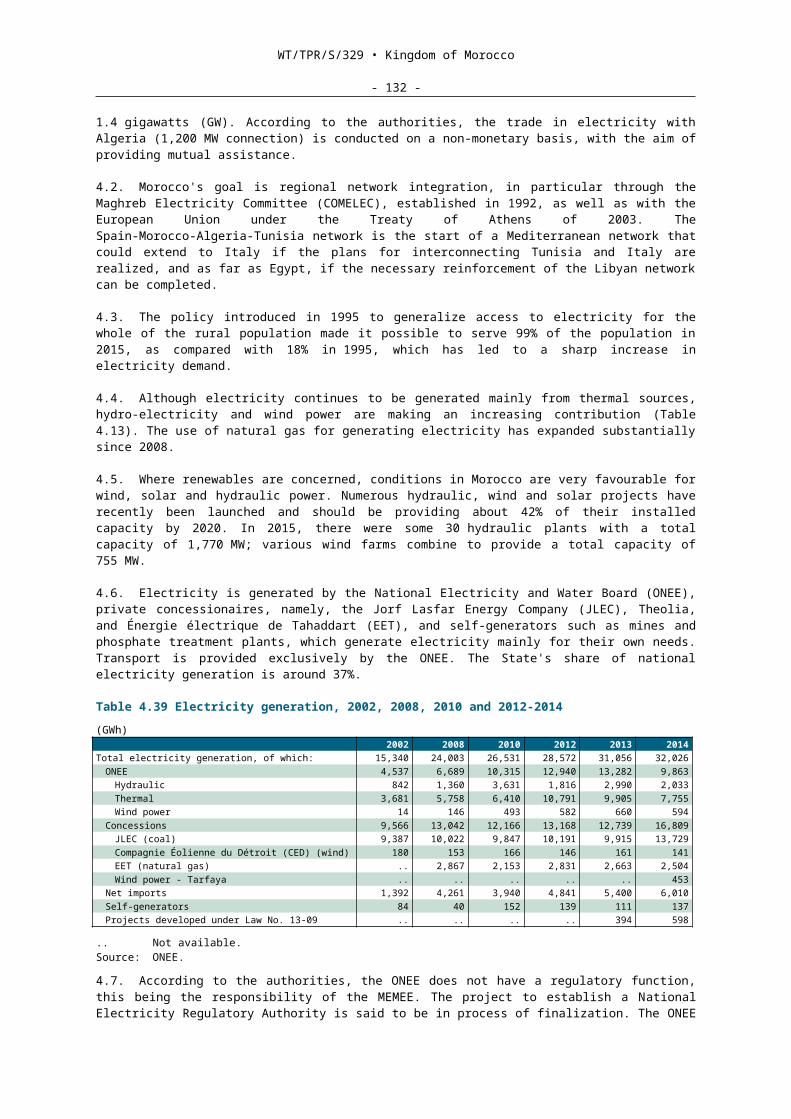
WT/TPR/S/329 • Kingdom of Morocco
- 132 -
the creation of a national council and regional councils to oversee compliance with notary ethics, the possibility of notaries forming a partnership within a single office, and the question of fees. It also gives notaries the status of a member of a liberal profession rather than that of a government official.
4.4. Adouls are attached to Taoutiq judges, who hear litigation under traditional family law in courts of first instance. They are appointed by the Ministry of Justice and overseen by the Court of Appeal, and they perform notary and clerk of the court functions. Adouls are not paid by the Ministry of Justice, but receive a commission based on the value of the transaction in question together with clerical expenses set by decree. They do not have an official association.
4.5. The profession is governed by Law No. 16-03318, which came into force in November 2008. To be able to work as professional adouls, candidates must be Muslim Moroccans, undergo a competitive selection process, work as trainees for a year and then pass a final exam.
4.12.4 Architectural services
4.1. The architectural profession is governed by Law No. 016-89, which has been in force since 1993, and its implementing decree.319 To be able to work as a professional architect on a private basis, it is necessary to obtain prior authorization from the SGG, which is issued subject to a favourable opinion from the National Association of Architects. The applicant must, among other things, be of Moroccan nationality or from a country with which Morocco has an agreement containing a reciprocity clause on the right to practise the architectural profession, hold an architecture qualification awarded by the National School of Architecture or equivalent diploma, and (except in special cases) have completed two years of training with an independent architect or in a firm of architects. Morocco has signed such agreements with Algeria, Mauritania and Tunisia.
4.2. Foreigners may be authorized to practise as architects on a private basis "subject to conditions and limits specified by the legislation on immigration, according to which, inter alia, authorization to practise the profession may be restricted to a certain administrative jurisdiction". Authorization is granted by the SGG, subject to an opinion from the government town planning authorities, the Association of Architects and the commission responsible for reviewing immigration application requests. Foreigners must satisfy the same study requirements as nationals, elect domicile with a Moroccan architect, and be removed from the register of the architects' association in their country of origin to register with the National Association of Architects in Morocco. Nonetheless, they are exempted from the period of professional work experience if they can show that they have practised continuously as independent architects in their countries of origin for at least five years. Foreigners from a country with which Morocco has signed a reciprocal establishment agreement must have an architectural degree or other equivalent qualification320
entitling them to practise the profession in their country of origin. They must also produce a certified copy of the decision to remove them from the register of the architects' association in their country of origin.
4.3. In 2015, nearly 2,800 architects were practising in Morocco, as compared with the 2,000 recorded in 2008. All architects must be registered with the National Association of Architects, which is responsible, among other things, for ensuring that its members comply with the legislation governing the architectural profession and for establishing the code of professional duties.
4.12.5 Engineering services
4.1. Engineering services continue to be governed by an obsolete instrument pre-dating Morocco's independence, i.e. the Dahir of 11 June 1949 regulating the title of engineer in Morocco. According to this, to be able to use the title of engineer in Morocco, it is necessary to have an official engineering diploma awarded in Morocco or in France, or abroad, and, in the latter case, previously recognized by the État chérifien or by France. In practice, authorization to provide professional engineering services is granted by the SGG. In the case of foreigners, this is subject to a favourable
318 Law No. 16-03 of 2006 on the profession of adoul.319 Law No. 016-89 of 1993 on the exercise of the architectural profession and establishment of the
National Association of Architects, and Decree No. 2-93-66 of 1 October 1993.320 Diplomas of the following countries are recognized: Algeria, Belgium, Bulgaria, Canada, Egypt,
France, Germany, Iraq, Italy, Libya, Netherlands, Poland, Romania, Russian Federation, Senegal, Spain, Switzerland, Syria, Tunisia, Ukraine, and the United States.
WT/TPR/S/329 • Kingdom of Morocco
- 133 -
opinion from the Ministry of Foreign Affairs and Cooperation, which is responsible for the authentication of diplomas. There is no national association of engineers. In 2007, Morocco did not have enough engineers, there being only nine per 10,000 members of the population, compared to 40 in Jordan and 130 in France. A new draft regulation on the status of engineers was being prepared.
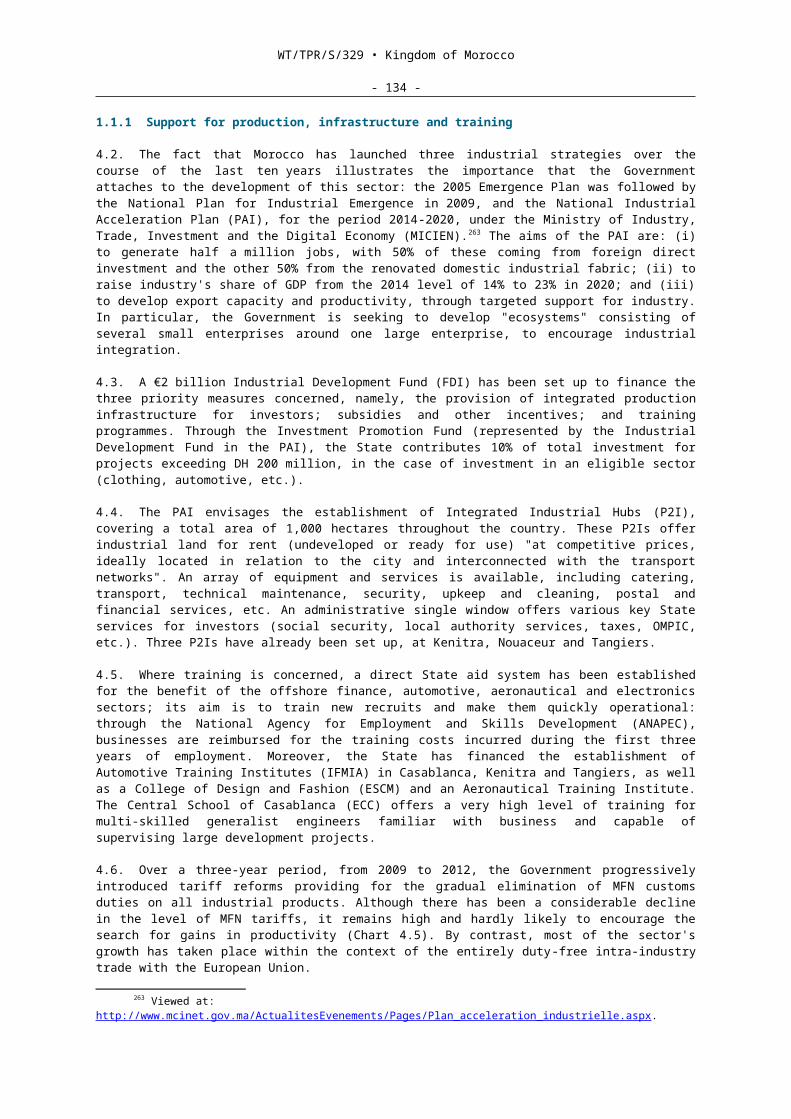
WT/TPR/S/329 • Kingdom of Morocco
- 134 -
REFERENCES
International Energy Agency (IEA) (2014), Revue de la politique énergétique du Royaume du Maroc. Viewed at: http://www.iea.org/newsroomandevents/speeches/MoroccoIDR_MariaVanderHoeven_slides.pdf.
Moroccan Investment Development Agency (AMDI) (2013), Fiches des mesures incitatives. Viewed at: http://www.invest.gov.ma/?Id=1&lang=fr.
National Ports Agency (ANP) (2014), Activités portuaires. Viewed at: http://www.anp.org.ma/EN/Pages/Home.aspx.
African Development Bank (AfDB) (2012), Morocco: Country Strategy Paper 2012-2016. Viewed at: http://www.afdb.org/fileadmin/uploads/afdb/Documents/Project-and-Operations/MOROCCO - CSP 2012-2016.pdf.
World Bank (2015), Doing Business Indicators. Viewed at: http://www.doingbusiness.org/ and http://donnees.banquemondiale.org/indicateur/IC.BUS.EASE.XQ.
International Trade Centre (ITC) (2012), Maroc: Perspectives des entreprises. Viewed at: http://www.intracen.org.
United Nations Conference on Trade and Development (UNCTAD) (2008), Examen de la politique de l'investissement – Maroc. Viewed at: http://unctad.org/fr/docs/iteipc200616_fr.pdf.
UNCTAD (2015, forthcoming), Rapport de suivi sur la mise en œuvre de l'Examen de la politique d'investissement - Maroc, Geneva.
International Monetary Fund (IMF) (2014), Annual Report on Exchange Arrangements and Exchange Restrictions. Viewed at: https://www.imf.org/external/pubs/nft/2014/areaers/ar2014.pdf.
IMF (2015), Morocco - Selected Issues Paper - The Sub-Saharan Expansion of Moroccan Banks: Challenges and Opportunities. Viewed at: http://www.imf.org.
Economic Foresight Institute for the Mediterranean Region (IPEMED) (2014), Les transports ferroviaires au Maghreb Viewed at: http://www.ipemed.coop/adminIpemed/media/fich_article/1415871184_IPEMED_Les-transports-ferroviaires-au-Maghreb_Nov2014.pdf.
Moroccan Association for Automotive Industry and Trade (MAAIT) (2013), Moroccan Automotive Industry: Opportunities and Perspectives. Viewed at: http://www.amcham-egypt.org/Mena/Focus Morocco 2013.pdf.
Ministry of the Economy and Finance (MEF) (2013a), Insurance and Social Security Directorate, Rapport d'activité des entreprises d'assurances et de réassurances au Maroc. Viewed at: http://www.finances.gov.ma/Docs/2014/DAPS/dapsRapport 2013.pdf.
MEF, Directorate of Economic Studies and Financial Forecasts (2013b), Le secteur de transports des marchandises: contraintes et voies de réformes. Viewed at: http://www.finances.gov.ma/depf/publications/en_catalogue/etudes/2013/transport.pdf.
MEF, Insurance and Social Security Directorate (2015), Situation liminaire du secteur des assurances et de réassurance au Maroc en 2014. Viewed at: http://www.finances.gov.ma.
Ministry of Energy, Mining, Water and the Environment (MEMEE) (2013), Rapport d'activités 2013 du secteur des mines, Rabat.
Ministry of Infrastructure, Transport and Logistics (METL) (2014), Le METL en chiffres. Viewed at: http://www.mtpnet.gov.ma/Gouvernance/Chiffres-cles/Documents/METL-en-chiffres-version-francaise.pdf.
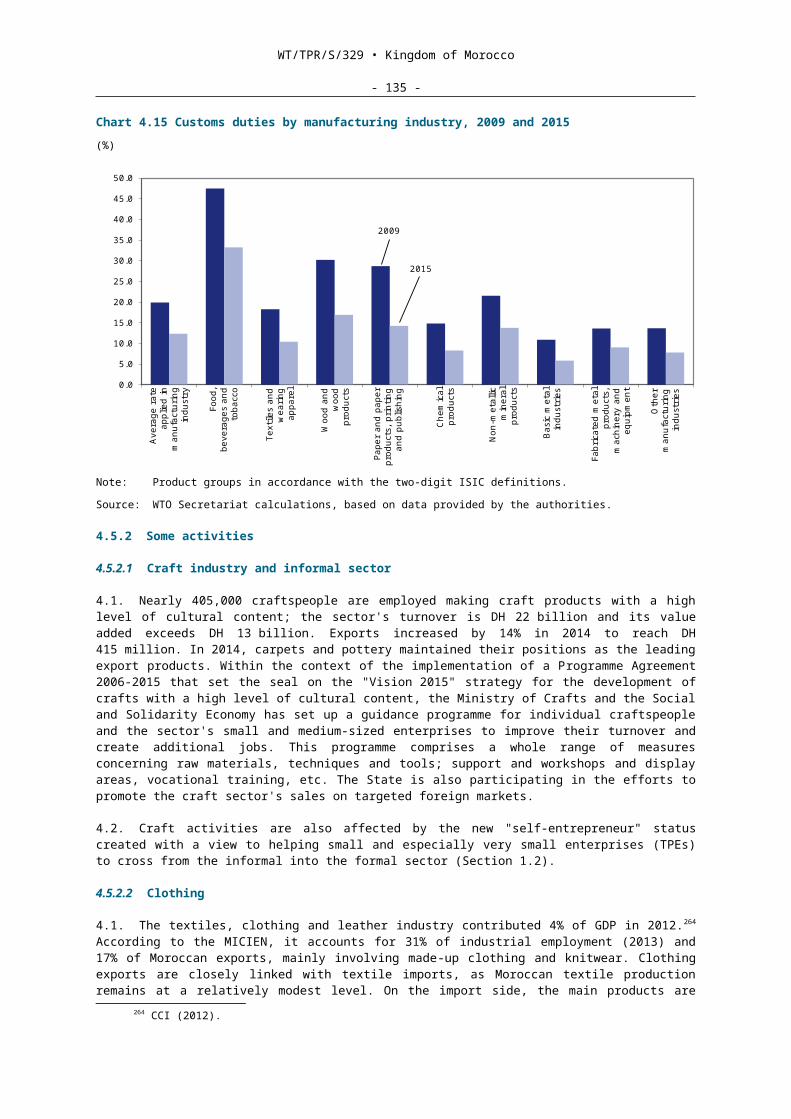
WT/TPR/S/329 • Kingdom of Morocco
- 135 -
Organisation for Economic Co-operation and Development (OECD) (2010), OECD Investment Policy Reviews: Morocco 2010. Viewed at: http://www.oecd-ilibrary.org/finance-and-investment/oecd-investment-policy-reviews-morocco-2010_9789264079618-en.
OECD (2013), US Department Report. Viewed at: http://www.oecd.org.
EuropeAid Co-operation Office (2010), The Logistics Sector on the Southern Shores of the Western Mediterranean. Viewed at: http://www.cetmo.org/pdf/Logistic%20Study%20on%20the%20southern%20shores.pdf.
World Trade Organization (WTO) (2009), Trade Policy Review - Morocco, Geneva.
World Economic Forum (WEF) (2014), The Global Competitiveness Report 2013-2014. Viewed at: http://www3.weforum.org/docs/WEF_GlobalCompetitivenessReport_2013-14.pdf
__________