
· Web view2 Waste rock blended with approximately 30% v/v fine ... 3.47 0.24 0.85 0.46 EWLS13 BR...
106
Ranger trial landform: Particle size of surface material samples in 2009 MJ Saynor & R Houghton August 2011 (Release status – unrestricted) 59 6 intern al report
Transcript of · Web view2 Waste rock blended with approximately 30% v/v fine ... 3.47 0.24 0.85 0.46 EWLS13 BR...

Ranger trial landform:
Particle size of surface
material samples in 2009
with additional
observations in 2010
MJ Saynor & R Houghton
August 2011
(Release status – unrestricted)
596internal
report

This page has been left blank intentionally.
Ranger trial landform: Particle size of surface material samples in 2009 with additional
observations in 2010
MJ Saynor & R Houghton
Supervising Scientist Division
GPO Box 461, Darwin NT 0801
August 2011
Registry File SG2002/0221 & SSD2011/0072
(Release status – unrestricted)

How to cite this report:
Saynor MJ & Houghton R 2011. Ranger trial landform: Particle size of surface material samples in 2009 with additional observations in 2010. Internal Report 596, August, Supervising Scientist, Darwin.
Location of final PDF file in SSDX Sharepoint:
Supervising Scientist Division > PublicationWork > Publications and Productions > Internal Reports (IRs) > Nos 500 to 599 > IR596_Ranger Trial Landform
Location of all key data files for this report in SSDX Sharepoint:
Supervising Scientist Division > SSDX > Development of Technology to Assess Mine Site Impact > Testing trial landforms Ranger > Erosion studies > 2009 surface samples
Authors of this report:
Mike Saynor – Environmental Research Institute of the Supervising Scientist, GPO Box 461, Darwin NT 0801, AustraliaRichard Houghton – formerly Environmental Research Institute of the Supervising Scientist, GPO Box 461, Darwin NT 0801, Australia. At time of publication: Steelcon Constructions, 668 Stuart Highway, Berrimah, NT 0828, Australia
The Supervising Scientist is part of the Australian Government Department of Sustainability, Environment, Water, Population and Communities.
© Commonwealth of Australia 2011
Supervising ScientistDepartment of Sustainability, Environment, Water, Population and Communities GPO Box 461, Darwin NT 0801 Australia
This work is copyright. Apart from any use as permitted under the Copyright Act 1968, no part may be reproduced by any process without prior written permission from the Supervising Scientist. Requests and enquiries concerning reproduction and rights should be addressed to Publications Enquiries, Supervising Scientist, GPO Box 461, Darwin NT 0801.
e-mail: [email protected]
Internet: www.environment.gov.au/ssd (www.environment.gov.au/ssd/publications)
The views and opinions expressed in this report do not necessarily reflect those of the Commonwealth of Australia. While reasonable efforts have been made to ensure that the contents of this report are factually correct, some essential data rely on references cited and/or the data and/or information of other parties, and the Supervising Scientist and the Commonwealth of Australia do not accept responsibility for the accuracy, currency or completeness of the contents of this report, and shall not be liable for any loss or damage that may be occasioned directly or indirectly through the use of, or reliance on, the report. Readers should exercise their own skill and judgment with respect to their use of the material contained in this report.
Printed and bound in Darwin NT by Supervising Scientist Division

ContentsExecutive summary iv
Acknowledgments iv
1 Introduction 1
2 Background on surface material sampling methods 3
3 Methods 43.1 Trial landform surface material collection 43.2 Digital photographs 6
3.3 Digital GravelometerTM 63.4 Particle size analysis (PSA) 63.5 Grain size statistics 73.6 Statistical analyses 7
4 Results 74.1 Photos of the material sample sites 2009 and 2010 7
4.2 Digital GravelometerTM results 74.3 Particle size results 74.4 Grain size statistics 74.5 Statistical differences in grain size statistics. 7
5 Discussion and conclusions 75.1 Further work 7
6 References 7
Appendix 1 Nutrient sample sites 7
Appendix 2 Grain size cumulative frequency data for the 24 surface samples on which particle size analysis was completed 7
Appendix 3 Cumulative frequency data from Digital GravelometerTM for each of the 12 surface sample sites 7
Appendix 4 Graphic grain size statistics for the gravel fraction 7
iii

Executive summaryA trial landform was constructed during 2008 and 2009 at the Ranger mine site to assist with the landform design and revegetation of the closed mine. The research design tests two types of potential surface material, waste rock and waste rock blended with approximately 30% fine-grained weathered horizon material (lateritic material), for their suitability as cap materials. The purpose of this report is to characterise the particle size statistics of the surface material of the trial landform.
Bulk samples of surface material were collected at 12 sites across the trial landform with two samples collected at each site. Generally one sample was collected from between rip lines and the other sample was collected from the top of the mound formed by the rip lines. Particle size analysis by a combined hydrometer and sieve method was undertaken on the 24 samples and graphic grain size statistics calculated from the cumulative frequency distribution. A software package called ‘Digital Gravelometer’TM was also used to derive particle size distributions from vertical photographs of the surface material at the same sites and the graphic grain size statistics were calculated from the cumulative frequency distribution.
The results from the sieve and hydrometer method were used for comparisons and show that there is no significant difference in graphic grain size statistics between the samples collected between the rip lines and those samples collected at the top of the mound created by the rip line. The results also show that for three of the five graphic grain size statistics there was no significant difference between the waste rock and the waste rock mixed with lateritic material. However for graphic mean size and inclusive graphic standard deviation there was a significant difference.
The graphic grain size statistics for the combined hydrometer and sieve method were significantly different to those derived from the ‘Digital Gravelometer’ TM. The reasons for the poor correspondence in graphic grain size statistics between the two methods are that:
The ‘Digital Gravelometer’TM is unable to determine the full range of particle sizes as provided by the sieve and hydrometer method,
it is unduly influenced by the unevenness of the ground which creates shadows which are wrongly measured as individual clasts,
it has problems distinguishing the smaller particles and often aggregated the smaller particles into one large particle,
and it had problems recognising individual angular clasts of waste rock.
Particle size analysis by the combined hydrometer and sieve method provides a better estimation of the size distribution of the particles present on the trial landform surface. It does however underestimate the amount of very large particle sizes because it was not physically possible to collect a large enough sample to inclusively contain a sufficiently representative sample of these very large components.
AcknowledgmentsThanks to Dr Wayne Erskine and Dr David Jones for reviewing and commenting on the document and to Ann Webb for assistance with editing and formatting of the document.
iv

Ranger trial landform: Particle size of surface material samples in 2009 with additional
observations in 2010MJ Saynor & R Houghton
1 IntroductionA trial landform of approximately 200 m x 400 m (8 ha) in footprint area, was constructed during late 2008 and early 2009 by Energy Resources of Australia Ltd (ERA) adjacent to the north-western wall of the Tailings Storage Facility (TSF) at Ranger mine (Figure 1). The trial landform was constructed to assist with the landform design and revegetation strategies being proposed for rehabilitation of the site at the end of mine life. The research design tests two types of potential final surface materials:
1 Waste rock
2 Waste rock blended with approximately 30% v/v fine-grained weathered horizon material (lateritic material).
Figure 1 Aerial view of the completed trial landform located next to the Ranger mine Tailings Storage Facility (taken 28 August 2009 by M Saynor)
Once the trial landform had been constructed the surface was ripped along the contour using tynes attached to a large bulldozer (Figures 2 & 3). Research on the evolution of the trial landform is being conducted collaboratively by Supervising Scientist Division (SSD) and ERA. SSD is focussing on quantifying exports or eroded cover material and solutes in surface runoff.
1

Figure 2 Tynes on the back of a large bull dozer. The tynes are raised when not ripping the surface.
Figure 3 Ripping the surface of the trial landform. The mounds created by the tynes can be seen as well as the area yet to be ripped.
To measure surface hydrology, erosion rates and solute loads, four erosion plots measuring 30 m x 30 m (Figure 4) were constructed on the trial landform. Research into revegetation strategies and the evolution of vegetation cover is being primarily undertaken by ERA. The landform is divided into six treatment areas with each treatment designed to test different planting methods and substrate types (Figure 4) as follows:
1 Tube stock planted in waste rock;
2 Direct seeding in waste rock;
3 Direct seeding in waste rock mixed with lateritic material to a depth of 2 m;
4 Direct seeding in waste rock mixed with lateritic material to a depth of 5 m;
5 Tube stock planted in waste rock mixed with lateritic material to a depth of 2 m;
6 Tube stock planted in waste rock mixed with lateritic material to a depth of 5 m.
The focus of the work described here is the determination of the graphic particle size statistics (Folk & Ward 1957, Folk 1974, 1980) of the surface material from different parts of the trial landform.
2

Figure 4 Surface treatments and layout of erosion plots on the trial landform
2 Background on surface material sampling methodsObtaining bulk samples from specific geomorphic environments is the accepted method of sampling surficial sediments (Kellerhals & Bray 1971). This involves the collection of material from a predetermined volume within a specific geomorphic environment (Kellerhals & Bray 1971). However, there are potential problems with bulk sampling that must be recognised. Very large sample masses are required to obtain reproducible measures of the grain size distributions of samples containing individual large clasts or gravels (de Vries 1970, Church et al 1987, Gale & Hoare 1992, Ferguson & Paola 1997).
Where collection of sediment from a specific depositional environment is difficult because the mass is too large for collection, transport and/or analysis, sub-sampling is practised. Recommended minimum sample mass also depends on sediment sorting or the dispersion of the grain size distribution (Gale & Hoare 1994, Ferguson & Paola 1997). Poorly sorted material, such as on the surface of the trial landform and as found in mixed sand- and gravel-bed rivers, require larger masses than better sorted samples (Gale & Hoare 1994, Ferguson & Paola 1997). For example, Church et al (1987) found that if the maximum grain size in a sample is 90 mm then a minimum sample mass of 1000 kg is required to obtain a reproducible measure of the grain size distribution! Gale & Hoare’s (1992) results indicate that the Church et al (1987) relationship may, in fact, underestimate minimum sample masses for some geomorphic environments! Clearly, even if it is possible to bulk sample gravel deposits containing large clasts, the required masses are so large as to be physically impossible to collect, transport, store and sieve. Observations by the authors of material on the trial landform have identified some boulders that are larger than 500 mm. The largest sample of fluvial gravels that Dr Erskine has ever collected over the last 33 years was 32 kg from the Cudgegong River (Benn & Erskine 1994) which only yields reproducible measures of the grain size distribution for samples with a maximum size of 30 mm! It is impossible to collect and transport larger samples without using heavy earth moving machinery (excavators and semi-trailers).
3

Clearly with the large particle sizes present on the trial landform, collection of the minimum sample mass to satisfy the representative sampling criteria of Church et al (1987) and Gale & Hoare (1992) was not physically possible. For collection of surface material samples from the trial landform it was decided to take a number of bulk samples and to augment this with information obtained from analyses of photographs of surface material taken prior to sampling. Information on particle size and number was to be obtained from the photographs using a method similar to Ibbeken and Schleyer (1986).
3 Methods3.1 Trial landform surface material collection In March 2009 ERA staff collected surface material samples from across the surface of the trial landform for the purpose of nutrient analysis. The locations for these samples were randomly generated using GIS. Five samples were collected from each of the 6 different treatments (total of 30 samples). Note, however, that only one of the ERA nutrient samples sites was located within an erosion plot (site 6 is located in erosion plot 2). The GPS locations were supplied to eriss by ERA (Appendix 1). Two of the sample sites from each of the six treatments were selected by SSD to collect additional samples for particle size analysis (total of 12 samples). The selected sites are shown in Figures 4 and 5.
Figure 5 ERA nutrient sample locations on the Trial Landform. The eriss sample sites are denoted by the red circles.
4

In April 2009, surface sample sites were located by GPS (Garmin etrex). A 1 m marked square was laid out on the ground at each sample location to capture a rip line and the area between the rip lines. A small step ladder was used to take photographs looking vertically down onto the area contained within the 1 m x 1 m square (shown in images below). At each location, several images were taken with a Canon 10 megapixel SLR camera. An oblique image was also taken once the samples had been collected to show the location of the sample sites in the context of the landform and to help with future relocation, as required.
Within the 1 m x 1 m square, surface material samples were collected using a spade down to a maximum depth of 10 cm. At each location, two surface samples were collected for particle size analysis, where possible, one from the top of one of the mounds displaced by the tyne and the other in the area between the rip lines (Figure 6). At several of the sample sites mounds displaced by the tyne were not present and samples were collected from the flat areas and named as between rips (sample 1 & sample 2). A total of 24 surface material samples were collected, two from each site shown as the red circled areas in Figure 5. The samples were collected to determine whether there was any difference in graphic grain size statistics between the mounds displaced by the rip lines and the undisturbed area between the rip lines. Each sample was placed in a clearly labelled bag for transport to the eriss laboratory in Darwin. Prior to leaving the Ranger site, all surface samples were checked by the Radiation Department and issued with a Radiation Release Certificate – 12182 1/5/09.
In September 2010, the original sites were relocated using the GPS coordinates and the oblique images from 2009. The sites were rephotographed and any observed ground surface changes recorded. Surface samples were not collected in 2010.
Figure 6 Shows the top of mounds created by ripping and the areas between the rip lines. A large boulder is also visible in the bottom left of the image.
5

3.2 Digital photographsSeveral digital photographs were taken at each surface sample location prior to sample collection. After the photographs and the samples were collected, the authors became aware of a computer software package (Digital GravelometerTM) that could be used to determine the particle size of samples containing large clasts (Graham et al 2005a).
The introduction to Digital GravelometerTM web page says that
‘Digital GravelometerTM is a tool for rapidly measuring the surface grain-size distribution of gravel. It has been designed for use on fluvial sediment, but should find application in other environments’ http://www.sedimetrics.com/documentation/introduction.html accessed on 19/4/2011.
The two sampled environments on the trial landform should be examples of the ‘other environments’ for which the Digital GravelometerTM could be used.
3.3 Digital GravelometerTM
A trial version of the software package Digital GravelometerTM was downloaded from the http://www.sedimetrics.com/ web site. The Digital GravelometerTM was applied to at least one image from each of the 12 samples locations and used to calculate particle diameters. For each of the 12 locations, a particle size distribution was obtained. Figure 10 in Graham et al (2005b) suggests that for a 1 m2 area with a 10 mega pixel camera the minimum particle size that can be resolved is 7 mm. In this context it should be noted that a significant component of some of the trial landform surface material is finer than 7 mm.
3.4 Particle size analysis (PSA)The 24 surface material samples (two from each sample site) collected in 2009 were subjected to particle size analysis using the hydrometer and sieve method of Gee and Bauder (1986). The samples were dried at 40C for at least 7 days and then sieved through a 2 mm sieve to split the sample into the gravel fraction (> 2mm) and the fine earth (sand, silt and clay) fraction (< 2mm). The gravel fraction of each of the samples was sieved in its entirety.
For the < 2 mm fraction, a sub-sample (between 80–100 g) was obtained using a riffle splitter. The < 2 mm fraction samples were chemically dispersed with 25 mL of sodium hexametaphosphate before being mechanically dispersed on a shaking wheel or platform for at least 12 hours. The sample was then wet sieved through a 63 μm or 4 (phi)1 stainless steel sieve with the mud (silt & clay < 63 µm) fraction collected in a 1000 mL cylinder. The sand fraction retained on the 63 µm or 4 stainless steel sieve was oven dried at 105C, weighed and dry sieved through a nest of sieves at /2 intervals, using a 15 minute shake time.
The mud suspension retained in the 1000 mL cylinder was made up to volume with distilled water and left in a constant temperature (24°C) room for at least 24 hours to allow temperature equilibration. The equilibrated sample was stirred with a stirring rod before the 5 minute reading to resuspend the material prior to taking the hydrometer readings. Hydrometer readings were taken at 5 min, 10 min, 90 min, 270 min, 480 min and 1440 min and were used to determine the amount of silt and clay in the sample. The fraction coarser than 20 μm or 5.65
1 The phi () notation system is often used to describe the grain size of clastic sediment by sedimentologists (Folk 1974, 1980). It is a logarithmic scale in which each grade limit is twice as large as the next smaller grade limit (Folk 1974, 1980) and is denoted by:
= -log2 d
where d is the grain diameter in mm.
6

was also determined by decantation using a sedimentation time based on Stokes equation for the water temperature at the time. The grain size data are included in Appendix 2.
3.5 Grain size statisticsGraphic grain size statistics (ie graphic mean size, inclusive graphic standard deviation, inclusive graphic skewness, graphic kurtosis and transformed kurtosis) were calculated using the equations of Folk and Ward (1957) and Folk (1974, 1980). These equations are outlined in Saynor et al (2006) and only use, at most, 90% of the grain size distribution between the 5 th
and 95th percentiles (Folk & Ward 1957; Folk 1974, 1980).
3.6 Statistical analysesTo test for normality, the values for each grain size statistic were subjected to an Anderson-Darling test. This is a simple but powerful objective measure of how well data follow a particular distribution (Ryan & Joiner 1976). When the data were normally distributed, to test for equal variances the relevant test in Minitab was used to determine whether there were significant differences between the samples collected between the rips and the samples collected from the mound created by ripping. Where the data were not normally distributed, Levene’s test was used. Where the data were normally distributed and the variances were equal the Two-Sample t-test was used to determine whether the means for the various grain size statistics between the samples collected between the rips and the samples collected from the mound created by ripping were significantly different. Where the data were non-normally distributed, the Mann Whitney test was used to determine whether the differences in distributions were significant.
4 Results4.1 Photos of the material sample sites 2009 and 2010In the photos below an oblique image is used to show the location of both sample sites, namely on top of the mound created by ripping and between the rip lines. The surface material sample sites are shown in numerical order. Photos of each site for 2009 & 2010 are shown below and have been annotated with circles and numbers to indicate the sample on top of the mound created by ripping and the sample collected between the rip lines. The circles indicate where the samples were collected (orange on top of the rip mound and white on the surface between rip lines). Coloured numbers (1 & 2) have been used to identify the same rocks or clasts in each photo. A general observation was that the sample holes usually infilled with finer material after sample collection.
Note – The sample locations were supplied, samples collected and named with a EWLS nomenclature. To keep continuity between the samples that were collected in 2009 the EWLS prefix for the sample site has been kept as is to avoid confusion.
7

Surface material sample EWLS site 2
Surface Material sample EWLS site 2. Oblique image of the sample locations and holes created in 2009. Image is taken looking north east across the landform. White circle shows sample collected from between the rip lines and orange circle shows sample collected from the mound created by ripping.
GPS location: 12.680700E, 132.895550S
Treatment: Waste rock material with planted tube stock.
8

Surface material sample EWLS site 2 in 2009 prior to samples being collected. Sample locations shown by circles.
Surface material sample at EWLS site 2 in 2010 showing the location of samples collected in 2009. The same clasts are indicated by the same number in each photo.
The orange circle was sampled on the top of the mound created by the rip line and has infilled with some large clasts as well as fine material. The white circle has infilled with fine material only.
9
1
1
2
2

Surface material sample EWLS site 5
Surface material sample EWLS site 5. Oblique image of the samples collected in 2009. The image is taken looking north east across the landform and also over Erosion Plot 1
GPS location: 12.680000E, 132.896400S
Treatment: Waste rock material with planted tube stock
10

Surface material sample EWLS site 5 in 2009 prior to samples being collected.
Surface material sample EWLS site 5 in 2010.
11
1
1
2
2

Surface material sample EWLS site 6
Surface material sample EWLS site 6. Oblique image of the samples collected in 2009. The image is taken looking north east across the landform. This site is located in erosion plot 2.
GPS location: 12.680240E, 132.896810S
Treatment: Waste rock material with direct seeding.
12

Surface material sample EWLS site 6 in 2009 prior to samples being collected.
Surface material sample EWLS site 6 in 2010.
13
1
2
1
2

Surface material sample EWLS site 9
Surface material sample EWLS site 9. Oblique image of the samples collected in 2009. The image is taken looking north east across the landform.
GPS location: 12.681110E, 132.896170S
Treatment: Waste Rock material with direct seeding.
14

Surface material sample EWLS site 9 in 2009 prior to samples being collected.
Surface material sample EWLS site 9 in 2010.
15
1
1
2
2

Surface material sample EWLS site 13
Surface material sample EWLS site 13. Oblique image of the samples collected in 2009. The image is taken looking north east across the landform.
GPS location: 12.682350E, 132.897780S
Treatment: Waste Rock & lateritic material (5 m) with planted tube stock.
16

Surface material sample EWLS site 13 in 2009 prior to samples being collected.
Surface material sample EWLS site 13 in 2010.
The white circle has a large rock where the hole was. Rock 1 has been shifted during the year. Several tufts of grass (dead) are present in the 2010 image.
17
1
1
2
2

Surface material sample EWLS site 15
Surface materials sample EWLS site 15. Oblique image of the samples collected in 2009. The image is taken looking south west across the landform.
GPS location: 12.682340E, 132.897320S
Treatment: Waste Rock & lateritic material (5 m) with planted tube stock.
18

Surface material sample EWLS site 15 in 2009 prior to samples being collected.
Surface material sample EWLS site 15 in 2010.
Both of the samples were collected between the mounds created by ripping and both have been filled with fine material.
19
1
1
2
2

Surface material sample EWLS site 16
Surface material sample EWLS site 16. Oblique image of the samples collected in 2009. The image is taken looking south west across the landform.
GPS location: 12.681770E, 132.897650S
Treatment: Waste Rock & lateritic material (2 m) with planted tube stock.
20

Surface material sample EWLS site 16 in 2009 prior to samples being collected.
Surface material sample EWLS site 16 in 2010.
There are tufts of grass (dead) present in the 2010 image.
21
1
1
2
2

Surface material sample EWLS site 18
Surface material sample EWLS site 18. Oblique image of the sample location in 2010. No image was taken in 2009 after the samples had been collected so it is not able to determined where the hole locations were. The image is taken looking north east across the landform.
GPS location: 12.681670E, 132.898350S
Treatment: Waste Rock & lateritic material (2 m) with planted tube stock.
22

Surface material sample EWLS site 18 in 2009 prior to samples being collected.
Surface material sample EWLS site 18 in 2010.
23
1
1
2
2

Surface material sample EWLS site 23
Surface material sample EWLS site 23. Oblique image of the samples collected in 2009. The image is taken looking south west across the landform.
GPS location: 12.680920E, 132.8977690S
Treatment: Waste Rock & lateritic material (2 m) with direct seeding.
24

Surface material sample EWLS site 23 in 2009 prior to samples being collected.
Surface material sample EWLS site 23 in 2010.
25
1
1
2
2

Surface material sample EWLS site 25
Surface material sample EWLS site 25. Oblique image of the samples collected in 2009. The image is taken looking south west across the landform.
GPS location: 12.681110E, 132.897050S
Treatment: Waste Rock & lateritic material (2 m) with direct seeding.
26

Surface material sample EWLS site 25 in 2009 prior to samples being collected.
Surface material sample EWLS site 25 in 2010.
Grass has grown in the hole that was sampled between the rips and there are other tufts of grass as well.
27
1
1
2
2

Surface material sample EWLS site 28
Surface material sample EWLS site 28. Oblique image of the samples collected in 2009. The image is taken looking south west across the landform.
GPS location: 12.681740E, 132.896560S
Treatment: Waste Rock & lateritic material (5 m) with direct seeding.
28

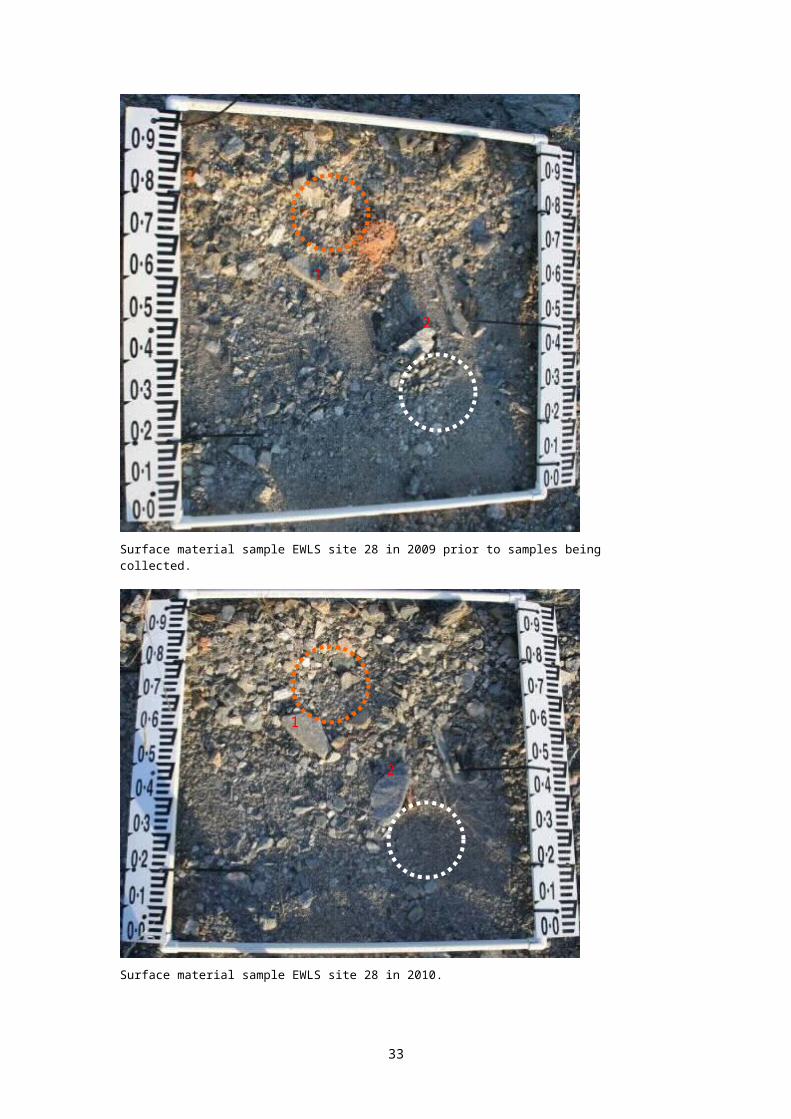
Surface material sample EWLS site 28 in 2009 prior to samples being collected.
Surface material sample EWLS site 28 in 2010.
There are a couple of tufts of grass (dead) in the 2010 image.
29
1
1
2
2

Surface material sample EWLS site 30
Surface material sample EWLS site 30. Oblique image of the samples collected in 2009. The image is taken looking south west across the landform.
GPS location: 12.680420E, 132.895680S
Treatment: Waste Rock & lateritic material (5 m) with direct seeding.
30

Surface material sample EWLS site 30 in 2009 prior to samples being collected.
Surface material sample EWLS site 30 in 2010.
Both of the samples were collected between the rips and both have been infilled with fine material.
31
1
1

4.2 Digital GravelometerTM resultsUp to eight vertical images were taken at each of the 12 sample sites, before sample collection. The images were then analysed using the Digital GravelometerTM using two approaches. Firstly, multiple images were analysed individually and secondly, multiple images were analysed simultaneously and the results aggregated. The aggregated results usually conformed to the average of the individual results and have been used in this report. For the Digital GravelometerTM results contained in this report the default parameter settings adopted by the program were used.
The Digital GravelometerTM was only able to determine particle sizes with b-axis diameters greater than 0.7 mm (0.5 ). It was hoped that this method could be used in future years to determine particle size at each sample location without having to collect a sample for time consuming particle size analysis using the sieve and hydrometer methods. In addition such a method is non-destructive in that there is no physical disturbance of the surface that could influence future behaviour. During the analysis undertaken by the Digital GravelometerTM the following 6 images shown in Figure 7 were generated for site 30.
After initially looking at all of the images (Figure 7) for one of the sites it was decided that for each site only the grains selected (Figure 7A) and the final overlay (Figure 7F) would be generated. These images highlighted several problems with the Digital GravelometerTM
software, including false classification resulting from uneven ground, shadows, variations or striations in the rocks, differences in surface texture of clasts, etc. Several images illustrating these problems are shown below.
32

A Greyscale – convert colour image to greyscale B Transformed – Uses known scale points to transform the image to a true scale
C Grains – Initial identification of grains D Watershed segmented grains – Attempts to divide the larger grains into several smaller grains
E - Grains selected – shows the grains that it has used
F - Greyscale image overlaid on grains selected – shows the actual grains selected overlayed on to
the transformed greyscale image
Figure 7 Images showing the various images that are generated during the measurement process
33

Surface material sample EWLS site 6 showing image of grains that have been selected.
Surface material sample EWLS site 6 final image of grains selected overlying the transformed greyscale image. Where there is fine material (< 2.0 mm) these have been grouped together to form several large clasts. This area does contain large clasts, however, they have not been determined. They have also been grouped with shadows from the surrounding frame. Also the scale bar on the outside of the frame has been determined as large clasts. Several of the smaller clasts in the middle of the image have been determined appropriately.
34

Surface material sample EWLS site 13 showing image of grains that have been selected.
Surface material sample EWLS site 13 final image of grains selected overlying the transformed greyscale image. This final image has problems to the left side of the 1 m square and has determined it as two large particles and not been able to determine any of the individual particles at all. At the top of the image it has also depicted the scale bars as particles. The particles in the middle of the image have been reasonably well determined. However these better determinations can not be separated from the other less well determined particles.
35

Surface material sample EWLS site 18 showing image of grains that have been selected.
Surface material sample ELWS site 18 final image of grains selected overlying the transformed greyscale image. This image has not determined very many particles at all. It has determined a large particle outside of the square but has not been able to determine many particles within the 1 m square.
36
4.3 Particle size results4.3.1 Combined sieve and hydrometer particle size resultsThe gravel and fine earth percentages and the total sample masses are shown in Table 1. The cumulative frequency data for the bulk surface material samples are shown in Appendix 2.
Table 1 Total sample mass and percentages less than and greater than 2 mm for the 24 surface material samples collected on the Trial Landform
Sample name % Sample > 2 mm
% Sample < 2 mm
% Sample < 63 μm
Total Sample Mass (g)
EWLS 2 BR 62.6 37.4 8.9 6211
EWLS 2 TR 72.5 27.5 6.7 6109
EWLS 5 BR 70.8 29.2 4.3 8456
EWLS 5 TR 78.7 21.3 4.5 7414
EWLS 6 BR 57.6 42.4 9.7 6894
EWLS 6 TR 56.4 43.6 12.1 6488
EWLS 9 BR 67.3 32.7 7.5 5796
EWLS 9 TR 70.0 30.0 4.8 7106
EWLS 13 BR 60.9 39.1 9.6 5508
EWLS 13 TR 57.4 42.6 11.5 5190
EWLS 15 BR1 65.2 34.8 8.5 6821
EWLS 15 BR2 57.2 42.8 10.2 6049
EWLS 16 BR1 60.0 40.0 10.2 5285
EWLS 16 BR2 60.9 39.1 10.2 4955
EWLS 18 BR 60.8 39.2 10.0 5743
EWLS 18 TR 59.1 40.9 8.5 4864
EWLS 23 BR 63.2 36.8 8.6 6078
EWLS 23 TR 65.9 34.1 9.5 7312
EWLS 25 BR 66.5 33.5 9.0 9422
EWLS 25 TR 63.8 36.2 11.5 5880
EWLS 28 BR 69.2 30.8 7.4 3922
EWLS 28 TR 57.1 42.9 10.4 6517
EWLS 30 BR1 50.4 49.6 20.9 5807
EWLS 30 BR2 60.8 39.2 14.7 4920
Minimum Values 50.4 21.3 20.9 3922
Maximum Values 78.7 49.6 4.3 9422
Average Value 63.1 36.9 9.6 6198
The gravel percentage in all 24 samples was greater than 50% ranging from 50.4% to 78.7%. This illustrates the coarse nature of the material (predominantly waste rock) that has been used in the construction of the trial landform.
The particle size analysis determined that the percentage < 63 μm ranged from 4.3% to 20.9%, with an average of 9.6%, for the 24 samples.
37

4.3.2 Digital GravelometerTM particle size resultsThe Digital GravelometerTM calculated cumulative frequency data for each of the 12 samples. It was only able to distinguish particle sizes greater than 0.5 (0.7 mm). The cumulative frequency data for each of the 12 samples are shown in Appendix 3.
4.4 Grain size statistics4.4.1 Bulk surface material sample grain size resultsThe grain size statistics for each of the 24 bulk surface samples collected in 2009 were calculated and the values are shown on Table 2. The graphic mean () ranges from -3.63 (12.38 mm) to -0.98 (1.07 mm) with an average of -1.97 (4.44 mm).
Table 2 Graphic grain size statistics for the surface samples collected on the trial landform in 2009
Sample name Graphic Mean()
Graphic Mean(mm)
Inclusive Graphic Standard Deviation
()
Inclusive Graphic
Skewness
Graphic Kurtosis
Transformed Kurtosis
EWLS2 BR -1.89 3.71 3.89 0.23 0.86 0.46
EWLS2 TR -2.71 6.54 3.66 0.42 0.87 0.47
EWLS5 BR -3.55 11.71 3.67 0.30 0.92 0.48
EWLS5 TR -3.63 12.38 3.35 0.56 0.96 0.49
EWLS6 BR -1.82 3.53 3.98 0.10 1.01 0.50
EWLS6 TR -0.98 1.97 3.82 0.29 0.96 0.49
EWLS9 BR -2.25 4.76 3.60 0.35 0.80 0.45
EWLS9 TR -2.66 6.32 3.47 0.24 0.85 0.46
EWLS13 BR -1.93 3.81 4.11 0.23 0.87 0.46
EWLS13 TR -1.35 2.55 4.37 0.26 1.03 0.51
EWLS15 BR1 -2.28 4.86 3.98 0.32 0.92 0.48
EWLS15 BR2 -1.15 2.22 3.70 0.32 1.03 0.51
EWLS16 BR1 -1.58 2.99 4.06 0.28 0.95 0.49
EWLS16 BR2 -1.67 3.18 4.15 0.32 0.88 0.47
EWLS18 BR -1.70 3.25 3.90 0.28 0.89 0.47
EWLS18 TR -1.37 2.58 3.61 0.30 1.00 0.50
EWLS23 BR -2.26 4.79 4.14 0.27 0.81 0.45
EWLS23 TR -2.30 4.92 4.53 0.39 0.93 0.49
EWLS25 BR -2.74 6.68 4.81 0.18 0.94 0.49
EWLS25 TR -1.50 2.83 4.08 0.41 1.10 0.52
EWLS28 BR -2.37 5.17 3.71 0.36 0.80 0.44
EWLS28 TR -1.30 2.46 4.03 0.26 0.96 0.49
EWLS30 BR1 -0.99 1.99 3.82 0.40 1.24 0.55
EWLS30 BR2 -1.47 2.10 4.26 0.35 1.13 0.53
Min Value -0.98 1.97 3.35 0.10 0.80 0.44
Max Value -3.63 12.38 4.81 0.56 1.24 0.55
Average Value -1.97 4.44 3.94 0.30 0.94 0.48
38

4.4.2 Digital GravelometerTM grain size statisticsThe Digital GravelometerTM calculated grain size statistics (except for Transformed Kurtosis) for each of the 12 surface images taken in 2009 and the results are summarised in Table 3.The Digital GravelometerrTM did not report Transformed Kurtosis and it has not been calculated separately for this report. The graphic mean () ranges from -2.34 (5.06 mm) to -1.80 (3.48 mm) with an average of -2.04 (-4.12 mm).
Table 3 Graphic grain size statistics for the surface images taken on the trial landform in 2009 and processed by the Digital GravelometerTM
Site Graphic Mean ()
Graphic Mean (mm)
Inclusive Graphic Standard Deviation ()
Inclusive Graphic Skewness
Graphic Kurtosis
EWLS2 -1.92 3.79 1.20 0.13 1.22
EWLS5 -2.07 4.21 1.31 0.15 1.16
EWLS6 -2.34 5.06 1.33 0.14 1.36
EWLS9 -1.92 3.80 1.22 0.14 1.20
EWLS13 -2.23 4.68 1.32 0.16 1.25
EWLS15 -1.95 3.86 1.27 0.10 1.21
EWLS16 -2.10 4.28 1.76 0.17 1.24
EWLS18 -2.19 4.56 1.38 0.18 1.19
EWLS23 -1.80 3.48 1.14 0.06 1.24
EWLS25 -1.92 3.79 1.27 0.01 1.21
EWLS28 -2.08 4.24 1.26 0.10 1.22
EWLS30 -1.90 3.72 1.22 0.07 1.24
Min Value -1.80 3.48 1.14 0.01 1.16
Max Value -2.34 5.06 1.76 0.18 1.36
Average Value -2.04 4.12 1.31 0.12 1.23
4.5 Statistical differences in grain size statisticsThere are three hypotheses tested in this section:
Hypothesis 1: There is no difference in grain size statistics of bulk surface material samples collected between the rip lines and the top of the mound created by ripping that were analysed by the combined sieve and hydrometer method.,
Hypothesis 2: There is no difference in grain size statistics of bulk surface material samples collected from the waste rock and the waste rock mixed with lateritic material that were analysed by the combined sieve and hydrometer method.
Hypothesis 3: There is no difference in grain size statistics of samples analysed by the combined sieve and hydrometer method and by the Digital GravelometerTM.
4.5.1 Differences in grain size statistics between samples from top of mound created by ripping and those from between the rip linesThe data for each grain size statistic were normally distributed for both between the rip lines and the top of the mound created by ripping. The variances of each grain size statistic from each environment were equal (p < 0.05). The two-sample t-test for equal variance showed that there were no significant differences in graphic grain size statistics for samples collected from both surface treatments.
39

4.5.2 Differences in grain size statistics between waste rock and waste rock mixed with lateritic materialThe grain size statistics data for waste rock and waste rock mixed with lateritic material were all normally distributed. The variances were also equal for graphic mean size, inclusive graphic standard deviation, graphic kurtosis and transformed kurtosis (p = 0.05). The variances were not equal for inclusive graphic skewness. The two-sample t-test for equal variances showed that there were no significant differences for graphic kurtosis and transformed kurtosis. The Mann-Whitney test also showed no significant difference for inclusive graphic skewness. However, the two-sample t-test for unequal variances showed that there was a significant difference for graphic mean size and inclusive graphic standard deviation.
4.5.3 Differences in grain size statistics for samples analysed by the combined hydrometer and sieve method and Digital GravelometerTM
The Digital GravelometerTM calculated one set of graphic particle size statistics for each of the twelve surface samples. To enable comparison with the results for the two samples collected at each site for combined sieve and hydrometer analysis, the two samples were combined by adding the masses for each particle size interval and then recalculating the percentage in each of the size intervals using the total combined mass. It was demonstrated above that there was no significant difference in graphic grain size statistics for the two surface treatments. As the Digital GravelometerTM was only able to identify to a size of 0.5 (0.7 mm), a decision was made to only compare the gravel fractions ( > 2.0 mm) obtained by the two techniques. The grain size statistics for both methods were recalculated for > 2.0 mm only and are shown in Appendix 4.
The data for each grain size statistic for the combined particle size results and the Digital GravelometerTM were all normally distributed. The variances of each grain size statistic for the combined particle size results and the Digital GravelometerTM were not equal, except for graphic kurtosis and transformed kurtosis (p = 0.05). The two-sample t-test using unequal variances showed that there were significant differences for graphic mean size, inclusive graphic standard deviation & inclusive graphic skewness. A Mann-Whitney test revealed that there was a significant difference for kurtosis and transformed kurtosis between the combined particle size results and the Digital GravelometerTM. Clearly there is a significant difference in graphic grain size statistics between combined particle size results and the Digital Gravelometer TM. As a result, no further analysis of vertical photographs has been undertaken of surface material on the trial landform by the Digital Gravelometer TM.
5 Discussion and conclusionsTwenty-four bulk surface material samples from 12 sites were collected in 2009 from the trial landform. At each site, where possible, samples were collected from between the rip lines and also from the top of mounds created by ripping. No samples were collected for particle size analysis in 2010. Digital photographs were taken in both 2009 and 2010 at each sample site. These photos indicate that the holes produced by sample collection in 2009 had been infilled with fine material by 2010. In each set of photos common rocks were numbered to show if they were still in the same place in 2010. Mostly the rocks were in the same place but in some instances the rocks had moved because of people walking across the sites undertaking activities such as spraying for weeds, collecting Radon cups, accessing moisture probe data loggers and taking photos. There were also some grasses growing at the sample sites. It is recommended to continue taking these photos annually to keep a record of rock movement
40

and potential rock break down, keep a track of any armouring and also to keep a track of vegetation growth and development.
Cheetham et al (2008) investigated and compared several methods (laser diffraction, X-ray diffraction, scanning electron microscopy and combined sieve/hydrometer) for quantifying particle size distribution and found that in a sand-dominated fluvial environment the results obtained from the combined sieve and hydrometer method and laser diffraction were comparable. These results were based on similar sample preparation and applied to sand dominated fluvial sediments and did not take into account the gravel fraction of the sample. The results presented in this study have a very high percent of gravels present (generally angular clasts) and it was not appropriate to use laser diffraction in this study.
The Digital GravelometerTM should be able to determine the larger particle sizes that were impossible to physically collect due to their size (ie >500 mm b-axis diameter). However, in practice it was found that it was unable to identify the larger rocks and often amalgamated separate clasts into a single large clast. The Digital GravelometerTM was developed for use in fluvial environments to measure well rounded clasts on bars in gravel bed streams that usually have a relatively flat surface. The topography of the trial landform was much more uneven due to the rip lines and mounds. This unevenness and the 1 m2 grid boundary and bordering plate markers that was used for the photographs created shadows that caused the Digital GravelometerTM to have problems determining the individual particles that were present. Shadows were often grouped, artificially creating large clasts. There were also instances where different markings, textures or laminations in the rocks, such as quartz veins in a larger rock, were misidentified by the Digital GravelometerTM as different clasts.
The Digital GravelometerTM was unable to identify smaller particles (silt and clay) and often grouped these much smaller particles into one much larger clast, probably because the particles were all the same colour. The fine material in some cases was identified from the image as one single rock rather than lots of fine material (< 1.00 mm). This was further compounded by the presence of mica schist that was highly reflective Fluvial environments have rounded clasts as the gravels are rolled and bounced along the river bed. The particles on the trail landform were much more angular (the result of blasting in the pit) and have had no fluvial transport to make them less angular. It was expected that the Digital GravelometerTM
would be better able to distinguish large particles as it was unable to determine the smaller sized particles. For the gravel fractions only (Appendix4), the graphic grain size statistics for the Digital GravelometerTM are smaller than for the particle size results.
The particle size analysis results are much more reliable than those obtained from the Digital GravelometerTM for the following reasons:
The combined sieve & hydrometer method is better able to determine the full range of particle sizes.
The Digital GravelometerTM is unduly influenced by the unevenness of the ground which creates shadows which are measured as individual clasts.
The Digital GravelometerTM had problems distinguishing the smaller particles and often aggregated the smaller particles into one large particle.
The Digital GravelometerTM had problems recognising individual angular clasts of waste rock.
Soils in the Gulungul Creek catchment immediately to the west of Ranger mine were sampled in 2006 as part of a large project looking at the impacts of Cyclone Monica, which passed
41

through the area in April 2006 (Saynor et al 2009). Detailed particle size analyses were undertaken on samples collected from the catchment. Results of 12 samples collected from Woodland and Open woodland vegetation communities that are indicative of the type of soils on the natural surrounding Koolpinyah surface showed that the gravel fractions ranged from 0.0 % to 45.6 % with 6 of the samples having a gravel percentage less than 5 %. This indicates that the surface material on the trial landform (predominantly waste rock) is much coarser than on the surrounding Koolpinyah surface.
Although the particle size results are more reliable than provided by the photographic image analysis, the particle size results will under estimate the amount of large particles > 500 mm in diameter because it was not physically possible to collect a large enough sample that was representative of the whole surface (Figure 8). It was hoped that the Digital GravelometerTM
might assist with the determination of larger particles but this was not the case. The Digital GravelometerTM was used on photos that were taken prior to knowing the correct sample methodology. It was developed for fluvial environments but it does not work on the uneven ripped surface composed of angular rocks on the trial landform.
5.1 Further workThe sample sites should be photographed each year to track gross changes that are occurring in surface morphology. Samples should also be collected in 2014 and 2019 (or before if rehabilitation of the site occurs earlier) for detailed particle size analysis to determine whether there has been significant weathering and breakdown of gravel clasts. The mounds created by ripping should also be observed to see if they change over time. Although no actual measurements were made of the height of these mounds, observations should be made to see if the mounds noticeably reduce in height or disappear entirely. In a study on the southern waste rock dump which comprised waste rock only, the rip lines and mounds were still evident 11 years after Eucalyptus miniata trees were planted (Figure 9).
Figure 8 Large Boulder on the Trial Landform with a mobile phone for scale
42

Figure 9 Eucalyptus miniata trees showing growth in the waste rock dump substrate to 2006. The trees were planted in February 1995. The rip lines are still quite evident and many of the rocks are still
competent.
6 ReferencesBenn PC & Erskine WD 1994. Complex channel response to flow regulation: Cudgegong
River below Windamere Dam, Australia. Applied Geography 14, 153–168.
Cheetham MD, Keene AF, Bush RT, Sullivan LA & Erskine WD 2008. A comparison of grain-size analysis methods for sand-dominated fluvial sediments. Sedimentology 55, 1905–1913.
Church MA, McLean DG & Wolcott JF 1987. River bed gravels: sampling and analysis. In Sediment transport in gravel-bed rivers, eds CR Thorne, JC Bathurst & RD Hey, Wiley, Chichester, 43–88.
de Vries M 1970. On the accuracy of bed-material sampling. Journal of Hydraulic Research 8, 523–533.
Ferguson RI & Paola C 1997. Bias and precision of percentiles of bulk grain size distributions. Earth Surface Processes and Landforms 22, 1061–1077.
Folk RL 1974. Petrology of sedimentary rocks. Hemphill, Austin.
Folk RL 1980. Petrology of sedimentary rocks. Hemphill, Austin.
Folk RL & Ward WD 1957. Brazos River bar: a study in the significance of grain size parameters. Journal of Sedimentary Petrology 27, 3–26.
Gale SJ & Hoare PG 1992. Bulk sampling of coarse clastic sediments for particle-size analysis. Earth Surface Processes and Landforms 17, 729–733.
43

Gale SJ & Hoare PG 1994. Reply: Bulk sampling of coarse clastic sediments for particle-size analysis. Earth Surface Processes and Landforms 19, 263–268.
Gee GW & Bauder JW 1986. Particle size analysis. In Methods of soil analysis Vol 1, Physical and mineralogical methods, ed A Klute, American Society of Soil Agronomy and Soil Science Society of America, Madison, 357–376.
Graham DJ, Rice SP & Reid I 2005a. A transferable method for the automated grain sizing of river gravels. Water Resources Research 41, W07020.
Graham DJ, Reid I & Rice SP 2005b. Automated sizing of coarse grained sediments: Image-processing procedures. Mathematical Geology 37(1), 1–28.
Ibbeken H & Schleyer R 1986. Photo-Sieving: A method for Grain-Size Analysis of Corase-Grained, unconsolidated Bedding Surfaces. Earth Surface Processes and Landforms 11, 59–77.
Kellerhals R & Bray DI 1971. Sampling procedures for coarse fluvial sediments. Journal of the Hydraulics Division, Proceedings of the American Society of Civil Engineers 97, 1165–1180.
minitab 2004. What is the Anderson-Darling goodness-of-fit test statistic? (URL: http://www.minitab.com/support/answers/answers.aspx?ID=731) Accessed on 7/07/2005.
Muir TC 1969. Sampling and analysis of coarse riverbed sediments. In Proceedings 4th
Mississippi State University Water Resources Research Institute Conference, April 8–9, 1969, Mississippi State University, 73–83.
Ryan TA & Joiner BL 1976. Normal probability plots and tests for normality. (URL: http://www.minitab.com/resources/whitepapers/normprob.aspx) Accessed on 15/04/2004.
Saynor MJ, Erskine WD & Evans KG 2006. Bed-material grain size changes in the Ngarradj Creek catchment between 1998 and 2003. Supervising Scientist Report 188, Supervising Scientist, Darwin NT.
Saynor MJ, Houghton R, Hancock G, Staben G, Smith B & Lee N 2009. Soil sample descriptions – Gulungul Creek, Ranger mine site and Nabarlek: Cyclone Monica fieldwork. Internal Report 558, March, Supervising Scientist, Darwin. Unpublished paper.
Wolman MG 1954. A method of sampling coarse river-bed material. Transactions of American Geophysical Union 35, 951–956.
44

Appendix 1 Nutrient sample sitesExcel spread sheet of nutrient sample sites collected by Earth Water Life Sciences on 19 March 2009, supplied by Phil Hickey (EWL) 27 March 2009. Shaded rows are the sites sampled by eriss for particle size analysis.
EWLS GDA/MGA zone 53 GDA94 Ranger mine Grid
Site no X Y Long Lat Mine_grd_X Mine_grd_Y
1 271445 8597238 132.895451 -12.6808 7766 10980
2 271456 8597252 132.895554 -12.6807 7776 10994
3 271470 8597284 132.895685 -12.6804 7787 11027
4 271518 8597316 132.896129 -12.6801 7832 11063
5 271547 8597330 132.896397 -12.68 7860 11079
6 271592 8597304 132.896809 -12.6802 7907 11057
7 271585 8597276 132.896743 -12.6805 7902 11029
8 271563 8597228 132.896537 -12.6809 7884 10979
9 271523 8597208 132.896167 -12.6811 7846 10956
10 271495 8597206 132.895909 -12.6811 7818 10952
11 271648 8597106 132.89731 -12.682 7979 10864
12 271664 8597056 132.897453 -12.6825 7999 10816
13 271699 8597072 132.897777 -12.6823 8032 10835
14 271680 8597096 132.897604 -12.6821 8011 10857
15 271649 8597060 132.897316 -12.6825 7983 10819
16 271685 8597136 132.897653 -12.6818 8013 10897
17 271726 8597072 132.898025 -12.6824 8059 10837
18 271761 8597148 132.898353 -12.6817 8088 10915
19 271733 8597140 132.898095 -12.6817 8061 10905
20 271748 8597120 132.898231 -12.6819 8077 10886
21 271652 8597172 132.897352 -12.6814 7977 10930
22 271676 8597210 132.897575 -12.6811 7998 10970
23 271688 8597230 132.897687 -12.6809 8009 10991
24 271622 8597232 132.89708 -12.6809 7943 10988
25 271619 8597208 132.897051 -12.6811 7942 10964
26 271599 8597174 132.896864 -12.6814 7924 10928
27 271603 8597160 132.8969 -12.6815 7930 10915
28 271566 8597138 132.896558 -12.6817 7894 10890
29 271585 8597100 132.89673 -12.6821 7916 10853
30 271622 8597116 132.897071 -12.6819 7952 10872
45

Appendix 2 Grain size cumulative frequency data for the 24 surface samples on which particle size analysis was completed
46

Surface material sample site EWLS2 cumulative frequency data
EWLS2 between rip lines (EWLS2 BR)EWLS2 top of mound created by
ripping (EWLS2 TR)
Phi (Φ) Size (mm)Cumulative Percentage Phi (Φ)
Size (mm)
Cumulative Percentage
-7.0 128 0.00 -7.0 128 0.00
-6.0 64 14.23 -6.0 64 18.38
-5.0 32 22.48 -5.0 32 33.76
-4 16 32.33 -4 16 48.06
-3.25 9.5 40.92 -3.25 9.5 53.34
-2 4 53.93 -2 4 65.70
-1.5 2.8 58.68 -1.5 2.8 69.12
-1 2 62.63 -1 2 72.52
-0.5 1.4 66.26 -0.5 1.4 74.38
0 1 68.97 0 1 76.15
0.5 0.71 71.70 0.5 0.71 78.17
1 0.5 74.81 1 0.5 80.58
1.5 0.355 77.64 1.5 0.355 82.86
2 0.25 80.90 2 0.25 85.45
2.5 0.18 84.09 2.5 0.18 87.97
3 0.125 86.78 3 0.125 90.11
3.5 0.09 89.25 3.5 0.09 92.04
4 0.063 91.07 4 0.063 93.30
4.64 0.04 94.24 4.64 0.04 95.75
5.76 0.0184 95.37 5.76 0.0185 96.33
6.26 0.0130 95.87 6.26 0.0131 96.91
7.06 0.0075 96.62 7.05 0.0075 97.49
7.85 0.0043 96.87 7.84 0.0044 98.07
8.64 0.0025 97.12 8.63 0.0025 98.26
9.05 0.0019 97.50 9.05 0.0019 98.65
14.00 0.0011 100.00 14.00 0.0011 100.00
Graphic grain size statistics of Folk and Ward (1957) and Folk (1974, 1980)
Site Graphic Mean ()
Graphic Mean (mm)
Inclusive Graphic Standard Deviation ()
Inclusive Graphic Skewness
Graphic Kurtosis
Transformed Kurtosis
EWLS2 BR -1.89 3.71 3.89 0.23 0.86 0.46
EWLS2 TR -2.71 6.54 3.66 0.42 0.87 0.47
Textural classification of surface material samples after Folk (1954, 1974, 1980)
Site Method Textural class
EWLS2 BR Detailed Particle Size Analysis Muddy Medium Sandy Pebbly Gravel
EWLS2 TR Detailed Particle Size Analysis Muddy Medium Sandy Pebbly Gravel
47

Surface material sample at site EWLS5 cumulative frequency data
EWLS5 between rip lines (EWLS5 BR)EWLS5 top of mound created by
ripping (EWLS5 TR)
Phi (Φ) Size (mm)Cumulative Percentage Phi (Φ)
Size (mm)
Cumulative Percentage
-8.0 256 0.00 -8.0 256 0.00
-7.0 128 19.10 -7.0 128 0.00
-6.0 64 29.31 -6.0 64 33.28
-5.0 32 43.65 -5.0 32 48.47
-4 16 51.04 -4 16 56.24
-3.25 9.5 59.31 -3.25 9.5 63.72
-2 4 70.82 -2 4 73.36
-1.5 2.8 74.15 -1.5 2.8 76.17
-1 2 76.83 -1 2 78.73
-0.5 1.4 79.35 -0.5 1.4 80.74
0 1 81.33 0 1 82.47
0.5 0.71 83.35 0.5 0.71 84.19
1 0.5 85.69 1 0.5 86.16
1.5 0.355 87.72 1.5 0.355 87.88
2 0.25 89.90 2 0.25 89.79
2.5 0.18 91.85 2.5 0.18 91.61
3 0.125 93.31 3 0.125 93.10
3.5 0.09 94.80 3.5 0.09 94.54
4 0.063 95.70 4 0.063 95.47
4.64 0.04 97.32 4.64 0.04 97.21
5.76 0.0184 97.64 5.76 0.0185 97.51
6.26 0.0130 98.11 6.26 0.0131 97.95
7.06 0.0075 98.42 7.05 0.0075 98.09
7.85 0.0043 98.74 7.84 0.0044 98.68
8.64 0.0025 98.74 8.63 0.0025 98.83
9.05 0.0019 99.05 9.05 0.0019 99.12
14.00 0.0011 100.00 14.00 0.0011 100.00
Graphic grain size statistics of Folk and Ward (1957) and Folk (1974, 1980)
Site Graphic Mean ()
Graphic Mean (mm)
Inclusive Graphic Standard Deviation ()
Inclusive Graphic Skewness
Graphic Kurtosis
Transformed Kurtosis
EWLS5 BR -3.55 11.71 3.67 0.30 0.92 0.48
EWLS5 TR -3.63 12.38 3.35 0.56 0.96 0.49
Textural classification for surface material samples Folk (1954, 1974, 1980)
Site Method Textural class
EWLS5 BR Detailed Particle Size Analysis Muddy Medium Sandy Pebbly Gravel
EWLS5 TR Detailed Particle Size Analysis Muddy Medium Sandy Pebbly Gravel
48

Surface material sample at site EWLS6 cumulative frequency data
EWLS6 between rip lines (EWLS6 BR)EWLS6 top of mound created by
ripping (EWLS6 TR)
Phi (Φ) Size (mm)Cumulative Percentage Phi (Φ)
Size (mm)
Cumulative Percentage
-7.0 128 0.00 -7.0 128 0
-6.0 64 16.19 -6.0 64 3.62
-5.0 32 20.28 -5.0 32 10.54
-4 16 26.55 -4 16 21.00
-3.25 9.5 34.43 -3.25 9.5 31.04
-2 4 47.57 -2 4 46.08
-1.5 2.8 52.81 -1.5 2.8 50.88
-1 2 57.57 -1 2 56.36
-0.5 1.4 63.09 -0.5 1.4 60.10
0 1 67.91 0 1 63.30
0.5 0.71 71.99 0.5 0.71 66.62
1 0.5 76.11 1 0.5 70.34
1.5 0.355 79.42 1.5 0.355 73.60
2 0.25 82.33 2 0.25 77.04
2.5 0.18 84.94 2.5 0.18 80.34
3 0.125 87.57 3 0.125 83.27
3.5 0.09 88.82 3.5 0.09 85.97
4 0.063 90.30 4 0.063 87.89
4.64 0.04 94.30 4.64 0.04 92.10
5.76 0.0184 94.94 5.76 0.0185 93.23
6.26 0.0130 95.25 6.26 0.0131 94.36
7.06 0.0075 95.73 7.05 0.0075 95.21
7.85 0.0043 96.20 7.84 0.0044 96.05
8.64 0.0025 96.36 8.63 0.0025 96.33
9.05 0.0019 96.68 9.05 0.0019 96.90
14.00 0.0011 100.00 14.00 0.0011 100.00
Graphic grain size statistics of Folk and Ward (1957) and Folk (1974, 1980)
Site Graphic Mean ()
Graphic Mean (mm)
Inclusive Graphic Standard Deviation ()
Inclusive Graphic Skewness
Graphic Kurtosis
Transformed Kurtosis
EWLS6 BR -1.82 3.53 3.98 0.10 1.01 0.50
EWLS6 TR -0.98 1.97 3.82 0.29 0.96 0.49
Textural classification for surface material samples Folk (1954, 1974, 1980)
Site Method Textural class
EWLS6 BR Detailed Particle Size Analysis Muddy Coarse Sandy Pebbly Gravel
EWLS6 TR Detailed Particle Size Analysis Muddy Medium Sandy Pebbly Gravel
49

Surface material sample at site EWLS9 cumulative frequency data
EWLS9 between rip lines (EWLS9 BR)EWLS9 top of mound created by
ripping (EWLS9 TR)
Phi (Φ) Size (mm)Cumulative Percentage Phi (Φ)
Size (mm)
Cumulative Percentage
-7.0 128 0.00 -7.0 128 0.00
-6.0 64 9.06 -6.0 64 19.10
-5.0 32 31.95 -5.0 32 30.23
-4 16 39.46 -4 16 37.92
-3.25 9.5 48.19 -3.25 9.5 47.90
-2 4 59.94 -2 4 62.28
-1.5 2.8 63.79 -1.5 2.8 66.45
-1 2 67.31 -1 2 69.95
-0.5 1.4 70.77 -0.5 1.4 74.04
0 1 73.36 0 1 77.21
0.5 0.71 75.73 0.5 0.71 79.98
1 0.5 78.54 1 0.5 82.81
1.5 0.355 81.17 1.5 0.355 85.24
2 0.25 83.96 2 0.25 87.79
2.5 0.18 86.74 2.5 0.18 90.21
3 0.125 89.09 3 0.125 92.23
3.5 0.09 91.03 3.5 0.09 94.00
4 0.063 92.50 4 0.063 95.16
4.64 0.04 95.15 4.64 0.04 97.39
5.76 0.0184 95.55 5.76 0.0185 97.82
6.26 0.0130 96.09 6.26 0.0131 98.26
7.06 0.0075 96.36 7.05 0.0075 98.69
7.85 0.0043 96.77 7.84 0.0044 99.13
8.64 0.0025 97.17 8.63 0.0025 99.35
9.05 0.0019 97.57 9.05 0.0019 99.56
14.00 0.0011 100.00 14.00 0.0011 100.00
Graphic grain size statistics of Folk and Ward (1957) and Folk (1974, 1980)
Site Graphic Mean ()
Graphic Mean (mm)
Inclusive Graphic Standard Deviation ()
Inclusive Graphic Skewness
Graphic Kurtosis
Transformed Kurtosis
EWLS9 BR -2.25 4.76 3.60 0.35 0.80 0.45
EWLS9 TR -2.66 6.32 3.47 0.24 0.85 0.46
Textural classification for surface material samples Folk (1954, 1974, 1980)
Site Method Textural class
EWLS9 BR Detailed Particle Size Analysis Muddy Medium Sandy Pebbly Gravel
EWLS9 TR Detailed Particle Size Analysis Muddy Coarse Sandy Pebbly Gravel
50

Surface material sample at site EWLS13 cumulative frequency data
EWLS13 between rip lines (EWLS13 BR)EWLS13 top of mound created by
ripping (EWLS13 TR)
Phi (Φ) Size (mm)Cumulative Percentage Phi (Φ)
Size (mm)
Cumulative Percentage
-7.0 128 0.00 -7.0 128 0.00
-6.0 64 16.43 -6.0 64 8.27
-5.0 32 24.86 -5.0 32 19.67
-4 16 32.56 -4 16 27.17
-3.25 9.5 40.95 -3.25 9.5 34.48
-2 4 52.96 -2 4 47.75
-1.5 2.8 57.07 -1.5 2.8 52.10
-1 2 60.87 -1 2 57.37
-0.5 1.4 64.72 -0.5 1.4 60.58
0 1 68.05 0 1 63.59
0.5 0.71 70.80 0.5 0.71 66.71
1 0.5 74.06 1 0.5 70.35
1.5 0.355 77.22 1.5 0.355 73.61
2 0.25 80.51 2 0.25 77.40
2.5 0.18 83.71 2.5 0.18 80.99
3 0.125 86.39 3 0.125 83.95
3.5 0.09 88.69 3.5 0.09 86.66
4 0.063 90.43 4 0.063 88.52
4.64 0.04 93.66 4.64 0.04 91.70
5.76 0.0184 94.22 5.76 0.0185 92.45
6.26 0.0130 95.00 6.26 0.0131 93.23
7.06 0.0075 95.31 7.05 0.0075 93.73
7.85 0.0043 95.63 7.84 0.0044 94.24
8.64 0.0025 96.25 8.63 0.0025 94.92
9.05 0.0019 96.56 9.05 0.0019 95.77
14.00 0.0011 100.00 14.00 0.0011 100.00
Graphic grain size statistics of Folk and Ward (1957) and Folk (1974, 1980)
Site Graphic Mean ()
Graphic Mean (mm)
Inclusive Graphic Standard Deviation ()
Inclusive Graphic Skewness
Graphic Kurtosis
Transformed Kurtosis
EWLS13 BR -1.93 3.81 4.11 0.23 0.87 0.46
EWLS13 TR -1.35 2.55 4.37 0.26 1.03 0.51
Textural classification for surface material samples Folk (1954, 1974, 1980)
Site Method Textural class
EWLS13 BR Detailed Particle Size Analysis Muddy Medium Sandy Pebbly Gravel
EWLS13 TR Detailed Particle Size Analysis Muddy Medium Sandy Pebbly Gravel
51

Surface material sample at site EWLS15 cumulative frequency data EWLS15 between rip lines (EWLS15 BR1) EWLS15 between rip lines (EWLS15 BR2)
Phi (Φ) Size (mm)Cumulative Percentage Phi (Φ)
Size (mm)
Cumulative Percentage
-7.0 128 0.00 -7.0 128 0.00
-6.0 64 17.42 -6.0 64 0.00
-5.0 32 25.40 -5.0 32 9.79
-4 16 35.28 -4 16 20.97
-3.25 9.5 47.54 -3.25 9.5 31.49
-2 4 57.82 -2 4 47.51
-1.5 2.8 61.28 -1.5 2.8 51.90
-1 2 65.20 -1 2 57.23
-0.5 1.4 68.66 -0.5 1.4 61.81
0 1 71.85 0 1 65.64
0.5 0.71 74.53 0.5 0.71 69.15
1 0.5 77.56 1 0.5 72.91
1.5 0.355 80.22 1.5 0.355 76.06
2 0.25 83.00 2 0.25 79.53
2.5 0.18 85.68 2.5 0.18 82.85
3 0.125 88.05 3 0.125 85.42
3.5 0.09 89.94 3.5 0.09 88.05
4 0.063 91.46 4 0.063 89.80
4.64 0.04 94.37 4.64 0.04 93.14
5.76 0.0184 94.88 5.76 0.0185 93.74
6.26 0.0130 95.46 6.26 0.0131 94.48
7.06 0.0075 95.83 7.05 0.0075 94.93
7.85 0.0043 96.21 7.84 0.0044 95.68
8.64 0.0025 96.59 8.63 0.0025 95.83
9.05 0.0019 96.97 9.05 0.0019 96.12
14.00 0.0011 100.00 14.00 0.0011 100.00
Graphic grain size statistics of Folk and Ward (1957) and Folk (1974, 1980)
Site Graphic Mean ()
Graphic Mean (mm)
Inclusive Graphic Standard Deviation ()
Inclusive Graphic Skewness
Graphic Kurtosis
Transformed Kurtosis
EWLS15 BR -2.28 4.86 3.98 0.32 0.92 0.48
EWLS15 TR -1.15 2.22 3.70 0.32 1.03 0.51
Textural classification for surface material samples Folk (1954, 1974, 1980)
Site Method Textural class
EWLS15 BR Detailed Particle Size Analysis Muddy Medium Sandy Pebbly Gravel
EWLS15 TR Detailed Particle Size Analysis Muddy Medium Sandy Pebbly Gravel
52

Surface material sample at site EWLS16 cumulative frequency data EWLS16 between rip lines (EWLS16 BR1) EWLS16 between rip lines (EWLS16 BR2)
Phi (Φ) Size (mm)Cumulative Percentage Phi (Φ)
Size (mm)
Cumulative Percentage
-7.0 128 0.00 -7.0 128 0.00
-6.0 64 6.61 -6.0 64 7.47
-5.0 32 20.59 -5.0 32 26.83
-4 16 31.96 -4 16 36.41
-3.25 9.5 33.25 -3.25 9.5 42.51
-2 4 50.91 -2 4 52.74
-1.5 2.8 55.18 -1.5 2.8 56.40
-1 2 60.02 -1 2 60.89
-0.5 1.4 63.55 -0.5 1.4 64.31
0 1 66.91 0 1 67.54
0.5 0.71 70.11 0.5 0.71 70.58
1 0.5 73.52 1 0.5 73.94
1.5 0.355 76.56 1.5 0.355 77.00
2 0.25 80.00 2 0.25 80.22
2.5 0.18 83.26 2.5 0.18 77.05
3 0.125 85.84 3 0.125 86.00
3.5 0.09 88.28 3.5 0.09 88.20
4 0.063 89.80 4 0.063 89.85
4.64 0.04 92.84 4.64 0.04 92.78
5.76 0.0184 93.51 5.76 0.0185 93.40
6.26 0.0130 94.33 6.26 0.0131 94.03
7.06 0.0075 94.73 7.05 0.0075 94.97
7.85 0.0043 95.41 7.84 0.0044 95.60
8.64 0.0025 95.81 8.63 0.0025 95.92
9.05 0.0019 96.22 9.05 0.0019 96.54
14.00 0.0011 100.00 14.00 0.0011 100.00
Graphic grain size statistics of Folk and Ward (1957) and Folk (1974, 1980)
Site Graphic Mean ()
Graphic Mean (mm)
Inclusive Graphic Standard Deviation ()
Inclusive Graphic Skewness
Graphic Kurtosis
Transformed Kurtosis
EWLS16 BR -1.58 2.99 4.06 0.28 0.95 0.49
EWLS16 TR -1.67 3.18 4.15 0.32 0.88 0.47
Textural classification for surface material samples Folk (1954, 1974, 1980)
Site Method Textural class
EWLS16 BR Detailed Particle Size Analysis Muddy Medium Sandy Pebbly Gravel
EWLS16 TR Detailed Particle Size Analysis Muddy Medium Sandy Pebbly Gravel
53
Surface material sample at site EWLS18 cumulative frequency data
EWLS18 between rip lines (EWLS18 BR)EWLS18 top of mound created by
ripping (EWLS18 TR)
Phi (Φ) Size (mm)Cumulative Percentage Phi (Φ)
Size (mm)
Cumulative Percentage
-7.0 128 0.00 -7.0 128 0.00
-6.0 64 6.34 -6.0 64 0.00
-5.0 32 22.69 -5.0 32 12.40
-4 16 31.88 -4 16 23.16
-3.25 9.5 39.47 -3.25 9.5 33.07
-2 4 52.38 -2 4 48.54
-1.5 2.8 56.71 -1.5 2.8 53.92
-1 2 60.84 -1 2 59.10
-0.5 1.4 64.55 -0.5 1.4 63.47
0 1 67.83 0 1 67.30
0.5 0.71 71.13 0.5 0.71 70.59
1 0.5 74.59 1 0.5 74.32
1.5 0.355 77.60 1.5 0.355 77.64
2 0.25 80.84 2 0.25 81.11
2.5 0.18 83.88 2.5 0.18 84.55
3 0.125 86.31 3 0.125 87.52
3.5 0.09 88.55 3.5 0.09 89.68
4 0.063 90.05 4 0.063 91.54
4.64 0.04 93.56 4.64 0.04 93.73
5.76 0.0184 94.15 5.76 0.0185 93.73
6.26 0.0130 94.73 6.26 0.0131 94.78
7.06 0.0075 95.90 7.05 0.0075 95.47
7.85 0.0043 96.49 7.84 0.0044 96.17
8.64 0.0025 96.78 8.63 0.0025 96.52
9.05 0.0019 97.07 9.05 0.0019 97.21
14.00 0.0011 100.00 14.00 0.0011 100.00
Graphic grain size statistics of Folk and Ward (1957) and Folk (1974, 1980)
Site Graphic Mean ()
Graphic Mean (mm)
Inclusive Graphic Standard Deviation ()
Inclusive Graphic Skewness
Graphic Kurtosis
Transformed Kurtosis
EWLS18 BR -1.70 3.25 3.90 0.28 0.89 0.47
EWLS18 TR -1.37 2.58 3.61 0.30 1.00 0.50
Textural classification for surface material samples Folk (1954, 1974, 1980)
Site Method Textural class
EWLS18 BR Detailed Particle Size Analysis Muddy Medium Sandy Pebbly Gravel
EWLS18 TR Detailed Particle Size Analysis Muddy Medium Sandy Pebbly Gravel
54

Surface material sample at site EWLS23 cumulative frequency data
EWLS23 between rip lines (EWLS23 BR)EWLS23 top of mound created by
ripping (EWLS23 TR)
Phi (Φ) Size (mm)Cumulative Percentage Phi (Φ)
Size (mm)
Cumulative Percentage
-7.0 128 0.00 -7.0 128 0.00
-6.0 64 24.14 -6.0 64 23.06
-5.0 32 32.19 -5.0 32 32.47
-4 16 38.78 -4 16 42.00
-3.25 9.5 45.60 -3.25 9.5 48.45
-2 4 55.78 -2 4 58.08
-1.5 2.8 59.23 -1.5 2.8 61.63
-1 2 63.22 -1 2 65.94
-0.5 1.4 66.92 -0.5 1.4 68.29
0 1 70.05 0 1 70.77
0.5 0.71 73.18 0.5 0.71 72.96
1 0.5 76.47 1 0.5 75.69
1.5 0.355 79.34 1.5 0.355 78.32
2 0.25 82.47 2 0.25 81.27
2.5 0.18 85.44 2.5 0.18 84.21
3 0.125 87.91 3 0.125 86.81
3.5 0.09 89.99 3.5 0.09 88.87
4 0.063 91.45 4 0.063 90.47
4.64 0.04 94.19 4.64 0.04 92.52
5.76 0.0184 94.34 5.76 0.0185 92.64
6.26 0.0130 94.92 6.26 0.0131 93.54
7.06 0.0075 95.65 7.05 0.0075 94.50
7.85 0.0043 95.94 7.84 0.0044 94.68
8.64 0.0025 96.23 8.63 0.0025 95.02
9.05 0.0019 96.37 9.05 0.0019 95.81
14.00 0.0011 100.00 14.00 0.0011 100.00
Graphic grain size statistics of Folk and Ward (1957) and Folk (1974, 1980)
Site Graphic Mean ()
Graphic Mean (mm)
Inclusive Graphic Standard Deviation ()
Inclusive Graphic Skewness
Graphic Kurtosis
Transformed Kurtosis
EWLS23 BR -2.26 4.79 4.14 0.27 0.81 0.45
EWLS23 TR -2.30 4.92 4.53 0.39 0.93 0.49
Textural classification for surface material samples Folk (1954, 1974, 1980)
Site Method Textural class
EWLS23 BR Detailed Particle Size Analysis Muddy Medium Sandy Pebbly Gravel
EWLS23 TR Detailed Particle Size Analysis Muddy Medium Sandy Pebbly Gravel
55

Surface material sample at site EWLS25 cumulative frequency data
EWLS25 between rip lines (EWLS25 BR)EWLS25 top of mound created by
ripping (EWLS25 TR)
Phi (Φ) Size (mm)Cumulative Percentage Phi (Φ)
Size (mm)
Cumulative Percentage
-8.0 256 0.00 -8.0 256 0.00
-7.0 128 26.26 -7.0 128 0.00
-6.0 64 26.26 -6.0 64 4.99
-5.0 32 29.90 -5.0 32 14.44
-4 16 36.66 -4 16 29.02
-3.25 9.5 44.42 -3.25 9.5 39.16
-2 4 57.24 -2 4 53.83
-1.5 2.8 62.21 -1.5 2.8 58.38
-1 2 66.48 -1 2 63.81
-0.5 1.4 70.59 -0.5 1.4 66.24
0 1 74.27 0 1 69.13
0.5 0.71 77.12 0.5 0.71 71.67
1 0.5 80.00 1 0.5 74.71
1.5 0.355 82.35 1.5 0.355 77.40
2 0.25 84.63 2 0.25 80.21
2.5 0.18 86.71 2.5 0.18 82.92
3 0.125 88.50 3 0.125 85.24
3.5 0.09 89.94 3.5 0.09 87.06
4 0.063 91.03 4 0.063 88.46
4.64 0.04 92.61 4.64 0.04 91.36
5.76 0.0184 93.13 5.76 0.0185 91.84
6.26 0.0130 93.93 6.26 0.0131 92.80
7.06 0.0075 94.19 7.05 0.0075 94.00
7.85 0.0043 94.72 7.84 0.0044 94.72
8.64 0.0025 94.98 8.63 0.0025 95.20
9.05 0.0019 95.91 9.05 0.0019 95.68
14.00 0.0011 100.00 14.00 0.0011 100.00
Graphic grain size statistics of Folk and Ward (1957) and Folk (1974, 1980)
Site Graphic Mean ()
Graphic Mean (mm)
Inclusive Graphic Standard Deviation ()
Inclusive Graphic Skewness
Graphic Kurtosis
Transformed Kurtosis
EWLS25 BR -2.74 6.68 4.81 0.18 0.94 0.49
EWLS25 TR -1.50 2.83 4.08 0.41 1.10 0.52
Textural classification for surface material samples Folk (1954, 1974, 1980)
Site Method Textural class
EWLS25 BR Detailed Particle Size Analysis Muddy Medium Sandy Pebbly Gravel
EWLS25 TR Detailed Particle Size Analysis Muddy Medium Sandy Pebbly Gravel
56

Surface material sample at site EWLS28 cumulative frequency data
EWLS28 between rip lines (EWLS28 BR)EWLS28 top of mound created by
ripping (EWLS28 TR)
Phi (Φ) Size (mm)Cumulative Percentage Phi (Φ)
Size (mm)
Cumulative Percentage
-7.0 128 0.00 -7.0 128 0.00
-6.0 64 14.39 -6.0 64 4.83
-5.0 32 33.84 -5.0 32 17.09
-4 16 41.78 -4 16 24.88
-3.25 9.5 49.86 -3.25 9.5 35.03
-2 4 61.60 -2 4 47.82
-1.5 2.8 65.50 -1.5 2.8 52.02
-1 2 69.22 -1 2 57.06
-0.5 1.4 71.43 -0.5 1.4 60.39
0 1 73.53 0 1 63.31
0.5 0.71 75.63 0.5 0.71 66.13
1 0.5 78.27 1 0.5 69.74
1.5 0.355 80.91 1.5 0.355 73.15
2 0.25 83.79 2 0.25 77.06
2.5 0.18 86.59 2.5 0.18 81.09
3 0.125 89.05 3 0.125 84.55
3.5 0.09 91.08 3.5 0.09 87.42
4 0.063 92.59 4 0.063 89.60
4.64 0.04 94.99 4.64 0.04 92.86
5.76 0.0184 95.25 5.76 0.0185 93.27
6.26 0.0130 95.78 6.26 0.0131 93.96
7.06 0.0075 96.04 7.05 0.0075 94.78
7.85 0.0043 96.44 7.84 0.0044 95.33
8.64 0.0025 96.57 8.63 0.0025 95.60
9.05 0.0019 97.23 9.05 0.0019 95.74
14.00 0.0011 100.00 14.00 0.0011 100.00
Graphic grain size statistics of Folk and Ward (1957) and Folk (1974, 1980)
Site Graphic Mean ()
Graphic Mean (mm)
Inclusive Graphic Standard Deviation ()
Inclusive Graphic Skewness
Graphic Kurtosis
Transformed Kurtosis
EWLS28 BR -2.37 5.17 3.71 0.36 0.80 0.44
EWLS28 TR -1.30 2.46 4.03 0.26 0.96 0.49
Textural classification for surface material samples Folk (1954, 1974, 1980)
Site Method Textural class
EWLS28 BR Detailed Particle Size Analysis Muddy Medium Sandy Pebbly Gravel
EWLS28 TR Detailed Particle Size Analysis Muddy Medium Sandy Pebbly Gravel
57

Surface material sample at site EWLS30 cumulative frequency data EWLS30 between rip lines (EWLS30 BR1) EWLS30 between rip lines (EWLS30 TR2)
Phi (Φ) Size (mm)Cumulative Percentage Phi (Φ)
Size (mm)
Cumulative Percentage
-7.0 128 0.00 -7.0 128 0.00
-6.0 64 0.00 -6.0 64 3.74
-5.0 32 5.45 -5.0 32 17.20
-4 16 13.29 -4 16 26.65
-3.25 9.5 23.47 -3.25 9.5 34.60
-2 4 39.68 -2 4 47.35
-1.5 2.8 45.10 -1.5 2.8 52.08
-1 2 50.43 -1 2 56.75
-0.5 1.4 54.05 -0.5 1.4 60.12
0 1 57.26 0 1 63.31
0.5 0.71 60.11 0.5 0.71 66.31
1 0.5 63.41 1 0.5 69.63
1.5 0.355 66.41 1.5 0.355 72.64
2 0.25 69.63 2 0.25 75.82
2.5 0.18 72.77 2.5 0.18 72.69
3 0.125 75.37 3 0.125 81.52
3.5 0.09 77.53 3.5 0.09 83.69
4 0.063 79.13 4 0.063 85.32
4.64 0.04 91.77 4.64 0.04 91.94
5.76 0.0184 92.39 5.76 0.0185 92.25
6.26 0.0130 92.86 6.26 0.0131 93.18
7.06 0.0075 93.79 7.05 0.0075 93.80
7.85 0.0043 94.41 7.84 0.0044 94.58
8.64 0.0025 94.57 8.63 0.0025 94.89
9.05 0.0019 95.03 9.05 0.0019 95.35
14.00 0.0011 100.00 14.00 0.0011 100.00
Graphic grain size statistics of Folk and Ward (1957) and Folk (1974, 1980)
Site Graphic Mean ()
Graphic Mean (mm)
Inclusive Graphic Standard Deviation ()
Inclusive Graphic Skewness
Graphic Kurtosis
Transformed Kurtosis
EWLS30 BR -0.20 1.15 4.15 0.37 0.95 0.49
EWLS30 TR -1.07 2.10 4.39 0.33 0.99 0.50
Textural classification for surface material samples Folk (1954, 1974, 1980)
Site Method Textural class
EWLS30 BR Detailed Particle Size Analysis Muddy Medium Sandy Pebbly Gravel
EWLS30 TR Detailed Particle Size Analysis Muddy Medium Sandy Pebbly Gravel
58

Appendix 3 Cumulative frequency data from Digital GravelometerTM for each of the 12 surface sample sitesThe grain size statistics have been taken from the Digital GravelometerTM results.
EWLS Site 2 – cumulative frequency data from Digital GravelometerTM
8 images were assessed and aggregated
Phi (Φ) Size (mm)
Count in class
Cumulative Percentage
-9.5 724 2 0.01
-9 512 2 0.01
-8.5 362 1 0.01
-8 256 8 0.03
-7.5 181 21 0.09
-7 128 39 0.19
-6.5 90.5 96 0.43
-6 64 120 0.73
-5.5 45.3 151 1.12
-5 32 301 1.88
-4.5 22.6 575 3.34
-4 16 1486 7.12
-3.5 11.3 3401 15.75
-3 8 5758 30.37
-2.5 5.7 7313 48.94
-2 4 6767 66.13
-1.5 2.83 5446 79.96
-1 2 2831 87.15
-0.5 1.41 1604 91.22
0 1 108 91.50
0.5 0.71 3349 100.00
Graphic grain size statistics of Folk and Ward (1957) and Folk (1974, 1980)
Site Graphic Mean ()
Graphic Mean (mm)
Inclusive Graphic Standard Deviation ()
Inclusive Graphic Skewness
Graphic Kurtosis
EWLS2 -1.92 3.79 1.20 0.13 1.22
59

EWLS Site 5 – cumulative frequency data from Digital GravelometerTM
5 images were assessed and aggregated
Phi (Φ) Size (mm)
Count in class
Cumulative Percentage
-8.5 362 5 0.02
-8 256 6 0.05
-7.5 181 16 0.13
-7 128 21 0.24
-6.5 90.5 32 0.39
-6 64 99 0.88
-5.5 45.3 207 1.90
-5 32 247 3.12
-4.5 22.6 487 5.52
-4 16 1044 10.67
-3.5 11.3 2335 22.19
-3 8 3194 37.94
-2.5 5.7 3660 56.00
-2 4 2842 70.01
-1.5 2.83 2062 80.18
-1 2 1260 86.40
-0.5 1.41 737 90.03
0 1 53 90.29
0.5 0.71 1968 100.00
Graphic grain size statistics of Folk and Ward (1957) and Folk (1974, 1980)
Site Graphic Mean ()
Graphic Mean (mm)
Inclusive Graphic Standard Deviation ()
Inclusive Graphic Skewness
Graphic Kurtosis
EWLS5 -2.07 4.21 1.31 0.15 1.16
60

EWLS Site 6 – cumulative frequency data from Digital GravelometerTM
4 images were assessed and aggregated
Phi (Φ) Size (mm)
Count in class
Cumulative Percentage
-9 512 2 0.03
-8.5 362 9 0.18
-8 256 10 0.34
-7.5 181 18 0.62
-7 128 11 0.80
-6.5 90.5 21 1.14
-6 64 41 1.79
-5.5 45.3 67 2.87
-5 32 106 4.56
-4.5 22.6 216 8.02
-4 16 468 15.52
-3.5 11.3 795 28.25
-3 8 1165 46.91
-2.5 5.7 1087 64.32
-2 4 817 77.40
-1.5 2.83 523 85.78
-1 2 255 89.86
-0.5 1.41 193 92.95
0 1 8 93.08
0.5 0.71 432 100.00
Graphic grain size statistics of Folk and Ward (1957) and Folk (1974, 1980)
Site Graphic Mean ()
Graphic Mean (mm)
Inclusive Graphic Standard Deviation ()
Inclusive Graphic Skewness
Graphic Kurtosis
EWLS6 -2.34 5.06 1.33 0.14 1.36
61

EWLS Site 9 – cumulative frequency data from Digital GravelometerTM
6 images were assessed and aggregated
Phi (Φ) Size (mm)
Count in class
Cumulative Percentage
-8 256 0.05 0.05
-7.5 181 0.13 0.19
-7 128 0.08 0.27
-6.5 90.5 0.19 0.46
-6 64 0.29 0.75
-5.5 45.3 0.55 1.30
-5 32 0.78 2.08
-4.5 22.6 1.50 3.58
-4 16 3.99 7.57
-3.5 11.3 8.68 16.25
-3 8 14.04 30.29
-2.5 5.7 19.27 49.57
-2 4 16.75 66.32
-1.5 2.83 12.71 79.03
-1 2 7.29 86.32
-0.5 1.41 3.85 90.17
0 1 0.32 90.49
0.5 0.71 9.51 100.00
Graphic grain size statistics of Folk and Ward (1957) and Folk (1974, 1980)
Site Graphic Mean ()
Graphic Mean (mm)
Inclusive Graphic Standard Deviation ()
Inclusive Graphic Skewness
Graphic Kurtosis
EWLS9 -1.92 3.8 1.22 0.14 1.2
62

EWLS Site 13 – cumulative frequency data from Digital GravelometerTM
6 images were assessed and aggregated
Phi (Φ) Size (mm)
Count in class
Cumulative Percentage
-10 1024 1 0.01
-9.5 724 0 0.01
-9 512 9 0.05
-8.5 362 2 0.06
-8 256 7 0.10
-7.5 181 9 0.14
-7 128 20 0.25
-6.5 90.5 40 0.45
-6 64 89 0.90
-5.5 45.3 153 1.69
-5 32 312 3.28
-4.5 22.6 611 6.40
-4 16 1312 13.11
-3.5 11.3 2590 26.35
-3 8 3333 43.38
-2.5 5.7 3425 60.89
-2 4 2585 74.10
-1.5 2.83 1953 84.08
-1 2 1092 89.66
-0.5 1.41 620 92.83
0 1 44 93.05
0.5 0.71 1359 100.00
Graphic grain size statistics of Folk and Ward (1957) and Folk (1974, 1980)
Site Graphic Mean ()
Graphic Mean (mm)
Inclusive Graphic Standard Deviation ()
Inclusive Graphic Skewness
Graphic Kurtosis
EWLS13 -2.23 4.68 1.32 0.16 1.25
63

EWLS Site 15 – cumulative frequency data from Digital GravelometerTM
6 images were assessed and aggregated
Phi (Φ) Size (mm)
Count in class
Cumulative Percentage
-9 512 4 0.01
-8.5 362 7 0.04
-8 256 10 0.08
-7.5 181 15 0.13
-7 128 41 0.28
-6.5 90.5 81 0.58
-6 64 80 0.87
-5.5 45.3 160 1.45
-5 32 373 2.81
-4.5 22.6 526 4.73
-4 16 1219 9.18
-3.5 11.3 2437 18.08
-3 8 3848 32.12
-2.5 5.7 4829 49.74
-2 4 4496 66.15
-1.5 2.83 3720 79.72
-1 2 2022 87.10
-0.5 1.41 745 89.82
0 1 376 91.19
0.5 0.71 2413 100.00
Graphic grain size statistics of Folk and Ward (1957) and Folk (1974, 1980)
Site Graphic Mean ()
Graphic Mean (mm)
Inclusive Graphic Standard Deviation ()
Inclusive Graphic Skewness
Graphic Kurtosis
EWLS15 -1.95 3.86 1.27 0.10 1.21
64

EWLS Site 16 – cumulative frequency data from Digital GravelometerTM
5 images were assessed and aggregated
Phi (Φ) Size (mm)
Count in class
Cumulative Percentage
-9.5 724 2 0.01
-9 512 8 0.04
-8.5 362 1 0.05
-8 256 7 0.08
-7.5 181 18 0.16
-7 128 31 0.29
-6.5 90.5 3 0.31
-6 64 30 0.44
-5.5 45.3 88 0.83
-5 32 279 2.05
-4.5 22.6 593 4.66
-4 16 1230 10.07
-3.5 11.3 2524 21.17
-3 8 3772 37.75
-2.5 5.7 4296 56.64
-2 4 3391 71.55
-1.5 2.83 2542 82.73
-1 2 1403 88.90
-0.5 1.41 529 91.22
0 1 249 92.32
0.5 0.71 1747 100.00
Graphic grain size statistics of Folk and Ward (1957) and Folk (1974, 1980)
Site Graphic Mean ()
Graphic Mean (mm)
Inclusive Graphic Standard Deviation ()
Inclusive Graphic Skewness
Graphic Kurtosis
EWLS16 -2.10 4.28 1.76 0.17 1.24
65

EWLS Site 18 – cumulative frequency data from Digital GravelometerTM
4 images were assessed and aggregated
Phi (Φ) Size (mm)
Count in class
Cumulative Percentage
-9 512 4 0.12
-8.5 362 1 0.15
-8 256 3 0.24
-7.5 181 2 0.29
-7 128 6 0.47
-6.5 90.5 4 0.59
-6 64 10 0.88
-5.5 45.3 34 1.88
-5 32 54 3.47
-4.5 22.6 125 7.15
-4 16 238 14.15
-3.5 11.3 423 26.60
-3 8 573 43.45
-2.5 5.7 550 59.64
-2 4 440 72.58
-1.5 2.83 308 81.64
-1 2 209 87.79
-0.5 1.41 102 90.79
0 1 41 92.00
0.5 0.71 272 100.00
Graphic grain size statistics of Folk and Ward (1957) and Folk (1974, 1980)
Site Graphic Mean ()
Graphic Mean (mm)
Inclusive Graphic Standard Deviation ()
Inclusive Graphic Skewness
Graphic Kurtosis
EWLS18 -2.19 4.56 1.38 0.18 1.19
66

EWLS Site 23 – cumulative frequency data from Digital GravelometerTM
5 images were assessed and aggregated
Phi (Φ) Size (mm)
Count in class
Cumulative Percentage
-9.5 724 4 0.01
-9 512 3 0.03
-8.5 362 0 0.03
-8 256 0 0.03
-7.5 181 5 0.04
-7 128 17 0.11
-6.5 90.5 34 0.23
-6 64 22 0.32
-5.5 45.3 49 0.50
-5 32 145 1.04
-4.5 22.6 352 2.34
-4 16 864 5.55
-3.5 11.3 1880 12.52
-3 8 3478 25.43
-2.5 5.7 4583 42.43
-2 4 4975 60.89
-1.5 2.83 4835 78.83
-1 2 2374 87.64
-0.5 1.41 1142 91.88
0 1 81 92.18
0.5 0.71 2107 100.00
Graphic grain size statistics of Folk and Ward (1957) and Folk (1974, 1980)
Site Graphic Mean ()
Graphic Mean (mm)
Inclusive Graphic Standard Deviation ()
Inclusive Graphic Skewness
Graphic Kurtosis
EWLS23 -1.80 3.49 1.14 0.06 1.24
67

EWLS Site 25 – cumulative frequency data from Digital GravelometerTM
2 images were assessed and aggregated
Phi (Φ) Size (mm)
Count in class
Cumulative Percentage
-9.5 724 1 0.01
-9 512 0 0.01
-8.5 362 3 0.05
-8 256 3 0.08
-7.5 181 5 0.14
-7 128 8 0.23
-6.5 90.5 5 0.29
-6 64 16 0.47
-5.5 45.3 50 1.04
-5 32 121 2.42
-4.5 22.6 211 4.84
-4 16 402 9.44
-3.5 11.3 768 18.22
-3 8 1062 30.36
-2.5 5.7 1379 46.13
-2 4 1451 62.73
-1.5 2.83 1440 79.20
-1 2 669 86.85
-0.5 1.41 354 90.90
0 1 18 91.10
0.5 0.71 778 100.00
Graphic grain size statistics of Folk and Ward (1957) and Folk (1974, 1980)
Site Graphic Mean ()
Graphic Mean (mm)
Inclusive Graphic Standard Deviation ()
Inclusive Graphic Skewness
Graphic Kurtosis
EWLS25 -1.92 3.79 1.27 0.01 1.21
68

EWLS Site 28 – cumulative frequency data from Digital GravelometerTM
4 images were assessed and aggregated
Phi (Φ) Size (mm)
Count in class
Cumulative Percentage
-9 512 4 0.02
-8.5 362 4 0.04
-8 256 4 0.06
-7.5 181 0 0.06
-7 128 8 0.10
-6.5 90.5 22 0.22
-6 64 36 0.41
-5.5 45.3 110 0.98
-5 32 265 2.35
-4.5 22.6 487 4.88
-4 16 1098 10.58
-3.5 11.3 2045 21.20
-3 8 2905 36.28
-2.5 5.7 3338 53.62
-2 4 3111 69.77
-1.5 2.83 2487 82.68
-1 2 1140 88.60
-0.5 1.41 672 92.09
0 1 44 92.32
0.5 0.71 1479 100.00
Graphic grain size statistics of Folk and Ward (1957) and Folk (1974, 1980)
Site Graphic Mean ()
Graphic Mean (mm)
Inclusive Graphic Standard Deviation ()
Inclusive Graphic Skewness
Graphic Kurtosis
EWLS28 -2.08 4.24 1.26 0.10 1.22
69

EWLS Site 30 – cumulative frequency data from Digital GravelometerTM
6 images were assessed and aggregated
Phi (Φ) Size (mm)
Count in class
Cumulative Percentage
-9.5 724 4 0.01
-9 512 1 0.02
-8.5 362 0 0.02
-8 256 5 0.03
-7.5 181 7 0.06
-7 128 37 0.18
-6.5 90.5 57 0.37
-6 64 73 0.61
-5.5 45.3 153 1.12
-5 32 318 2.18
-4.5 22.6 595 4.17
-4 16 1043 7.64
-3.5 11.3 2407 15.66
-3 8 4074 29.24
-2.5 5.7 5242 46.71
-2 4 5281 64.31
-1.5 2.83 4592 79.61
-1 2 2234 87.05
-0.5 1.41 1205 91.07
0 1 88 91.36
0.5 0.71 2592 100.00
Graphic grain size statistics of Folk and Ward (1957) and Folk (1974, 1980)
Site Graphic Mean ()
Graphic Mean (mm)
Inclusive Graphic Standard Deviation ()
Inclusive Graphic Skewness
Graphic Kurtosis
EWLS30 -1.90 3.72 1.22 0.07 1.24
70

Appendix 4 Graphic grain size statistics for the gravel fractionGraphic grain size statistics for the gravel fraction (> 2.0 mm) for the combined top of rip mound and between rip lines surface samples collected on the trial landform in 2009 and the 2009 images analysed by Digital GravelometerTM.
71

Graphic grain size statistics for the gravel fraction of combined (top of rip mound and between rip lines) surface material samples in 2009
Sample name Graphic Mean()
Graphic Mean(mm)
Inclusive Graphic Standard Deviation
()
Inclusive Graphic
Skewness
Graphic Kurtosis
Transformed Kurtosis
EWLS2 -4.39 20.93 1.82 0.13 0.72 0.42
EWLS5 -5.05 33.2 1.92 0.29 0.80 0.45
EWLS6 -3.87 14.61 1.87 -0.16 0.78 0.44
EWLS9 -4.38 20.77 1.78 0.15 0.74 0.42
EWLS13 -4.12 17.39 1.87 -0.03 0.70 0.41
EWLS15 -3.97 15.7 1.76 -0.07 0.83 0.45
EWLS16 -4.10 17.16 1.73 0.19 0.73 0.42
EWLS18 -4.02 16.18 1.70 0.09 0.75 0.43
EWLS25 -4.63 24.81 1.88 0.29 0.69 0.41
EWLS24 -4.51 22.83 2.29 -0.19 0.68 0.40
EWLS28 -4.02 16.18 1.75 0.02 0.76 0.43
EWLS30 -3.50 11.32 1.55 -0.08 0.78 0.44
Min Value -5.05 11.32 1.55 -0.19 0.68 0.40
Max Value -3.50 33.20 2.29 0.29 0.83 0.45
Average Value -4.22 19.69 1.84 0.05 0.75 0.43
Graphic grain size statistics of the gravel fraction determined by the Digital GravelometerTM for 2009 images
Sample name Graphic Mean()
Graphic Mean(mm)
Inclusive Graphic Standard Deviation
()
Inclusive Graphic
Skewness
Graphic Kurtosis
Transformed Kurtosis
EWLS2 -2.66 6.34 0.93 -0.08 0.99 0.50
EWLS5 -2.86 7.28 1.01 -0.06 1.04 0.51
EWLS6 -3.07 8.38 1.03 -0.07 1.07 0.52
EWLS9 -2.69 6.44 0.94 -0.08 1.01 0.50
EWLS13 -2.95 7.73 1.02 -0.04 1.00 0.50
EWLS15 -2.72 6.57 1.00 -0.11 1.01 0.50
EWLS16 -2.83 7.12 0.97 -0.05 1.00 0.50
EWLS18 -2.98 7.87 1.05 -0.03 1.01 0.50
EWLS25 -2.52 5.72 0.89 -0.13 0.95 0.49
EWLS24 -2.67 6.38 1.02 -0.17 0.95 0.49
EWLS28 -2.81 7 0.99 -0.09 0.96 0.49
EWLS30 -2.64 6.22 0.96 -0.13 1.00 0.50
Min Value -3.07 5.72 0.89 -0.17 0.95 0.49
Max Value -2.52 8.38 1.05 -0.03 1.07 0.52
Average Value -2.78 6.94 0.98 -0.09 1.00 0.50
72