Occupational Hygiene and Sustainability Steve Bailey GSK Sustainability & Environment.
Institute for Social, Behavioral,and Economic Research
ISBER Publications(University of California, Santa Barbara)
Year Paper
Eco-Labeling Strategies: The
Eco-Premium Puzzle in the Wine
Industry
Magali A. Delmas ∗ Laura E. Grant †
∗University of California, Santa Barbara†University of California, Santa Barbara
This paper is posted at the eScholarship Repository, University of California.
http://repositories.cdlib.org/isber/publications/12
Copyright c©2008 by the authors.

Eco-Labeling Strategies: The
Eco-Premium Puzzle in the Wine
Industry
Abstract
Eco-labeling signals that a product has been eco-certified. While there isincreasing use of eco-labeling practices, there is still little understanding of theconditions under which eco-labels can command price premiums. In this paper,we argue that the certification of environmental practices by a third party shouldbe analyzed as a strategy distinct from although related to the advertisementof the eco-certification through a label posted on the product. By assessingeco-labeling and eco-certification strategies separately, we are able to identifybenefits associated with the certification process independently from those as-sociated with the actual label. More specifically, we argue in the context ofthe wine industry that eco-certification can provide benefits, such as improvedreputation in the industry or increased product quality, which can lead to aprice premium without the need to use the eco-label. We estimate this pricepremium of wine due to the eco-certification of grapes using 13,400 observationsof wine price, quality rating, varietals, vintage, and number of bottles produced,for the period 1998-2005. Overall, certifying wine increases the price by 13%,yet including an eco-label reduces the price by 20%. This result confirms thenegative connotation associated by consumers with organic wine. The pricepremium of this luxury good due to certification acts independently from itslabel, a confounding result not previously demonstrated by related literature.

1
ECO-LABELING STRATEGIES:
THE ECO-PREMIUM PUZZLE IN THE WINE INDUSTRY
Magali A. Delmas and Laura E. Grant1
Abstract
Eco-labeling signals that a product has been eco-certified. While there is increasing use of eco-labeling practices, there is still little understanding of the conditions under which eco-labels can command price premiums. In this paper, we argue that the certification of environmental practices by a third party should be analyzed as a strategy distinct from although related to the advertisement of the eco-certification through a label posted on the product. By assessing eco-labeling and eco-certification strategies separately, we are able to identify benefits associated with the certification process independently from those associated with the actual label. More specifically, we argue in the context of the wine industry that eco-certification can provide benefits, such as improved reputation in the industry or increased product quality, which can lead to a price premium without the need to use the eco-label. We estimate this price premium of wine due to the eco-certification of grapes using 13,400 observations of wine price, quality rating, varietals, vintage, and number of bottles produced, for the period 1998-2005. Overall, certifying wine increases the price by 13%, yet including an eco-label reduces the price by 20%. This result confirms the negative connotation associated by consumers with organic wine. The price premium of this luxury good due to certification acts independently from its label, a confounding result not previously demonstrated by related literature.
1 Magali Delmas: Associate Professor Donald Bren School of Environmental Science and Management, University of California, Santa Barbara CA 93106, [email protected], Visiting Professor Institute of the Environment, University of California, Los Angeles. Laura Grant: PhD student, Donald Bren School of Environmental Science and Management, University of California, Santa Barbara CA 93106, [email protected]

2
1. Introduction
Eco-labels signal the environmental attributes of a product to consumers. The goal of eco-labels
is to provide simple and easily interpretable information, and to elicit increased demand for
products perceived as environmentally favorable. Examples of eco-labels include the organic
label for agricultural products, the Energy Star label for energy appliances, and the Forest
Sustainable Stewardship label for lumber. The value of eco-products on the market and the
number of new eco-label programs are growing rapidly. For example, consumers spent
approximately $2.2 billion on fair-trade certified products in 2006, a 42% increase over the
previous year.2 Retail sales of organic foods also increased from $3.8 billion in 1997 to $16.7
billion in 2006 (Organic Trade Association, 2006).3 The number of eco-label programs has
grown from a mere dozen worldwide in the 1990s to more than 415 programs estimated today.4
One of the conditions for effective eco-labels is that customers be willing to pay a price premium
that helps defray the higher cost of improved environmental management practices. However,
little is known about the conditions under which eco-labels can command price premiums. First,
previous studies use the contingent valuation approach and are based on attitudes regarding the
purchase of eco-labeled products rather than on actual purchases (Loureiro and Lotade, 2005;
Leire and Thidell, 2005). Second, current literature does not elucidate the rationale and
motivation of potential consumer demand for eco-labeled products. We need further research
regarding these complex attitudes and actions: are consumers willing to pay for the public good
(a better environment) or for other private benefits associated with certified products, such as a
higher quality?
An eco-label consists of three nested steps: the adoption of environmentally friendly practices,
the certification of these practices by a third party, and the labeling of the eco-certification
through a label posted on the product. We argue that each of these distinct components provides
2 Fair Trade in Bloom. October 2, 2007. The New York Times 3 The OTA 2006 Manufacturer Survey Overview available at http://www.ota.com/organic/mt.html
4 See www.ecolabels.com

3
specific benefits. By assessing each step of eco-labeling, we are able to identify benefits that
could be associated with the certification process independently from those associated with the
actual label. More specifically, we argue that eco-certification can provide benefits, such as
improved reputation in the industry or increased product quality, which can lead to a price
premium without the need to use the eco-label. The label is an additional signaling device
directed towards consumers and can have a distinct effect on price.
In this paper, we undertake the first empirical test of the effect of eco-certification and labeling
practices on prices in the wine industry. Wine is particularly well suited to answer our research
question for two reasons. First, wine eco-certification is relatively recent and still lacks positive
public recognition. Many wineries that are eco-certified still do not label this information on
their wine bottle. Therefore, wine represents an interesting case of eco-certification with
variation in labeling strategies. This distinctive feature allows us to identify potential benefits
that could be associated with the certification process independently from those associated with
the actual label. Second, wine is a differentiated product, celebrated for its many attributes and
allowing for heterogeneous consumer tastes. We can determine the effect of certification while
controlling for a broad range of other product attributes in our data set, such as the effect of wine
quality.
We use information on 13,400 wines regarding wine price, quality rating, varietals, vintage, and
number of bottles produced, for the period 1998-2005. In addition, we use data on organic and
biodynamic certification and labeling. We compare the benefits of eco-certification to those of
eco-labeling and find these two practices have opposite impacts on the price of wine. We find
that consumers are not willing to pay a premium for wine eco-labels, but that certified though
unlabeled wine enjoys a significant premium. One possibility is that consumers are not familiar
with the eco-certification process and negatively associate it with lower quality wine. We also
theorize that eco-certification elicits price premiums. First, eco-certification allows wineries to
be members of trade associations or ‘clubs’ that help enhance their reputation within the industry.
Second, the practices associated with eco-certification can induce changes in grape and wine
quality. We argue that eco-certification provides private benefits for producers and consumers
beyond the label information provided about the environmental attributes of the product.

4
Our research contributes to the literature on information disclosure. The literature on information
disclosure has shown how mandated information disclosure policies could be effective at
inducing changes in organizations’ behavior (Jin and Leslie, 2003; Delmas, Montes, and
Shimshack, 2007). Our research shows that disclosure policies such as eco-labeling can be
effective even with partial disclosure of the information. Our research also contributes to the
literature on eco-labeling; while the literature emphasizes potential customer reaction to eco-
labels, it does not identify how the process of eco-certification can yield changes in quality of the
product that can result in a price premium. We show that eco-labeling strategies can trigger
beneficial changes in the production process independently from the signal associated with the
policy.
2. Literature review
Green products are credence goods; consumers cannot ascertain their environmental qualities
during purchase or use. Customers are not present during the production process of the product
and therefore cannot observe environmental friendliness of production. The objective of eco-
labels is to reduce information asymmetry between the producer of green products and
consumers by providing credible information related to the environmental attributes of the
product and to signal that the product is superior in this regard to a non-labeled product (Crespi
and Marett, 2005). The assumption behind eco-labels is that environmentally responsible
consumers can make informed purchasing choices based on product-related environmental
information (Leire and Thidell, 2005:1062). However, research shows that several elements need
to be combined for an effective eco-label (Winters Lynch, 1994; Leire, 2004). These include
consumer awareness, consumer acceptance (credibility/comprehension), and consumer behavior
change.
Consumer awareness, understanding, and acceptance of eco-labels
First, consumers need awareness and understanding of the information provided on eco-labels.
Although the objective of eco-labels is to reduce information asymmetry between the producer
of green products and consumers, if eco-labels fail to communicate adequately they will not
diminish the information gap between seller and buyer. For example, studies have shown that the
presence of competing eco-labels has led to consumer confusion (Leire and Thidell, 2005). In

5
addition, if the cost of accessing this information is too high then customers will be less likely to
purchase green products.
Credibility of the eco-labeling process is also important to facilitate consumer choices of green
products. Eco-labels represent different realities. In some cases, eco-labels are issued by
independent organizations that have developed transparent environmental criteria and are third-
party verified. In other cases, eco-labels just represent claims made by manufacturers related to
some environmental friendliness (Ibanez and Grolleau, 2007).5 The presence of the second type
of eco-label may produce some confusion in the mind of consumers over the credibility of eco-
labels. These unsubstantiated claims can result in adverse selection if some producers provide
false or misleading labeling about environmental attributes and underlying production practices,
causing consumers to choose products that do not in fact have the attributes implied by the label
(Grodsky, 1993; Ibanez and Grolleau, 2007).
Consumer willingness to pay for eco-labels
Once consumers have been exposed to the information provided by an eco-label, they must
express preferences for eco-labeled products through their purchasing practices. The emerging
empirical literature on the effectiveness of eco-labels either identifies changes in consumer
awareness after exposure to the label (Loureiro and Lotade, 2005; Leire and Thidell, 2005) or
asks consumers how they would change their behavior if provided with additional information
through eco-labels (Loureiro, 2003; Blamey et al., 2000). However, survey respondents tend to
overestimate their willingness to pay for environmental attributes, and awareness of those
attributes does not automatically translate into changes in purchasing. Research shows that
positive attitudes towards eco-labels are an unreliable predictor of green behavior (Reiser and
Simmons, 2005; Leire and Thidell, 2005). For example, Magnuson et al. (2001) find no
relationship for Swedish consumers between positive attitudes toward organic eco-labeled
products and high intention to buy these products. Eco-label effectiveness depends not only on
the provision of credible and understandable information but also on the willingness of
consumers to use that information.
5 Ibanez and Grolleau (2007) suggested three dimensions that distinguish eco-labels: (i) the way the standard underlying the eco-label is defined, (ii) the way the claim is verified, and (iii) the way it is signaled to consumers.

6
However, we still know little about the factors that drive customers to purchase green products.
Green products have been defined as “impure public good” because they yield both public and
private benefits (Cornes and Sandler 1996; Ferraro et al., 2005; Kotchen, 2006). They consist of
a private good, such as the pleasure of drinking coffee, jointly produced with a public good, like
biodiversity protection due to organic farming. Emerging research indicates that consumers are
more likely to purchase green products if certification is associated with additional private
benefits. For example, Magnusson et al. (2001) found that the most important purchase criteria
for organic products were related to quality rather than the environmental attribute. These
include criteria such as “taste good,” “healthy,” and “long shelf-life.” Miles and Frewer (2001)
reported that organic foods were viewed as safer than conventional products. Several other
studies showed that health concerns were a major reason along with environmental concerns why
people choose organic food products (Davies, Titterington, and Cochrane, 1995; Tregear, Dent,
and McGregor, 1994; Wandel, 1994; Wandel and Bugge, 1997).
In conclusion, the literature related to the effectiveness of eco-labels shows that eco-labels that
are credible and easily understood and that provide private benefits to the consumers are more
likely to command a price premium than eco-labels that do not fulfill these requirements.
Eco-label versus eco-certification
While this literature emphasizes consumers’ reaction to eco-labels, it does not identify whether
eco-certification could yield benefits for the manufacturer outside of the signal provided by the
label. This is mainly because it assumes that eco-certification equals eco-labeling, when in fact
these two notions represent two related but distinct strategies. An organization could obtain a
third-party eco-certification of the environmentally friendly practices it uses to manufacture or
grow its products but decide not to label the certification on its products. However, an
organization needs to have its products eco-certified to label them as such. Why would an
organization pursue an eco-certification strategy without labeling it on its products? Could there
be benefits associated with eco-certification that are independent from the signal that the label is
providing to consumers?
In this paper, we analyze the effectiveness of both eco-certification and eco-labeling in the wine
industry, where few of the requirements identified by the current eco-label literature are present.
7
When it comes to wine, eco-certification is not well understood by consumers and seems to
provide unclear value to them. Based on these characteristics we predict an insignificant or even
negative effect of eco-labeling on wine prices. We argue, however, that eco-certification should
be associated with price premium if there are additional benefits associated with the eco-
certification process that are understood by wine makers but not communicated to consumers.
We argue that eco-certification could lead to a change in production process that leads to higher
quality and therefore price premiums. In addition, it allows wineries to participate in associations
or ‘clubs’ to enhance their reputation and reach within the industry. In this case, the production
process related to certification could lead to quality benefits that consumers may not associate
with eco-certification.
3. Eco-certification standards and eco-labeling in the wine industry
There are two main eco-labels in the wine industry in the United States. The first one relates to
organic certification and the second one to biodynamic certification.
Organic certification follows the U.S. National Organic farming standard which defines a
farming method prohibiting the use of additives or alterations to the natural seed, plant, or animal
including, but not limited to, pesticides, chemicals, or genetic modification. The U.S. National
Organic Standards law was passed in 2001.
Regulations require organic products and operations to be certified by a U.S. Department of
Agriculture (USDA) accredited entity to assure consumers that products marketed as organic
meet consistent, uniform minimum standards. Organic certifying agencies can be either State
Departments of Agriculture or private certifying agencies. Regulations also prohibit practices
such as genetic engineering, ionizing radiation, and using sewage sludge. Production and
handling standards address crop production and livestock management requirements.
Additionally, labeling standards were created based on the percentage of organic ingredients in
the product:
• “100 percent organic” labeled products must contain only organically produced
ingredients and may display the USDA Organic seal.
8
• “Organic” labeled products must consist of at least 95% organically produced
ingredients and may display the USDA Organic seal.
• “Made with organic ingredients” labeled products are those that contain at least 70%
organic ingredients. The principal display panel can list up to three organic
ingredients or food groups, however the USDA seal cannot be used anywhere on the
package.
Biodynamic agriculture is a method made popular by Austrian scientist and philosopher Rudolf
Steiner in the early 1920s. Often compared to organic agriculture, biodynamic farming is
different in a few distinct ways. Biodynamic farming prohibits synthetic pesticides and fertilizers
in the same manner as certified organic farming. However, while organic farming methods focus
on eliminating pesticides, growth hormones, and other additives for the benefit of human health,
biodynamic farming emphasizes creating a self-sufficient and healthy ecosystem. A biodynamic
farm is managed as a living organism and farming practices are guided by the following six
principles: plant diversity, crop rotation, composting, homeopathic fertilizers, animal life, and
seasonal and planetary cycles.
In 1928, the Demeter Association was founded in Europe to support and promote biodynamic
agriculture. The United States Demeter Association certified its first biodynamic farm in 1982. 6
To achieve Demeter certification, a vineyard must adhere to requirements concerning agronomic
guidelines, greenhouse management, structural components, livestock guidelines, and post-
harvest handling and processing procedures. In addition to the vineyard agricultural requirements,
Demeter provides a separate set of wine-making standards with two certification alternatives for
biodynamic wine:
• “Biodynamic wine,” “Demeter wine,” or “Demeter certified wine”
• “Wine made from Biodynamic Grapes” or “Wine made from Demeter certified
grapes”
Both organic and biodynamic agricultures are more labor intensive than conventional farming
methods because they require more attention to detail. Cost studies suggest that switching from a
6 Demeter USA Web Site. (2006). www.demeter-usa.org
9
conventional to an organic certified winery can add 10 to 15% in cost for the first three to four
years.7 In an article in the San Francisco Chronicle (July 1, 2004), author Tom Elkjer noted that
“champagne producer Jean-Pierre Fleury once said that biodynamic farming increased his
workload by 30 percent compared to conventional viticulture.” Much of that increase was in
“planning, organizing and preparing precisely calibrated natural treatment for [the] vineyards.”8
It is also important to note that organic or biodynamic grapes are associated with a lower yield
per acre as compared to conventional grapes. The average yield per acre for conventional grapes
is 5 tons for Cabernet Sauvignon and 6 tons for Chardonnay (Weber, Klonsky, and De Moura,
2003; et al., 2004a). For organic and biodynamic grapes, the average yield for all varietals is
estimated at 4 tons/acre (Smith et al., 2004; Weber, Klonsky, and De Moura, 2005),9 a 20 to 30%
reduction in yield for organic and biodynamic grapes as compared to conventional grapes.
4. The value of eco-labeling
Many consumers presume that organic foods taste better and provide greater health benefits than
their conventionally grown counterparts (Huang, 1991; Huang and Lin, 2007; Jolly and Norris,
1991). This is not the case with wine made from organically grown grapes.
Consumer awareness and understanding of wine eco-certification
Because there is a variety of wine eco-labels and of wine eco-certification bodies, consumers
may be confused about the actual meaning of wine eco-certification. First, consumers may be
confused over the definition of organic wine and may not understand the difference between
“wine made from organically grown grapes” and “organic wine.” Second, consumers may not be
familiar with biodynamic certification, which has been introduced recently in California and has
still only been adopted by a few wineries.
Wine made from organic grapes is wine made from grapes that have been grown without
pesticides. Organic wine is also made with organic grapes but prohibits sulfite use in the wine-
7 Silverman, Lanphar (2003), Benziger Family Winery Case Study. 8 Thom Elkjer. 2004 “Biodynamos Cutting-edge vintners put their wines to a taste test” San Francisco Chronicle
July 1, 2004.

10
making process.10 This distinction is important because sulfites affect the quality of the wine.
Sulfites act as a preservative. Eliminating sulfites can reduce the quality of the wine because the
wine is not as stable and cannot be kept very long. There is no such problem for wine made from
organic grapes because sulfites are used in the wine-making process.
A survey conducted at the University of California in 2006 provides insights into wine
consumers’ familiarity with organic and biodynamic wines. In this survey 400 respondents from
California expressed their attitude toward wine eco-labels. While 66% of the respondents were
familiar with “organic wine” and 39% had tasted organic wine, only 19% were familiar with the
difference between organic wine and organically grown grapes. 11 Because the distinction
between organic wine and wine made from organic grapes is not readily known, people might
associate both with lower quality.
In addition, there may be little recognition of biodynamic certification. Results from the survey
conducted at UC Santa Barbara showed that a small percentage of respondents (17%) were
familiar with “wine from biodynamically grown grapes” and only 8% had tasted biodynamic
wine. Among the respondents who were familiar with organic wine, the vast majority (76%) had
not heard of biodynamic wine.
The existence of several competing labels might confuse consumers about the content of eco-
certification and its impact on wine quality.
9 One ton of grapes can produce 700 bottles of wine on average.
10 Because wine harvesting and production requires specific handling and processing methods, the USDA developed
explicit regulations regarding sulfite use for organic wine and other alcoholic beverages. Sulfites are a natural
byproduct of fermentation and are often added to wine for preservation purposes. Added sulfites are prohibited in
100% organic wines and in organic wines (95% organic), and are regulated by 7 CFR 205.605 in wines made with
organic ingredients. According to the U.S. Department of Agriculture's National Organic Program, an organic wine
has been defined as "a wine made from organically grown grapes and without any added sulfites."
11 Delmas et al., 2006. Survey of wine consumers. University of California, Santa Barbara.

11
Private benefits associated with eco-certification
While the health benefits of wine consumption are touted in recent dietary and medical studies,
the research has not made the link of added personal benefits due to environmental practices. The
link may be more indirect to consumers than is the case for other agricultural products because
wine is processed for differentiation and pleasure after the certification requirements are met.
This construction convolutes the quality and health values of eco-labels in the wine industry.
Eco-wines and health
Besides the lack of understanding of the potential benefits of sustainable practices on the quality
of wine, there is still little evidence on the impact of eco-wine on health. Historically, wine was
considered a necessary component of a healthy diet (Goldfinger, 2003). The presence of
phenolics and tannins in grapes and wine products has dramatic effects on wine flavor, quality,
and storability. These compounds can also play important roles as antioxidants and cancer
preventative agents in humans. In the early 20th century, epidemiologic research reported that
moderate wine drinkers had the lowest mortality rates, while heavy drinkers and abstainers had
higher mortality rates. This phenomenon, originally called the “French Paradox,” is due to the
antioxidant effect associated with polyphenolic compounds found in red wines. Additionally,
besides antioxidant properties, some components of red wine have proved to have an anticancer
effect in terms of initiation, promotion, and progression of cancer cells (Miceli et al., 2003).
Some initial research has studied the different health effects of traditional wine versus organic
wine, though in general there has not been much research completed on the topic. Some studies
have concluded that there is no discernable difference, but others have yielded opposing results.
Miceli et al. (2003) compared red table wines, controlled denomination of origin (DOC) wines,
and wine made from organically grown grapes from the same region in Italy. The study
concluded that antioxidant activity was 50% lower in traditional wines compared to DOC wines
and the organic wine. Additionally, the study tested OTA contamination, a toxin often found in
cereals, coffee, cocoa, and related food items, that has adverse effects on the immune system.
OTA contamination was highly varied across the wines tested, but contamination was
significantly lower in the organic wine.
12
Even less research has been completed on the health effects of biodynamic wine. However, a
study showed that biodynamic farming methods affect vine health and grape chemistry (Reeve et
al., 2005). Biodynamically grown grapes had significantly higher sugar content and notably
higher total phenols than organic grapes.
The results of these studies show that both viticultural and enological practices have important
influences on resulting concentrations of tannins and polyphenolics in the subsequent wine
products. Further research on the influence of both viticultural and enological practices on
phenolic content as it relates to wine quality and human health benefits is currently underway.
Eco-wines and quality
Concerning the perception of the quality of organic and biodynamic wines, results from the
survey conducted at UC Santa Barbara showed that it varied greatly according to the familiarity
of the respondents with those wines. Among the respondents who had tasted organic wine, 55%
had a positive to very positive opinion of the quality of the wine. Among the respondents who
had not tasted organic wine, only 31% had a positive opinion of the quality of organic wine.
Regarding biodynamic wine, the few who had tasted it had a positive to very positive perception
of the quality of the wine. But the majority of respondents expressed confusion, unjustified
skepticism, or an incorrect perception of biodynamic wine. Interestingly, the majority of
respondents who were not familiar with biodynamic wine associated the term with Genetically
Modified Organisms or bioengineered products.
Because of the lack of clarity on the value added by wine eco-labels, some wineries currently
follow organic and biodynamic practices without being certified. Others become certified but do
not provide the information on their bottle label.12 One reason is that growers want to have the
flexibility to change their inputs if it becomes necessary to save a crop during bad weather
conditions or other pestilence. 13 The other reason is that most of these wineries think that there is
a negative image associated with organic wine.
12 Rauber Chris, (2006) Winemakers go organic in bottle but not on label, San Francisco Business Times, October
22, 2006 .
13 Wine Institute of California, Eco-friendly winemaking web page (2006), http://www.california-wine.org/webfront/base.asp?pageid=15
13
For example, Tony Coturri from Coturri winery has certified organic vineyards and uses no
chemicals in his wine making but he doesn’t use the word “organic” on the Coturri Winery labels.
According to him:
In all honesty, wine consumers have not embraced quality and organic in the same line yet. They still have the attitude that organic wine is a lower quality than what you can get in a conventional wine. It’s a stigma. If you’re strictly looking for organically grown, no-sulfite wine, then you’re looking at what I consider a lesser-quality product. These wines have to stand on their own merits.14
The environmental impacts of wine making
Without clear benefits of eco-wine on health and quality, we might envisage that organic
certification may appeal to the altruistic values of environmentally aware consumers who would
like to promote sustainable agriculture. Altruistic customers may want to purchase eco-wine as a
substitute for donations to an environmental organization (Kotchen, 2005). However, the
environmental impact of wine making is not well known. The wine industry is typically not an
industry targeted by environmental NGOs as a major environmental polluter. On the contrary,
wine making may be associated in the minds of customers as an environmental practice since
most bottles or advertisements illustrate wine making with bucolic scenery. This is not to say that
the wine industry does not have an impact on the environment. In the wine grape cultivation
stage, soil erosion, toxicity (as a result of pesticide and fertilizer use), and water use are the main
environmental concerns.15 However, these concerns may not be associated with the current
image of the wine industry.
In conclusion, because of (i) consumers’ lack of understanding of the meaning of biodynamic or
organic certification and (ii) the perception that eco-certification might not be associated with
increased quality or health benefits, and because (iii) wine growing might not be perceived as
having a high environmental impact, we hypothesize that eco-labeling might not be associated
with price premiums in the wine industry. Hence:
14 Paul Gleason Organic Grapes, Organic Wine. The Harvest is Bountiful, but the Labeling Controversy is Still
Fermenting. http://www.emagazine.com/view/?3423 Accessed on October 26, 2007

14
H1: Eco-labeling is not associated with price premiums in the wine industry.
5. The value of eco-certification
If eco-certification has an unclear value for consumers, why would wineries pursue it? Can
wineries still obtain a price premium if customers do not value eco-certification? What would be
the mechanism that could lead to a price premium related to certification independently from the
eco-label? We hypothesize that eco-certification provides three main benefits. The first one is
associated with an increase in the quality of the grapes and the wine, the second one pertains to
learning about environmentally friendly practices through the certification process, and the third
one relates to reputation benefits associated with membership in a club of certified wineries.
Eco-certification and quality
While most consumers may not associate benefits with eco-certification, wine makers seem to
find some advantages related to eco-certification. In particular, many wine makers claim that the
adoption of green practices is a way to increase the quality of their wines. For example, Ron
Laughton from Jasper Hill Vineyards says that wines without chemicals can better express the
flavors of the ‘terroir’:
Flavors are created in the vine. The building blocks are the minerals in the soil. If you keep applying synthetic chemicals, you are upsetting the minerals in the soil. So if you wish to express true terroir, you should be trying to keep the soil healthy. Let the minerals that are already there express themselves in the flavor in the vine. Herbicides upset the balance of the vineyard simply because dead grasses are an essential part of the vineyard floor. Those dying grasses act as food for another species, and they act as food for another species. You go right down the food chain to the organisms that create the minerals for your plant to suck up and create the building blocks for the flavors. It’s not rocket science.16
Similarly, wine maker John Williams, owner of Frog’s Leap Winery in Napa Valley, pursues
certification to produce better wines. According to him:
15 According to the California 2004 Annual Pesticide Use Report, over 23.5 million pounds of pesticides were applied to wine grapes. Pesticides degrade the air quality depending on the chemicals used and method of application. They also affect the soil and water quality when leaching through the soil to bodies of water. 16 Biodynamics in the vineyard. The Organic Wine Journal http://www.organicwinejournal.com/index.php/main/more/biodynamics_in_the_vineyard/ Accessed on October 26, 2007

15
The bottom line is wine quality, not the organic movement’s ‘save the world’ agenda [.] Organic growing is the only path of grape growing that leads to optimum quality and expression of the land in wine. And that’s for the same reason that a healthy diet and lifestyle make for healthy people. When the soil is healthy, then the vines are healthy. The analogy is almost totally complete.17
These wine makers also prefer to put the quality of their products up front rather than discuss
eco-certification or even label it on their bottle. This is because the label may not be associated
with high-quality wines. According to Mike Benziger of Benziger Sonoma Mountain Estate:
When I talk about our wines I always approach it from quality first. If I can make that connection with people, and the wine is good, the whole hope is they’ll ask me how it was made. Once they ask me, I have permission to tell them about biodynamics. That order has the most effect.18
Eco-certification and learning
If environmental practices lead to better grapes, do wineries still need to go through third-party
certification? One could imagine that some of these benefits could be obtained by wineries
without obtaining certification. However, certification is usually not limited to a stamp of
approval of the conformity of adopted practices to a specific standard. Some wineries and third-
party certification agencies claim that the process of certification helps wineries learn about the
best environmental management practices and helps them formalize their practices. 19 In
summary, the process of certification would be associated with consulting services that help
wineries improve their existing practices. This phenomenon has been identified in many eco-
certification processes, such as for example the ISO 14001 certification process.
Eco-certification and reputation
In addition, eco-certification allows wineries to be part of trade associations focusing on
environmental issues. Eco-certification is required to be considered a member of these
17 http://www.thewinenews.com/augsep00/cover.html Accessed on October 26, 2007,. 18 Biodynamics in the vineyard. The Organic Wine Journal http://www.organicwinejournal.com/index.php/main/more/biodynamics_in_the_vineyard/P2/ Accessed on October 26, 2007 19 CCOF, the main eco-certification agency in California, claims on its website the following benefits associated with certification: “Learning about practices. It is possible to adopt green practices without certification and it is possible to obtain the same level of greenness. However, the certification process can help an organization learn about the practices.”

16
associations. For example, the California Certified Organic Farmers (CCOF) organization was
one of the first organizations to certify organic farms in North America. It is a non profit that
plays the role of a trade association. It helps promote certified farmers and wineries and has a
long history of helping implement organic legislation.20 This is similar to other certification
agencies providing capabilities to enhance organizations’ business capabilities and markets.21
Scholars have shown that such trade associations could be conceptualized as ‘clubs’ that:
“promulgate standards of conduct targeted to produce public benefits by changing members’
behaviors. In return, club members receive excludable and nonrivalrous (club) benefits, such as
affiliation with the club’s positive ‘brand name’” (Potoski and Prakash, 2004:235). In the case of
wine, eco-certification provides a broad reputation benefit through participation in trade
associations. In addition, participation in such associations could help wineries avoid costly
government regulation and other liabilities as a result of their environmental impact (Lenox,
2006).
In conclusion, because of the potential benefits described above, we hypothesize the following:
H2: Eco-certification is associated with price premiums in the wine industry.
Overall, we hypothesize that eco-certification and eco-labeling will have differing effects on
the price of wine. While eco-certification would be associated with price premium, eco-labeling
would not.
6. Methodology
In order to assess whether or not there is a price premium associated with organic and
biodynamic certification, we study the price of 13,426 wines of California, spread over wine
vintages from 1998 to 2005. These represent 1495 wineries, mostly from the coastal regions of
the state, or about 72% of California wineries. California accounts for an estimated 90% of the
20 As stated on the CCOF website: “With over 30 years of experience and integrity, CCOF is your best ally for: organic certification, Trade Support , Marketing assistance and PR support, Political advocacy and Consumer education about organic products.” See http://www.ccof.org/certification.php Accessed December 7, 2007. 21 “ During audits, certification bodies focus on conformance with the standard and overall effectiveness of the system. Increasingly, they are using their considerable expertise and capabilities to enhance an organization’s business advantage — expertise and capabilities which are missing from self-declaration.” http://www.dnvcert.com/DNV/Certification1/Resources1/Articles/Environmental/UnderstandingtheBenefi/

17
US wine production, making over 260 million cases annually.22 23 In fact, if California were an
independent nation, it would be ranked the fourth largest producer of wine in the world behind
France, Italy, and Spain.24
Description of our variables
We include all available California wine observation, with data on varietals, regions, and
appellations accessed from the Wine Spectator website database of more than 180,000 wine
ratings and tasting reports. The Wine Spectator Magazine is a bimonthly publication that
provides information, articles, and recommendations about wine. Each publication has a “buying
guide” section, rating newly released wine on a 100-point scale. The Wine Spectator designed a
blind-tasting procedure to rank overall quality within categories of wines.25 They perform the
tasting with reference to varietal, region, and vintage without other knowledge of the wine. Wine
Spectator publishes this score with winery, wine name, vintage, grape varietal(s), region, and the
suggested retail price, and often gives tasting notes about the wine’s appeal. The number of cases
is reported when available.
Table 1 provides summaries of the primary variables for these data. The release “price” is the
manufacturer’s suggested retail price, varying from $5 to $500 with mean price of $35.48, and is
not adjusted for inflation. It may be expected to differ from actual retail price. Our regression
specifications use a natural-log transformation of price. We consider this price variable to reflect
the wine maker’s educated expectation of market value. “Score” averages 86 with a standard
deviation of 4, indicating a fairly narrow range of quality specification. All California wines are
scored consistently by a single taster; this variable serves as a good proxy for overall quality.
Wine “vintage” specifies the year the grapes were grown, harvested, and pressed into wine juice;
this variable captures and reflects the weather of the year. “Issue year” is the date the Wine
Spectator released the tasting scores and evaluations. We calculate “age” using year of issue less
vintage; the magazine representatives taste and score wine an average of 2.5 years after the
vintage year. Production is measured in thousands of cases, ranging from small, vineyard-
22 U.S. Treasury’s Alcohol and Tobacco Tax and Trade division data. 23 USDA, NASS, California field office (2005) California Agriculture Overview. 24 Food and Agriculture Organization of the United Nations. (2005) FAOSTAT data. 25 Wine Spectator Online http://www.winespectator.com/Wine/Free/Wine_Ratings/About_Tastings/0,4634,,00.html, accessed October 25, 2007.

18
specific, twenty-case wines to corporations producing up to 1,000,000 cases of a particular wine
each year. Many varietals comprise the data, with classics like Cabernet Sauvignon, Chardonnay,
and Pinot Noir dominating the collection. The varietals can be sorted into red wine, white wine,
and other; the numbers of observations are 9377, 3902, and 147, of each type respectively. The
spatial coverage of our data is 160 wine-growing appellations, such Napa Valley and Santa Rita
Hills, nested in seven large regions of the state.
The “certified” variable is of primary interest for our research, indicating that the wine
observation is eco-certified. There are three main ways we distinguish an observation as certified.
First, the winery has certified organic vines. We match our wine list to data of organically
certified vineyards and year of certification as provided by certifier California Certified Organic
Farmers (CCOF). Second, the winery follows biodynamic practices as certified by and listed
with Demeter Certification Services. Finally, a winery purchases grapes from one of the two
preceding sources. About 2.3% of the data are certified wines. Twenty-eight wineries have
sought one of the eco-certifications and a handful of others purchase these eco-certified grapes.
Each vintage year shows an increase from the previous in the percentage of wines that are
certified within our dataset, with 15 wineries becoming certified during the period of observation.
The variable “eco-label” specifies that the certified winery uses language and/or symbols on their
products, signaling their greenness to consumers. We contacted each certified winery to
determine its labeling practices and rationale. Sixteen wineries have an eco-label on the bottle, or
about half the certified wineries, and these products account for 34.5% of the eco-wine
observations. The average price of an eco-label wine is $37.65, a few dollars lower than a
certified but unlabeled bottle averaging $40.54. These prices are both higher than the average
bottle of wine in the data, by 6% and 14% respectively.
Descriptive statistics
Many variables factor into wine price. Table 2 provides the linear correlation between prices and
these factors. Score and price are correlated, and as expected, a higher quality wine will cost
more to produce and will garner a better price. Issue year and vintage are also positively
correlated, relating the decision to release wine 1 to 3 years after bottling. The certification
variable does not covary strongly with other variables; however price and certification are
certainly related because the certification process and practices are added costs that potentially

19
increase the price of wine. Figure 1 shows the relationship of issue year and vintage as related to
price. The attributes of vintage and issue year have a strong patterned relationship with price.
Each line represents a specific vintage and tracks the price over a few issue years. These price
changes are positive through time; the longer a wine is aged the higher the release price.
However, the fact may be that wines of higher quality are just released later. The data are further
distinguished as certified (indicated with open symbols and key-name marked with a “c”) or not
certified. Certified wines show a price premium for nearly all vintages and issue years. The price
wedge for certification appears to grow over time. Of course, we are not accounting for other
controls in this apparent trend. A full hedonic approach is necessary to understand the nuanced
wine attributes’ effect on price.
Description of our model
Wine has considerable variation in quality, character, style, and flavor. Wine also tends to be a
cultural pursuit, providing consumers with a wide array of choice at various prices to match the
palate. Our research follows in the tradition of hedonic price models – decomposing the
consumer demand for a product using the attributes (Rosen, 1974). Earlier work has queried the
effects of wine characteristics on price. Oczkowski (2001, 1994) determines the relationship of
reputation to the price of premium wine controlling for varietal, vintage, region, and a
professional quality metric. Others ask if these quality indicators factor in the price of wine;
Combris et al. (1997) find that professional quality ratings do not predict Bordeaux wine prices.
However, Bombrun and Sumner (2001) also employ a hedonic equation of determinants of wine
using Wine Spectator data; they find a positive and significant relationship between the quality
and price over a wide variety of California wines. Other wine literature shows price sensitivity to
be quite high for Swedish consumers, which is expected due to the ‘luxury’ nature of wine
(Nerlove, 1995). However, Unwin (1999) suggests that hedonic specifications cannot capture the
nuances of the industry, although Thrane (2004) rebuffs the criticism and demonstrates the
applicability of this approach.
These previous research approaches commonly use the typical wine characteristics and qualities
of varietal, age at release, appellation, label designation, vintage, tasting score, and tasting notes
such as color, scent, and texture. Our research makes an important contribution to this agenda,
incorporating two additional controls: winery skill and eco-practices.

20
The full regression specification estimates the hedonic price of wine as a function of eco-label,
certification, and other control variables. We control for idiosyncratic winery attributes using
longitudinal data, following wineries over time in most of our specifications:
Following convention in price hedonic studies, we use the log-linear specification instead of the
linear specification (Thrane, 2004).26 The covariates in X include Vintage, Score, Issue year, and
Cases for each wine observation; all models control for appellation and varietal. We also
estimate variations of the above equation such as not including score and not controlling for
winery fixed effects. The eco-premium may be specific to the type of wine or to certain price
ranges, so we estimate the price equations for red wine and white wine separately. In addition,
we break the data into quartile subsets by average winery price and estimate four specifications
to determine how each sector is distinctly affected. We unravel the eco-premium effect by
separating the label practices from the certification. We expect that the reputation and consumer
preferences affect price differently than the practices alone.
Finally, price and quality are codetermined during the production of wine and eco-practices can
affect both. Certification is costly and the price will likely be passed on to consumers. However,
much of the cost of eco-certified wine is from increased labor, which may also improve the
quality of wine – the special production and care could result in higher scores. We therefore
estimate similar regressions of score as a function of the certification, vintage, price, issue year,
and cases produced.
7. Results
We first estimate the effect of the eco-certification of grapes on the price, as the indirect price
premium, and distinguish the eco-label variable coefficient as the direct consumer change in
26 It should be noted that in this study the linear model yielded basically the same results as the log-linear model. Results available upon request.
lnPriceits = ϕ ·Eco-Labels + β ·Certs + ϕ ·Xits + αi + δ ·Varietals + ρ ·Appellations + εits (2)
where i = winery, t = vintage, s = wine
21
willingness to pay. Various specifications in tables 3 through 6 demonstrate the important
distinctions between effects of green practices, certification, and labeling.
In table 1, model (1) is the full model and also includes winery fixed effects. In model (2) we
remove the winery fixed effects and in model (3) we remove the variable score. We conjecture
that the certification variable will have a positive price impact due to the summary statistics and
the theory of price premiums; however, eco-labeling may lower price. We expect Score (a proxy
for quality) and Age (as measured by Issue Year) to also be positive and significant, each ceteris
paribus. Cases should be negative and significant, reflecting increasing returns to scale in capital
investment. A younger wine as given by Vintage should also decrease price (Thrane, 2004).
The partial effect of these variables on price is interpreted as the percent change in price due to
the eco-practice. Specification (1) in table 3 gives the main result: while certifying the wine
increases the price by 13%, including an eco-label reduces the price by 20%. Certification is
statistically significant in regression specification (2), which does not control for winery fixed
effects, but at a lower effect; the major change here is that Score now functions as a proxy for
winery reputation, too.
All other effects are highly significant and the coefficients are consistent with previous results in
the wine hedonic price literature and our hypotheses. Many varietals are also statistically distinct
in price although the coefficients are not displayed. Although most previous studies have
included both red and white wine simultaneously in their analyses, Thrane (2004) suggested
analyzing white and red wines separately because the effects of a set of attributes on wine prices
may differ for red and white wines. Following his suggestion, models (4) and (5) give the results
with separate price equations for red wine and white wine. The results show that the eco-
premium is driven by red wines, with a certification premium of 11.7%. The certification and
labeling coefficients are larger and more significant for red wines than in the full equations. We
do not find a significant price premium for eco-practices in white wines.
Table 4 separates the data into quartile subsets by winery. We used average wine price of a
winery over the data period when creating the quartiles to keep the panel data intact. The mean
quartile prices are $13, $24, $33, and $50. We see that the lower-middle and upper-middle price-
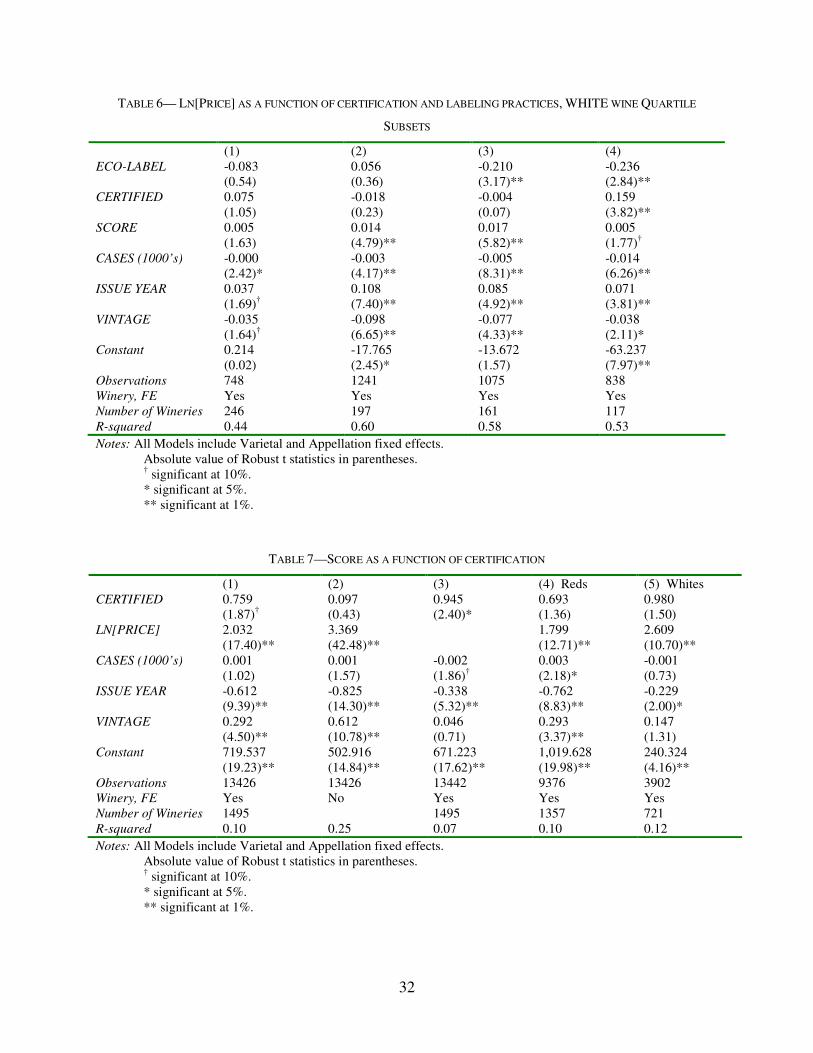
points are responsible for this certification/label trade-off. Tables 5 and 6 further delineate the
data into red and white quartile subsets, showing the effects within these broad varietal

22
categories. We tested the linear combination of Eco-label plus Certified as equal to zero and
could not reject this hypothesis for any of the specifications – in effect, the labeling of bottles
seems to wash out the price premium of certification.
Tables 7 and 8 reverse the dependent variable and the quality metric Score. Now we interpret the
coefficient of certification as the point change due to the eco-characteristics. Score is not well
captured by these data, as demonstrated by the many insignificant variables and low R2 values,
and seems to be determined instead from je ne sais quoi unobservables of the taster’s palate. The
full specification in table 7 shows Certification boosting score by 0.8 points, significant at the
10% level, from an average pre-certification score of 83.8. Certification becomes a stronger
predictor when price is removed from the equation (3), as expected because of the positive
correlation of these two variables. These findings corroborate our hypothesis that certification
will affect the quality if the variability in price does not fully link with quality. Furthermore,
scores are determined in a blind tasting, and therefore should preclude distinguishing the eco-
labeled bottles from those certified but unlabeled (see table 8). However, a significant quality
difference in the eco-labeled wineries may not be captured by price, and indeed, the labeled
group is driving the certification effect on score, with a positive premium of 1.6 points.
8. Discussion and conclusion
Eco-labels provide information about the environmental characteristics of a product. Eco-labels
are effective if consumers are willing to pay a price premium for green products which are
costlier to produce. If consumers are not willing to pay a premium for an eco-label why should
an organization still seek certification? Are there other benefits associated with the certification
process? We investigated this question in the wine industry, where many wineries obtain eco-
certification but do not label it on their wine bottle.
In this paper, we empirically determined the price premium associated with eco-certification in
the California wine industry. Consumer value of wine eco-labels due to personal benefits such as
improved wine quality and better health is still unknown and research studying sustainable wine-
making on wine quality and health is lacking. Also, eco-labels are relatively new and consumers
do not necessarily understand the actual meaning behind the different labels. More specifically,
some consumers are still confused about the difference between wine made out of organically

23
grown grapes and organic wine, which does not use sulfite in the process of making the wine.
Organic wine, unlike wine made out of organically grown grapes, could be less stable over time
and therefore of a potentially lower quality. Because there is little awareness and understanding
of eco-certification in the wine industry, one might wonder whether there is a price premium
associated with eco-labeling.
In order to tease out the benefits associated with the label from those associated with certification,
we introduced a variable representing third-party eco-certification and another variable
representing the inclusion of this certification on the wine label. We tested the effect of these two
variables on the price of wine.
Our results show that eco-labeling has a negative impact on prices in the wine industry, while we
find a price premium associated with eco-certification. The negative result associated with eco-
labeling can be explained by the lack of understanding of the eco-certification process. Our
findings support and enhance what certified wine-makers have been saying: wine must first pass
muster in quality and some consumers stigmatize organic wine, dismissing it as an inferior
product.
Yet eco-certification does not need to be directly associated with consumers’ recognition of the
label, as we demonstrate with the investigation of other potential benefits associated with
certification. We theorize that certification can provide reputation benefits via clubs or trade
associations. We also suspect that eco-certification can lead to a higher wine quality and
provided a second set of regressions of wine characteristics on the scores attributed by the Wine
Spectator. The results indicate that wine quality increases with eco-certification. The winery
might also gain reputation and publicity; thus eco-certification broadly confers benefits that are
not directly associated in the consumers’ decision with specific environmental practices.
Our research is not without limitations. First, our measure of quality is imperfect. The Wine
Spectator ratings we used may reflect a specific set of preferences. While Wine Spectator scores
are widely used by wine consumers, further research could compare our results to other existing
ratings. Second, while we argued that there are benefits associated with green practices, we were
not able to identify the adoption of green practices independently from certification. Further
research could survey wine makers who are not certified to identify whether some of them have
also adopted of environmentally friendly growing practices

24
Using the context of wine, we have identified a mechanism that could lead producers to seek
eco-certification independently from its label. This mechanism had not been identified in the
previous literature on eco-labels. It is possible that the difference between eco-certification and
eco-labeling benefits will fade over time as consumers become more informed about the link
between green practices and wine quality.
Other industries may be adopting mechanisms that relate eco-certification to an increase in
quality. We hypothesize that similar patterns could be at work for other agricultural products
such as coffee, because the conditions may be similar to those identified for grape growing. The
manufacturing sector may elicit a similar pattern if socially responsible investors use
environmental management practices as a proxy for good management.
25
References
Blamey, R.K., Bennett, J.W., Louviere, J.J., Morrison, M.D, and Rolfe, J. 2000. A test of policy
labels in environmental choice modeling studies. Ecological Economics, 32(2): 269-286.
Bombrun, H. and Sumner, D. 2001. What determines the price of wine? (AIC Issues Brief)
Cason, T.N. and Gangadharan, L. (2002). Environmental labeling and incomplete consumer
information in laboratory markets. Journal of Environmental Economics and
Management, 43:113-134.
Combris, P., Lecocq, S., and Visser, M. 1997. Estimation of a hedonic price equation for
Bordeaux wine: Does quality matter? Economic Journal, 107: 390-402.
Cornes, R. and Sandler, T. (1996). The Theory of Externalities, Public Goods, and Club Goods,
2nd edition. Cambridge University Press.
Crespi, J.M. and Marette, S. 2005. Eco-labelling economics: Is public involvement necessary? in
Environment, Information and Consumer Behavior. Edited by S. Krarup and C. S.
Russell. Edward Elgar Publishing: 93-110.
Delmas, M., Shimshack, J., and Montes, M. 2007. Information disclosure policies: Evidence
from the electricity industry. Institute for Social, Behavioral, and Economic Research.
ISBER Publications. Paper 09.
Davies, A., Titterington, A.J., and Cochrane, C. 1995. Who buys organic food? A profile of
purchasers of organic food in Northern Ireland. British Food Journal, 97: 17-23.
Ferraro, P., Uchida, T., and Conrad, J.M. 2005. Price premiums for eco-friendly commodities:
Are ‘green’ markets the best way to protect endangered ecosystems? Environmental and
Resource Economics, 32(3): 419-438.
Goldfinger, T.M. 2003. Beyond the French paradox: The impact of moderate beverage alcohol
and wine consumption in the prevention of cardiovascular disease. Cardiology Clinics,
21: 449-457.
Grodsky, J. 1993. Certified green: The law and future of environmental labeling. Yale Journal of
Regulation, 10: 147-227.

26
Huang, C.L. 1996. Consumer preferences and attitudes toward organically grown produce.
European Review of Agricultural Economics, 23(3):331-342.
Huang, C.L. and Lin, B.-H. 2007. A hedonic analysis of fresh tomato prices among regional
markets. Review of Agricultural Economics, 29(4):783-800.
Ibanez, L. and Grolleau, G. 2007. Can ecolabeling schemes preserve the environment?
Environmental Resource Economics. Forthcoming.
Jin, G. and Leslie, P.. 2003. The effect of information on product quality: Evidence from
restaurant hygiene grade cards. Quarterly Journal of Economics, 118(2): 409-51.
Jolly, D. and Norris, K. 1991. Marketing prospects for organics and pesticide-free produce.
American Journal of Alternative Agriculture, 6(4): 174-38.
Kotchen, M.J. 2006. Green markets and private provision of public goods. Journal of Political
Economy, 114(4): 816-845.
Leire, C. and Thidell, A. 2005. Product-related environmental information to guide consumer
purchases – A review and analysis of research on perceptions, understanding and use
among Nordic consumers. Journal of Cleaner Production, 13(10,11): 1061-1070.
Lenox, M. 2006. The role of private, decentralized institutions in sustaining industry self-
regulations. Organization Science, 17(6): 670-690.
Loureiro, M.L and Lotade, J. 2005. Do fair trade and eco-labels in coffee wake up the consumer
conscience? Ecological Economics, 53(1): 129-138.
Loureiro, M.L. 2003. Rethinking new wines: Implications of local and environmentally friendly
labels. Food Policy, 28(5-6): 547-560.
Magnusson, M.K., Arvola, A., Koivisto Hursti, U.-K., Aberg, L., and Sjoden, P.o. 2001.
Attitudes towards organic foods among Swedish consumers. British Food Journal, 103:
209-227.
Miceli, A. et al. 2003. Polyphenols, Resveratrol, antioxidant activity and Ochratoxin A
contamination in red table wines, Controlled Denomination of Origin (DOC) wines and
wines obtained from organic farming. Journal of Wine Research, 14(203): 115-120.
27
Miles, S. and Frewer, L.J. 2001. Investigating specific concerns about different food hazards.
Food Quality and Preference,12: 47-61.
Nerlove, 1995. Hedonic price functions and the measurement of preferences. Economic Record,
39: 1697-1716.
Oczkowski, E. 1994. A hedonic price function for Australian premium table wine. Australian
Journal of Agricultural Economics, 38: 93-110.
Oczkowski, E. 2001. Hedonic wine price functions and measurement error. The Economic
Record, 77: 374-382.
Organic Trade Association, 2006. The OTA 2006 Manufacturer Survey Overview available at
http://www.ota.com/organic/mt.html
Potoski, M. and Prakash, A. 2005. Green clubs and voluntary governance: ISO 14001 and firm’s
regulatory compliance. American Journal of Political Science, 49(2):235-248.
Reeve, J.R. et al. 2005. Soil and winegrape quality in biodynamically and organically managed
vineyards. American Society of Enologists, 56(4): 367-376.
Reiser, A. and Simmons, D.G. 2005. A quasi-experimental method for testing the effectiveness
of ecolabel promotion. Journal of Sustainable Tourism, 13(6):590-616.
Reiser, A. and Simmons, D.G. 2005. A quasi-experimental method for testing the effectiveness
of ecolabel promotion. Journal of Sustainable Tourism, 13(6):590-616.
Rosen, S. 1974. Hedonic prices and implicit markets: Product differentiation in pure competition.
Journal of Political Economy, 82: 34-55.
Smith, R.J., Klonsky, K.M, Linvingston, P., De Moura, R.L. 2004. Sample costs to establish a
vineyard and produce wine grapes, chardonnay, CA north coast region, Sonoma County
2004 University of California cooperative extension, UC Davis. GR-NC-04-0
Teisl, M.F., Roe, B., and Hicks, R. 2002. Can eco-labels tune a market? Evidence from dolphin-
safe labeling of canned tuna. Journal of Environmental Economics and Management, 43:
339-59.
Thrane, C. 2004. In defence of the Price Hedonic Model in wine research. Journal of Wine
Research, 15(2): 123-134.
28
Tregear, A., Dents, J.B., and McGregor, M.J. 1994. The demand for organically grown produce.
British Food Journal, 96: 21-25.
Unwin, T. 1999. Hedonic prices indexes and the qualities of wine. Journal of Wine Research, 10:
95-104.
Wandel, M. and Bugge, A. 1997. Environmental concern in consumer evaluation of food quality.
Food Quality and Preference, 8: 19-26.
Wandel, M. 1994. Understanding consumer concern about food-related health risks. British Food
Journal, 96: 35-40.
Weber E.A., Klonsky, K.M, De Moura, R.L. 2003. Sample costs to establish a vineyard and
produce wine grapes, Cabernet Sauvignon, CA north coast region, Napa County 2005,
University of California cooperative extension, UC Davis.
Weber E.A., Klonsky, K.M, De Moura, R.L. 2005. Sample costs to produce organic wine grapes.
Cabernet Sauvignon. University of California Cooperative Extension. UC Davis GR-NC-
05-10.
Winters Lynch, J. 1994. Determinants of effectiveness for environmental certification and
labeling programs. Office of Pollution Prevention and Toxics. US EPA.

29
TABLE 1—DATA DESCRIPTION
SUMMARY
STATISTICS
Observations 13,426 Wineries 1,495 VARIABLE Mean SD Min Max PRICE (NOMINAL) 35.48 26.16 5.00 500.00 LN[PRICE] 3.37 0.61 1.61 6.21 SCORE 85.98 4.13 55 99 VINTAGE 1998 2005 YEAR OF ISSUE 1999 2007 AGE AT ISSUE (YEARS) 2.54 0.79 1 8 CASES (1000's) 8.47 33.40 0.02 1000 CERTIFIED
1 0.023 0.151 0 1
ECO-LABEL 2 0.008 0.091 0 1
VARIETALS 3 Cabernet Blend 2.6% Cabernet Sauvignon 16.9% Chardonnay 17.2% Merlot 7.6% Pinot Noir 16.2% Red Blend 4.0% Sauvignon Blanc 6.2% Syrah 9.6% Zinfandel 9.5% VINTAGE BY
CERTIFICATION
Not Cert Cert Total 1998 1,900 31 1,931 1999 2,237 47 2,284 2000 1,110 19 1,129 2001 2,585 67 2,652 2002 2,381 74 2,455 2003 1,705 36 1,741 2004 1,026 27 1,053 2005 168 13 181 Tot al 13,112 314
Notes: 1Twenty-eight wineries are certified. 2Sixteen wineries use eco-labels. 3Varietal listed if representing more than 2% of the data. Other varietals in the dataset include Semillon, Marsanne, Riesling, Barbera, Rose, Chenin Blanc Gewerztraminer, Pinot Blanc, Dessert Wine, Other Red, Mourvedre, Roussanne, Grenache, Cabernet Franc, Sangiovese, Sparkling Wine, Pinot Gris, Other White, White Blend, Petite Sirah, and Viognier.

30
TABLE 2—DATA CORRELATION
PRICE LN[PRICE] VINTAGE SCORE ISSUE CASES CERT’D
PRICE 1.00
LN[PRICE] 0.89 1.00
VINTAGE 0.01 0.01 1.00
SCORE 0.35 0.41 -0.03 1.00
YEAR OF ISSUE 0.16 0.18 0.91 -0.02 1.00
CASES (1000’S) -0.17 -0.28 0.01 -0.12 -0.04 1.00
CERTIFIED 0.02 0.02 0.03 0.01 0.03 -0.01 1.00
TABLE 3—LN[PRICE] AS A FUNCTION OF CERTIFICATION AND LABELING PRACTICES
(1) (2) (3) (4) Reds (5) Whites ECO-LABEL -0.200 -0.019 -0.181 -0.199 -0.080 (2.71)** (0.42) (2.49)* (2.16)* (0.85) CERTIFIED 0.133 0.053 0.141 0.156 0.072 (3.17)** (1.80)† (3.38)** (2.97)** (1.54) SCORE 0.014 0.038 0.013 0.015 (16.51)** (34.24)** (12.21)** (9.83)** CASES (1000’s) -0.001 -0.002 -0.001 -0.002 -0.001 (6.12)** (7.00)** (6.07)** (3.80)** (5.37)** ISSUE YEAR 0.138 0.154 0.133 0.148 0.103 (25.13)** (25.91)** (23.90)** (20.23)** (11.12)** VINTAGE -0.119 -0.124 -0.119 -0.131 -0.089 (21.49)** (20.91)** (21.03)** (17.43)** (9.63)** Constant -34.500 -60.054 -24.696 -32.736 -25.188 (10.70)** (16.17)** (7.56)** (7.33)** (5.58)** Observations 13426 13426 13428 9376 3902 Winery, FE Yes No Yes Yes Yes Number of Wineries 1495 1495 1357 721 R-squared 0.51 0.61 0.50 0.40 0.46
Notes: All Models include Varietal and Appellation fixed effects. Absolute value of Robust t statistics in parentheses. † significant at 10%. * significant at 5%. ** significant at 1%.

31
TABLE 4— LN[PRICE] AS A FUNCTION OF CERTIFICATION AND LABELING PRACTICES, QUARTILE SUBSETS
(1) (2) (3) (4) ECO-LABEL 0.074 -0.251 -0.437 -0.133 (0.48) (2.40)* (2.91)** (0.52) CERTIFIED -0.088 0.189 0.267 0.067 (0.65) (3.14)** (5.02)** (0.91) SCORE 0.008 0.011 0.014 0.012 (4.00)** (6.79)** (9.09)** (7.32)** CASES (1000’s) -0.000 -0.003 -0.005 -0.018 (3.88)** (6.90)** (9.40)** (9.62)** ISSUE YEAR 0.069 0.141 0.129 0.111 (5.02)** (15.60)** (12.17)** (9.87)** VINTAGE -0.067 -0.128 -0.114 -0.077 (5.10)** (13.82)** (10.43)** (6.86)** Constant -0.585 -24.544 -28.171 -67.061 (0.08) (4.59)** (4.56)** (11.60)** Observations 2004 3988 3893 3541 Winery, FE Yes Yes Yes Yes Number of Wineries 369 375 375 376 R-squared 0.49 0.56 0.60 0.59
Notes: All Models include Varietal and Appellation fixed effects. Absolute value of Robust t statistics in parentheses. † significant at 10%. * significant at 5%. ** significant at 1%.
TABLE 5— LN[PRICE] AS A FUNCTION OF CERTIFICATION AND LABELING PRACTICES, RED WINE QUARTILE SUBSETS
(1) (2) (3) (4) ECO-LABEL 0.140 -0.249 -0.470 0.229 (0.50) (1.85)† (2.42)* (1.67)† CERTIFIED -0.205 0.245 0.297 0.080 (0.75) (2.90)** (4.68)** (0.81) SCORE 0.010 0.009 0.014 0.011 (3.29)** (4.72)** (7.07)** (5.85)** CASES (1000’s) -0.000 -0.003 -0.005 -0.026 (1.74)† (5.18)** (5.53)** (8.70)** ISSUE YEAR 0.075 0.158 0.153 0.120 (3.95)** (12.68)** (10.55)** (8.22)** VINTAGE -0.079 -0.144 -0.136 -0.084 (4.23)** (11.00)** (9.08)** (5.85)** Constant 9.869 -25.539 -31.184 -69.223 (0.84) (3.31)** (3.73)** (8.95)** Observations 1232 2717 2756 2671 Winery, FE Yes Yes Yes Yes Number of Wineries 292 339 358 368 R-squared 0.46 0.48 0.50 0.45
Notes: All Models include Varietal and Appellation fixed effects. Absolute value of Robust t statistics in parentheses. † significant at 10%. * significant at 5%. ** significant at 1%.
32
TABLE 6— LN[PRICE] AS A FUNCTION OF CERTIFICATION AND LABELING PRACTICES, WHITE WINE QUARTILE
SUBSETS
(1) (2) (3) (4) ECO-LABEL -0.083 0.056 -0.210 -0.236 (0.54) (0.36) (3.17)** (2.84)** CERTIFIED 0.075 -0.018 -0.004 0.159 (1.05) (0.23) (0.07) (3.82)** SCORE 0.005 0.014 0.017 0.005 (1.63) (4.79)** (5.82)** (1.77)† CASES (1000’s) -0.000 -0.003 -0.005 -0.014 (2.42)* (4.17)** (8.31)** (6.26)** ISSUE YEAR 0.037 0.108 0.085 0.071 (1.69)† (7.40)** (4.92)** (3.81)** VINTAGE -0.035 -0.098 -0.077 -0.038 (1.64)† (6.65)** (4.33)** (2.11)* Constant 0.214 -17.765 -13.672 -63.237 (0.02) (2.45)* (1.57) (7.97)** Observations 748 1241 1075 838 Winery, FE Yes Yes Yes Yes Number of Wineries 246 197 161 117 R-squared 0.44 0.60 0.58 0.53
Notes: All Models include Varietal and Appellation fixed effects. Absolute value of Robust t statistics in parentheses. † significant at 10%. * significant at 5%. ** significant at 1%.
TABLE 7—SCORE AS A FUNCTION OF CERTIFICATION
(1) (2) (3) (4) Reds (5) Whites CERTIFIED 0.759 0.097 0.945 0.693 0.980 (1.87)† (0.43) (2.40)* (1.36) (1.50) LN[PRICE] 2.032 3.369 1.799 2.609 (17.40)** (42.48)** (12.71)** (10.70)** CASES (1000’s) 0.001 0.001 -0.002 0.003 -0.001 (1.02) (1.57) (1.86)† (2.18)* (0.73) ISSUE YEAR -0.612 -0.825 -0.338 -0.762 -0.229 (9.39)** (14.30)** (5.32)** (8.83)** (2.00)* VINTAGE 0.292 0.612 0.046 0.293 0.147 (4.50)** (10.78)** (0.71) (3.37)** (1.31) Constant 719.537 502.916 671.223 1,019.628 240.324 (19.23)** (14.84)** (17.62)** (19.98)** (4.16)** Observations 13426 13426 13442 9376 3902 Winery, FE Yes No Yes Yes Yes Number of Wineries 1495 1495 1357 721 R-squared 0.10 0.25 0.07 0.10 0.12
Notes: All Models include Varietal and Appellation fixed effects. Absolute value of Robust t statistics in parentheses. † significant at 10%. * significant at 5%. ** significant at 1%.

33
TABLE 8—SCORE AS A FUNCTION OF CERTIFICATION AND LABELING PRACTICES
(1) (2) (3) (4) Reds (5) Whites ECO-LABEL 1.622 -0.644 1.234 2.068 0.288 (1.77)† (1.44) (1.37) (1.47) (0.23) CERTIFIED 0.266 0.349 0.573 0.283 0.827 (0.58) (1.18) (1.28) (0.51) (1.45) LN[PRICE] 2.036 3.368 1.802 2.609 (17.42)** (42.47)** (12.73)** (10.68)** CASES (1000’s) 0.001 0.001 -0.002 0.003 -0.001 (1.00) (1.58) (1.87)† (2.17)* (0.73) ISSUE YEAR -0.614 -0.824 -0.339 -0.764 -0.229 (9.42)** (14.28)** (5.33)** (8.85)** (2.01)* VINTAGE 0.293 0.612 0.045 0.293 0.147 (4.50)** (10.77)** (0.71) (3.37)** (1.31) Constant 722.994 502.054 673.803 1,023.040 240.941 (19.31)** (14.81)** (17.68)** (20.02)** (4.18)** Observations 13426 13426 13442 9376 3902 Winery, FE Yes No Yes Yes Yes Number of Wineries 1495 1495 1357 721 R-squared 0.10 0.25 0.07 0.10 0.12
Notes: All Models include Varietal and Appellation fixed effects. Absolute value of Robust t statistics in parentheses. † significant at 10% * significant at 5%.** significant at 1%.
FIGURE 1—PRICE AS A FUNCTION OF VINTAGE, ISSUE YEAR, AND CERTIFICATION
$-
$5
$10
$15
$20
$25
$30
$35
$40
$45
$50
$55
$60
$65
$70
$75
1999 2000 2001 2002 2003 2004 2005 2006
Issue Year
No
min
al
Pri
ce
vint1998 vint1999 vint2000 vint2001 vint2002 vint2003
vint1998 c vint1999 c vint2000 c vint2001 c vint2002 c vint2003 c

34