View Online / Journal Homepage / Table of Contents for ... Lab Chip - Capture Release.pdf · Umut...
15
Controlled viable release of selectively captured label-free cells in microchannels† Umut Atakan Gurkan, a Tarini Anand, a Huseyin Tas, a David Elkan, a Altug Akay, a Hasan Onur Keles a and Utkan Demirci * ab Received 3rd June 2011, Accepted 5th September 2011 DOI: 10.1039/c1lc20487d Selective capture of cells from bodily fluids in microchannels has broadly transformed medicine enabling circulating tumor cell isolation, rapid CD4 + cell counting for HIV monitoring, and diagnosis of infectious diseases. Although cell capture methods have been demonstrated in microfluidic systems, the release of captured cells remains a significant challenge. Viable retrieval of captured label-free cells in microchannels will enable a new era in biological sciences by allowing cultivation and post- processing. The significant challenge in release comes from the fact that the cells adhere strongly to the microchannel surface, especially when immuno-based immobilization methods are used. Even though fluid shear and enzymes have been used to detach captured cells in microchannels, these methods are known to harm cells and affect cellular characteristics. This paper describes a new technology to release the selectively captured label-free cells in microchannels without the use of fluid shear or enzymes. We have successfully released the captured CD4 + cells (3.6% of the mononuclear blood cells) from blood in microfluidic channels with high specificity (89% 8%), viability (94% 4%), and release efficiency (59% 4%). We have further validated our system by specifically capturing and controllably releasing the CD34 + stem cells from whole blood, which were quantified to be 19 cells per million blood cells in the blood samples used in this study. Our results also indicated that both CD4 + and CD34 + cells released from the microchannels were healthy and amenable for in vitro culture. Manual flow based microfluidic method utilizes inexpensive, easy to fabricate microchannels allowing selective label-free cell capture and release in less than 10 minutes, which can also be used at the point-of-care. The presented technology can be used to isolate and purify a broad spectrum of cells from mixed populations offering widespread applications in applied biological sciences, such as tissue engineering, regenerative medicine, rare cell and stem cell isolation, proteomic/genomic research, and clonal/ population analyses. Introduction Capture, isolation and purification of specific cells from hetero- geneous populations has enabled advancements in a broad variety of scientific fields including cell based diagnostics in microfluidic systems, 1–5,45 cell specific genomic/proteomic anal- ysis, 6–8,46 clonal and population studies, 9,10 stem cell purification for regenerative therapies, 11,12 and circulating tumor cell capture for cancer research. 6,13 For instance, isolation of CD4 + cells from blood has been widely used for HIV monitoring, 1,2,14,15,47 for biological studies and pharmaceutical research. 16–18 On the other hand, isolation of stem cells (e.g., CD34 + endothelial progenitor cells) from peripheral blood, cord blood, and bone marrow has found applications in regenerative medicine and tissue engi- neering. 19–22 Fluorescence-activated and magnetic-activated cell sorting are commonly used methods for cell isolation, which require extensive preliminary sample processing and tagging of the cells with fluorophores or magnetic particles conjugated with antibodies. While these methods are powerful and sort cells from heterogeneous mixtures, the cost, complexity and the require- ments for infrastructure (e.g., facility, technical personnel, and reagents) limit their use at the point-of-care (POC). 1,16 There have been attempts to miniaturize these systems to simpler microfluidic platforms. 23,24 However, the peripheral equipment required for detection and sorting using microfluidics remain bulky and costly. On the other hand, microfluidic systems have traditionally required thousands of cells for post-capture genomic and proteomic analysis (e.g., circulating tumor cell and a Demirci Bio-Acoustic-MEMS in Medicine (BAMM) Laboratory, Center for Biomedical Engineering, Department of Medicine, Brigham and Women’s Hospital, Harvard Medical School, 65 Landsdowne St PRB Rm. 267, Boston, MA, USA. E-mail: [email protected]; Tel: +1 650-906-9227 b Harvard-MIT Health Sciences and Technology, Cambridge, MA, USA † Electronic supplementary information (ESI) available: See DOI: 10.1039/c1lc20487d This journal is ª The Royal Society of Chemistry 2011 Lab Chip, 2011, 11, 3979–3989 | 3979 Dynamic Article Links C < Lab on a Chip Cite this: Lab Chip, 2011, 11, 3979 www.rsc.org/loc PAPER Downloaded by Harvard University on 05 December 2011 Published on 14 October 2011 on http://pubs.rsc.org | doi:10.1039/C1LC20487D View Online / Journal Homepage / Table of Contents for this issue
Transcript of View Online / Journal Homepage / Table of Contents for ... Lab Chip - Capture Release.pdf · Umut...

Dynamic Article LinksC<Lab on a Chip
Cite this: Lab Chip, 2011, 11, 3979
www.rsc.org/loc PAPER
Dow
nloa
ded
by H
arva
rd U
nive
rsity
on
05 D
ecem
ber
2011
Publ
ishe
d on
14
Oct
ober
201
1 on
http
://pu
bs.r
sc.o
rg |
doi:1
0.10
39/C
1LC
2048
7DView Online / Journal Homepage / Table of Contents for this issue
Controlled viable release of selectively captured label-free cells inmicrochannels†
Umut Atakan Gurkan,a Tarini Anand,a Huseyin Tas,a David Elkan,a Altug Akay,a Hasan Onur Kelesa
and Utkan Demirci*ab
Received 3rd June 2011, Accepted 5th September 2011
DOI: 10.1039/c1lc20487d
Selective capture of cells from bodily fluids in microchannels has broadly transformed medicine
enabling circulating tumor cell isolation, rapid CD4+ cell counting for HIV monitoring, and diagnosis
of infectious diseases. Although cell capture methods have been demonstrated in microfluidic systems,
the release of captured cells remains a significant challenge. Viable retrieval of captured label-free cells
in microchannels will enable a new era in biological sciences by allowing cultivation and post-
processing. The significant challenge in release comes from the fact that the cells adhere strongly to the
microchannel surface, especially when immuno-based immobilization methods are used. Even though
fluid shear and enzymes have been used to detach captured cells in microchannels, these methods are
known to harm cells and affect cellular characteristics. This paper describes a new technology to release
the selectively captured label-free cells in microchannels without the use of fluid shear or enzymes. We
have successfully released the captured CD4+ cells (3.6% of the mononuclear blood cells) from blood in
microfluidic channels with high specificity (89% � 8%), viability (94% � 4%), and release efficiency
(59% � 4%). We have further validated our system by specifically capturing and controllably releasing
the CD34+ stem cells from whole blood, which were quantified to be 19 cells per million blood cells in
the blood samples used in this study. Our results also indicated that both CD4+ and CD34+ cells
released from the microchannels were healthy and amenable for in vitro culture. Manual flow based
microfluidic method utilizes inexpensive, easy to fabricate microchannels allowing selective label-free
cell capture and release in less than 10 minutes, which can also be used at the point-of-care. The
presented technology can be used to isolate and purify a broad spectrum of cells from mixed
populations offering widespread applications in applied biological sciences, such as tissue engineering,
regenerative medicine, rare cell and stem cell isolation, proteomic/genomic research, and clonal/
population analyses.
Introduction
Capture, isolation and purification of specific cells from hetero-
geneous populations has enabled advancements in a broad
variety of scientific fields including cell based diagnostics in
microfluidic systems,1–5,45 cell specific genomic/proteomic anal-
ysis,6–8,46 clonal and population studies,9,10 stem cell purification
for regenerative therapies,11,12 and circulating tumor cell capture
for cancer research.6,13 For instance, isolation of CD4+ cells from
blood has been widely used for HIV monitoring,1,2,14,15,47 for
aDemirci Bio-Acoustic-MEMS in Medicine (BAMM) Laboratory, Centerfor Biomedical Engineering, Department of Medicine, Brigham andWomen’s Hospital, Harvard Medical School, 65 Landsdowne St PRBRm. 267, Boston, MA, USA. E-mail: [email protected];Tel: +1 650-906-9227bHarvard-MIT Health Sciences and Technology, Cambridge, MA, USA
† Electronic supplementary information (ESI) available: See DOI:10.1039/c1lc20487d
This journal is ª The Royal Society of Chemistry 2011
biological studies and pharmaceutical research.16–18 On the other
hand, isolation of stem cells (e.g., CD34+ endothelial progenitor
cells) from peripheral blood, cord blood, and bone marrow has
found applications in regenerative medicine and tissue engi-
neering.19–22 Fluorescence-activated and magnetic-activated cell
sorting are commonly used methods for cell isolation, which
require extensive preliminary sample processing and tagging of
the cells with fluorophores or magnetic particles conjugated with
antibodies. While these methods are powerful and sort cells from
heterogeneous mixtures, the cost, complexity and the require-
ments for infrastructure (e.g., facility, technical personnel, and
reagents) limit their use at the point-of-care (POC).1,16 There
have been attempts to miniaturize these systems to simpler
microfluidic platforms.23,24 However, the peripheral equipment
required for detection and sorting using microfluidics remain
bulky and costly. On the other hand, microfluidic systems have
traditionally required thousands of cells for post-capture
genomic and proteomic analysis (e.g., circulating tumor cell and
Lab Chip, 2011, 11, 3979–3989 | 3979

Dow
nloa
ded
by H
arva
rd U
nive
rsity
on
05 D
ecem
ber
2011
Publ
ishe
d on
14
Oct
ober
201
1 on
http
://pu
bs.r
sc.o
rg |
doi:1
0.10
39/C
1LC
2048
7D
View Online
neutrophil analysis).6,7,25 Genomic studies on captured cells in
microfluidic systems are mainly hampered by the loss of genomic
material in the channels due to the large surface to volume ratio.
Retrieval and downstream processing of captured live cells can
eliminate this limitation. Moreover, the release of selectively
captured live cells is significantly needed for extensive post-pro-
cessing capabilities and cultivation, and for clonal and pop-
ulation studies within the isolated cells.
Effectively releasing the selectively immuno-captured cells in
microfluidic channels without compromising the viability and
phenotypic characteristics of the cells remains a challenge.26–28
Chemical and physical means for cell detachment, such as
enzymatic and fluid shear based methods are known to adversely
affect cell viability and function.29,30 To minimize these effects,
captured cells need to be released and recovered without using
harsh chemical or physical mechanisms. Alginate based hydro-
gels have recently been used in combination with conjugated
antibodies to isolate endothelial progenitor cells from blood in
microchannels, in which the cells were released by chemically
chelating the hydrogel that coats the channels.31 However, algi-
nate based hydrogels allow a high level of non-specific
binding28,32 and offer a limited number of sites for conjugating
antibodies,31 which significantly reduce the capture specificity
and efficiency. Furthermore, coating and chemical chelation of
hydrogels in microfluidic channels add extra steps, lengthy pro-
cessing time (e.g., 2+ days for gel preparation and channel
coating), operational complexities (e.g. use of microfluidic
pumps), and additional chemical reagents that render this
approach costly and challenging to apply especially at the POC
including bedside or the primary healthcare delivery settings.
Temperature responsive polymer (poly(N-iso-
propylacrylamide), PNIPAAm) interacts strongly with proteins
(e.g., insulin chain A, serum albumin) above the lower critical
solution temperature (LCST).33,34 Whereas, when the tempera-
ture of the polymer is reduced below the LCST, a complete
desorption of the adsorbed proteins is possible.33,34 Even though
responsive polymers have been used to release attached cells
from surfaces without the use of fluid shear or enzymes,35–37 these
studies relied on non-specific attachment of adherent cells (e.g.,
fibroblasts). There are three unaddressed challenges for temper-
ature responsive polymers to be applicable in selective cell
isolation. The first challenge is that the cells need to be selectively
captured on the polymer, which requires immobilization of
specific antibodies on the polymer. The second challenge is
merging these polymers with microfluidic systems to process
large volumes of heterogonous cell suspensions, such as bodily
fluids and whole blood. The third challenge is releasing the
captured cells from microfluidic channels. The challenge in
release emerges from the fact that the cells tend to adhere
strongly to the surface when they are immobilized via antibody–
antigen interactions. Enzymatic and fluid shear based methods
prove to be inefficient in detaching cells when immuno-based
immobilization is used. Since the challenges listed have not been
addressed so far, thermoresponsive microfluidic technology has
not been available for selective cell isolation, purification, and
diagnostics/monitoring applications with potential impact on
clinical practice and outcome. Here, we introduce a new
approach to rapidly release the selectively captured cells label-
free in microchannels with high specificity and post-release
3980 | Lab Chip, 2011, 11, 3979–3989
viability by using simple manual pipettors and short processing
times.
Materials and methods
We developed a biotin binding protein (Neutravidin) and bio-
tinylated antibody based surface chemistry on PNIPAAm
microfluidic channels (Fig. 1). In this approach: first, Neu-
travidin followed by biotinylated antibody (human Anti-CD4 or
human Anti-CD34) were immobilized in microfluidic channels at
37 �C (Fig. 1C). Next, the heterogeneous cell suspension (i.e.,
blood) was flown through the channels without any preliminary
processing (Fig. 1D). During this step, the CD4+ cells or the
CD34+ cells were captured on the channel surface with antibody–
antigen interaction as we have shown before.38 Then, the non-
captured cells in the channels were rinsed away with buffer
solution at 37 �C (Fig. 1E). Rapid heating (37 �C) and cooling
(<32 �C) of the microchannels was achieved by the small liquid
volume (10 mL) in the channels. The Neutravidin–antibody
complex together with the captured cells was then released from
the surface by a reduction in temperature (Fig. 1F). The
temperature of the microfluidic channels was controlled with
a heating pad and monitored using a liquid crystal dye in
a channel, working in the 32 �C to 40 �C range (sensitivity: 1 �C)(Fig. 1B). The temperature level and distribution in the ther-
moresponsive release channels were observed to be uniform
throughout the experiments.
Quantification of CD4+ and CD34+ cells in blood samples
The CD4+ and CD34+ cells in the blood samples were quantified
by using the standard flow cytometry methods.15 For flow
cytometry analysis, 100 mL of buffy coat or whole blood was
lysed with 1� fluorescence activated cell sorting (FACS) lysing
solution diluted with deionized water (MilliQ Academic, Bill-
erica, MA) from 10� BD FACS Lysing Solution (BD Biosci-
ences, San Jose, CA). The sample was vortexed gently and
incubated for 10 minutes at room temperature. Next, the sample
was centrifuged at 2000 rpm for 5 minutes which was followed by
discarding the supernatant. Cell debris were washed away with
2.5 mL of phosophate buffered saline (PBS), followed by
a second centrifugation. Next, cells were suspended in 1 mL of
PBS. 1938 mL of FACSFlow Sheath Fluid (BD Biosciences,
Franklin Lakes, NJ) and 10 mL of cell solution prepared as
a result of lysis step was mixed in a new FACS tube and even-
tually 12 mL of Alexa Fluor 488 anti-human CD34 antibody
(Biolegend, San Diego, CA) or anti-human CD4 Alexa Fluor�488 (eBioscience Inc., San Diego, CA) was added before 30
minutes of dark incubation at room temperature. With the
addition of 50 mL of counting beads (BD Biosciences, San Jose,
CA), cell solution was prepared for flow cytometry analysis,
during which calibration beads (BD Biosciences, San Jose, CA)
were used. The software used during FACS measurements was
CellQuestPro (BD Biosciences). The results of these analyses are
reported in Table 1.
Design and fabrication of microfluidic channels
We have optimized our microfluidic channel design to accom-
modate manual pipetting (Fig. 1A) and to result in optimum flow
This journal is ª The Royal Society of Chemistry 2011

Fig. 1 Thermoresponsive microfluidic chip developed for releasing selectively captured cells from blood. (A) The microfluidic chip was composed of
three parallel channels (4 mm � 22 mm � 80 mm), one of which (middle channel) was used as the temperature indicator channel. Blood was introduced
into the top and bottom release channels with a manual pipette. The tubing connected to the outlet ports allowed the collection of the released cells in
microcentrifuge tubes. (B) The middle channel was coated with temperature sensitive liquid crystal dye, which was responsive between 35 �C (red-
orange) and 40 �C (blue-purple). At the target temperature of 37 �C, the middle channel displayed green color. (C) Schematic drawing of the working
principle of label-free selective capture from whole blood and controlled release of cells in thermoresponsive microfluidic channels. Biotin binding
protein (Neutravidin) and biotinylated antibody (Anti-CD4 or Anti-CD34) were immobilized on the PNIPAAm channel surface at 37 �C. (D) Pre-
warmed blood sample (at 37 �C) was injected into the microfluidic channel, and the CD4+ cells or the CD34+ cells in blood were captured on the channel
surface. (E) The non-captured cells in the channels were rinsed off and the red blood cells were lysed. (F) The microchip was then cooled down below
32 �C (in less than 5 minutes). The released cells were rinsed out of the channels and collected at the channel outlet.
Dow
nloa
ded
by H
arva
rd U
nive
rsity
on
05 D
ecem
ber
2011
Publ
ishe
d on
14
Oct
ober
201
1 on
http
://pu
bs.r
sc.o
rg |
doi:1
0.10
39/C
1LC
2048
7D
View Online
rates and shear stresses in the microchannels for the capture of
cells from blood. Briefly, in each microfluidic chip, three channels
(dimensions: 25 mm � 4 mm � 80 mm) were employed with
either PNIPAAm layered polystyrene bottom surface (release
channels) or polystyrene (control channels) bottom surface
(Fig. S1 and S2†). To minimize the peripheral equipment needed
to operate the microfluidic chips, we eliminated the need for
syringes and pumps. We performed 40 manual pipetting exper-
iments (0.5–10 mL manual pipettors with 0.1–10 mL pipette tips,
VWR International, Batavia, IL) with microfluidic channels to
estimate the resulting flow rates in channels for PBS and blood.
Using the flow rates obtained from the experiment, the resulting
shear stress on the channel surface was determined by employing
This journal is ª The Royal Society of Chemistry 2011
the Navier–Stoke’s equation for incompressible fluids and
infinite parallel flow. Eqn (1) was derived to evaluate the shear
stress in the microchannels as described before.38
s ¼ 6mQ
WH2(1)
where the shear stress (s) varies with the width (W) and height
(H) of the channels, as well as the volumetric flow rate (Q), and
the dynamic viscosity (m) of the fluid. The channel dimensions
(width and height) were optimized iteratively until the measured
flow rates and the resulting estimated shear stress levels fell
within the optimal range for the capture of CD4+ T-lymphocytes
in microfluidic channels (Fig. 5B and C).15,38 The middle channel
Lab Chip, 2011, 11, 3979–3989 | 3981

Table 1 Typical CD4+ and CD34+ cell counts in the blood samples usedin this study quantified by flow cytometrya
Cell count permicrolitre (flowcytometry)
Percentage ofmononuclearblood cells
Per million (106)blood cells(WBCs + RBCs)
CD4+ cells 931 3.6% 195CD34+ cells 92 0.5% 19
a (Cytometry): the number of white blood cells (WBCs) in adults: 3.3 �8.7 � 103 mL�1 (average: 6 � 103 mL�1); the number of red blood cells(RBCs) in adults: 3.93 � 5.6 � 106 mL�1 (average: 4.7 � 106 mL�1).(Source for the number of blood cells in adults: National Institutes ofHealth Clinical Center.)
Dow
nloa
ded
by H
arva
rd U
nive
rsity
on
05 D
ecem
ber
2011
Publ
ishe
d on
14
Oct
ober
201
1 on
http
://pu
bs.r
sc.o
rg |
doi:1
0.10
39/C
1LC
2048
7D
View Online
was stained with temperature sensitive liquid crystal dye to
monitor the channel temperature throughout the experiment
(Fig. 1B). To keep the fabrication costs low, microfluidic chips
were made of inexpensive plastic components and adhesives with
methods that would allow high fabrication yield (ESI†).
Functionalization of microchannels for selective label-free CD4+
and CD34+ cell capture
All components were kept at 37 �C throughout the experiment.
The microchips were placed on a temperature controlled heating
pad (Omega Engineering Inc, Stamford, CT) to maintain the
hydrophobic state of the polymer. The channels were washed
with Phosphate Buffered Saline (PBS, Mediatech, Herndon,
VA). Next, biotin binding protein NeutrAvidin (Thermo Fisher
Scientific Inc., Rockford, IL) was immobilized on the surface by
incubating 100 mg mL�1 NeutrAvidin solution in PBS for 1 hour.
The surface was then passivated with 1% Albumin from Bovine
Serum (BSA) solution (Sigma-Aldrich Co., St Louis, MO) in
PBS. Monoclonal biotinylated human anti-CD4 antibody
(Beckman Coulter Inc., Brea, CA) was immobilized with two
successive half hour incubations of 22 mg mL�1 solutions in PBS.
Similarly, biotinylated anti-human CD34 antibody (BioLegend
Inc., San Diego, CA) was immobilized in microchannels. After
each incubation period, the channels were rinsed with PBS.
Selective CD4+ cell capture from human blood in microchannels
Following the completion of surface chemistry, blood was
introduced into the channels. Discarded buffy coat samples from
healthy patients were obtained from Blood Transfusion Services
at Massachusetts General Hospital, Boston, MA under the
approval of the Institutional Review Board. To minimize the
effects of CD4+ cell number variations in the blood samples, we
performed cell count on each buffy coat sample and normalized
the number of white blood cells to the normal range observed in
humans (Table 1). White blood cell concentrations were quan-
tified using a hematology system (Drew-3, Drew Scientific
Group, Dallas, TX) for each buffy coat sample obtained. Next,
the serum was extracted from the buffy coat by centrifuging 5 mL
of buffy coat at 2000 rpm for 12 minutes. Then, the buffy coat
samples were diluted with the serum38 to obtain a white blood cell
concentration within the normal range in humans (Table 1). It
should be noted that these process steps are not required if whole
blood samples from healthy patients are available, in which case
a direct application of the whole blood into the microchannels
3982 | Lab Chip, 2011, 11, 3979–3989
would be possible as described below for our CD34+ capture
experiments. For CD4+ capture, 20 mL of the blood sample
(buffy coat) at 37 �C was introduced into the microchannels with
a manual pipette (Fig. 1A). Immediately after sample injection,
a 100 mLmL�1 FACS Lysing solution (BD Biosciences, San Jose,
CA) in HyPure Cell Culture Grade Water (HyClone Laborato-
ries Inc., Logan, UT) was introduced into the channels and
incubated for 5 minutes to remove the remaining erythrocytes
from the channels, followed by a PBS wash.
Selective CD34+ cell capture from human whole blood in
microchannels
Discarded deidentified whole blood samples were obtained from
Brigham and Women’s Hospital (Boston, MA), under the
approval of the Institutional Review Board. Cell concentrations
in whole blood were verified using a hematology system (Drew-3,
Drew Scientific Group, Dallas, TX) to ensure that the levels are
within the normal range per mL of blood (Table 1).39 For
capturing the CD34+ cells, 100 mL of the whole blood was
introduced into the microchannels, during which temperature
was maintained at 37 �C. Immediately after sample injection,
a 100 mg mL�1 FACS Lysing solution (BD Biosciences, San Jose,
CA) in HyPure Cell Culture Grade Water (HyClone Laborato-
ries Inc., Logan, UT) was introduced into the channels and
incubated for 5 minutes to lyse and remove the erythrocytes from
the channels, followed by a PBS wash.
Controlled release of captured CD4+ and CD34+ cells in channels
To release the captured cells, microchannels were removed from
the heating pads and cooled down at room temperature for 5
minutes. Released cells were then rinsed out with PBS (or the
culture medium of interest) and collected in 1.5 mL micro-
centrifuge tubes through tubing connected to the outlet port
(Fig. 1A). After the release step, channels were assessed with
a microscope to confirm and quantify the cell release. Release
efficiency of captured cells was quantified by determining the
ratio of the released cells to the remaining cells in channels. We
have assessed the effect of flow rate (in the range of 50–500 mL
min�1) in channels on release efficiency by using a programmable
syringe pump.
Analysis of capture specificity in microchannels
The capture specificity of the channels can be defined as the total
number of cells stained with anti-CD4 or anti-CD34 antibody-
fluorophore, divided by the total number of cells counted in
bright field images (Fig. 3A–D and 7A and B). Captured cells on
a separate group of channels (n ¼ 4 per group) were stained with
anti-human CD4 antibody conjugated with Alexa Fluor� 488
(eBioscience Inc., San Diego, CA) or anti-human CD34 antibody
conjugated with Alexa Fluor 488(Biolegend, San Diego, CA) to
assess capture specificity. The channels were imaged at 10 pre-
determined fixed locations to quantify captured cells in bright
field and in fluorescent modes. Then, fluorescent cell counts were
divided by the bright field cell counts to determine capture
specificity.
This journal is ª The Royal Society of Chemistry 2011

Dow
nloa
ded
by H
arva
rd U
nive
rsity
on
05 D
ecem
ber
2011
Publ
ishe
d on
14
Oct
ober
201
1 on
http
://pu
bs.r
sc.o
rg |
doi:1
0.10
39/C
1LC
2048
7D
View Online
Post-release viability assessment and cultivation of CD4+ and
CD34+ cells
To evaluate the post-release viability, CD4+ cells were collected
and assessed by a dye exclusion viability method. The released
cells were stained with trypan blue (Sigma Aldrich, St Louis,
MO) and counted in a hemocytometer. The live and dead cell
numbers were recorded and the counts were repeated 5 times to
obtain an average. On the other hand, the released CD34+ cells
were assessed for viability by using live/dead cell assay (Invi-
trogen, Carlsbad, CA). The released and collected CD4+ and
CD34+ cells were cultured in RPMI 1640 media (Invitrogen,
Carlsbad, CA) supplemented with 10% fetal bovine serum
(Invitrogen, Carlsbad, CA), and 100 UI mL�1 Penicillin-strep-
tomycin. CD4+ cell medium was supplemented with phytohe-
magglutinin (PHA) (Thermo Fisher Scientific, Waltham, MA) to
facilitate cellular mitosis.40 The CD4+ cells were cultured for 8
days at 37 �C and 5% CO2 incubator. During the cultivation
period, cell morphologies and numbers were assessed with
microscopy. Cell densities in culture per millimetre square were
quantified to analyze the proliferation potential of CD4+ cells.
Microfluidic channel visualization and image processing
A Carl Zeiss Observer D1 Model Axio Inverted Microscope with
the AxioVision LE (from Carl Zeiss) software was used to obtain
microscopic images in this study. Carl Zeiss Plan-Apochromat
(10�/0.45 ph1) objective lens was utilized for bright field and
fluorescent imaging of microchannels. Ten images were taken per
channel at predetermined fixed locations marked during micro-
fluidic chip fabrication,which ensured consistencyof thepositionof
images before and after the cell release. ImageJ software (National
Institutes ofHealth)was utilized to semi-automatically quantify the
number of cells in each image using the Cell-Counter plug-in.
Statistical analysis
Data obtained in this study were reported as mean � standard
error of the mean. The collected data were tested for normal
distribution with Anderson–Darling normality test. Parametric
2-sample t-test (release efficiency, n ¼ 6 channels in each group
with an average of 10 images per channel) and paired t-test (cell
capture specificity, n ¼ 4 channels in each group with an average
of 10 images per channel) were used for statistical analysis. The
effect of flow rate on release efficiency was assessed using analysis
of variance (ANOVA) with Tukey’s post hoc comparison (n ¼ 4
channels per flow rate). CD4+ cell proliferation was also analyzed
using ANOVA with Tukey’s post hoc comparisons. Statistical
significance was set at 95% confidence level for all tests (p < 0.05).
The experiments were repeated at least four times with different
blood samples to validate repeatability and reproducibility.
Error bars in the figures represent the standard error of the mean.
Results
We showed that the protein adsorption/desorption mechanism
on temperature-responsive polymer (PNIPAAm)34 can be
adapted to develop a biotin-binding protein and biotinylated
antibody based surface chemistry to release the selectively
captured label-free CD4+ and CD34+ cells from blood with high
This journal is ª The Royal Society of Chemistry 2011
viability and specificity. With this new approach, selective
capture, controlled release and viable retrieval of cells can be
achieved in less than 10 minutes with simple manual pipetting in
a standard laboratory setting (Fig. 1).
CD4+ and CD34+ cell counts in blood samples
Quantification of cell numbers in the buffy coat samples indi-
cated that 3.6% of the mononuclear cells were CD4+ cells, which
accounted for 195 cells per million blood cells (including the red
blood cells) (Table 1). CD34+ cell capture was performed using
whole blood samples. The number of CD34+ cells in the whole
blood samples was measured to be 0.5% of the mononuclear
cells, which accounted for 19 cells per million blood cells
(including the red blood cells) (Table 1).
Release efficiency of the captured cells in microchannels
The microchannels were rendered chemically active by function-
alization with anti-CD4 or anti-CD34 antibodies. We analyzed
the release efficiency of captured CD4+ cells in thermoresponsive
release channels in comparison to control channels (standard cell
culture grade polystyrene) (Fig. 2A–D). A significant number of
cells were released in release channels (paired t-test, p < 0.05)
(Fig. 2E), while there was no statistically significant difference
between the number of captured and unreleased cells in control
channels (paired t-test, p>0.05).Weobserved the release efficiency
to be 59% (�4%) in release channels, while the release efficiency
was less than 2% in the control channels (Fig. 2F). The difference
between the cell release efficiencies of control and release channels
was statistically significant (t-test, p < 0.05).
Specificity of selective cell capture in microchannels
Selective cell capture specificity was analyzed by quantifying all
the captured cells (Fig. 3A and C) and the number of CD4 flu-
orophore conjugated antibody labeled captured cells (Fig. 3B
and D) in both control and release channels. For CD4+ cell
capture, control channels displayed a capture specificity of 83%
(�2.5%), while the thermoresponsive release channels displayed
a significantly greater (t-test, p < 0.05), 91% (�1.3%) capture
specificity (Fig. 3E and F).
Cell capture and release distribution along the microchannels
Cell capture and release distribution along the channels were
analyzed by imaging five predetermined locations in the
channels. A higher density of captured cells was observed close
to the channel inlets, which decreased towards the outlet
(Fig. 4). When the channel temperature was reduced, less than
2% of the cells were released along the control channels
(Fig. 4A). On the other hand, a significant release of captured
cells was observed (59%) with a distribution along the release
channels (Fig. 4B).
Effect of flow rate on release efficiency and optimized fluid shear
rates in channels
Flow rates used in this study (50–500 mL min�1) did not have
a major effect (p>0.05) on the release efficiency of captured
Lab Chip, 2011, 11, 3979–3989 | 3983
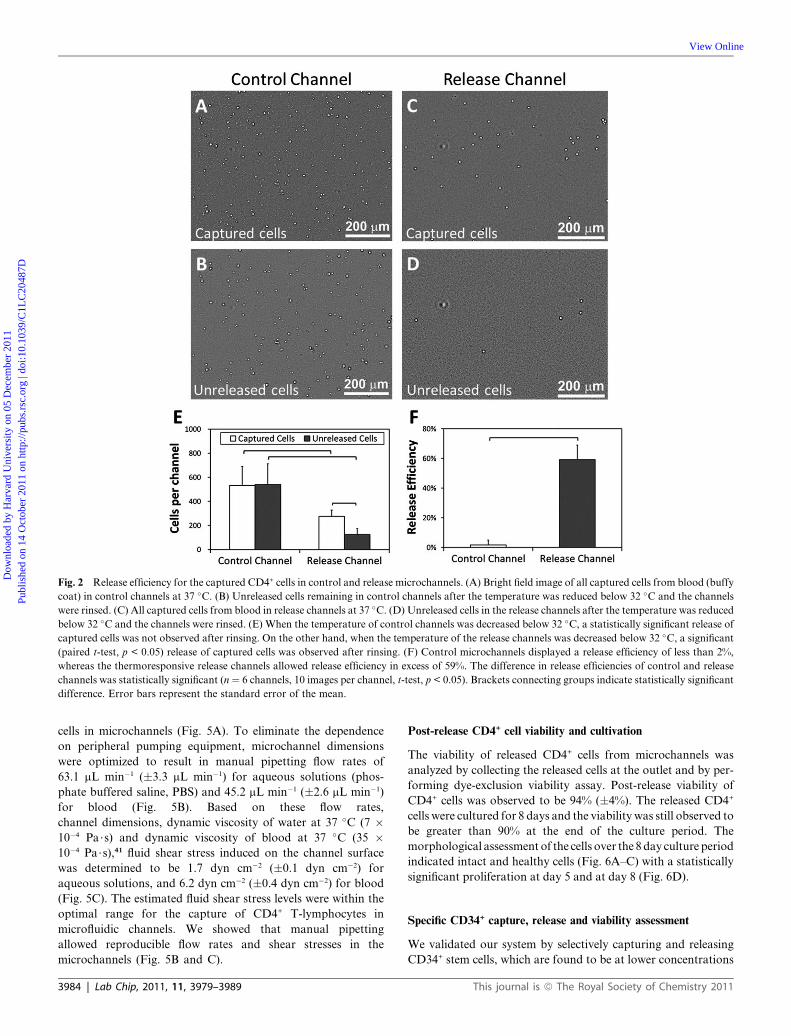
Fig. 2 Release efficiency for the captured CD4+ cells in control and release microchannels. (A) Bright field image of all captured cells from blood (buffy
coat) in control channels at 37 �C. (B) Unreleased cells remaining in control channels after the temperature was reduced below 32 �C and the channels
were rinsed. (C) All captured cells from blood in release channels at 37 �C. (D) Unreleased cells in the release channels after the temperature was reduced
below 32 �C and the channels were rinsed. (E) When the temperature of control channels was decreased below 32 �C, a statistically significant release ofcaptured cells was not observed after rinsing. On the other hand, when the temperature of the release channels was decreased below 32 �C, a significant(paired t-test, p < 0.05) release of captured cells was observed after rinsing. (F) Control microchannels displayed a release efficiency of less than 2%,
whereas the thermoresponsive release channels allowed release efficiency in excess of 59%. The difference in release efficiencies of control and release
channels was statistically significant (n¼ 6 channels, 10 images per channel, t-test, p < 0.05). Brackets connecting groups indicate statistically significant
difference. Error bars represent the standard error of the mean.
Dow
nloa
ded
by H
arva
rd U
nive
rsity
on
05 D
ecem
ber
2011
Publ
ishe
d on
14
Oct
ober
201
1 on
http
://pu
bs.r
sc.o
rg |
doi:1
0.10
39/C
1LC
2048
7D
View Online
cells in microchannels (Fig. 5A). To eliminate the dependence
on peripheral pumping equipment, microchannel dimensions
were optimized to result in manual pipetting flow rates of
63.1 mL min�1 (�3.3 mL min�1) for aqueous solutions (phos-
phate buffered saline, PBS) and 45.2 mL min�1 (�2.6 mL min�1)
for blood (Fig. 5B). Based on these flow rates,
channel dimensions, dynamic viscosity of water at 37 �C (7 �10�4 Pa$s) and dynamic viscosity of blood at 37 �C (35 �10�4 Pa$s),41 fluid shear stress induced on the channel surface
was determined to be 1.7 dyn cm�2 (�0.1 dyn cm�2) for
aqueous solutions, and 6.2 dyn cm�2 (�0.4 dyn cm�2) for blood
(Fig. 5C). The estimated fluid shear stress levels were within the
optimal range for the capture of CD4+ T-lymphocytes in
microfluidic channels. We showed that manual pipetting
allowed reproducible flow rates and shear stresses in the
microchannels (Fig. 5B and C).
3984 | Lab Chip, 2011, 11, 3979–3989
Post-release CD4+ cell viability and cultivation
The viability of released CD4+ cells from microchannels was
analyzed by collecting the released cells at the outlet and by per-
forming dye-exclusion viability assay. Post-release viability of
CD4+ cells was observed to be 94% (�4%). The released CD4+
cells were cultured for 8 days and the viability was still observed to
be greater than 90% at the end of the culture period. The
morphological assessment of the cells over the 8day culture period
indicated intact and healthy cells (Fig. 6A–C) with a statistically
significant proliferation at day 5 and at day 8 (Fig. 6D).
Specific CD34+ capture, release and viability assessment
We validated our system by selectively capturing and releasing
CD34+ stem cells, which are found to be at lower concentrations
This journal is ª The Royal Society of Chemistry 2011

Fig. 3 CD4+ cell capture specificity for control and release microchannels. (A) Bright field image of all the captured cells from blood (buffy coat) in
control channels. (B) CD4 antibody stained cells in control channels. (C) All the captured cells in release channels. (D) CD4 antibody stained cells in
release channels. (E) Specificity of captured cells at 37 �C was 83% (mean � 2.5%) for control, and 91% (mean � 1.3%) for thermoresponsive release
channels. The brackets indicate statistically significant difference (n ¼ 4 channels, 10 images per channel, t-test, p < 0.05). Error bars represent the
standard error of the mean.
Dow
nloa
ded
by H
arva
rd U
nive
rsity
on
05 D
ecem
ber
2011
Publ
ishe
d on
14
Oct
ober
201
1 on
http
://pu
bs.r
sc.o
rg |
doi:1
0.10
39/C
1LC
2048
7D
View Online
in peripheral blood compared to CD4+ cells (Table 1). CD34+
cells were selectively captured from whole blood samples, and
released to result in isolated cells with high viability and culti-
vation potential. Capture specificity of the CD34+ cells was
observed to be more than 90% (Fig. 7A and B), which was
comparable to the specificity observed for CD4+ cells in the
system (Fig. 3). The released CD34+ cells were viable (viability
more than 90%, Fig. 7C and D) and displayed intact and healthy
morphology after a day in culture (Fig. 7E).
Discussion
We have shown that specific antibodies can be immobilized in
thermoresponsive microfluidic channels to selectively immobilize
cells from blood with antibody–antigen interaction followed by
controlled release and retrieval with high release efficiency,
specificity and viability. To design thermoresponsive microfluidic
channels that can effectively release selectively captured cells, it is
This journal is ª The Royal Society of Chemistry 2011
important to understand the working principle of temperature
responsive polymers and their interaction with proteins at
different states. Temperature dependent interaction between the
polymer and proteins is due to the changes in local environment
around the hydrophobic isopropyl domains in the polymer.
Below the LCST (<32 �C), the polymer becomes hydrophilic and
swells in water42 at which point, the hydrophilic amide and
carboxyl groups in the polymer form hydrogen bonds with water
molecules, reducing the interaction with proteins. At and above
the LCST (>32 �C), the polymer becomes hydrophobic and
insoluble in water,34,42 where the hydrophobic isopropyl group in
the polymer causes phase separation from the aqueous envi-
ronment and therefore breakage of hydrogen bonds. In this case,
the polymer becomes hydrophobic and associates less with the
surrounding water and interacts more with the proteins in solu-
tion. Since the polymer has high affinity for adherence of
proteins at 37 �C,34 Neutravidin (or other biotin binding
proteins) can be immobilized on the polymer followed by
Lab Chip, 2011, 11, 3979–3989 | 3985
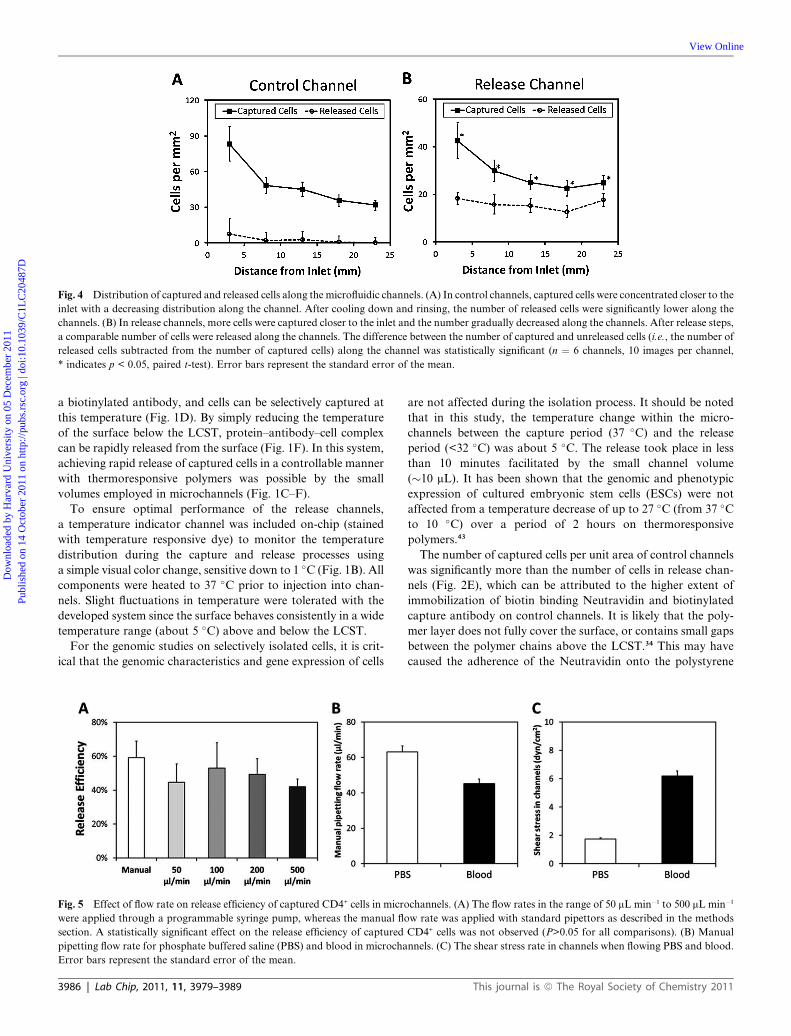
Fig. 4 Distribution of captured and released cells along the microfluidic channels. (A) In control channels, captured cells were concentrated closer to the
inlet with a decreasing distribution along the channel. After cooling down and rinsing, the number of released cells were significantly lower along the
channels. (B) In release channels, more cells were captured closer to the inlet and the number gradually decreased along the channels. After release steps,
a comparable number of cells were released along the channels. The difference between the number of captured and unreleased cells (i.e., the number of
released cells subtracted from the number of captured cells) along the channel was statistically significant (n ¼ 6 channels, 10 images per channel,
* indicates p < 0.05, paired t-test). Error bars represent the standard error of the mean.
Dow
nloa
ded
by H
arva
rd U
nive
rsity
on
05 D
ecem
ber
2011
Publ
ishe
d on
14
Oct
ober
201
1 on
http
://pu
bs.r
sc.o
rg |
doi:1
0.10
39/C
1LC
2048
7D
View Online
a biotinylated antibody, and cells can be selectively captured at
this temperature (Fig. 1D). By simply reducing the temperature
of the surface below the LCST, protein–antibody–cell complex
can be rapidly released from the surface (Fig. 1F). In this system,
achieving rapid release of captured cells in a controllable manner
with thermoresponsive polymers was possible by the small
volumes employed in microchannels (Fig. 1C–F).
To ensure optimal performance of the release channels,
a temperature indicator channel was included on-chip (stained
with temperature responsive dye) to monitor the temperature
distribution during the capture and release processes using
a simple visual color change, sensitive down to 1 �C (Fig. 1B). All
components were heated to 37 �C prior to injection into chan-
nels. Slight fluctuations in temperature were tolerated with the
developed system since the surface behaves consistently in a wide
temperature range (about 5 �C) above and below the LCST.
For the genomic studies on selectively isolated cells, it is crit-
ical that the genomic characteristics and gene expression of cells
Fig. 5 Effect of flow rate on release efficiency of captured CD4+ cells in micro
were applied through a programmable syringe pump, whereas the manual flo
section. A statistically significant effect on the release efficiency of captured
pipetting flow rate for phosphate buffered saline (PBS) and blood in microcha
Error bars represent the standard error of the mean.
3986 | Lab Chip, 2011, 11, 3979–3989
are not affected during the isolation process. It should be noted
that in this study, the temperature change within the micro-
channels between the capture period (37 �C) and the release
period (<32 �C) was about 5 �C. The release took place in less
than 10 minutes facilitated by the small channel volume
(�10 mL). It has been shown that the genomic and phenotypic
expression of cultured embryonic stem cells (ESCs) were not
affected from a temperature decrease of up to 27 �C (from 37 �Cto 10 �C) over a period of 2 hours on thermoresponsive
polymers.43
The number of captured cells per unit area of control channels
was significantly more than the number of cells in release chan-
nels (Fig. 2E), which can be attributed to the higher extent of
immobilization of biotin binding Neutravidin and biotinylated
capture antibody on control channels. It is likely that the poly-
mer layer does not fully cover the surface, or contains small gaps
between the polymer chains above the LCST.34 This may have
caused the adherence of the Neutravidin onto the polystyrene
channels. (A) The flow rates in the range of 50 mL min�1 to 500 mL min�1
w rate was applied with standard pipettors as described in the methods
CD4+ cells was not observed (P>0.05 for all comparisons). (B) Manual
nnels. (C) The shear stress rate in channels when flowing PBS and blood.
This journal is ª The Royal Society of Chemistry 2011

Fig. 6 Post-release cultivation of CD4+ cells. (A–C) CD4+ cells were collected after release and cultured for up to 8 days. Microscopic imaging was
performed at day 1, 5 and 8 to assess the cellular morphologies. (D) Cell densities in culture (per millimetre square) at day-5 and day-8 displayed
a statistically significant increase compared to day-1 (p < 0.05). The brackets indicate statistically significant difference. Error bars represent the standard
error of the mean.
Dow
nloa
ded
by H
arva
rd U
nive
rsity
on
05 D
ecem
ber
2011
Publ
ishe
d on
14
Oct
ober
201
1 on
http
://pu
bs.r
sc.o
rg |
doi:1
0.10
39/C
1LC
2048
7D
View Online
surface, which would not respond to a temperature change, and
hence, not release the protein–antibody–cell complex. In addi-
tion, while the polymer was in a hydrated state (at 37 �C),proteins may have diffused through the polymer chains and got
adsorbed directly onto the polystyrene surface via hydrophobic
Fig. 7 Validation of the microfluidic capture/release system with CD34+ stem
from whole blood. (B) CD34 fluorescent labeling of captured cells in microch
CD34+ cells displayed greater than 90% viability as indicated by live/dead ass
cellular morphology after a day of culture.
This journal is ª The Royal Society of Chemistry 2011
interactions as discussed before elsewhere.44 To enhance the
release efficiency, polymer density on the surface can be increased
by employing a chain transfer reaction on self-assembled
monolayer chains terminated with thiol groups, as shown
before.34 In this study, we used Neutravidin/biotin-antibody
cells from whole blood. (A) CD34+ stem cells were successfully captured
annels indicated capture specificity greater than 90%. (C–D) The released
ay. (E) Post-release cultivation of CD34+ cells was possible with healthy
Lab Chip, 2011, 11, 3979–3989 | 3987

Dow
nloa
ded
by H
arva
rd U
nive
rsity
on
05 D
ecem
ber
2011
Publ
ishe
d on
14
Oct
ober
201
1 on
http
://pu
bs.r
sc.o
rg |
doi:1
0.10
39/C
1LC
2048
7D
View Online
based surface chemistry, since it is a commonly used method in
the literature,15,38 and the components are readily accessible
through commercial vendors, which can be utilized by a wide
group of researchers. Other protein–antibody immobilization
methods (e.g., streptavidin/biotin-antibody) can potentially be
adapted to thermoresponsive microfluidics to enhance capture
and release efficiencies.
The capture pattern observed along the microchannels (Fig. 4)
can be explained by the fact that as the cell suspension (i.e.,
blood) flows along a channel, CD4+ cells are immobilized on the
surface and subsequently a reduced number of cells are available
for capture further along the channel. Even though a higher
density of cells was captured closer to the inlet, a similar number
of cells were released closer to the inlet compared to the middle
and the outlet regions of the channels. Therefore, over-saturation
of the channel surface with captured cells would not necessarily
enhance the release efficiency, but may increase the total number
of cells released.
In this study, our objective was to develop a time efficient and
simple approach with an inexpensive microfluidic platform to
achieve highly selective cell isolation from heterogeneous
mixtures, which led to the use of manual pipetting as opposed to
using a pump. The flow rates employed in this study did not have
a major effect on the release efficiency (Fig. 5A), indicating that
the cell release mechanism mainly depended on the temperature
responsive behavior of channels. We have quantified the flow
rates and fluid shear stresses achieved by manual pipetting for
aqueous solutions and blood in microchannels (Fig. 5). Based on
detailed characterization of flow rates in microchannels, we
employed the optimal fluid shear range to capture cells from
blood.
The number of CD4+ cells in whole blood samples available
for this study was significantly low, as these whole blood samples
were obtained from transplant patients under immunosuppres-
sant treatment. Therefore, in this study, CD4+ cells were
captured from fresh buffy coat samples obtained from healthy
adults. Prior to utilization in experiments, white blood cell counts
were determined in buffy coat samples, which were observed to
be about 4 times higher than the normal range in humans (Table
1). Therefore, the buffy coat samples were diluted with their own
serum to obtain normal cell concentrations observed in whole
blood as described in Materials and Methods.
We have also performed preliminary analysis on the viability
and post-release culture potential of selectively captured CD4+
cells (Fig. 6). The results indicated that release of CD4+ cells,
which were captured in microchannels, did not significantly
affect their viability and culture potential. Further, we have
validated our system with CD34+ stem cell capture and release
using whole blood (Fig. 7). The released CD34+ cells were viable
and amenable to post-release cultivation (Fig. 7C–E), indicating
the potential of the developed technology for stem cell isolation
from sources such as peripheral blood, cord blood, and bone
marrow.
Conclusion
Effective, easy to use, inexpensive, rapid, and selective label-free
cell isolation technologies are significantly needed to enable
a new era of down-stream processing of cells for broad
3988 | Lab Chip, 2011, 11, 3979–3989
applications in biological research and diagnosis of diseases. In
this study, we have shown that cells can be rapidly and con-
trollably released in microchannels with high viability and
specificity after they were selectively and label-free captured from
blood without any pre-processing steps. The release of live cells
that are captured from heterogeneous cell suspensions, biological
and bodily fluids by using inexpensive microfluidic systems can
generate a great impact in areas such as genomic/proteomic
analysis, stem cell isolation/purification for regenerative thera-
pies, and circulating rare tumor cell isolation for cancer research.
Acknowledgements
This work was performed at the Demirci Bio-Acoustic-MEMS in
Medicine (BAMM) Laboratories at Harvard-Massachusetts
Institute of Technology Health Sciences and Technology, Brig-
ham &Women’s Hospital Center for Bioengineering at Harvard
Medical School. This work was partially supported by National
institutes of Health (NIHR21AI087107, NIHR01AI081534) and
the Center for Integration of Medicine and Innovative Tech-
nology (CIMIT) under the U.S. Army Medical Research
Acquisition Activity Cooperative Agreements DAMD17-02-2-
0006, W81XWH-07-2-0011, and W81XWH-09-2-0001. This
research was made possible partially by a research grant that was
awarded and administered by the U.S. Army Medical Research
& Materiel Command (USAMRMC) and the Telemedicine &
Advanced Technology Research Center (TATRC) at Fort Det-
rick, MD. The information contained herein does not necessarily
reflect the position or policy of the government, and no official
endorsement should be inferred.
References
1 U. A. Gurkan, S. Moon, H. Geckil, F. Xu, S. Wang, T. J. Lu andU. Demirci, Biotechnol. J., 2011, 6, 138–149.
2 W. R. Rodriguez, N. Christodoulides, P. N. Floriano, S. Graham,S. Mohanty, M. Dixon, M. Hsiang, T. Peter, S. Zavahir, I. Thior,D. Romanovicz, B. Bernard, A. P. Goodey, B. D. Walker andJ. T. McDevitt, PLoS Med., 2005, 2, 663–672.
3 W. G. Lee, Y.-G. Kim, B. G. Chung, U. Demirci andA. Khademhosseini, Adv. Drug Delivery Rev., 2010, 62, 449–457.
4 W. G. Lee, U. Demirci and A. Khademhosseini, Integr. Biol., 2009, 1,242–251.
5 S. Wang, F. Xu and U. Demirci, Biotechnol. Adv., 2010, 28, 770–781.6 S. Nagrath, L. V. Sequist, S. Maheswaran, D. W. Bell, D. Irimia,L. Ulkus, M. R. Smith, E. L. Kwak, S. Digumarthy,A. Muzikansky, P. Ryan, U. J. Balis, R. G. Tompkins,D. A. Haber and M. Toner, Nature, 2007, 450, 1235–1239.
7 K. T. Kotz, W. Xiao, C. Miller-Graziano, W.-J. Qian, A. Russom,E. A. Warner, L. L. Moldawer, A. De, P. E. Bankey, B. O. Petritis,D. G. Camp, A. E. Rosenbach, J. Goverman, S. P. Fagan,B. H. Brownstein, D. Irimia, W. Xu, J. Wilhelmy,M. N. Mindrinos, R. D. Smith, R. W. Davis, R. G. Tompkins andM. Toner, Nat. Med., 2010, 16, 1042–1047.
8 A. Salehi-Reyhani, J. Kaplinsky, E. Burgin, M. Novakova,A. J. Demello, R. H. Templer, P. Parker, M. A. A. Neil, O. Ces,P. French, K. R. Willison and D. Klug, Lab Chip, 2011, 11, 1256–1261.
9 B. K. McKenna, A. A. Selim, F. R. Bringhurst and D. J. Ehrlich, LabChip, 2009, 9, 305–310.
10 Q. Ramadan, V. Samper, D. Poenar, Z. Liang, C. Yu and T. M. Lim,Sens. Actuators, B, 2006, 113, 944–955.
11 M. Hosokawa, A. Arakaki, M. Takahashi, T. Mori, H. Takeyamaand T. Matsunaga, Anal. Chem., 2009, 81, 5308–5313.
12 H. W. Wu, C. C. Lin and G. B. Lee, Biomicrofluidics, 2011, 5, 26.
This journal is ª The Royal Society of Chemistry 2011

Dow
nloa
ded
by H
arva
rd U
nive
rsity
on
05 D
ecem
ber
2011
Publ
ishe
d on
14
Oct
ober
201
1 on
http
://pu
bs.r
sc.o
rg |
doi:1
0.10
39/C
1LC
2048
7D
View Online
13 Y. Xu, J. A. Phillips, J. L. Yan, Q. G. Li, Z. H. Fan and W. H. Tan,Anal. Chem., 2009, 81, 7436–7442.
14 E. Sandstrom,W. Urassa,M. Bakari, A. Swai, F.Mhalu, G. Biberfeldand K. Pallangyo, Int. J. STD AIDS, 2003, 14, 547–551.
15 S. Moon, U. A. Gurkan, J. Blander, W. W. Fawzi, S. Aboud,F. Mugusi, D. R. Kuritzkes and U. Demirci, PLoS One, 2011, 6, 8.
16 K.Wang, B. Cometti andD. Pappas,Anal. Chim. Acta, 2007, 601, 1–9.17 R. Busch, D. Cesar, D. Higuera-Alhino, T. Gee, M. K. Hellerstein
and J. M. McCune, J. Immunol. Methods, 2004, 286, 97–109.18 P. Sethu, L. L. Moldawer, M. N. Mindrinos, P. O. Scumpia,
C. L. Tannahill, J. Wilhelmy, P. A. Efron, B. H. Brownstein,R. G. Tompkins and M. Toner, Anal. Chem., 2006, 78, 5453–5461.
19 M. Hristov, W. Erl and P. C. Weber, Trends Cardiovasc. Med., 2003,13, 201–206.
20 M. Boyer, L. E. Townsend, L. M. Vogel, J. Falk, D. Reitz-Vick,K. T. Trevor, M. Villalba, P. J. Bendick and J. L. Glover, J.Cardiovasc. Surg., 2000, 31, 181–189.
21 J. J. Yang, M. Ii, N. Kamei, C. Alev, S. M. Kwon, A. Kawamoto,H. Akimaru, H. Masuda, Y. Sawa and T. Asahara, PLoS One,2011, 6, 14.
22 J. M. Winslow, J. L. Liesveld, D. H. Ryan, J. F. Dipersio andC. N. Abboud, Bone Marrow Transplant., 1994, 14, 265–271.
23 Y. Sung-Yi, et al., Meas. Sci. Technol., 2006, 17, 2001.24 A. Y. Fu, H.-P. Chou, C. Spence, F. H. Arnold and S. R. Quake,
Anal. Chem., 2002, 74, 2451–2457.25 X. Chen, D. F. Cui, C. C. Liu, H. Li and J. Chen, Anal. Chim. Acta,
2007, 584, 237–243.26 X. Zhang, P. Jones and S. J. Haswell,Chem. Eng. J., 2008, 135, S82–S88.27 S. P. Wankhede, Z. Du, J. M. Berg, M. W. Vaughn, T. Dallas,
K. H. Cheng and L. Gollahon, Biotechnol. Prog., 2006, 22, 1426–1433.
28 B. D. Plouffe, M. A. Brown, R. K. Iyer,M. Radisic and S. K.Murthy,Lab Chip, 2009, 9, 1507–1510.
29 K. Jung, G. Hampel, M. Scholz and W. Henke, Cell. Physiol.Biochem., 1995, 5, 353–360.
30 N. Fujioka, Y. Morimoto, K. Takeuchi, M. Yoshioka andM. Kikuchi, Appl. Spectrosc., 2003, 57, 241–243.
31 A. Hatch, G. Hansmann and S. K. Murthy, Langmuir, 2011, 27,4257–4264.
This journal is ª The Royal Society of Chemistry 2011
32 D. Su�arez-Gonz�alez, K. Barnhart, E. Saito, R. Vanderby,S. J. Hollister and W. L. Murphy, J. Biomed. Mater. Res., Part A,2010, 95, 222–234.
33 H. Kanazawa, K. Yamamoto, Y. Kashiwase, Y. Matsushima,N. Takai, A. Kikuchi, Y. Sakurai and T. Okano, J. Pharm. Biomed.Anal., 1997, 15, 1545–1550.
34 D. L. Huber, R. P. Manginell, M. A. Samara, B. I. Kim andB. C. Bunker, Science, 2003, 301, 352–354.
35 T. Okano, N. Yamada, M. Okuhara, H. Sakai and Y. Sakurai,Biomaterials, 1995, 16, 297–303.
36 H. A. von Recum, S. W. Kim, A. Kikuchi, M. Okuhara, Y. Sakuraiand T. Okano, J. Biomed. Mater. Res., 1998, 40, 631–639.
37 M. Yamato, M. Utsumi, A. Kushida, C. Konno, A. Kikuchi andT. Okano, Tissue Eng., 2001, 7, 473–480.
38 S.Moon, H. O. Keles, A. Ozcan, A. Khademhosseini, E. Haeggstrom,D. Kuritzkes and U. Demirci, Biosens. Bioelectron., 2009, 24, 3208–3214.
39 B. Alberts, A. Johnson, J. Lewis, M. Raff, K. Roberts and P. Walter,Molecular Biology of the Cell, Garland Science, New York, 2002.
40 C. T. Lefort and M. Kim, J. Vis. Exp., 2010, 40, e2017.41 E. Boutsianis, H. Dave, T. Frauenfelder, D. Poulikakos,
S. Wildermuth, M. Turina, Y. Ventikos and G. Zund, Eur. J.Cardio Thorac. Surg., 2004, 26, 248–256.
42 Y. G. Takei, T. Aoki, K. Sanui, N. Ogata, Y. Sakurai and T. Okano,Macromolecules, 1994, 27, 6163–6166.
43 S. Dey, B. Kellam, M. R. Alexander, C. Alexander andF. R. A. J. Rose, J. Mater. Chem., 2011, 21, 6883–6890.
44 H. Tekin, G. Ozaydin-Ince, T. Tsinman, K. K. Gleason, R. Langer,A. Khademhosseini and M. C. Demirel, Langmuir, 2011, 27, 5671–5679.
45 Y. G. Kim, S. Moon, D. R. Kuritzkes and U. Demirci, Quantum dot-based HIV capture and imaging in a microfluidic channel, Biosensors& Bioelectronics, 2009, 25(1), 253–258.
46 S. Moon, E. Ceyhan, U. A. Gurkan and U. Demirci, Statisticalmodeling of single target cell encapsulation, PLoS One, 2001, 6(7).
47 M. A. Alyassin, S. Moon, H. O. Keles, F. Manzur, R. L. Lin,E. Haeggstrom, D. R. Kuritzkes and U. Demirci, Rapid automatedcell quantification on HIV microfluidic devices, Lab on a Chip,2009, 9(23), 3364–3369.
Lab Chip, 2011, 11, 3979–3989 | 3989

Supporting Information (SI)
SI 1
Controlled viable release of selectively captured label-free cells in
microchannels
Umut Atakan Gurkana, Tarini Ananda, Huseyin Tasa, David Elkana, Altug Akaya, Hasan Onur
Kelesa, and Utkan Demircia,b,#
aDemirci Bio-Acoustic-MEMS in Medicine (BAMM) Laboratory, Center for Biomedical
Engineering, Department of Medicine, Brigham and Women’s Hospital, Harvard Medical School,
Boston, MA, USA
bHarvard-MIT Health Sciences and Technology, Cambridge, MA, USA.
Classification: Biological Sciences, Applied Biological Sciences
# Corresponding author:
Utkan Demirci, Ph.D.
Assistant Professor of Medicine and Health Sciences and Technology,
Harvard Medical School
Brigham & Women's Hospital
65 Landsdowne St. PRB Rm. 267
Cambridge, MA
Phone: 650-906-9227
E-mail: [email protected]
Electronic Supplementary Material (ESI) for Lab on a ChipThis journal is © The Royal Society of Chemistry 2011

Supporting Information (SI)
SI 2
A. Fabrication of microfluidic device components
Double sided adhesive (DSA) layer: The channels were cut into 80 µm DSA (iTapeStore, Scotch
Plains, NJ) using a laser-cutter (Versalaser, Moscow, Russia). Each DSA piece measured 24 mm X
35 mm. The channel dimensions measured 28 mm in length and 4 mm in width with 80 µm
height. DSA pieces were placed 1.5 mm from the horizontal edges (Fig. S1). The channel inlet
and outlet regions were angled at 127⁰ to better facilitate the introduction and evacuation of
fluids 1, 2. Three channels were cut into each DSA piece with 3 mm space in between.
Polymethymetacrylate (PMMA) layer: The inlet and outlet ports for the fluid were cut into 3.5
mm thick PMMA sheets (McMaster Carr, Santa Fe Springs, CA) using the laser-cutter as seen in.
Each PMMA layer was cut into 24 mm X 35 mm pieces (Fig. S2). The inlet ports measured 0.59
mm in diameter, and were positioned 0.5 mm from the right edge of each corresponding
channel cut into the DSA. The outlet ports also measured 0.59 mm in diameter, and they were
positioned 0.5 mm from left edge of each channel. Five equally spaced markers along the
channels, each 0.4 mm in diameter, were cut 1 mm from both the top and bottom edges of the
PMMA layers, to act as indicators for microscopic imaging locations along the channels. A
number was engraved into the top left corner of each PMMA layer to help identify each
microchip.
B. Assembly of microfluidic channels
The bottom surface of the microfluidic release channels were made of PNIPAAm polymer layer
(Upcell, Nalge Nunc International, Rochester, NY). The microfluidic chips were prepared using
the following components: DSA layer, PMMA layer, and a PNIPAAm coated polystyrene or
uncoated polystyrene layer. The channels were cut into the DSA, and the inlets and outlets
were cut into the PMMA using the laser cutter as described above. The DSA’s protective layers
were removed and carefully adhered to the PMMA layer. A thin mark was made with the laser
cutter on the underside of the bottom surface, marking the boundaries of the middle channel.
Then, a thin layer of temperature responsive liquid crystal stain (Edmund Scientific, Tonawanda,
NY) was applied to work as a temperature indicator throughout the experiment. Epoxy glue (5-
Minute Epoxy, Devcon, Danvers, MA) was used to seal the edges of the assembled microfluidic
chips. Tygon tubing with external diameter of 0.762 mm (Cole-Parmer, Vernon Hills, IL) was
inserted into each outlet and fixed using epoxy glue. Polystyrene tissue culture plastic was used
as a control surface for microfluidic channels and the control microchips were fabricated
according to the protocol described above. Surface cleanliness was critical when working with
the polymer coated surface to reduce contamination, which may hinder the capture and
release performance of the polymer.
Electronic Supplementary Material (ESI) for Lab on a ChipThis journal is © The Royal Society of Chemistry 2011

Supporting Information (SI)
SI 3
REFERENCES
1. S. Moon, H. O. Keles, A. Ozcan, A. Khademhosseini, E. Haeggstrom, D. Kuritzkes and U. Demirci, Biosensors & Bioelectronics, 2009, 24, 3208-3214.
2. S. Moon, U. A. Gurkan, J. Blander, W. W. Fawzi, S. Aboud, F. Mugusi, D. R. Kuritzkes and U. Demirci, PLoS One, 2011, 6, 8.
Electronic Supplementary Material (ESI) for Lab on a ChipThis journal is © The Royal Society of Chemistry 2011

Supporting Information (SI)
SI 4
FIGURES
Figure S1: Computer aided drawing of the 80 µm thick DSA film that was sandwiched between
PMMA and polystyrene surface to form the microfluidic channels. Dimensions are in
millimeters.
Figure S2: Computer aided drawing of the top PMMA layer of the microfluidic chips.
Dimensions are in millimeters.
Electronic Supplementary Material (ESI) for Lab on a ChipThis journal is © The Royal Society of Chemistry 2011