msmccrindle.weebly.com · Web view ... Oceanographers use the word . salinity . to describe the...
17
TOPIC 4.1 –INTRODUCTION TO WATER SYSTEMS Name: Significant ideas: The hydrological cycle is a system of water flows and storages that may be disrupted by human activity 1
Transcript of msmccrindle.weebly.com · Web view ... Oceanographers use the word . salinity . to describe the...
TOPIC 4.1 –INTRODUCTION TO WATER SYSTEMS Name:
Significant ideas: The hydrological cycle is a system of water flows and storages that may be disrupted by human activity
We have a water planet. 75% of Earth’s surface is covered with water, only 25% is covered with land. Where is Earth's water located and in what forms does it exist? You can see how water is distributed by viewing these bar charts. The left-side bar shows where the water on Earth exists; about 97 percent of all water is salt water, found in oceans, bays, and saltwater lakes. Only 3% of all water is freshwater. The middle bar breaks that 3% down into its parts. Almost 69% is locked up (frozen!) in glaciers and icecaps, mainly in Greenland and Antarctica. A little over 30% of all freshwater is ground water. This leaves 0.9% coming from other sources (atmosphere, plants and animals, etc.) and a tiny 0.3% of all freshwater coming from surface water. The right-side bar shows the distribution of the surface water. Notice that only 2% of the 0.3% of freshwater comes from rivers.
1
Objective Statement Covered the notes
Revised in class
I’m confident
Knowledge and understanding
Solar radiation drives the hydrological cycleFresh water only makes up a small fraction (approximately 2.6% by volume) of the Earth’s water storagesStorages in the hydrological cycle include organisms and various water bodies including oceans, groundwater (aquifers), lakes, soils, rivers, atmosphere, and glaciers and ice capsFlows in the hydrological cycle include evapotranspiration, sublimation, evaporation, condensation, advection (wind-blown movement), precipitation, melting, freezing, flooding, surface run-off, infiltration, percolation and stream-flow or currentsHuman activities such as agriculture, deforestation, and urbanization have a significant impact on surface run-off and infiltrationOcean circulation systems are driven by differences in temperature and salinity. The resulting difference in water density drives the ocean conveyor belt, which distributes heat around the world and thus affects climate
Applications and Skills
Discuss human impact on the hydrological cycleConstruct and analyze a hydrological cycle diagram
Fresh water only makes up a small fraction (approximately 2.6% by volume) of the Earth’s water storages

How much of Earth's water is available for our uses ... and in what forms does it exist? You can best see how water is distributed by viewing these pie charts. We use both surface and ground water to meet our water needs.
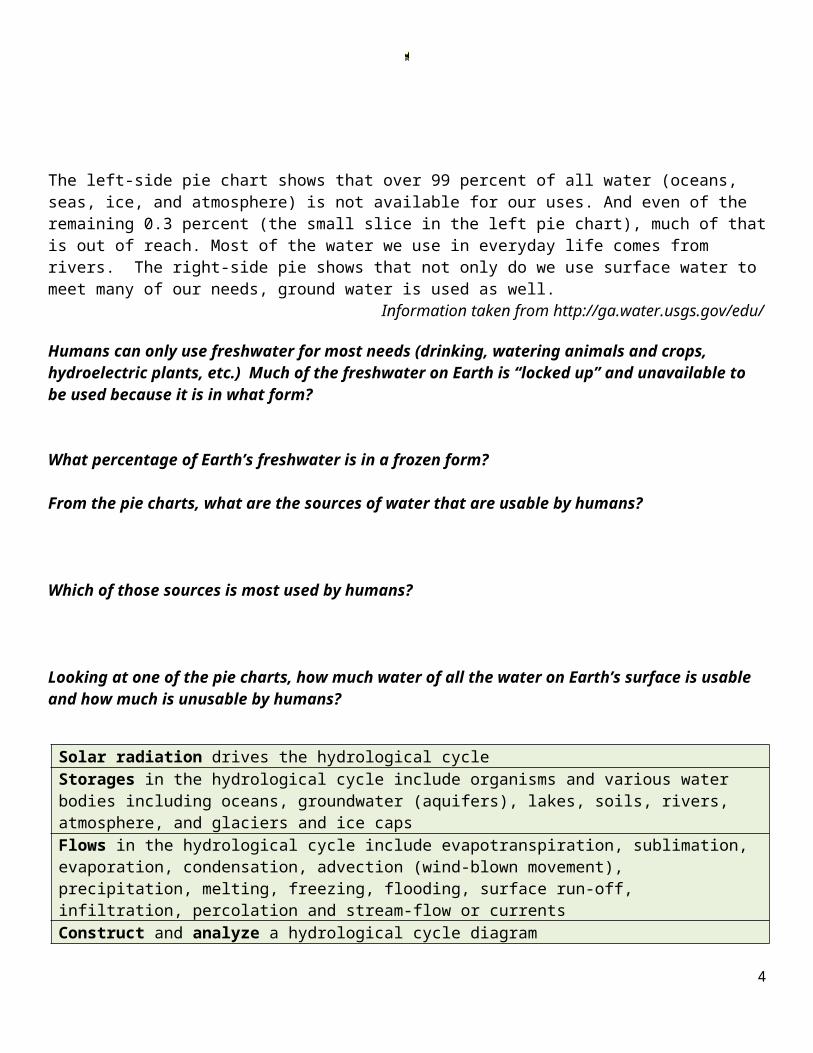
The left-side pie chart shows that over 99 percent of all water (oceans, seas, ice, and atmosphere) is not available for our uses. And even of the remaining 0.3 percent (the small slice in the left pie chart), much of that is out of reach. Most of the water we use in everyday life comes from rivers. The right-side pie shows that not only do we use surface water to meet many of our needs, ground water is used as well.
Information taken from http://ga.water.usgs.gov/edu/
Humans can only use freshwater for most needs (drinking, watering animals and crops, hydroelectric plants, etc.) Much of the freshwater on Earth is “locked up” and unavailable to be used because it is in what form?
What percentage of Earth’s freshwater is in a frozen form?
From the pie charts, what are the sources of water that are usable by humans?
2
Usable vs. Unusable Water on Earth
Ground vs. Surface WaterUsed by Humans

Which of those sources is most used by humans?
Looking at one of the pie charts, how much water of all the water on Earth’s surface is usable and how much is unusable by humans?
Draw a systems diagram of the water budget and cycle showing the flows and storages given in the table. Make your storage boxes and width of flow arrows correspond to the proportions of these volumes. Label all these storages and flows.
Storages Water volume(km2 x 103) Flows Water volume
(km2 x 103)Snow and ice 27000 Precipitation over oceans 385Ground water and aquifers 9000 Precipitation over land 110Lakes and rivers 250 Ice melt 2Oceans 1350000 Surface run off 40Atmosphere 13 Evapotranspiration over land 70Soil 35000 Evaporation form sea 425
Use your smartphone to find a real-life example of the human impact on the hydrological cycle. Make jot notes, and be prepared to share with your group.
3
Solar radiation drives the hydrological cycleStorages in the hydrological cycle include organisms and various water bodies including oceans, groundwater (aquifers), lakes, soils, rivers, atmosphere, and glaciers and ice capsFlows in the hydrological cycle include evapotranspiration, sublimation, evaporation, condensation, advection (wind-blown movement), precipitation, melting, freezing, flooding, surface run-off, infiltration, percolation and stream-flow or currentsConstruct and analyze a hydrological cycle diagram
Discuss human impact on the hydrological cycle
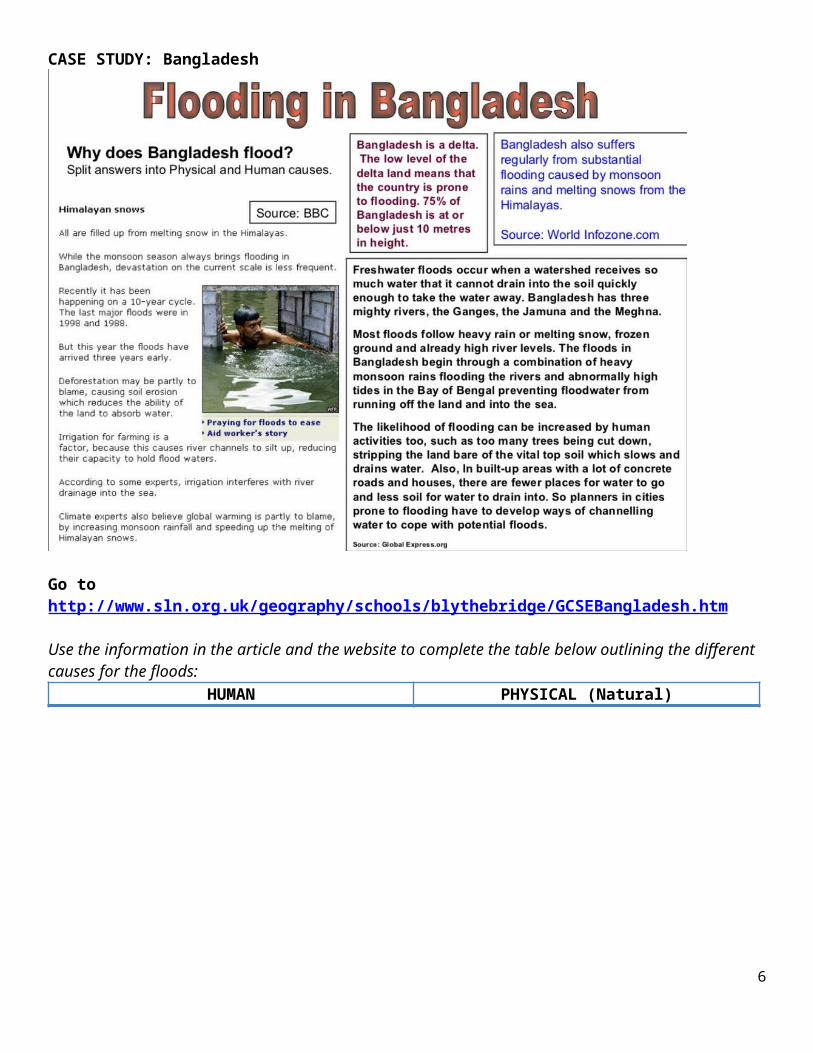
CASE STUDY: Bangladesh
Go to http://www.sln.org.uk/geography/schools/blythebridge/GCSEBangladesh.htm
Use the information in the article and the website to complete the table below outlining the different causes for the floods:
HUMAN PHYSICAL (Natural)
4
Human activities such as agriculture, deforestation, and urbanization have a significant impact on surface run-off and infiltration

CASE STUDY: Jordan
Go to http://www.fao.org/nr/water/aquastat/countries_regions/jor/index.stm
Describe where most of the population live and why
Summarize the agricultural industry of Jordan
List the water supply sources available to Jordan
Explain which of the listed sources are sustainable.
5
Describe the political and environmental issues around Jordan’s water supply.
Explain the water management strategies Jordan is adopting.
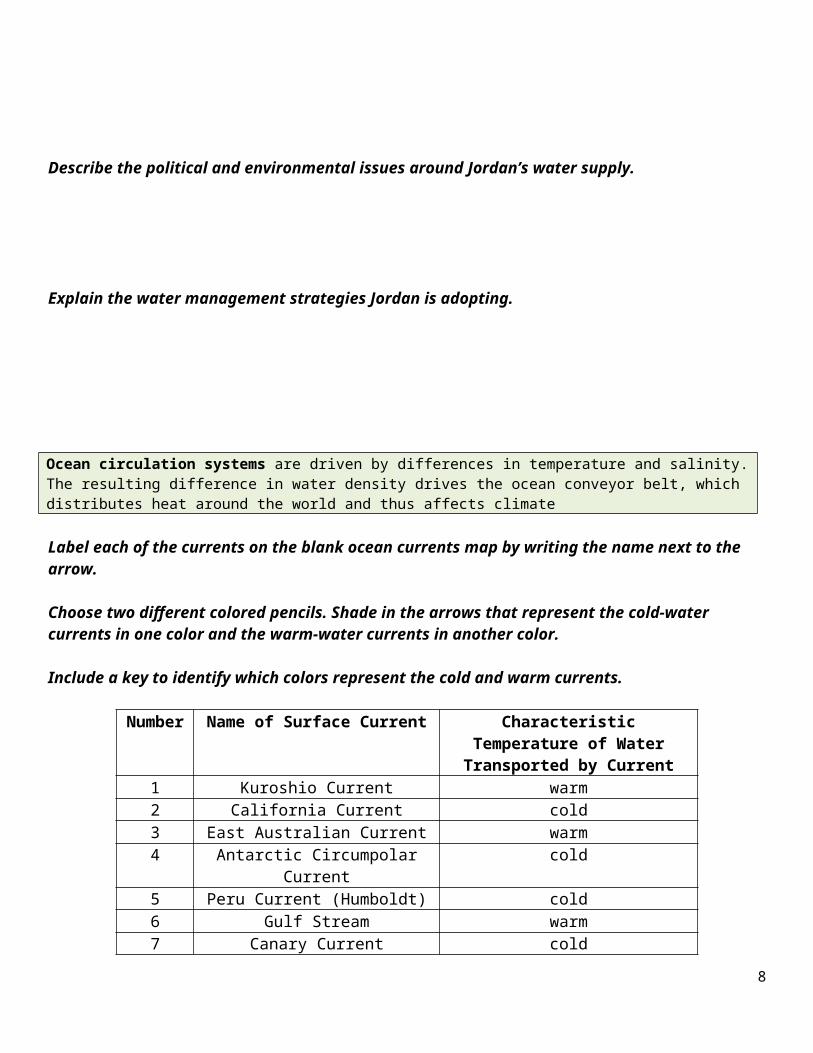
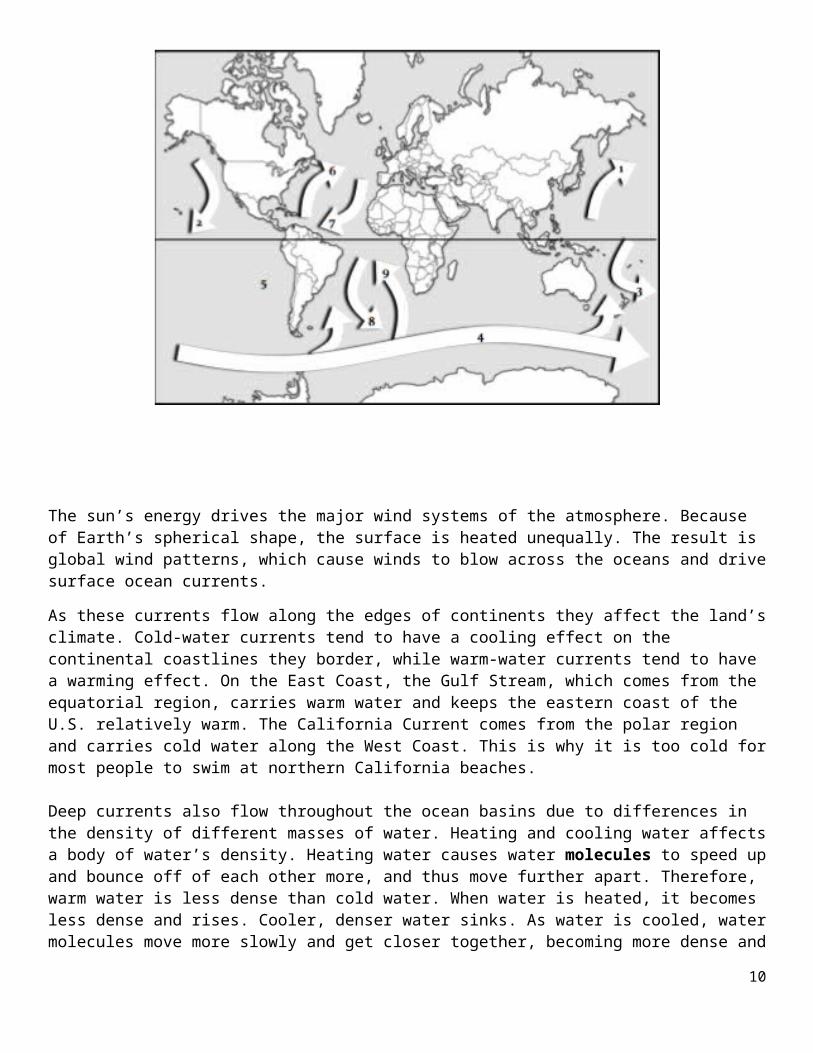
Label each of the currents on the blank ocean currents map by writing the name next to the arrow.
Choose two different colored pencils. Shade in the arrows that represent the cold-water currents in one color and the warm-water currents in another color.
Include a key to identify which colors represent the cold and warm currents.
Number Name of Surface Current Characteristic Temperature of Water Transported by Current
1 Kuroshio Current warm2 California Current cold3 East Australian Current warm4 Antarctic Circumpolar Current cold5 Peru Current (Humboldt) cold6 Gulf Stream warm7 Canary Current cold8 Brazil Current warm9 Benguela Current cold
6
Ocean circulation systems are driven by differences in temperature and salinity. The resulting difference in water density drives the ocean conveyor belt, which distributes heat around the world and thus affects climate
The sun’s energy drives the major wind systems of the atmosphere. Because of Earth’s spherical shape, the surface is heated unequally. The result is global wind patterns, which cause winds to blow across the oceans and drive surface ocean currents.
As these currents flow along the edges of continents they affect the land’s climate. Cold-water currents tend to have a cooling effect on the continental coastlines they border, while warm-water currents tend to have a warming effect. On the East Coast, the Gulf Stream, which comes from the equatorial region, carries warm water and keeps the eastern coast of the U.S. relatively warm. The California Current comes from the polar region and carries cold water along the West Coast. This is why it is too cold for most people to swim at northern California beaches.
Deep currents also flow throughout the ocean basins due to differences in the density of different masses of water. Heating and cooling water affects a body of water’s density. Heating water causes water molecules to speed up and bounce off of each other more, and thus move further apart. Therefore, warm water is less dense than cold water. When water is heated, it becomes less dense and rises. Cooler, denser water sinks. As water is cooled, water molecules move more slowly and get closer together, becoming more dense and sinking. The process of warm water rising and cool water sinking forms convection currents. Convection currents transfer most of the heat energy in the oceans. The process of convection also happens in atmosphere when warm air rises and cool air sinks.
Adding or subtracting certain materials to water, such as salt, can also change a body of water’s density. If salt is added to fresh water, the amount of matter within the space the water occupies is increased, since salt molecules are crowded into the same space as the water. This makes salt water more dense than fresh water. Oceanographers use the word salinity to describe the amount of salt in water.
Deep ocean currents form as colder, more saline water masses sink and warmer, less saline water masses rise. Warmer water masses are found near equatorial regions and colder water masses are found near polar
7
regions. More saline water masses are found in areas where there is a lot of evaporation or in polar areas where ice is formed. Less saline water is found where there is more precipitation or river input.
Currents and Earth’s ClimateTogether, the surface and deep currents of the oceans distribute heat. The ocean regulates global climate by absorbing and releasing heat as the water is transported around the Earth. The surface ocean currents have a strong effect on Earth’s climate. Areas near the equator receive more heat than areas near the poles. However, these areas are not constantly getting warmer. This is because the oceans and winds transport heat around the Earth from lower latitudes near the equator to higher latitudes near the pole.
The deep (density) ocean currents also have a strong effect on Earth’s climate. Water in the North Atlantic Ocean is cold and salty. This colder, salty water sinks because of its greater density. It then flows southward deep in the ocean. This deep current flows throughout the Earth’s oceans and eventually mixes with the surface currents and helps return surface water to the North Atlantic. This “great ocean conveyer belt” circulation of water moves heat around the Earth. One drop of ocean water in the North Atlantic Ocean takes about 1000 years to return to the same spot.
Scientists do not completely understand this flow of water, but they do believe that if Earth’s atmosphere continues to warm, water will not sink as much in the North Atlantic Ocean. This may cause the global flow of ocean water to slow, drastically changing Earth’s climate. Scientists think that if the conveyor slows or stops, the warmer surface water would not be propelled back toward the north Atlantic through the Gulf Stream. This could cause Europe to be frozen.
Over the past few million years, ocean currents have flowed in the same general patterns. Some small changes have occurred as Earth’s climate has slowly varied between ice ages and warmer periods. Today, however, we are facing a situation unlike any in the past. Due to an increased amount of greenhouse gases in Earth’s atmosphere, the Earth’s temperature is rising, causing the oceans to also warm. Warmer ocean temperatures will have a great effect on currents, sea level, and the climate on Earth.
8
Image source: NASA

What are the two types of ocean currents?
What seems to determine whether a current carries warm or cold water?
Find the United States on the map. Look at the pattern of currents in the Northern Hemisphere. What current affects the eastern coast of the United States? How do you think this current affects the climate on the east coast?
Look at the pattern of currents in the Northern Hemisphere. What current affects the western coast of the United States? How do you think this current affects the climate in the western coast?
At what locations on the Earth would you expect to find very cold and saline water? How would this water cause the deep currents in the ocean?
Explain thermohaline circulation.
How do surface currents affect the Earth’s climate?
How can deep density driven currents affect Earth’s climate?
What is the ‘great ocean conveyor belt’?
9
EL NINO WEBQUEST
Go to:http://www.classzone.com/books/earth_science/terc/content/investigations/esu601/esu601page01.cfm
List some examples of what El Niño can do to the weather of the world. (pg. 1)
How does El Niño develop? (pg2)
Draw a sketch of the ocean under normal, El Niño and La Niña conditions and label the Thermocline.
Estimate the latitude where warm El Niño water is located.(pg3)
During which months do ocean surface elevations begin to rise along the equator, indicating the beginning of an El Niño? (pg 4)
During which months does the El Niño end and the La Niña begin?
Describe the thermocline during normal, El Niño, and La Niña phases. (pg. 5 &6)
Describe changes in ocean temperatures characterizing each phase.
10

How does the North Pacific jet stream change from the mean during the January-March 1998 phase of the El Niño? (pg.8)
How does the North Pacific jet stream change from the mean during the January-March 1989 phase of the La Niña?
Compare temperature and precipitation patterns around equatorial southeast Asia during El Niño and La Niña. (pg9)
How does the weather in the northwestern part of the United States differ between El Niño and La Niña? (pg10)
Compare temperature and precipitation patterns around the Southern United States during el Niño and la Niña.
Describe an El Niño- or La Niña-related impact, and explain how El Niño or La Niña is thought to have caused this impact. (pg13 and links) Describe at least 4.
UpwellingAnswer the following questions using this website:http://ww2010.atmos.uiuc.edu/(Gh)/guides/mtr/eln/upw.rxml
What is upwelling?
11
Why does upwelling occur?
What is a thermocline? How does it affect sea surface temperatures?
How are layers of the ocean divided?
Why does a deeper thermocline (seen in El Nino years) affect fish?
Global Effects of El NinoUse the websites below to answer each set of questions.http://oceanworld.tamu.edu/students/elnino/elnino2.htm
How is southeast Texas affected?
What parts of the world experience drought conditions?
Which areas of the world are warmer than average?
http://www.oar.noaa.gov/k12/html/elnino2.html
How often do El Nino events occur?
How long do most El Nino events last?
http://www.cpc.ncep.noaa.gov/products/analysis_monitoring/enso_advisory/ensodisc.pdf
Are we currently in an El Nino, La Nino, or Neutral pattern?
When is this condition expected to change?
12