View - Montclair State University
15
Table 1. Flora Science Team 1) Spectroscopy algorithms and data products G. Asner, Carnegie PI; fractional material cover S. Ungar, GSFC Deputy PI; mission management R. Green, JPL Instrument scientist; calibration B. Knox, GSFC Deputy manager; plant functional types D. Roberts, UCSB fire fuel load, disturbance event-intensity S. Ustin, UC-Davis canopy water, fire fuel load B. Middleton, GSFC light use efficiency J. Gamon, Cal State light use efficiency, canopy water M. Martin, Univ NH plant functional types, fractional material cover J. Morisette, GSFC validation (2) Ecosystem/carbon modeling C. Field, Carnegie production-efficiency models for NPP D. Schimel, NCAR land surface data assimilation S. Ollinger, Univ NH meso-scale carbon flux modeling J. Collatz, GSFC global modeling of plant physiology J. Foley/C. Kucharik regional and global land use, agriculture Univ WI (3) Data fusion R. Treuhaft, JPL multi-sensor data fusion F. Hall, GSFC global dynamics and satellite constellations A. Huete, Univ AZ multi-scale satellite data integration and analysis Mission Concept for the National Academy of Sciences Decadal Study The Flora Mission for Ecosystem Composition, Disturbance and Productivity Gregory P. Asner Carnegie Institution of Washington 260 Panama Street Stanford, CA 94305 Tel: 650.380.2828 [email protected] Robert G. Knox NASA Goddard Space Flight Center [email protected] Robert O. Green Jet Propulsion Laboratory [email protected] Stephen G. Ungar NASA Goddard Space Flight Center [email protected] (1) Flora Mission Objective The Flora satellite mission will provide global, high spatial resolution measurements of vegetation composition, ecosystem processes and productivity controls, and their integrated responses to climate variability, disturbance, and land-use change. (2) Thematic Group and Mission Category • Primary: Land-use change, ecosystem dynamics and biodiversity • Secondary: Earth science applications and societal needs Water resources and the global hydrological cycle • Small mission costing less than $200 M (3) Flora Mission Summary Global land use and climate variability alter ecosystem conditions – including structure, function, and biological diversity – at a pace that requires unambiguous observations from satellite vantage points. Current global measurements are limited to general land cover, some disturbances, vegetation leaf area index, and canopy energy absorption. Flora is a pathfinding mission that provides new measurements of ecosystem structure, function, and diversity to understand the spatial and temporal dynamics of human and natural disturbances, and the biogeochemical and physiological responses of ecosystems to disturbance. The mission relies upon high-fidelity imaging spectroscopy to deliver full optical spectrum measurements (400-2500 nm) of the global land surface on a monthly time step at 45 meter spatial resolution for three years. The Flora measurement objectives are: (i) fractional cover of biological materials, (ii) canopy water content, (iii) vegetation pigments and light-use efficiency, (iv) plant functional types, (v) fire fuel load and fuel moisture content, and (vi) disturbance occurrence, type and intensity. These measurements are made using a multi-parameter, spectroscopic analysis approach afforded by observation of the full optical spectrum. Combining these measurements, along with additional observations from multispectral sensors, Flora will far advance global studies and models of ecosystem dynamics and change.
Transcript of View - Montclair State University
Table 1. Flora Science Team 1) Spectroscopy algorithms and data products G. Asner, Carnegie PI; fractional material cover
S. Ungar, GSFC Deputy PI; mission management R. Green, JPL Instrument scientist; calibration
B. Knox, GSFC Deputy manager; plant functional types D. Roberts, UCSB fire fuel load, disturbance event-intensity
S. Ustin, UC-Davis canopy water, fire fuel load B. Middleton, GSFC light use efficiency J. Gamon, Cal State light use efficiency, canopy water M. Martin, Univ NH plant functional types, fractional material cover J. Morisette, GSFC validation (2) Ecosystem/carbon modeling C. Field, Carnegie production-efficiency models for NPP D. Schimel, NCAR land surface data assimilation S. Ollinger, Univ NH meso-scale carbon flux modeling J. Collatz, GSFC global modeling of plant physiology J. Foley/C. Kucharik regional and global land use, agriculture
Univ WI (3) Data fusion R. Treuhaft, JPL multi-sensor data fusion F. Hall, GSFC global dynamics and satellite constellations A. Huete, Univ AZ multi-scale satellite data integration and analysis
Mission Concept for the National Academy of Sciences Decadal Study The Flora Mission for Ecosystem Composition, Disturbance and Productivity Gregory P. Asner Carnegie Institution of Washington 260 Panama Street Stanford, CA 94305 Tel: 650.380.2828 [email protected] Robert G. Knox NASA Goddard Space Flight Center [email protected] Robert O. Green Jet Propulsion Laboratory [email protected] Stephen G. Ungar NASA Goddard Space Flight Center [email protected] (1) Flora Mission Objective The Flora satellite mission will provide global, high spatial resolution measurements of vegetation composition, ecosystem processes and productivity controls, and their integrated responses to climate variability, disturbance, and land-use change. (2) Thematic Group and Mission Category
• Primary: Land-use change, ecosystem dynamics and biodiversity • Secondary: Earth science applications and societal needs
Water resources and the global hydrological cycle • Small mission costing less than $200 M
(3) Flora Mission Summary Global land use and climate variability alter ecosystem conditions – including structure, function, and biological diversity – at a pace that requires unambiguous observations from satellite vantage points. Current global measurements are limited to general land cover, some disturbances, vegetation leaf area index, and canopy energy absorption. Flora is a pathfinding mission that provides new measurements of ecosystem structure, function, and diversity to understand the spatial and temporal dynamics of human and natural disturbances, and the biogeochemical and physiological responses of ecosystems to disturbance. The mission relies upon high-fidelity imaging spectroscopy to deliver full optical spectrum measurements (400-2500 nm) of the global land surface on a monthly time step at 45 meter spatial resolution for three years. The Flora measurement objectives are: (i) fractional cover of biological materials, (ii) canopy water content, (iii) vegetation pigments and light-use efficiency, (iv) plant functional types, (v) fire fuel load and fuel moisture content, and (vi) disturbance occurrence, type and intensity. These measurements are made using a multi-parameter, spectroscopic analysis approach afforded by observation of the full optical spectrum. Combining these measurements, along with additional observations from multispectral sensors, Flora will far advance global studies and models of ecosystem dynamics and change.
1
(4) Background Terrestrial ecosystems are a central component of the Earth system because they regulate carbon, water, energy, and other material transfers between the land, oceans and atmosphere. Past NASA programs have focused on climatological drivers of ecosystem dynamics as well as land cover change. Ecosystem responses to climate variability are now observed at global scale and at moderate spatial resolution, and these observations mainly focus on vegetation phenology – the dynamics of vegetation greenness and its relationship to fractional photosynthetic radiation absorption (fPAR). Land cover change is observed using moderate to high spatial resolution, multispectral sensors on a regional basis. Additional uses of multispectral observations include the detection of major fires and major forms of ecological disturbance such as deforestation. Landsat, Terra, Aqua, AVHRR, and SeaWIFs are U.S. spaceborne remote sensing platforms that provide information on vegetation phenology, land cover, and fire occurrence. These types of measurements are now considered operationally viable, allowing for their transition to the NOAA NPOESS program. During the NASA Earth Observing System (EOS) era, the Earth science community has learned a great deal about the dynamics of the terrestrial biosphere and the major land cover changes that occur throughout the world. Data provided by EOS sensors often show that ecosystem changes occur (1), but unambiguous measurements remain elusive (2). Recognized issues of spatial, spectral and temporal resolution represent trade-offs inherent to the 1980s technology that limited sensor designs and mission objectives of the EOS era. What the EOS sensors foremost deliver is a clear sense that although ecosystem change is ubiquitous, the biophysical details of such changes are difficult to identify and quantify. Current measurements do not readily advance the Earth system models beyond relatively simple algorithms that use general vegetation type (e.g., deciduous vs. coniferous trees) and fPAR for vegetation growth dynamics. By the late 1990s, the ecological research community became well aware that land cover at high spatial/low temporal resolution (e.g., Landsat) and fPAR at high temporal/moderate spatial resolution (e.g., AVHRR, MODIS) are not sufficient for the detailed studies of terrestrial ecosystem dynamics (including carbon cycling) called for by the Earth system modeling, land management, or policy development sectors (3). In particular, land-surface and ecosystem models were found to be limited in capability due to lack of observations of the vegetation structural and chemical changes taking place in the biosphere. These observations are required as modeling inputs that cannot be obtained via field measurements or current multispectral sensors (4). The scientific community also recognized that many terrestrial ecosystem processes are now dominated by human activities, both directly via disturbance and indirectly via atmospheric pollutants such as reactive nitrogen (5). Today, for example, there is a clear need for high spatial resolution remote sensing observations of vegetation structural, chemical and physiological variables in the context of ecosystem disturbance and response (3). Changes in biological diversity, driven by the loss of habitat, invasive species and other factors, are also a central contributor to global environmental change (5), but space-based assets have not been designed specifically to address these issues. New measurements are required to capture key changes in the structural, chemical, and physiological properties of ecosystems. Although these measurements are needed at a range of spatial and temporal scales, one critical type of observation not currently available is a full-global measurement capability at a spatial resolution commensurate with the many small-scale, but highly diffuse disturbances that occur throughout ecosystems, and at a time step of 1-3 months. The diffuse disturbances include forest thinning, insect and pathogen outbreaks, understory fires, species introductions, changes in grazing pressure, and many others. These disturbances are well known to alter ecosystem functioning at the local scale, as studied in numerous field projects (6, 7). However, the occurrence, type and intensity (e.g., spatial scale and biophysical impact) of these disturbances are not known globally. Moreover, the structural, chemical, and physiological impacts of these diffuse disturbances are poorly understood. It is
2
0
2
4
6
8
10
12
14
16
400 700 1000 1300 1600 1900 2200 2500Wavelength (nm)
Rad
ianc
e (µ
W/c
m2 /n
m/s
r)
Atm
osph
eric
Oxy
gen
Atmospheric Water Vapor & Canopy water
Atm
osph
eric
Car
bon
Leaf
Chl
orop
hyll
and
Oth
er K
ey P
igm
ents Organic Carbon
NitrogenDer
ived
Ref
lect
ance
Wavelength (nm)
Ecosystem Disturbance, Composition,Productivity
Fire
Fue
ls &
Fue
l Moi
stur
e
Canopy Water Content
Dis
turb
ance
& R
espo
nses Plant Functional Types
Fractional Cover of Biological Materials
Measurem
ents
AnalysisMod
elin
g
Obs
erva
tions
Light-use Efficiency & Pigments
Calibrated Full Optical Spectrum Reflectance
0
2
4
6
8
10
12
14
16
400 700 1000 1300 1600 1900 2200 2500Wavelength (nm)
Rad
ianc
e (µ
W/c
m2 /n
m/s
r)
Atm
osph
eric
Oxy
gen
Atmospheric Water Vapor & Canopy water
Atm
osph
eric
Car
bon
Leaf
Chl
orop
hyll
and
Oth
er K
ey P
igm
ents
0
2
4
6
8
10
12
14
16
400 700 1000 1300 1600 1900 2200 2500Wavelength (nm)
Rad
ianc
e (µ
W/c
m2 /n
m/s
r)
Atm
osph
eric
Oxy
gen
Atmospheric Water Vapor & Canopy water
Atm
osph
eric
Car
bon
Leaf
Chl
orop
hyll
and
Oth
er K
ey P
igm
ents Organic Carbon
NitrogenDer
ived
Ref
lect
ance
Wavelength (nm)
Ecosystem Disturbance, Composition,Productivity
Fire
Fue
ls &
Fue
l Moi
stur
e
Canopy Water Content
Dis
turb
ance
& R
espo
nses Plant Functional Types
Fractional Cover of Biological Materials
Measurem
ents
AnalysisMod
elin
g
Obs
erva
tions
Light-use Efficiency & Pigments
Calibrated Full Optical Spectrum Reflectance
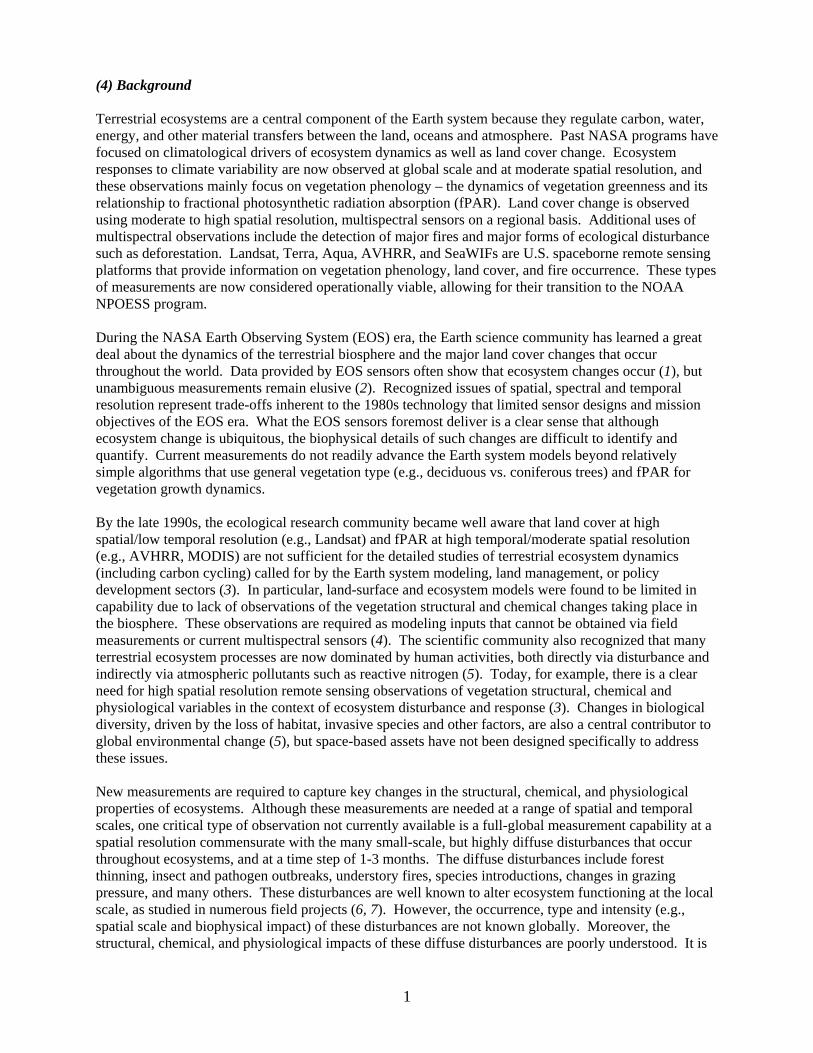
Fig 1. Flora will quantify elemental and molecular constituents of vegetation and the atmosphere using high-fidelity imaging spectroscopy to reach six science measurement objectives that revolutionize models of ecosystem disturbance, composition and productivity.
the integrated occurrence and ecological effects of these disturbances that are largely missed by EOS-era technologies and thus not well represented in Earth system models. During the EOS era, new airborne technologies have been developed to expand the number and quality of remote sensing observations pertinent to studies of ecosystem dynamics, disturbance and biodiversity. Two technologies – imaging spectroscopy and scanning laser detection and ranging (LIDAR) – opened doors to novel measurements of ecosystem structure, chemistry and physiology. Scanning LIDAR brought measurements of canopy height and vertical profile that are deemed important for biomass studies (36). Imaging spectroscopy evolved from empirically-based studies to physically-based approaches for determining structural, chemical and physiological properties of vegetation and ecosystems. As airborne measurements from the NASA Airborne Visible and Infrared Imaging Spectrometer (AVIRIS) advanced from lower quality in the 1990s to very high performance in the 21st century (8, 9), measurements of multiple vegetation properties became possible and were explored by the Earth science community. It is now apparent that “high-fidelity” imaging spectroscopy has reached a level of capability and maturity that is pertinent to spaceborne missions for ecosystem studies. The NASA New Millennium Program brought forward an opportunity to deploy a low-fidelity imaging spectrometer – Earth Observing-1 Hyperion – as a technology demonstration. The performance of Hyperion is only equivalent to a predecessor AVIRIS-1993 capability, but it nonetheless showed that spaceborne imaging spectrometer observations could advance ecosystem science by providing observations of canopy water, pigments, nutrients, carbon dioxide uptake efficiency, and species diversity (10-13). Hyperion data have been provisionally employed in a mainstream ecosystem dynamics model to simulate carbon sources and sinks in the Northeast United States, showing substantial increases in accuracy over previous methods that use land cover and fPAR observations alone (12, 14). Despite these early successes, Hyperion demonstrated that shortfalls in sensor uniformity, stability, and signal-to-noise performance limited its value in higher levels of ecosystem analysis (15, 16). The Flora spaceborne imaging spectroscopy mission brings a rich and mature heritage of instrument design and scientific knowledge – from AVIRIS, Hyperion and other planetary programs – to the forefront of Earth systems research and monitoring. Flora is a mission designed to deliver new quantitative information on ecosystem disturbances, structure, chemistry and physiology for research and predictive modeling. The information is also important to land management and policy development sectors. The Flora deliverables are highly quantitative on both per-area and per-mass basis, and thus can be readily ingested into the next generation of ecological and land-surface simulations. Flora measurements are provided at high spatial and “biophysical” resolution, to advance a range of Earth studies from carbon cycling to biological diversity. Unlike some past imaging spectroscopy concepts, Flora has a well-defined hierarchy of deliverables based on scientific maturity, complexity of analysis, and community need (Fig. 1).

3
Fig 2. Flora mission objectives require contiguous spectral measurements in the 400-2500 nm wavelength range to quantify vegetation and atmospheric constituents. Other multispectral missions (shown at top) do not provide the spectral coverage or continuity to achieve Flora mission goals.
Flora is a global mission, with a nominal spatial sampling resolution of 45 m. Using a 90 km instrument swath, measurements are made every 31 days, and specific products are made available on a 90 day (quarterly) basis. There is very little, if any, competition with the commercial remote sensing sector for such global measurements at these resolutions. There is no other mission in progress or planned to deliver products similar to Flora (Fig. 2). Finally, Flora utilizes technologies that are well tested and low risk in both sensor and spacecraft development and scientific algorithm readiness. (5) Mission Measurements Flora employs high-fidelity imaging spectroscopy to measure the distribution of biological materials and vegetation chemical and physiological properties at high spatial resolution on a global basis. There are four core Flora deliverables, addressing three science measurement objectives (Figs. 1-2):
1) Calibrated full-optical range surface reflectance: Measurement units are percentage hemispherical-directional reflectance from 400 to 2500 nm in 10 nm increments (FWHM).
2) Fractional cover of biological materials: includes live, dead and senescent vegetation, bare substrates, and snow/ice; High accuracy, automated measurements require contiguous spectra in the 705-750 nm and 2000-2500 nm ranges; Measurement units are meters squared of material over the land surface.
3) Canopy water content: Automated measurements require contiguous spectra in the 800-1250 nm range; Measurement units are millimeters and kg of precipitable water per area.
4) Canopy light-use efficiency (carbon uptake efficiency): units are grams of CO2 fixed per unit of absorbed photosynthetic energy (e.g., megajoules PAR). Automated measurements require contiguous spectra in the 400-750 nm and 1500-2500 nm ranges.
In addition, there are three high-level Flora science measurement objectives, derived from the core products (Fig. 1):
1) Plant functional types: employs Flora core deliverables 1-4. 2) Fire fuels and fuel moisture: employs Flora core deliverables 2-3. 3) Ecological disturbance: employs Flora core deliverables 1-4.
(6) Measurement Approach and Significance Calibrated full-optical range surface reflectance: Success of the Flora mission hinges upon the acquisition of highly calibrated, full optical spectrum (400-2500 nm) measurements of apparent land surface reflectance. All other Flora products, and potentially new products to be derived later or after the mission, require these high-quality full-range reflectance data. Instrument calibration and atmospheric correction are key steps in deriving these data from measured at-sensor radiances. Unique to spectroscopic observations, atmospheric correction of imaging spectrometer data is accomplished in part by direct observation of the spectral absorption characteristics of water vapor (17). In addition, corrections such as for Rayleigh scattering, CO2 and N2O absorption are mechanistically derived because the spectroscopic measurements contain the required information (Fig. 2). Some allowances must be
4
Bioclimatic Zone
Sub-T
Wet
Forest
LM W
et Fore
st
LM M
oist F
orest
Sub-T
Mois
t Fore
st
M Wet
Forest
M Mois
t Fore
st
Sub-T
Dry
Forest
LM Tho
rn Step
pe
LM D
ry Fore
st
Sub-T
Thorn
Forest
T Thorn
Forest
M Steppe
T Des
ert B
ush
Sub-al
pine/A
lpine
Frac
tiona
l Cov
er (%
)
0.0
0.2
0.4
0.6
0.8
1.0
PV NPV Bare
PV spectra
NPV spectra
BARE spectra
Bioclimatic Zone
Sub-T
Wet
Forest
LM W
et Fore
st
LM M
oist F
orest
Sub-T
Mois
t Fore
st
M Wet
Forest
M Mois
t Fore
st
Sub-T
Dry
Forest
LM Tho
rn Step
pe
LM D
ry Fore
st
Sub-T
Thorn
Forest
T Thorn
Forest
M Steppe
T Des
ert B
ush
Sub-al
pine/A
lpine
Frac
tiona
l Cov
er (%
)
0.0
0.2
0.4
0.6
0.8
1.0
PV NPV Bare
PV spectra
NPV spectra
BARE spectra
Fig. 3. Flora’s contiguous shortwave-IR spectra (left panels) are needed to determine the lateral cover of biological materials (e.g., PV, NPV, bare) on a fully automated basis. This approach yields detailed cover estimates across 14 biome types (center panel), with proven accuracy and precision (right panels).
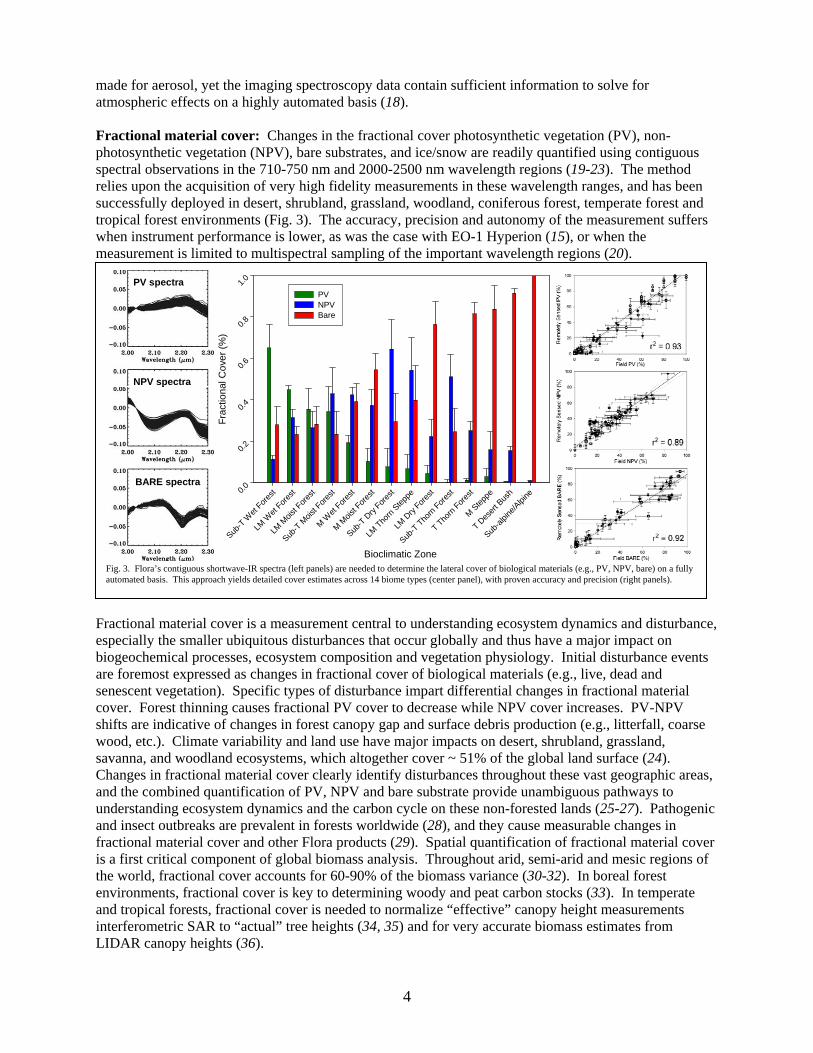
made for aerosol, yet the imaging spectroscopy data contain sufficient information to solve for atmospheric effects on a highly automated basis (18). Fractional material cover: Changes in the fractional cover photosynthetic vegetation (PV), non-photosynthetic vegetation (NPV), bare substrates, and ice/snow are readily quantified using contiguous spectral observations in the 710-750 nm and 2000-2500 nm wavelength regions (19-23). The method relies upon the acquisition of very high fidelity measurements in these wavelength ranges, and has been successfully deployed in desert, shrubland, grassland, woodland, coniferous forest, temperate forest and tropical forest environments (Fig. 3). The accuracy, precision and autonomy of the measurement suffers when instrument performance is lower, as was the case with EO-1 Hyperion (15), or when the measurement is limited to multispectral sampling of the important wavelength regions (20).
Fractional material cover is a measurement central to understanding ecosystem dynamics and disturbance, especially the smaller ubiquitous disturbances that occur globally and thus have a major impact on biogeochemical processes, ecosystem composition and vegetation physiology. Initial disturbance events are foremost expressed as changes in fractional cover of biological materials (e.g., live, dead and senescent vegetation). Specific types of disturbance impart differential changes in fractional material cover. Forest thinning causes fractional PV cover to decrease while NPV cover increases. PV-NPV shifts are indicative of changes in forest canopy gap and surface debris production (e.g., litterfall, coarse wood, etc.). Climate variability and land use have major impacts on desert, shrubland, grassland, savanna, and woodland ecosystems, which altogether cover ~ 51% of the global land surface (24). Changes in fractional material cover clearly identify disturbances throughout these vast geographic areas, and the combined quantification of PV, NPV and bare substrate provide unambiguous pathways to understanding ecosystem dynamics and the carbon cycle on these non-forested lands (25-27). Pathogenic and insect outbreaks are prevalent in forests worldwide (28), and they cause measurable changes in fractional material cover and other Flora products (29). Spatial quantification of fractional material cover is a first critical component of global biomass analysis. Throughout arid, semi-arid and mesic regions of the world, fractional cover accounts for 60-90% of the biomass variance (30-32). In boreal forest environments, fractional cover is key to determining woody and peat carbon stocks (33). In temperate and tropical forests, fractional cover is needed to normalize “effective” canopy height measurements interferometric SAR to “actual” tree heights (34, 35) and for very accurate biomass estimates from LIDAR canopy heights (36).
5
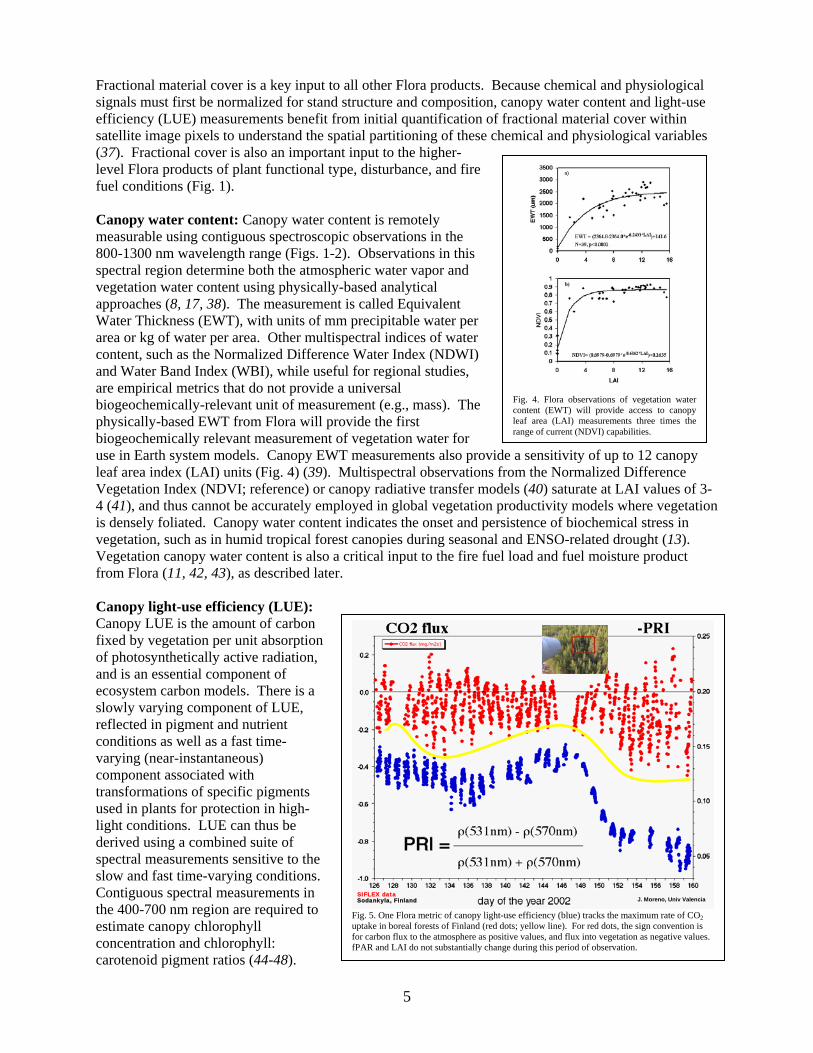
Fig. 4. Flora observations of vegetation water content (EWT) will provide access to canopy leaf area (LAI) measurements three times the range of current (NDVI) capabilities.
Sodankyla, FinlandSIFLEX data
J. Moreno, Univ ValenciaSodankyla, FinlandSIFLEX data
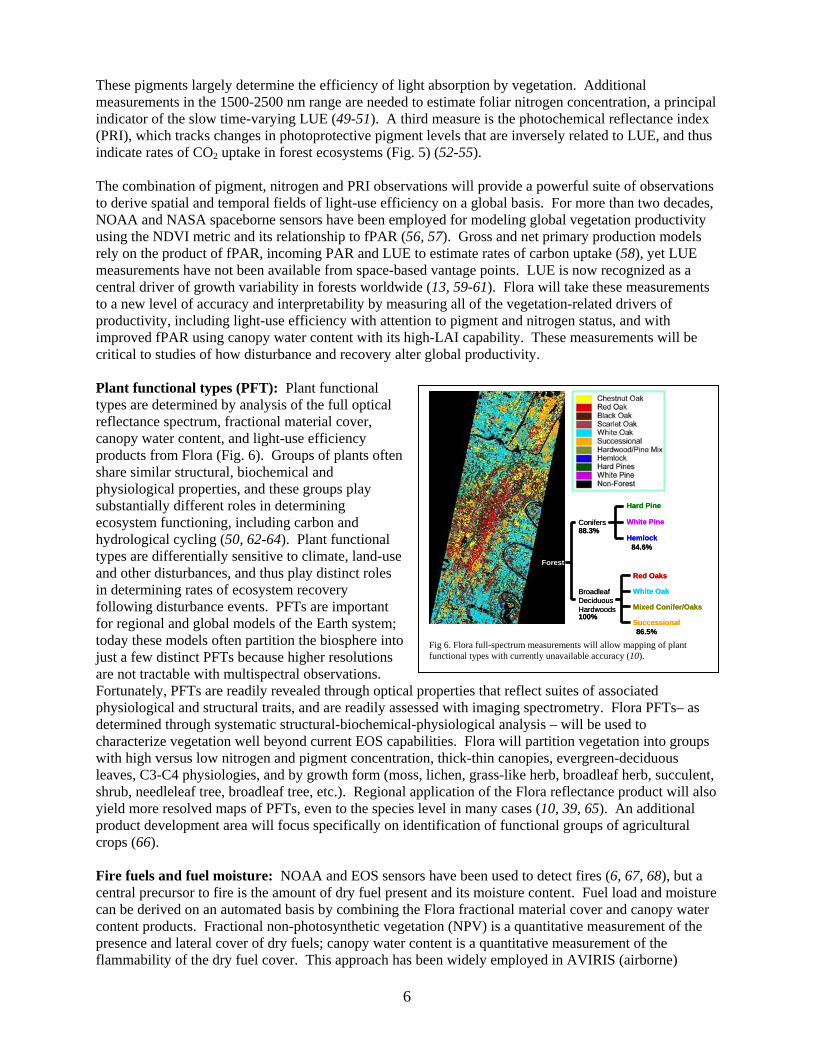
J. Moreno, Univ Valencia Fig. 5. One Flora metric of canopy light-use efficiency (blue) tracks the maximum rate of CO2 uptake in boreal forests of Finland (red dots; yellow line). For red dots, the sign convention is for carbon flux to the atmosphere as positive values, and flux into vegetation as negative values. fPAR and LAI do not substantially change during this period of observation.
Fractional material cover is a key input to all other Flora products. Because chemical and physiological signals must first be normalized for stand structure and composition, canopy water content and light-use efficiency (LUE) measurements benefit from initial quantification of fractional material cover within satellite image pixels to understand the spatial partitioning of these chemical and physiological variables (37). Fractional cover is also an important input to the higher-level Flora products of plant functional type, disturbance, and fire fuel conditions (Fig. 1). Canopy water content: Canopy water content is remotely measurable using contiguous spectroscopic observations in the 800-1300 nm wavelength range (Figs. 1-2). Observations in this spectral region determine both the atmospheric water vapor and vegetation water content using physically-based analytical approaches (8, 17, 38). The measurement is called Equivalent Water Thickness (EWT), with units of mm precipitable water per area or kg of water per area. Other multispectral indices of water content, such as the Normalized Difference Water Index (NDWI) and Water Band Index (WBI), while useful for regional studies, are empirical metrics that do not provide a universal biogeochemically-relevant unit of measurement (e.g., mass). The physically-based EWT from Flora will provide the first biogeochemically relevant measurement of vegetation water for use in Earth system models. Canopy EWT measurements also provide a sensitivity of up to 12 canopy leaf area index (LAI) units (Fig. 4) (39). Multispectral observations from the Normalized Difference Vegetation Index (NDVI; reference) or canopy radiative transfer models (40) saturate at LAI values of 3-4 (41), and thus cannot be accurately employed in global vegetation productivity models where vegetation is densely foliated. Canopy water content indicates the onset and persistence of biochemical stress in vegetation, such as in humid tropical forest canopies during seasonal and ENSO-related drought (13). Vegetation canopy water content is also a critical input to the fire fuel load and fuel moisture product from Flora (11, 42, 43), as described later. Canopy light-use efficiency (LUE): Canopy LUE is the amount of carbon fixed by vegetation per unit absorption of photosynthetically active radiation, and is an essential component of ecosystem carbon models. There is a slowly varying component of LUE, reflected in pigment and nutrient conditions as well as a fast time-varying (near-instantaneous) component associated with transformations of specific pigments used in plants for protection in high-light conditions. LUE can thus be derived using a combined suite of spectral measurements sensitive to the slow and fast time-varying conditions. Contiguous spectral measurements in the 400-700 nm region are required to estimate canopy chlorophyll concentration and chlorophyll: carotenoid pigment ratios (44-48).
6
Forest
Hard Pine
White Pine
Hemlock
Red Oaks
White Oak
Mixed Conifer/Oaks
Successional
Conifers
BroadleafDeciduousHardwoods
88.3%
100%
84.6%
86.5%
Forest
Hard Pine
White Pine
Hemlock
Red Oaks
White Oak
Mixed Conifer/Oaks
Successional
Conifers
BroadleafDeciduousHardwoods
88.3%
100%
84.6%
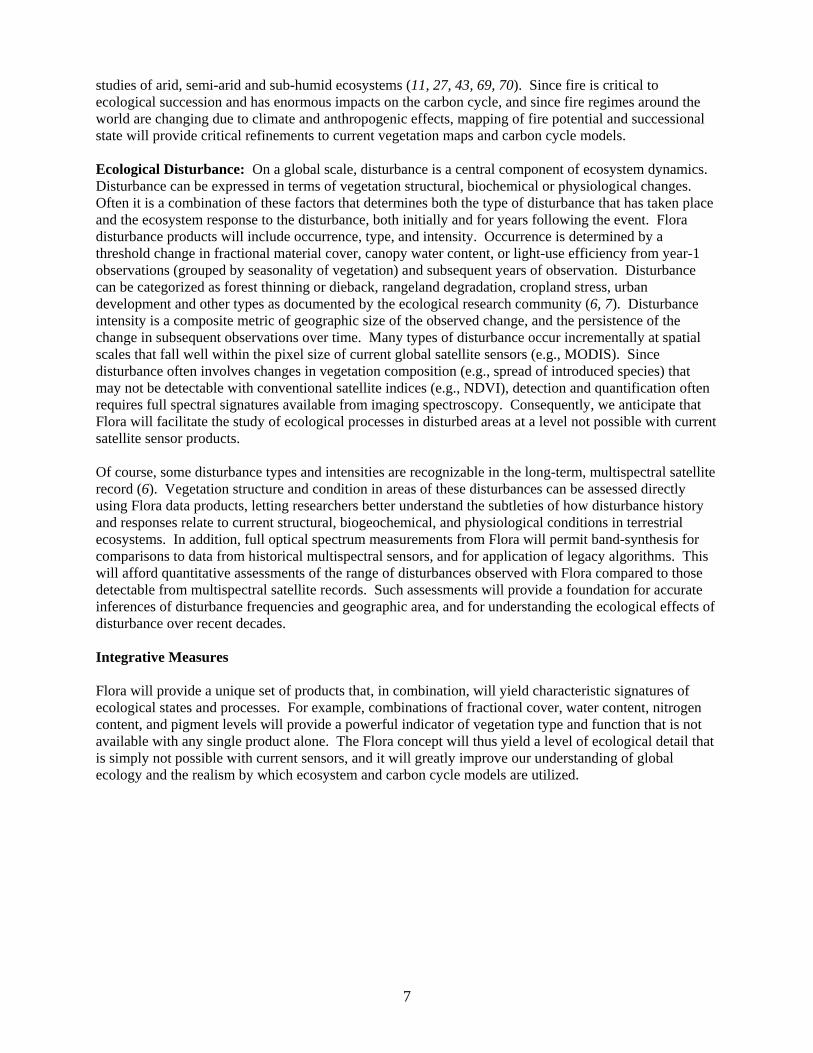
86.5% Fig 6. Flora full-spectrum measurements will allow mapping of plant functional types with currently unavailable accuracy (10).
These pigments largely determine the efficiency of light absorption by vegetation. Additional measurements in the 1500-2500 nm range are needed to estimate foliar nitrogen concentration, a principal indicator of the slow time-varying LUE (49-51). A third measure is the photochemical reflectance index (PRI), which tracks changes in photoprotective pigment levels that are inversely related to LUE, and thus indicate rates of CO2 uptake in forest ecosystems (Fig. 5) (52-55). The combination of pigment, nitrogen and PRI observations will provide a powerful suite of observations to derive spatial and temporal fields of light-use efficiency on a global basis. For more than two decades, NOAA and NASA spaceborne sensors have been employed for modeling global vegetation productivity using the NDVI metric and its relationship to fPAR (56, 57). Gross and net primary production models rely on the product of fPAR, incoming PAR and LUE to estimate rates of carbon uptake (58), yet LUE measurements have not been available from space-based vantage points. LUE is now recognized as a central driver of growth variability in forests worldwide (13, 59-61). Flora will take these measurements to a new level of accuracy and interpretability by measuring all of the vegetation-related drivers of productivity, including light-use efficiency with attention to pigment and nitrogen status, and with improved fPAR using canopy water content with its high-LAI capability. These measurements will be critical to studies of how disturbance and recovery alter global productivity. Plant functional types (PFT): Plant functional types are determined by analysis of the full optical reflectance spectrum, fractional material cover, canopy water content, and light-use efficiency products from Flora (Fig. 6). Groups of plants often share similar structural, biochemical and physiological properties, and these groups play substantially different roles in determining ecosystem functioning, including carbon and hydrological cycling (50, 62-64). Plant functional types are differentially sensitive to climate, land-use and other disturbances, and thus play distinct roles in determining rates of ecosystem recovery following disturbance events. PFTs are important for regional and global models of the Earth system; today these models often partition the biosphere into just a few distinct PFTs because higher resolutions are not tractable with multispectral observations. Fortunately, PFTs are readily revealed through optical properties that reflect suites of associated physiological and structural traits, and are readily assessed with imaging spectrometry. Flora PFTs– as determined through systematic structural-biochemical-physiological analysis – will be used to characterize vegetation well beyond current EOS capabilities. Flora will partition vegetation into groups with high versus low nitrogen and pigment concentration, thick-thin canopies, evergreen-deciduous leaves, C3-C4 physiologies, and by growth form (moss, lichen, grass-like herb, broadleaf herb, succulent, shrub, needleleaf tree, broadleaf tree, etc.). Regional application of the Flora reflectance product will also yield more resolved maps of PFTs, even to the species level in many cases (10, 39, 65). An additional product development area will focus specifically on identification of functional groups of agricultural crops (66). Fire fuels and fuel moisture: NOAA and EOS sensors have been used to detect fires (6, 67, 68), but a central precursor to fire is the amount of dry fuel present and its moisture content. Fuel load and moisture can be derived on an automated basis by combining the Flora fractional material cover and canopy water content products. Fractional non-photosynthetic vegetation (NPV) is a quantitative measurement of the presence and lateral cover of dry fuels; canopy water content is a quantitative measurement of the flammability of the dry fuel cover. This approach has been widely employed in AVIRIS (airborne)
7
studies of arid, semi-arid and sub-humid ecosystems (11, 27, 43, 69, 70). Since fire is critical to ecological succession and has enormous impacts on the carbon cycle, and since fire regimes around the world are changing due to climate and anthropogenic effects, mapping of fire potential and successional state will provide critical refinements to current vegetation maps and carbon cycle models. Ecological Disturbance: On a global scale, disturbance is a central component of ecosystem dynamics. Disturbance can be expressed in terms of vegetation structural, biochemical or physiological changes. Often it is a combination of these factors that determines both the type of disturbance that has taken place and the ecosystem response to the disturbance, both initially and for years following the event. Flora disturbance products will include occurrence, type, and intensity. Occurrence is determined by a threshold change in fractional material cover, canopy water content, or light-use efficiency from year-1 observations (grouped by seasonality of vegetation) and subsequent years of observation. Disturbance can be categorized as forest thinning or dieback, rangeland degradation, cropland stress, urban development and other types as documented by the ecological research community (6, 7). Disturbance intensity is a composite metric of geographic size of the observed change, and the persistence of the change in subsequent observations over time. Many types of disturbance occur incrementally at spatial scales that fall well within the pixel size of current global satellite sensors (e.g., MODIS). Since disturbance often involves changes in vegetation composition (e.g., spread of introduced species) that may not be detectable with conventional satellite indices (e.g., NDVI), detection and quantification often requires full spectral signatures available from imaging spectroscopy. Consequently, we anticipate that Flora will facilitate the study of ecological processes in disturbed areas at a level not possible with current satellite sensor products. Of course, some disturbance types and intensities are recognizable in the long-term, multispectral satellite record (6). Vegetation structure and condition in areas of these disturbances can be assessed directly using Flora data products, letting researchers better understand the subtleties of how disturbance history and responses relate to current structural, biogeochemical, and physiological conditions in terrestrial ecosystems. In addition, full optical spectrum measurements from Flora will permit band-synthesis for comparisons to data from historical multispectral sensors, and for application of legacy algorithms. This will afford quantitative assessments of the range of disturbances observed with Flora compared to those detectable from multispectral satellite records. Such assessments will provide a foundation for accurate inferences of disturbance frequencies and geographic area, and for understanding the ecological effects of disturbance over recent decades. Integrative Measures Flora will provide a unique set of products that, in combination, will yield characteristic signatures of ecological states and processes. For example, combinations of fractional cover, water content, nitrogen content, and pigment levels will provide a powerful indicator of vegetation type and function that is not available with any single product alone. The Flora concept will thus yield a level of ecological detail that is simply not possible with current sensors, and it will greatly improve our understanding of global ecology and the realism by which ecosystem and carbon cycle models are utilized.
8
Fig. 7. Flora optical design with unobscured, 3-mirror telescope and three f/2.7 Offner spectrometers to provide high precision, high uniformity, well-calibrated spectra in the solar reflected spectral range, with 90 km swath and 45 m spatial resolution.
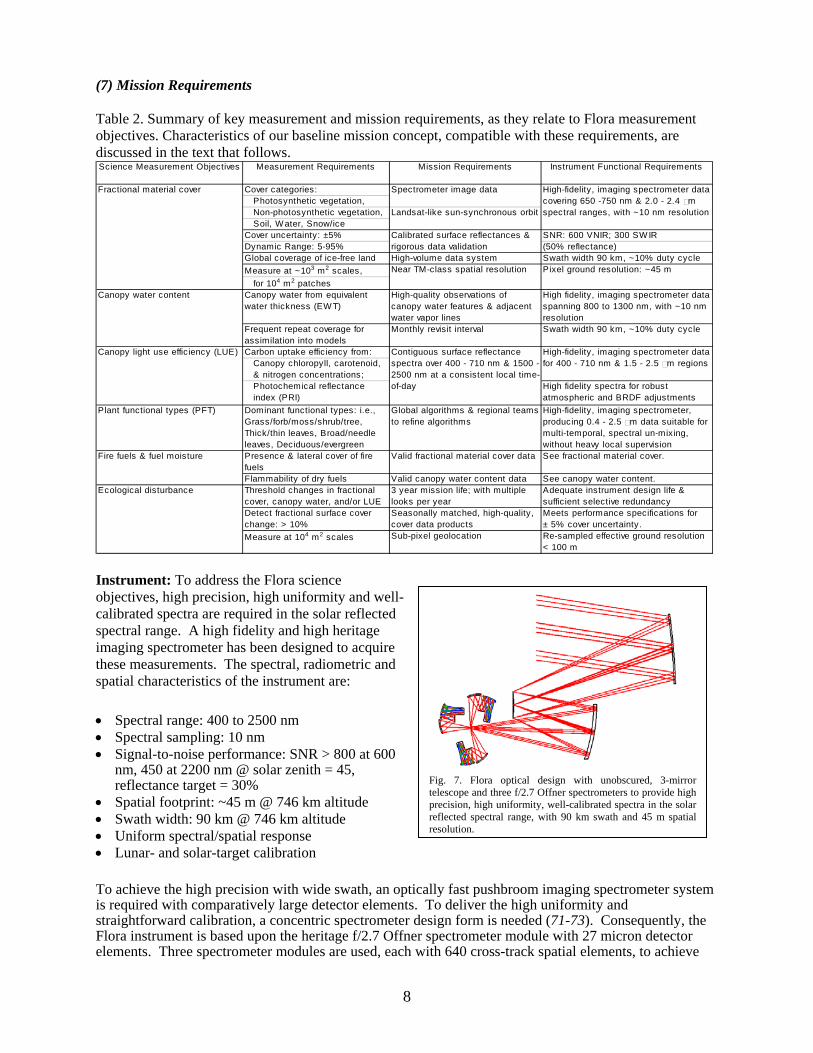
(7) Mission Requirements Table 2. Summary of key measurement and mission requirements, as they relate to Flora measurement objectives. Characteristics of our baseline mission concept, compatible with these requirements, are discussed in the text that follows.
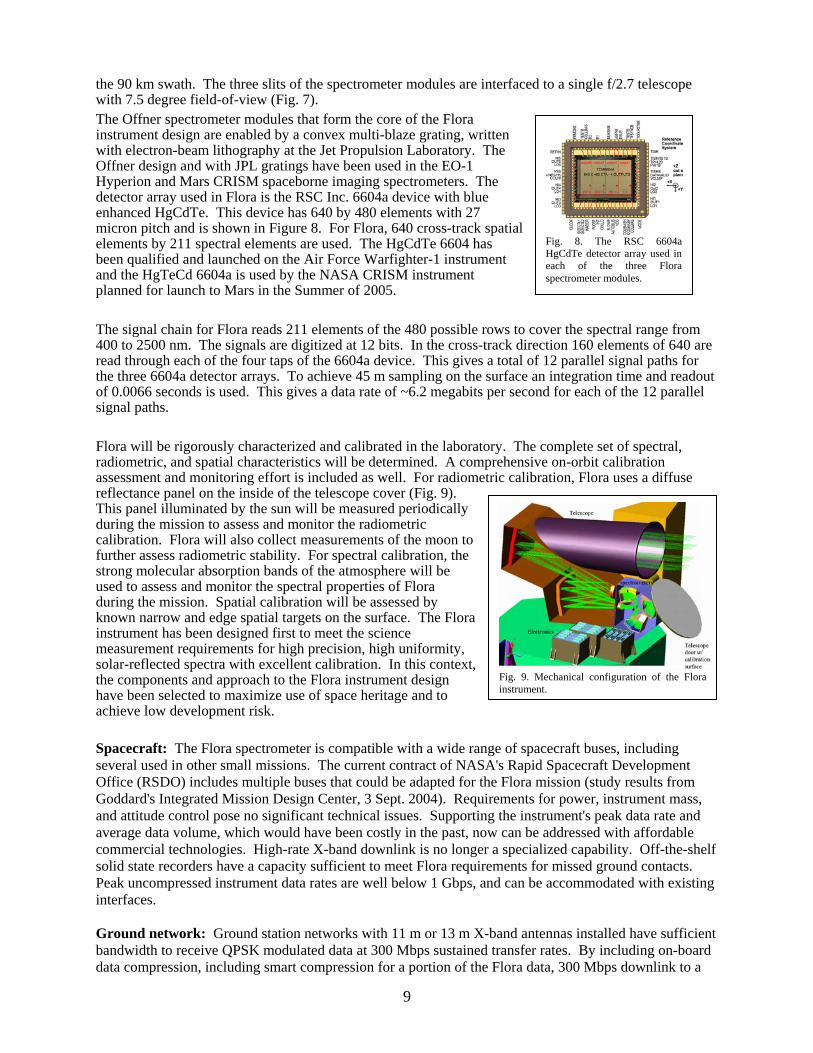
Instrument: To address the Flora science objectives, high precision, high uniformity and well-calibrated spectra are required in the solar reflected spectral range. A high fidelity and high heritage imaging spectrometer has been designed to acquire these measurements. The spectral, radiometric and spatial characteristics of the instrument are: • Spectral range: 400 to 2500 nm • Spectral sampling: 10 nm • Signal-to-noise performance: SNR > 800 at 600
nm, 450 at 2200 nm @ solar zenith = 45, reflectance target = 30%
• Spatial footprint: ~45 m @ 746 km altitude • Swath width: 90 km @ 746 km altitude • Uniform spectral/spatial response • Lunar- and solar-target calibration To achieve the high precision with wide swath, an optically fast pushbroom imaging spectrometer system is required with comparatively large detector elements. To deliver the high uniformity and straightforward calibration, a concentric spectrometer design form is needed (71-73). Consequently, the Flora instrument is based upon the heritage f/2.7 Offner spectrometer module with 27 micron detector elements. Three spectrometer modules are used, each with 640 cross-track spatial elements, to achieve
Science Measurement Objectives Measurement Requirements Mission Requirements Instrument Functional Requirements
Cover categories: Photosynthetic vegetation, Non-photosynthetic vegetation,Soil, Water, Snow/ice
Cover uncertainty: ±5% SNR: 600 VNIR; 300 SW IR Dynamic Range: 5-95% (50% reflectance)Global coverage of ice-free land High-volume data system Swath width 90 km, ~10% duty cycleMeasure at ~103 m2 scales,
for 104 m2 patchesCanopy water from equivalent water thickness (EW T)
High-quality observations of canopy water features & adjacent water vapor lines
High fidelity, imaging spectrometer data spanning 800 to 1300 nm, with ~10 nm resolution
Frequent repeat coverage for assimilation into models
Monthly revisit interval Swath width 90 km, ~10% duty cycle
Carbon uptake efficiency from: Canopy chloropyll, carotenoid, & nitrogen concentrations;Photochemical reflectance index (PRI)
High fidelity spectra for robust atmospheric and BRDF adjustments
Plant functional types (PFT) Dominant functional types: i.e., Grass/forb/moss/shrub/tree, Thick/thin leaves, Broad/needle leaves, Deciduous/evergreen
Global algorithms & regional teams to refine algorithms
High-fidelity, imaging spectrometer, producing 0.4 - 2.5 m data suitable for multi-temporal, spectral un-mixing, without heavy local supervision
Presence & lateral cover of fire fuels
Valid fractional material cover data See fractional material cover.
Flammability of dry fuels Valid canopy water content data See canopy water content.Threshold changes in fractional cover, canopy water, and/or LUE
3 year mission life; with multiple looks per year
Adequate instrument design life & sufficient selective redundancy
Detect fractional surface cover change: > 10%
Seasonally matched, high-quality, cover data products
Meets performance specifications for ± 5% cover uncertainty.
Measure at 104 m2 scales Sub-pixel geolocation Re-sampled effective ground resolution < 100 m
Contiguous surface reflectance spectra over 400 - 710 nm & 1500 - 2500 nm at a consistent local time-of-day
High-fidelity, imaging spectrometer data for 400 - 710 nm & 1.5 - 2.5 m regions
Fractional material cover Spectrometer image data High-fidelity, imaging spectrometer data covering 650 -750 nm & 2.0 - 2.4 m spectral ranges, with ~10 nm resolutionLandsat-like sun-synchronous orbit
Calibrated surface reflectances & rigorous data validation
Near TM-class spatial resolution Pixel ground resolution: ~45 m
Ecological disturbance
Fire fuels & fuel moisture
Canopy water content
Canopy light use efficiency (LUE)
9
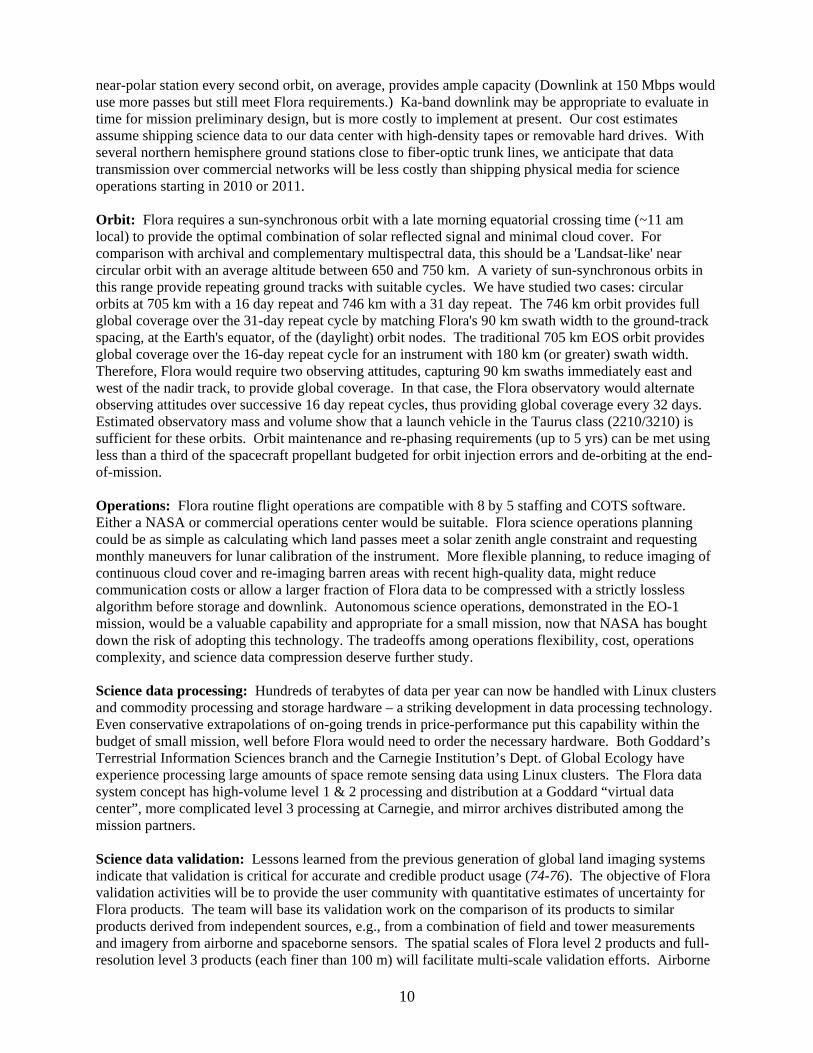
Fig. 8. The RSC 6604a HgCdTe detector array used in each of the three Flora spectrometer modules.
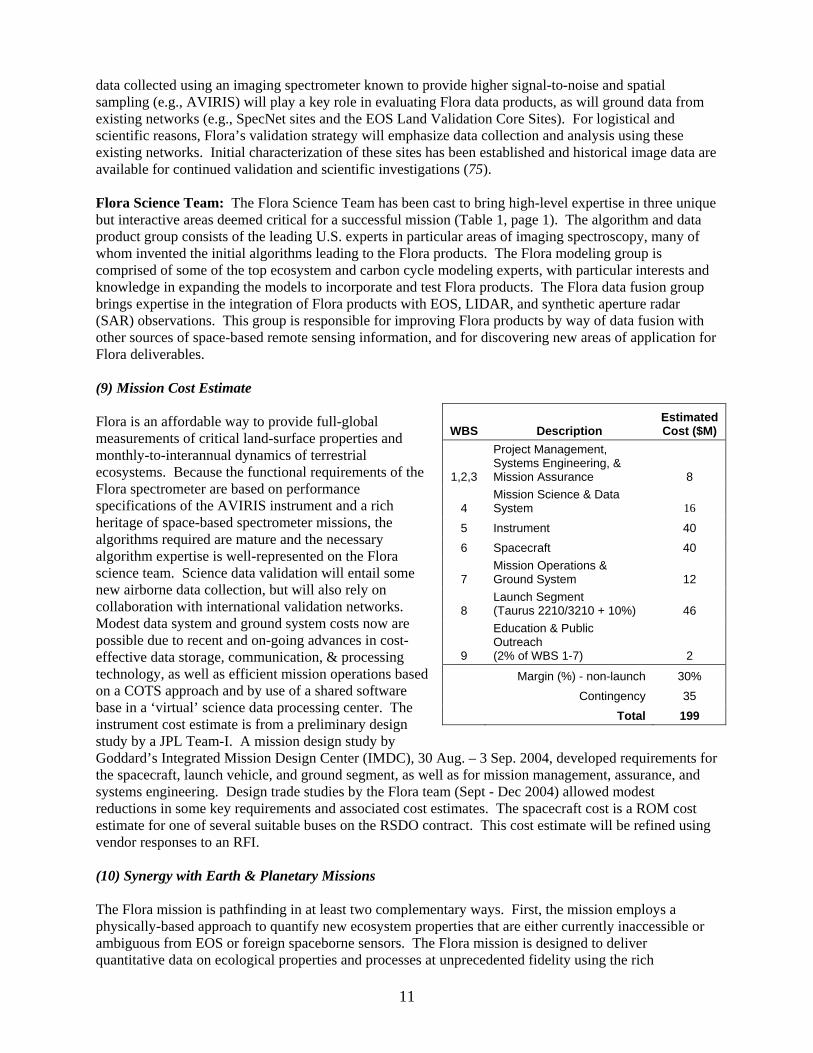
Fig. 9. Mechanical configuration of the Flora instrument.
the 90 km swath. The three slits of the spectrometer modules are interfaced to a single f/2.7 telescope with 7.5 degree field-of-view (Fig. 7). The Offner spectrometer modules that form the core of the Flora instrument design are enabled by a convex multi-blaze grating, written with electron-beam lithography at the Jet Propulsion Laboratory. The Offner design and with JPL gratings have been used in the EO-1 Hyperion and Mars CRISM spaceborne imaging spectrometers. The detector array used in Flora is the RSC Inc. 6604a device with blue enhanced HgCdTe. This device has 640 by 480 elements with 27 micron pitch and is shown in Figure 8. For Flora, 640 cross-track spatial elements by 211 spectral elements are used. The HgCdTe 6604 has been qualified and launched on the Air Force Warfighter-1 instrument and the HgTeCd 6604a is used by the NASA CRISM instrument planned for launch to Mars in the Summer of 2005. The signal chain for Flora reads 211 elements of the 480 possible rows to cover the spectral range from 400 to 2500 nm. The signals are digitized at 12 bits. In the cross-track direction 160 elements of 640 are read through each of the four taps of the 6604a device. This gives a total of 12 parallel signal paths for the three 6604a detector arrays. To achieve 45 m sampling on the surface an integration time and readout of 0.0066 seconds is used. This gives a data rate of ~6.2 megabits per second for each of the 12 parallel signal paths. Flora will be rigorously characterized and calibrated in the laboratory. The complete set of spectral, radiometric, and spatial characteristics will be determined. A comprehensive on-orbit calibration assessment and monitoring effort is included as well. For radiometric calibration, Flora uses a diffuse reflectance panel on the inside of the telescope cover (Fig. 9). This panel illuminated by the sun will be measured periodically during the mission to assess and monitor the radiometric calibration. Flora will also collect measurements of the moon to further assess radiometric stability. For spectral calibration, the strong molecular absorption bands of the atmosphere will be used to assess and monitor the spectral properties of Flora during the mission. Spatial calibration will be assessed by known narrow and edge spatial targets on the surface. The Flora instrument has been designed first to meet the science measurement requirements for high precision, high uniformity, solar-reflected spectra with excellent calibration. In this context, the components and approach to the Flora instrument design have been selected to maximize use of space heritage and to achieve low development risk. Spacecraft: The Flora spectrometer is compatible with a wide range of spacecraft buses, including several used in other small missions. The current contract of NASA's Rapid Spacecraft Development Office (RSDO) includes multiple buses that could be adapted for the Flora mission (study results from Goddard's Integrated Mission Design Center, 3 Sept. 2004). Requirements for power, instrument mass, and attitude control pose no significant technical issues. Supporting the instrument's peak data rate and average data volume, which would have been costly in the past, now can be addressed with affordable commercial technologies. High-rate X-band downlink is no longer a specialized capability. Off-the-shelf solid state recorders have a capacity sufficient to meet Flora requirements for missed ground contacts. Peak uncompressed instrument data rates are well below 1 Gbps, and can be accommodated with existing interfaces. Ground network: Ground station networks with 11 m or 13 m X-band antennas installed have sufficient bandwidth to receive QPSK modulated data at 300 Mbps sustained transfer rates. By including on-board data compression, including smart compression for a portion of the Flora data, 300 Mbps downlink to a
10
near-polar station every second orbit, on average, provides ample capacity (Downlink at 150 Mbps would use more passes but still meet Flora requirements.) Ka-band downlink may be appropriate to evaluate in time for mission preliminary design, but is more costly to implement at present. Our cost estimates assume shipping science data to our data center with high-density tapes or removable hard drives. With several northern hemisphere ground stations close to fiber-optic trunk lines, we anticipate that data transmission over commercial networks will be less costly than shipping physical media for science operations starting in 2010 or 2011. Orbit: Flora requires a sun-synchronous orbit with a late morning equatorial crossing time (~11 am local) to provide the optimal combination of solar reflected signal and minimal cloud cover. For comparison with archival and complementary multispectral data, this should be a 'Landsat-like' near circular orbit with an average altitude between 650 and 750 km. A variety of sun-synchronous orbits in this range provide repeating ground tracks with suitable cycles. We have studied two cases: circular orbits at 705 km with a 16 day repeat and 746 km with a 31 day repeat. The 746 km orbit provides full global coverage over the 31-day repeat cycle by matching Flora's 90 km swath width to the ground-track spacing, at the Earth's equator, of the (daylight) orbit nodes. The traditional 705 km EOS orbit provides global coverage over the 16-day repeat cycle for an instrument with 180 km (or greater) swath width. Therefore, Flora would require two observing attitudes, capturing 90 km swaths immediately east and west of the nadir track, to provide global coverage. In that case, the Flora observatory would alternate observing attitudes over successive 16 day repeat cycles, thus providing global coverage every 32 days. Estimated observatory mass and volume show that a launch vehicle in the Taurus class (2210/3210) is sufficient for these orbits. Orbit maintenance and re-phasing requirements (up to 5 yrs) can be met using less than a third of the spacecraft propellant budgeted for orbit injection errors and de-orbiting at the end-of-mission. Operations: Flora routine flight operations are compatible with 8 by 5 staffing and COTS software. Either a NASA or commercial operations center would be suitable. Flora science operations planning could be as simple as calculating which land passes meet a solar zenith angle constraint and requesting monthly maneuvers for lunar calibration of the instrument. More flexible planning, to reduce imaging of continuous cloud cover and re-imaging barren areas with recent high-quality data, might reduce communication costs or allow a larger fraction of Flora data to be compressed with a strictly lossless algorithm before storage and downlink. Autonomous science operations, demonstrated in the EO-1 mission, would be a valuable capability and appropriate for a small mission, now that NASA has bought down the risk of adopting this technology. The tradeoffs among operations flexibility, cost, operations complexity, and science data compression deserve further study. Science data processing: Hundreds of terabytes of data per year can now be handled with Linux clusters and commodity processing and storage hardware – a striking development in data processing technology. Even conservative extrapolations of on-going trends in price-performance put this capability within the budget of small mission, well before Flora would need to order the necessary hardware. Both Goddard’s Terrestrial Information Sciences branch and the Carnegie Institution’s Dept. of Global Ecology have experience processing large amounts of space remote sensing data using Linux clusters. The Flora data system concept has high-volume level 1 & 2 processing and distribution at a Goddard “virtual data center”, more complicated level 3 processing at Carnegie, and mirror archives distributed among the mission partners. Science data validation: Lessons learned from the previous generation of global land imaging systems indicate that validation is critical for accurate and credible product usage (74-76). The objective of Flora validation activities will be to provide the user community with quantitative estimates of uncertainty for Flora products. The team will base its validation work on the comparison of its products to similar products derived from independent sources, e.g., from a combination of field and tower measurements and imagery from airborne and spaceborne sensors. The spatial scales of Flora level 2 products and full-resolution level 3 products (each finer than 100 m) will facilitate multi-scale validation efforts. Airborne
11
data collected using an imaging spectrometer known to provide higher signal-to-noise and spatial sampling (e.g., AVIRIS) will play a key role in evaluating Flora data products, as will ground data from existing networks (e.g., SpecNet sites and the EOS Land Validation Core Sites). For logistical and scientific reasons, Flora’s validation strategy will emphasize data collection and analysis using these existing networks. Initial characterization of these sites has been established and historical image data are available for continued validation and scientific investigations (75). Flora Science Team: The Flora Science Team has been cast to bring high-level expertise in three unique but interactive areas deemed critical for a successful mission (Table 1, page 1). The algorithm and data product group consists of the leading U.S. experts in particular areas of imaging spectroscopy, many of whom invented the initial algorithms leading to the Flora products. The Flora modeling group is comprised of some of the top ecosystem and carbon cycle modeling experts, with particular interests and knowledge in expanding the models to incorporate and test Flora products. The Flora data fusion group brings expertise in the integration of Flora products with EOS, LIDAR, and synthetic aperture radar (SAR) observations. This group is responsible for improving Flora products by way of data fusion with other sources of space-based remote sensing information, and for discovering new areas of application for Flora deliverables. (9) Mission Cost Estimate Flora is an affordable way to provide full-global measurements of critical land-surface properties and monthly-to-interannual dynamics of terrestrial ecosystems. Because the functional requirements of the Flora spectrometer are based on performance specifications of the AVIRIS instrument and a rich heritage of space-based spectrometer missions, the algorithms required are mature and the necessary algorithm expertise is well-represented on the Flora science team. Science data validation will entail some new airborne data collection, but will also rely on collaboration with international validation networks. Modest data system and ground system costs now are possible due to recent and on-going advances in cost-effective data storage, communication, & processing technology, as well as efficient mission operations based on a COTS approach and by use of a shared software base in a ‘virtual’ science data processing center. The instrument cost estimate is from a preliminary design study by a JPL Team-I. A mission design study by Goddard’s Integrated Mission Design Center (IMDC), 30 Aug. – 3 Sep. 2004, developed requirements for the spacecraft, launch vehicle, and ground segment, as well as for mission management, assurance, and systems engineering. Design trade studies by the Flora team (Sept - Dec 2004) allowed modest reductions in some key requirements and associated cost estimates. The spacecraft cost is a ROM cost estimate for one of several suitable buses on the RSDO contract. This cost estimate will be refined using vendor responses to an RFI. (10) Synergy with Earth & Planetary Missions The Flora mission is pathfinding in at least two complementary ways. First, the mission employs a physically-based approach to quantify new ecosystem properties that are either currently inaccessible or ambiguous from EOS or foreign spaceborne sensors. The Flora mission is designed to deliver quantitative data on ecological properties and processes at unprecedented fidelity using the rich
WBS Description Estimated Cost ($M)
1,2,3
Project Management, Systems Engineering, & Mission Assurance 8
4 Mission Science & Data System 16
5 Instrument 40
6 Spacecraft 40
7 Mission Operations & Ground System 12
8 Launch Segment (Taurus 2210/3210 + 10%) 46
9
Education & Public Outreach (2% of WBS 1-7) 2
Margin (%) - non-launch 30% Contingency 35
Total 199
12
information base available by way of full-spectrum optical analysis. Second, Flora is a high-fidelity imaging spectrometer mission that provides a new level of spectroscopic measurement currently unavailable on Earth and planetary missions such as EO-1 Hyperion, Mars CRISM, and Moon M3. These spectrometers are low- to moderate-fidelity, and thus will not resolve the detailed chemical composition of targets as Flora will deliver. The Flora spectrometer will have a high level of uniformity, stability and signal-to-noise performance, which directly facilitates new measurements – observations of targets that will be left undetected and non-quantifiable by current and planned imaging spectrometers. Future planetary imaging spectroscopy missions will thus directly benefit from the scientific and engineering heritage brought forward by the Flora Earth System Science Pathfinder mission. (11) Acknowledgements We are grateful to members of the Flora Science Team (Table 1) who contributed portions of this white paper, and also for the design insights and hard work offered by other members of the Flora mission proposal team and by supporting technical teams at the Goddard Space Flight Center and the Jet Propulsion Laboratory. G. Gadwall, D. Mandl, and P. Mouroulis supplied expertise vital to defining the implementation approach outlined here. We thank Jose Moreno for use of Figure 3. (12) References 1. R. B. Myneni, et al., Nature 386, 698 (1997). 2. R. S. DeFries, et al., Global Biogeochemical Cycles (1999). 3. S. L. Ustin, et al., Bioscience 54, 523 (2004). 4. C. A. Wessman, G. P. Asner, in Successes, Limitations and Frontiers in Ecosystem Ecology P.
Groffman, M. Pace, Eds. (Springer, 1998) pp. 346-371. 5. P. M. Vitousek, et al., Science 277, 494 (1997). 6. G. Gutman et al., Eds., Observing, Monitoring and Understanding Trajectories of Change on the
Earth's Surface, vol. 6 (Springer, 2004), pp. 461. 7. R. S. DeFries, G. P. Asner, R. A. Houghton, Eds., Ecosystems and land use change, vol. 153
(American Geophysical Union, Washington, 2004), pp. 352. 8. R. O. Green et al., Remote Sensing of Environment 65, 227 (1998). 9. R. O. Green, M. L. Eastwood, C. M. Sarture, paper presented at the NASA Airborne Earth
Science Workshop, Pasadena, CA 2005. 10. P. A. Townsend, J. R. Foster, International Geoscience and Remote Sensing Symposium 2, 793
(2002). 11. D. A. Roberts et al., IEEE Transactions on Geoscience and Remote Sensing 41, 1297 (2003). 12. M. L. Smith, et al., IEEE Transactions on Geoscience and Remote Sensing 41, 1332 (2003). 13. G. P. Asner, et al., Proceedings of the National Academy of Sciences of the United States of
America 101, 6039 (2004). 14. M. L. Smith et al., Ecological Applications 12, 1286 (2002). 15. G. P. Asner, K. B. Heidebrecht, IEEE Transactions on Geoscience and Remote Sensing 41, 1283
(2003). 16. S. G. Ungar, et al., IEEE Transactions on Geoscience and Remote Sensing 41, 1149 (2003). 17. B.-C. Gao, A. F. H. Goetz, Journal of Geophysical Research 95, 3549 (1990). 18. J. C. Granahan, J. N. Sweet, paper presented at the IEEE Geoscience and Remote Sensing
Symposium, Sydney, Australia 2001. 19. G. P. Asner, D. B. Lobell, Remote Sensing of Environment 74, 99 (2000). 20. G. P. Asner, K. B. Heidebrecht, International Journal of Remote Sensing 23, 3939 (2002). 21. A. T. Harris, G. P. Asner, M. E. Miller, Ecosystems 6, 368 (2003). 22. D. B. Lobell, et al., Journal of Geophysical Research-Atmospheres 106, 5151 (2001). 23. R. E. Martin, G. P. Asner, Ecosystems 8, 33 (2005). 24. J. F. Reynolds, D. M. Stafford Smith, in Global desertification: do humans cause deserts? J. F.
Reynolds, D. M. Stafford Smith, Eds. (Dahlem University Press, Berlin, 2002) pp. 1-21.
13
25. C. A. Wessman, C. A. Bateson, T. L. Benning, Ecological Applications 7, 493 (1997). 26. D. A. Roberts, R. O. Green, J. B. Adams, Remote Sensing of Environment 62, 223 (1997). 27. D. A. Roberts, M. Gardner, J. Regelbrugge, D. Pedreros, S. L. Ustin, (1998). 28. N. Kamata, Bulletin of Entomological Research 92, 109 (2002). 29. P. M. Treitz, P. J. Howarth, Progress in Physical Geography 23, 359 (1999). 30. C. Leprieur,et al., International Journal of Remote Sensing 21, 281 (2000). 31. G. P. Asner, et al., Global Change Biology 9, 316 (2003). 32. F. Mora, J. L. Silvan-Cardenas, Proceedings of SPIE - The International Society for Optical
Engineering 5232, 312 (2004). 33. K. Jasinski, P. Angelstam, Forest Ecology and Management 161, 1 (2002). 34. R. N. Treuhaft, G. P. Asner, B. E. Law, Geophysical Research Letters 30 (2003). 35. R. N. Treuhaft, et al., Journal of Geophysical Research-Atmospheres 107 (2002). 36. K. Bergen, R. G. Knox, S. Saatchi, “Multi-dimensional forested ecosystem structure:
Requirements for remote sensing observations” Tech. Report No. NASA/CP-2005-212778 (NASA, 2005).
37. G. P. Asner, P. M. Vitousek, Proceedings of the National Academy of Sciences 102, 1 (2005). 38. R. O. Green, University of California (2003). 39. D. A. Roberts et al., Ecosystems 7, 545 (2004). 40. R. B. Myneni, R. N. Ramakrishna, S. W. Running, IEEE Transactions on Geoscience and Remote
Sensing 35, 1380 (1997). 41. Y. Knyazikhin et al., Journal of Geophysical Research 103, 32 (1998). 42. L. Serrano, et al., Remote Sensing of Environment 74, 570 (2000). 43. S. L. Ustin et al., Remote Sensing of Environment 65, 280 (1998). 44. S. Jacquemoud, et al., Remote Sensing of Environment 52, 163 (1995). 45. S. Jacquemoud et al., Remote Sensing of Environment 56, 194 (1996). 46. A. A. Gitelson, et al., Photochemistry and Photobiology 75, 272 (2002). 47. M. N. Merzlyak,et al., Russian Journal of Plant Physiology 50, 704 (2003). 48. M. N. Merzlyak, A. E. Solovchenko, A. A. Gitelson, Postharvest Biology and Technology 27, 197
(2003). 49. C. Field, H. A. Mooney, Oecologia 56, 348 (1983). 50. S. V. Ollinger et al., Ecology 83, 339 (2002). 51. M. E. Martin, J. D. Aber, Ecological Applications 7, 431 (1997). 52. J. A. Gamon et al., Oecologia 85, 1 (1990). 53. J. A. Gamon, J. Peñuelas, C. B. Field, Remote Sensing of Environment (1992). 54. D. A. Fuentes, et al., Journal of Geophysical Research 106, 33 (2001). 55. J. A. Gamon, L. Serrano, J. S. Surfus, Oecologia 112, 492 (1997). 56. P. J. Sellers, International Journal of Remote Sensing 6, 1335 (1985). 57. P. J. Sellers, Remote Sensing of Environment 21, 143 (1987). 58. C. B. Field, J. T. Randerson, C. M. Malmström, Remote Sensing of Environment 51, 74 (1995). 59. A. Bondeau, D. W. Kicklighter, J. Kaduk, Global Change Biology 5, 35 (1999). 60. J. C. Jenkins, et al., Ecosystems 2, 555 (1999). 61. H. Tian et al., Global Ecology and Biogeography 9, 315 (2000). 62. H. Poorter, C. Roumet, B. D. Campbell, in Carbon, Dioxide, Populations, and Communities C.
Körner, F. A. Bazzaz, Eds. (Academic Press, San Diego, 1996) pp. 375-412. 63. D. D. Breshears, F. J. Barnes, Landscape Ecology 14, 465 (1999). 64. R. A. Gill, R. B. Jackson, New Phytologist 147, 13 (2000). 65. D. A. Roberts et al., Remote Sensing of Environment 65, 267 (1998). 66. D. B. Lobell, G. P. Asner, IEEE Transactions Geoscience and Remote Sensing 41, 1277 (2003). 67. C. O. Justice et al., Remote Sensing of Environment 83, 244 (2002). 68. Y. J. Kaufman et al., Journal of Geophysical Research-Atmospheres V103, 32215 (1998). 69. D. Riaño et al., Remote Sensing of Environment 79, 60 (2002). 70. G. P. Asner, K. B. Heidebrecht, Global Change Biology 11, 182 (2005).
14
71. P. Mouroulis, R. O. Green, Proceedings of SPIE - The International Society for Optical Engineering 4829, 1048 (2003).
72. P. Z. Mouroulis, R. O. Green, Proceedings of the SPIE - The International Society for Optical Engineering 5173, 18 (2003).
73. P. Mouroulis, R. O. Green, T. G. Chrien, Applied Optics 39, 2210 (2000). 74. C. O. Justice, J. Townshend, International Journal of Remote Sensing 15, 3621 (1994). 75. J. T. Morisette, J. L. Privette, C. O. Justice, Remote Sensing of Environment (2002). 76. J. Cihlar, J. Chen, Z. Li, Canadian Journal of Remote Sensing 23, 381 (1997).