VIETNAM FMCG TODAY AND TOMORROW - Vietnam Business filevietnam fmcg today and tomorrow 10th of june...
21
VIETNAM FMCG TODAY AND TOMORROW 10 th of June 2015 A SHARING SESSION WITH MJN
Transcript of VIETNAM FMCG TODAY AND TOMORROW - Vietnam Business filevietnam fmcg today and tomorrow 10th of june...

VIETNAM FMCGTODAY AND TOMORROW
10th of June 2015
A SHARING SESSION WITH MJN

Co
pyr
igh
t ©
2015
Th
e N
iels
en C
om
pan
y. C
on
fid
enti
al a
nd
pro
pri
etar
y.
2
MACRO ECONOMY – DO THE NUMBERS ADD UP?
+ 6.03%Q1’15 vs. YA
2015 Target
6.0%GDP
CPI
RETAIL SALES
+ 10%Q1’15 vs. YA
2015 Target
3.7%+ 0.74%Q1’15 vs. YA
EXPORT + 6.9%Q1’15 vs. YA

Cop
yri
gh
t ©
20
15
T
he
Nie
lse
n C
om
pa
ny.
Con
fid
en
tia
l a
nd
pro
pri
eta
ry.
3
37.4
17.214.9
12.4
8.4 5.6 4.2Beverage
Foods
Milk Bases
Cigarette
Personal Care
Home Care
Baby Products
RECOVERY IN THE TREND BUT STILL VERY SLUGGISH
Source: Nielsen Retail Audit – Total 6 cities – Mar’15 data ending
Value % Chg. YA – Q1 ‘15FMCG – Value % Share – Q1 ‘15
8.1%
1.1%
25.9%
18.0% 18.8%
11.6%
2.4% 1.4%-1.9% 0.6% 3.4% 2.3%
4.0%
-10%-5%0%5%
10%15%20%25%30%
Unit Value Change Volume Change Nominal Growth
9.6
5
-1
-5
Beverage
Foods
Milk Bases
Cigarette
7
3
-4
PersonalCare
Home Care
BabyProducts
FMCG GROWTH

Co
pyr
igh
t ©
2012
Th
e N
iels
en C
om
pan
y. C
on
fid
enti
al a
nd
pro
pri
etar
y.
4
-1.1%
1.2% 1.0% 0.9%0.1% 0.1% 0.3%
3.0%
0.7%
2.6%1.3%
4.8%3.9%
10.4%
-3.4%
-1.6% -1.2%
0.3% 1.4%2.6% 2.8%
0.9%
3.4%
2.2%3.9%
5.2% 6.5%
0.3%
-4.5%
-0.4% -0.2%
1.2% 1.5%
2.7%3.1%
3.8% 4.0%4.8%
5.3%
10.0%10.4% 10.7%
Japan Korea Taiwan Australia Singapore Thailand NZ China Vietnam HK Malaysia India Philippines Indonesia
Unit value change Volume change Nominal growth
Fast Moving Consumer Goods market dynamics REGIONAL SUMMARY – Q1 2015

Cop
yri
gh
t ©
20
15
T
he
Nie
lse
n C
om
pa
ny.
Con
fid
en
tia
l a
nd
pro
pri
eta
ry.
5
CONSUMER CONFIDENCE REBOUNDS AT THE HIGHEST LEVEL OVER LAST 2 YEARS WHILE RETAILERS ARE LESS OPTIMISTIC
Source: Nielsen Consumer Confident Global Survey - Q4’14
Source: Consumer Confidence Survey Q4’14 & Retailer Interview (5thJan – 6thFeb): “What are your major concerns over the next 6 months?”
#1 - HEALTH
#2- ECONOMY
CONSUMERS BIGGEST CONCERNS#: Chg. vs. YA
71
RETAILER CONFIDENCE INDEX (RCI) VIETNAM
CONSUMER CONFIDENCE INDEX (CCI) VIETNAM
98 99 98102 106
Q4 2013 Q1 2014 Q2 2014 Q3 2014 Q4 2014
RETAILERS BIGGEST CONCERNS
#1 - CONSUMER SUPPORT
#2 - REVENUE / MARGIN

Co
pyr
igh
t ©
2012
Th
e N
iels
en C
om
pan
y. C
on
fid
enti
al a
nd
pro
pri
etar
y.
6
FMCG GROWTH IS EXPECTED TO BE SLUGGISH OVER THE NEXT FEW QUARTERS
Source: Nielsen Syndicated Forecasting
• EXPECTED AVERAGE FORECAST as the most likely scenario , 95% chance will be within 2-3% of this scenario• EXPECTED MAX FORECAST most likely happens in optimistic market, with the signal of:
• Big increase in FDI. • Strengthening Forex• Big increase in consumer confidence.
• EXPECTED MIN FORECAST most likely happens in pessimistic market, with the signal of:• Recession – 2 periods of declining GDP growth• Tax hikes – introduction of GST, gas prices tax increase • Political turmoil

BUT THERE ARE OPPORTUNITIES

Co
pyr
igh
t ©
2015
Th
e N
iels
en C
om
pan
y. C
on
fid
enti
al a
nd
pro
pri
etar
y.
8
4 BIG CONSUMER TRENDS
IT’S ALL ABOUT ME
CONNECT ME TO THE
WORLD
I’M ON THE MOVE
I HAVE THEPOWERTO BUY
Co
pyr
igh
t ©
2015
Th
e N
iels
en C
om
pan
y. C
on
fid
enti
al a
nd
pro
pri
etar
y.
9
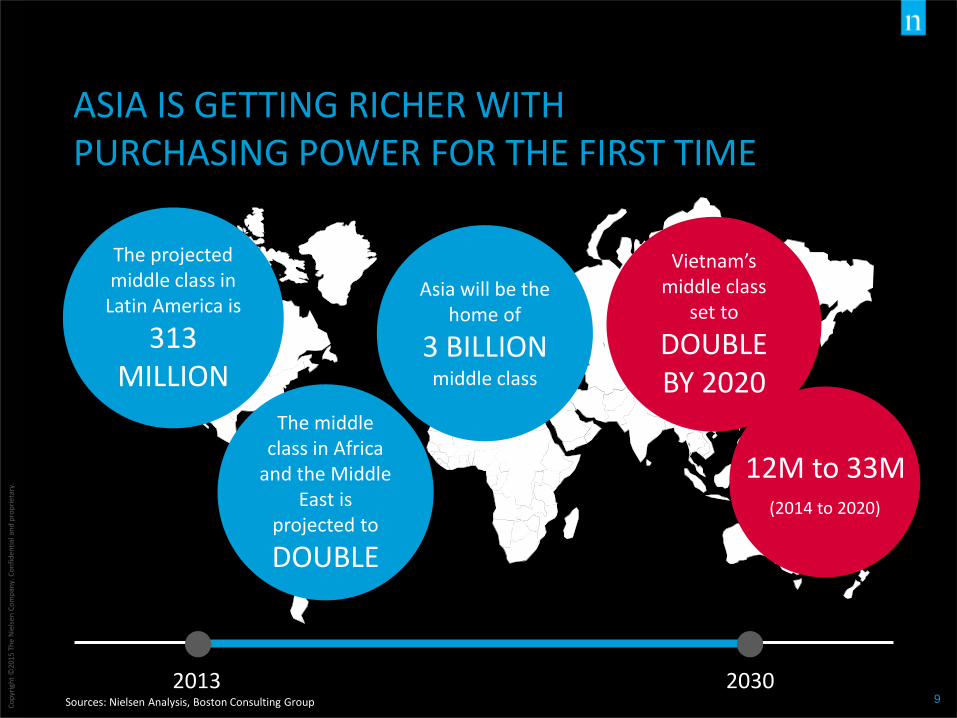
20302013
Asia will be the home of
3 BILLION middle class
The projected middle class in
Latin America is
313 MILLION
The middle class in Africa
and the Middle East is
projected to
DOUBLE
ASIA IS GETTING RICHER WITH PURCHASING POWER FOR THE FIRST TIME
Sources: Nielsen Analysis, Boston Consulting Group
Vietnam’smiddle class
set to
DOUBLE BY 2020
(2014 to 2020)
12M to 33M

Co
pyr
igh
t ©
2015
Th
e N
iels
en C
om
pan
y. C
on
fid
enti
al a
nd
pro
pri
etar
y.
10
57% population below 35 years old
YOUNG POPULATION
Sources: Data results of the Viet Nam Household Living Standards Survey 2012 – VN GSOStatistical Yearbook of Vietnam 2013 – VN GSOVietnam Urbanization Review 2011 – World BankNielsen Vietnam Pocket Book
ALL SET TO SOAR
HIGH LABOR FORCE13% increase in labor force participation
HIGHER INCOME
44% increase in monthly income per capita(2010 vs. 2012)
MORE EXPENDITURE
32% growth in monthly total consumption expenditure per capita (2010 vs. 2012)
SMALLERHOUSEHOLD SIZEFrom 4.44 to 3.85 people/ household (2002 vs. 2012)
URBANISATION
30% urbanisation rate with 3.4% growth rate per year
QUALITY
73% willing to pay more for higher quality
39% considering health as top concern in life
HEALTH
MORE EDUCATED1.6 times more college/university graduates(2006 vs. 2012)

Co
pyr
igh
t ©
2012
Th
e N
iels
en C
om
pan
y. C
on
fid
enti
al a
nd
pro
pri
etar
y.
11
VIETNAMESE CONSUMERS ARE DISCERNING
“I will wait until an innovation
has proven itself before
purchasing”(% Agree)
.. and sustained over at least 2 years

Co
pyr
igh
t ©
2013
Th
e N
iels
en C
om
pan
y. C
on
fid
enti
al a
nd
pro
pri
etar
y.
VIETNAMESE ARE AMONG THE YOUNGEST CONSUMERS IN THE WORLD
Source: US Central Intelligence Agency – The World Fact Book
Nig
eria
Ken
ya
Gh
ana
Paki
stan
Ph
ilip
pin
es
Egyp
t
Sau
di A
rab
ia
S. A
fric
a
Alg
eria
Mal
aysi
a
Mo
rocc
o
VIE
TNA
M
Ind
on
esia
Ku
wai
t
UA
E
Sin
gap
ore
Thai
lan
d
New
zea
lan
d
Au
stra
lia
Ko
rea
Jap
an
18 1921 23 24 25 26 26
27 28 28 29 29 2930
3437 38 38
40
45Median Age of Population
US 38
CHINA 37
VIETNAM 29
DEVELOPING DEVELOPED
12

THE EMERGENCE OF NEW CHANNELS

Co
pyr
igh
t ©
2012
Th
e N
iels
en C
om
pan
y. C
on
fid
enti
al a
nd
pro
pri
etar
y.
14
RETAILERS RULE IN VIETNAM
Source: Retail Index Universe for # of stores, CIA factbook for Population numbers
# of Traditional Storesin Universe
# of TT stores per Million inhabitants
2,533,025
1,044,014
1,011,115
408,135
33,172
2,253
INDONESIA
PHILIPPINES
VIETNAM
THAILAND
MALAYSIA
SINGAPORE
10,085
9,875
10,934
6,051
1,120
413
URBAN
93% OF SHOPPER SHOP ON
AUTO PILOT
RURAL
9/10 RETAILERS GIVE
RECOMMENDATIONS AND 3/10 BUY BECAUSE
OF THESE

Co
pyr
igh
t ©
2015
Th
e N
iels
en C
om
pan
y. C
on
fid
enti
al a
nd
pro
pri
etar
y.
15
NEXT UP: E-CONVENIENCE?
Hours per week
Consumers in Asia Pacific are among the most connected in the world
Source: Survey of Internet users Nielsen Cross Platform report
VIETNAM
15.5

Co
pyr
igh
t ©
2013
Th
e N
iels
en C
om
pan
y. C
on
fid
enti
al a
nd
pro
pri
etar
y.
CONVENIENCE FOOTPRINT IN ASIA IS EXPLODING
X = Growth since 2004Source: Nielsen Retail Census
2.7 X
2 X
2 X
1.4 X
3 X
3 X
1.5 X
CHINA
KOREA
THAILAND
TAIWAN
MALAYSIA
PHILIPPINES
SINGAPORE
Number of Stores In 2014

Co
pyr
igh
t ©
2012
Th
e N
iels
en C
om
pan
y. C
on
fid
enti
al a
nd
pro
pri
etar
y.
17
147
863
304
130
428
11612
321
98
259
1082
300236
523
11217
421
89
348
1452
313 326
547
10015
602
94
CVS Minimart Super/Hypermarket
CVS Minimart Super/Hypermarket
CVS Minimart Super/Hypermarket
URBAN HCMC HANOI
2012 2013 2014
Number of Modern Trade stores in Vietnam
Source: Nielsen Retail Establishment Survey (RES)
THIS IS STARTING TO HAPPEN IN VIETNAM, BUT IT IS EARLY DAYS

Co
pyr
igh
t ©
2015
Th
e N
iels
en C
om
pan
y. C
on
fid
enti
al a
nd
pro
pri
etar
y.
18
ENORMOUS OPPORTUNITY IN VIETNAMWhat is the right offer in each area?
Number of People per Convenience Store
Convenience stores are now truly convenient in many countries
1,835
2,300
5,261
5,556
7,040
7,300
21,000
37,000
69,000
KOREA
TAIWAN
HK
THAILAND
MALAYSIA
SINGAPORE
CHINA
PHILIPPINES
VIETNAM
Source: Nielsen Retail Census
(% OF POPULATION)

WHERE TO FROM HERE

Co
pyr
igh
t ©
2012
Th
e N
iels
en C
om
pan
y. C
on
fid
enti
al a
nd
pro
pri
etar
y.
20
MORE PURCHASING POWERYOU NEED KNOW WHAT MAKES THEM TICK
REACH
WHO WHAT HOW
REACT RESONATE
Driving differentiated outcomes for your business in Vietnam

CONVENIENCE IS NOT A STORE FRONT, IT’S A WAY OF LIFE