Vietnam Closed-End Funds - vn-investor.info. This document is a ... competitive workforce, ......
14
This note has been prepared by sales or trading persons of Jefferies International Limited and may not be supported by independent analysis. This document is a marketing communication and is not and should not be construed as investment research. * Jefferies Hoare Govett is corporate broker to Vietnam Enterprise Inv. Ltd Mark Ambrose, CFA +44 (0)20 7898 7107 [email protected] Jefferies International Limited Vintners Place 68 Upper Thames Street London EC4V 3BJ Vietnam Closed-End Funds Key takeaways from our Ho Chi Minh City trip We recently attended Dragon Capital’s Vietnam Access Conference in Ho Chi Minh City, taking the opportunity to update our thoughts on the market and economy and attend presentations by some of the portfolio companies of Dragon Capital’s flagship fund, Vietnam Enterprise Investments * (VEIL LN). While to us Vietnam’s secular growth story has never been in doubt, we were keen to learn if the market still looks good from a cyclical standpoint. Notwithstanding some areas where some caution is warranted (e.g. certain areas of real estate) we left bullish, confident the market has further to run. With foreign ownership limits still a major barrier to investing direct, and the performance of the ETFs dire, there is still a powerful case for closed-end funds. Grouping our main takeaways by subject: Economy Vietnam is growing strongly, with real GDP up 6.2% in 2016. Notwithstanding a blip in Q1 2017, impacted by Samsung discontinuing its Galaxy Note 7 smartphone, Dragon Capital expects the economy to grow by 6.6% in real terms in 2017. Importantly, growth is built on more solid foundations than in earlier periods. Inflation is under control at +3.2% YoY; the current account balance has been in surplus since 2012; and the VND/USD exchange rate has been remarkably stable, albeit managed to depreciate modestly each year and maintain competitiveness. The period of bank restructuring/provisioning is coming to an end and, as a result, banks have returned to profitability. Credit growth is at a level, seen as sustainable, of 16-18%. The budget deficit, at 5.5% of GDP, is higher than desirable and public debt-to- GDP is close to a self-imposed ceiling of 65%. However, we note that only a quarter is owed to foreigners and most of that is in the form of Overseas Development Assistance, on concessional financial terms. The fiscal situation could in fact work in investors’ favour by encouraging greater divestment from listed SOEs and a larger privatisation pipeline, and the creation of more favourable investment environment for foreigner investors to facilitate this. Long-term drivers are still compelling, with a young, literate population with a median age of 30 — young, but old enough to have disposable income; a highly competitive workforce, with wages ~40% of those in China; and urbanisation that is still around 16 years behind Thailand. Equity market Vietnamese equities have enjoyed a strong run since the beginning of 2013, up over 95% in US$ TR terms, or +16% p.a., while the MSCI Emerging Market Index was roughly flat (+1.2% p.a.), the MSCI Asia ex-Japan was up +5.1 % p.a. and the MSCI Frontier Markets – of which Vietnam is a constituent – was up 6.8 % p.a.. This begs the question: are Vietnamese equities still attractive here? In our view, the market remains reasonably priced relative to peers at 13x 2017e PE, in the context of estimated EPS growth this year of 19% (Bloomberg). Investment Companies Desk Note Company Profile 14 June 2017
Transcript of Vietnam Closed-End Funds - vn-investor.info. This document is a ... competitive workforce, ......

This note has been prepared by sales or trading persons of Jefferies International Limited and may not be supported by independent
analysis. This document is a marketing communication and is not and should not be construed as investment research.
* Jefferies Hoare Govett is corporate broker
to Vietnam Enterprise Inv. Ltd
Mark Ambrose, CFA
+44 (0)20 7898 7107
Jefferies International Limited
Vintners Place
68 Upper Thames Street
London EC4V 3BJ
Vietnam Closed-End Funds Key takeaways from our Ho Chi Minh City trip
We recently attended Dragon Capital’s Vietnam Access Conference in Ho Chi
Minh City, taking the opportunity to update our thoughts on the market and
economy and attend presentations by some of the portfolio companies of
Dragon Capital’s flagship fund, Vietnam Enterprise Investments * (VEIL LN).
While to us Vietnam’s secular growth story has never been in doubt, we were
keen to learn if the market still looks good from a cyclical standpoint.
Notwithstanding some areas where some caution is warranted (e.g. certain
areas of real estate) we left bullish, confident the market has further to run.
With foreign ownership limits still a major barrier to investing direct, and the
performance of the ETFs dire, there is still a powerful case for closed-end funds.
Grouping our main takeaways by subject:
Economy
Vietnam is growing strongly, with real GDP up 6.2% in 2016. Notwithstanding a
blip in Q1 2017, impacted by Samsung discontinuing its Galaxy Note 7
smartphone, Dragon Capital expects the economy to grow by 6.6% in real terms
in 2017.
Importantly, growth is built on more solid foundations than in earlier periods.
Inflation is under control at +3.2% YoY; the current account balance has been in
surplus since 2012; and the VND/USD exchange rate has been remarkably stable,
albeit managed to depreciate modestly each year and maintain competitiveness.
The period of bank restructuring/provisioning is coming to an end and, as a result,
banks have returned to profitability. Credit growth is at a level, seen as sustainable,
of 16-18%.
The budget deficit, at 5.5% of GDP, is higher than desirable and public debt-to-
GDP is close to a self-imposed ceiling of 65%. However, we note that only a
quarter is owed to foreigners and most of that is in the form of Overseas
Development Assistance, on concessional financial terms.
The fiscal situation could in fact work in investors’ favour by encouraging greater
divestment from listed SOEs and a larger privatisation pipeline, and the creation of
more favourable investment environment for foreigner investors to facilitate this.
Long-term drivers are still compelling, with a young, literate population with a
median age of 30 — young, but old enough to have disposable income; a highly
competitive workforce, with wages ~40% of those in China; and urbanisation that
is still around 16 years behind Thailand.
Equity market
Vietnamese equities have enjoyed a strong run since the beginning of 2013, up
over 95% in US$ TR terms, or +16% p.a., while the MSCI Emerging Market Index
was roughly flat (+1.2% p.a.), the MSCI Asia ex-Japan was up +5.1 % p.a. and the
MSCI Frontier Markets – of which Vietnam is a constituent – was up 6.8 % p.a..
This begs the question: are Vietnamese equities still attractive here? In our view,
the market remains reasonably priced relative to peers at 13x 2017e PE, in the
context of estimated EPS growth this year of 19% (Bloomberg).
Investment Companies
Desk Note
Company Profile 14 June 2017

14 June 2017
page 2 of 14
This note has been prepared by sales or trading persons of Jefferies International Limited and may not be supported by independent
analysis. This document is a marketing communication and is not and should not be construed as investment research
Desk Note
Company Profile
Chart 1: Vietnamese Equity Valuations vs. Regional Peers
China
India
IndonesiaSri Lanka
Pakistan
Malaysia
Philippines
Thailand Vietnam
0
5
10
15
20
25
0% 5% 10% 15% 20% 25% 30%
P
/
E
2017e EPS gth
Source: Bloomberg
Foreign ownership limits (FOLs) are still a major issue
FOLs were officially removed for all but ‘restricted’ sectors in 2016 with the responsibility for
enactment passed onto companies themselves. However, few have followed through and
implemented this in practice. Only nine members of the VN All-Share Index have removed
FOLs, we believe.
Being deemed to have ‘foreign status’ by virtue of having a predominantly foreign
shareholder register can still present problems for businesses. For example, Mobile World
Group (MWG), a leading and rapidly growing retailer, said it had no current intention to raise
its FOL. In doing so, it would run the risk of becoming predominantly owned by foreigners
and thus being classed as ‘foreign’, restricting its ability to open new retail stores.
Further relaxation is clearly needed. In the meantime, foreign premiums are still a common
occurrence. Taking the example of MWG again, we are aware of one block that was traded
between foreigners in Q1 2017 at a 20% premium to the reference market price.
FOLs mean there is still a powerful case for accessing Vietnam through CEFs. It also means
the ‘true’ NAVs on CEFs are higher than the published figures, and the discounts to NAV are
also larger.
To illustrate, Vietnam Enterprise Investments Ltd (VEIL LN) currently trades on a c.14%
discount to NAV, but more than 25% of its NAV is in companies that are at their foreign limits.
Blocks of these names trade between foreigners at premiums of 15-20% to market price,
making the ‘true’ discount to NAV several percentage points wider.
MSCI EM inclusion
While Vietnam is not among this year’s MSCI 2017 Annual Market Classification Review, there
is hope that MSCI will recognise the direction of travel and this month place Vietnam on its
watch-list for MSCI Emerging Market inclusion. Failing that, local fund managers expect it
will be put on the watch-list in 2018.
From a quantitative perspective, we believe Vietnam meets the criteria. The country needs
three companies with more than $1.375bn market cap, $687m free float, and 15% annual
traded value ratio (ATVR). We estimate it potentially has eight today.
However, more work needs to be done to meet the qualitative criteria. Market Accessibility
Criteria require:
o “Significant” openness to foreign ownership, defined by the proportion of the market
accessible to non-domestic investors and/or the existence of a foreign board where
foreigners can trade with one another, as well as the availability of information in
English.

14 June 2017
page 3 of 14
This note has been prepared by sales or trading persons of Jefferies International Limited and may not be supported by independent
analysis. This document is a marketing communication and is not and should not be construed as investment research
Desk Note
Company Profile
o “Significant” ease of capital inflows/outflows, including the existence of a developed
onshore and offshore foreign exchange market.
An announcement of Pakistan’s upgrade by MSCI from ‘Frontier’ to ‘Emerging’ status in
2016 (effective June 2017) was a wake-up call for Vietnam—in many ways a more developed
economy and market—and has hopefully provided the impetus for the government to take
the necessary steps to make it happen.
Our conclusion from presentations and discussions on the trip is that the will is there and it is
a case of when, not if, Vietnam qualifies. While we would not advise buying Vietnam now
purely to front-run potential MSCI EM watch-list inclusion this month, we feel there are
enough other reasons to own it anyway, with 2-3 year MSCI EM inclusion to be seen as a
‘bonus’.
Privatisation/IPO opportunity
The current program of privatisations was launched in 2014, with 430 SOEs identified. So far,
165 have been done. The government recently identified 137 companies to be IPO’d in
2017-19.
In contrast to earlier waves, pricing has been far more reasonable, at 1 – 1.5x book value. In
addition, unlike previous programs, where companies sometimes languished as unlisted
companies indefinitely, companies must now list on UPCoM (Unlisted Public Company
Market), a transitional market, within a short space of time and then list on the HCMC or
Hanoi stock exchange within a further 270 days.
UPCoM has become a large market itself, larger in fact that Hanoi, with a market cap of c.
$18.5bn. Importantly for Vietnam closed-end fund investors, it is also a transparent one, with
trades printed on Bloomberg, enabling validation of marks in funds’ NAVs.
Private IPOs and SOE privatisations have historically been a good source of returns for VEIL.
Since 2014, VEIL has invested in 12 deals for a collective, total IRR of 53.6%. IPO-related deals
were said to have contributed 5 percentage points to VEIL’s NAV growth last year.
Pre-IPO investments will be constrained by the availability of suitably priced opportunities, as
many are likely to be turned down on pricing and/or quality grounds. VEIL also has a cap of
15-20% on pre-listed investments (inc. UPCoM stocks).
Property market
Vietnam’s physical infrastructure is taking form. Examples here include the HCMC Metro Line
which is in the process of being constructed. There are also infrastructure projects aimed at
tackling flooding as well as traffic congestion.
Vietnamese real estate continues to see strong capital inflows from Japanese, Korean and
Chinese buyers.
There were a few words of caution from Fraser Wilson (manager of Dragon Capital’s Vietnam
Property Fund) who warned of signs of oversupply in residential and retail property. Fraser
also warned that land prices have rocketed to unsustainable levels.
This view was somewhat echoed in a later meeting we had with Vinacapital who cited high
end residential property as one area that can be considered late-cycle.
Company presentations
The conference was a useful opportunity to hear from the underlying companies, all but one
of which is in VEIL’s portfolio. One of the highlights, for us, was a presentation by the
entrepreneur behind Mobile World Group – VEIL’s second largest position, at 7.5% of VEIL’s
NAV.
Described by Dragon Capital’s speaker as “the next Vinamilk”, Mobile World Group is
Vietnam’s largest retailer – both bricks & mortar and online. MWG began as a chain of
mobile phone stores but subsequently expanded into consumer electronics stores and is now
looking to move into minimarts and hypermarkets. MWG’s growth has been spectacular —
revenues +54% CAGR and net profit +85% CAGR. between 2012 and 2016. MWG’s valuation
is not expensive, however, at 14x 2017 budgeted earnings (~$95m, +35% yoy).
14 June 2017
page 4 of 14
This note has been prepared by sales or trading persons of Jefferies International Limited and may not be supported by independent
analysis. This document is a marketing communication and is not and should not be construed as investment research
Desk Note
Company Profile
MWG was an IPO-related investment for VEIL. As of 30 April 2017, this initial investment had
generated an IRR of 46.7% and a multiple of 4.3x on invested capital.
An even more profitable IPO-related investment, at least in IRR terms, has been Airports Corp
of Vietnam (3.6% of VEIL’s NAV). ACV is the monopoly operator of 22 civilian airports in
Vietnam, including 9 international airports. The company has very limited free float and is still
95% owned by the Ministry of Transport, but is in the process of seeking a strategic buyer for
a c. 20% stake, with Aeroports de Paris (ADP FP) considered to be a likely candidate. ACV is
expecting earnings growth of 16% in 2017, off a ‘conservative’ estimate of 10% revenue
growth, which takes into account higher landing charges that come into effect in September.
ACV has been an incredibly profitable privatisation investment for VEIL, delivering an IRR of
165.6% and a multiple of 3.6x on the original investment as of 30 April 2017.
Novaland (NVL VN, est. 3.7% of VEIL’s NAV) is the largest real estate player in Ho Chi Minh
City (HCMC) with a focus on mid-high end residential property. For the next stage of its
development, however, the company is selectively reviewing opportunities outside of HCMC
as well as diversifying into commercial real estate.
NVL was a pre-IPO investment for VEIL, as well as Vinacapital’s Vietnam Opportunity Fund
(VOF), and the company IPO’d and listed on HCMC stock exchange in December 2016. VEIL
and VOF invested in convertible preference shares that paid a high coupon and which
converted into shares prior to the company’s IPO. As of 30 April the investment had delivered
an IRR of 43.0% to VEIL and a multiple of 1.5x
Other presentations included:
o Asia Commercial Bank (ACB VN, 5.9% of NAV), a retail bank and long-term holding of
VEIL’s. ACB went through a period of restructuring from 2012 to 2015, partly related to
its former Chairman’s arrest, but is emerging from this and aiming to resolve any
outstanding issues in 2017. Earlier in the day, ACB had been identified as one of the
better banks from a capital adequacy ratio and provisioning perspective, alongside
Military Bank (MBB VN) and Vietcombank (VCB VN).
o Cotecons (CTD VN, Est. 2.2% of NAV), a well-regarded construction company, focused
on residential property but also involved in commercial property and industrial, with a
healthy $1.2bn backlog of orders.
o Hoa Sen Group (HSC VN, Est. 1.8% of NAV), a manufacturer of construction materials
(e.g., coloured steel sheets for roofing) focused on the low-to-middle income segment,
selling direct via a network of 250 retail stores. HSG is currently trading at an attractive
valuation (5.8x PE) despite strong growth (profits +45% CAGR since 2001).
o Power Construction No. 1 (PC1 VN, Est. 1.8% of NAV), a former state-owned company
privatised in 2005 and now 100% privately owned. PC1 is the largest player in the
power grid construction space, with a market share of c. 40%, and a beneficiary of
growing demand for power, which is expected to grow twice as fast as GDP.

14 June 2017
page 5 of 14
This note has been prepared by sales or trading persons of Jefferies International Limited and may not be supported by independent
analysis. This document is a marketing communication and is not and should not be construed as investment research
Desk Note
Company Profile
How to play Vietnam
Given the barrier to entry that FOLs continue to represent, closed-end funds remain the best way of
investing in Vietnam in our view. Currently, these also have the added attraction of trading at
discounts to NAV – discounts that, relative to other emerging market funds in general, appear wide
in our view.
Excluding direct property plays like Vietnam Property Fund (VPF ID) and Vinaland (VNL LN), both of
which are in harvesting mode at the present time, and Vietnam Phoenix Fund (VTNPHXC KY), which
is now a concentrated end-game play looking to realise its portfolio of unlisted and/or illiquid
assets, there are three closed-ended funds focused on Vietnamese equities: Vietnam Enterprise
Investments (VEIL LN); Vietnam Opportunity Fund (VOF LN); and Vietnam Holding (VNH LN).
Name Vietnam Enterprise Investments Ltd Vietnam Opportunity Fund Vietnam Holding Ltd
Manager Dragon Capital Vinacapital Inv. Mgmt Vietnam Holding Asset Mgmt
Exchange London Stock Exchange London Stock Exchange London Stock Exchange (AIM)
Ticker VEIL LN VOF LN VNH LN
Quote currency GBp GBp USD
Price 366.75p 292.625p $2.2025
Est. NAV/sh 426p 365.8p $2.806
Prem. / Disc. -13.9% -20.0% -21.5%
1yr ave. prem./disc. -16.5% -22.3% -14.1%
Shares o/s 220,125,680 200,871,258 73,301,667
M/ cap ($- equiv) $1,030m $750m $161m
Total eNAV ($-equiv) $1,197m $938m $206m
ADTV ($-equiv, YTD) $1,033k $1,699k $305k
Management Fee 2% NAV p.a. 1.5% NAV p.a. 2% NAV p.a. for NAV <$100m
1.75% NAV p.a. for NAV $100-150m
1.5% NAV p.a. for NAV >$150m
Performance Fee n/a Direct real estate: 15% over 8% hurdle
All other: 15% over 8% hurdle
Each capped at 1.5% of pool’s NAV
15% over 5% hurdle.
Capped at 3% of NAV
Continuation/
Wind-Up vote
2020 2018 2018
Source: Jefferies, Bloomberg, Company data
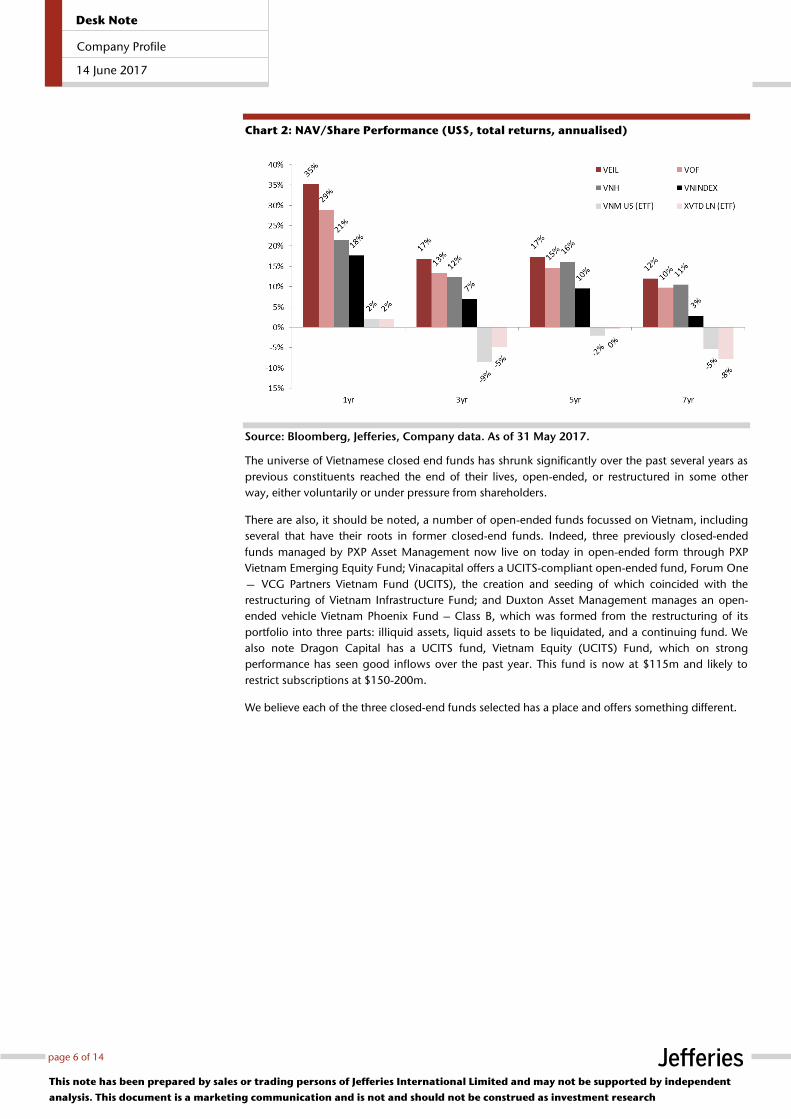
Chart 2, below, compares the one, three, five and seven-year NAV performance of the three funds
against each other as well as against the New York and London-listed Vietnam ETFs. As this shows,
ETFs are not yet a viable alternative. The ETFs each track their respective benchmarks well, but these
benchmarks are constrained by foreign investability criteria that exclude those companies at or
close to the FOLs – by definition the companies that foreign institutional investors want to hold –
and includes those that may be shunned by offshore funds on corporate governance or valuation
grounds. The effect this can have on performance is significant as the performance comparison
shows. Remarkably, these ETFs have more than $500m of assets under management between
them.
14 June 2017
page 6 of 14
This note has been prepared by sales or trading persons of Jefferies International Limited and may not be supported by independent
analysis. This document is a marketing communication and is not and should not be construed as investment research
Desk Note
Company Profile
Chart 2: NAV/Share Performance (US$, total returns, annualised)
Source: Bloomberg, Jefferies, Company data. As of 31 May 2017.
The universe of Vietnamese closed end funds has shrunk significantly over the past several years as
previous constituents reached the end of their lives, open-ended, or restructured in some other
way, either voluntarily or under pressure from shareholders.
There are also, it should be noted, a number of open-ended funds focussed on Vietnam, including
several that have their roots in former closed-end funds. Indeed, three previously closed-ended
funds managed by PXP Asset Management now live on today in open-ended form through PXP
Vietnam Emerging Equity Fund; Vinacapital offers a UCITS-compliant open-ended fund, Forum One
— VCG Partners Vietnam Fund (UCITS), the creation and seeding of which coincided with the
restructuring of Vietnam Infrastructure Fund; and Duxton Asset Management manages an open-
ended vehicle Vietnam Phoenix Fund – Class B, which was formed from the restructuring of its
portfolio into three parts: illiquid assets, liquid assets to be liquidated, and a continuing fund. We
also note Dragon Capital has a UCITS fund, Vietnam Equity (UCITS) Fund, which on strong
performance has seen good inflows over the past year. This fund is now at $115m and likely to
restrict subscriptions at $150-200m.
We believe each of the three closed-end funds selected has a place and offers something different.
14 June 2017
page 7 of 14
This note has been prepared by sales or trading persons of Jefferies International Limited and may not be supported by independent
analysis. This document is a marketing communication and is not and should not be construed as investment research
Desk Note
Company Profile
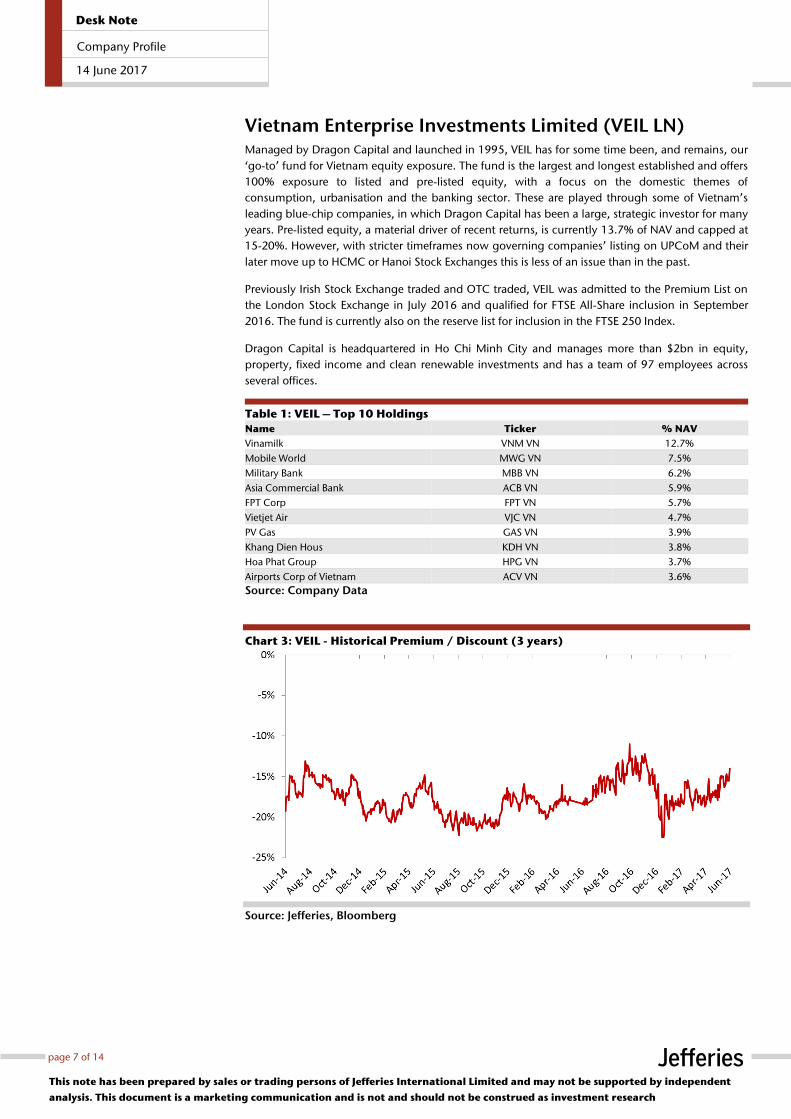
Vietnam Enterprise Investments Limited (VEIL LN) Managed by Dragon Capital and launched in 1995, VEIL has for some time been, and remains, our
‘go-to’ fund for Vietnam equity exposure. The fund is the largest and longest established and offers
100% exposure to listed and pre-listed equity, with a focus on the domestic themes of
consumption, urbanisation and the banking sector. These are played through some of Vietnam’s
leading blue-chip companies, in which Dragon Capital has been a large, strategic investor for many
years. Pre-listed equity, a material driver of recent returns, is currently 13.7% of NAV and capped at
15-20%. However, with stricter timeframes now governing companies’ listing on UPCoM and their
later move up to HCMC or Hanoi Stock Exchanges this is less of an issue than in the past.
Previously Irish Stock Exchange traded and OTC traded, VEIL was admitted to the Premium List on
the London Stock Exchange in July 2016 and qualified for FTSE All-Share inclusion in September
2016. The fund is currently also on the reserve list for inclusion in the FTSE 250 Index.
Dragon Capital is headquartered in Ho Chi Minh City and manages more than $2bn in equity,
property, fixed income and clean renewable investments and has a team of 97 employees across
several offices.
Table 1: VEIL – Top 10 Holdings
Name Ticker % NAV
Vinamilk VNM VN 12.7%
Mobile World MWG VN 7.5%
Military Bank MBB VN 6.2%
Asia Commercial Bank ACB VN 5.9%
FPT Corp FPT VN 5.7%
Vietjet Air VJC VN 4.7%
PV Gas GAS VN 3.9%
Khang Dien Hous KDH VN 3.8%
Hoa Phat Group HPG VN 3.7%
Airports Corp of Vietnam ACV VN 3.6%
Source: Company Data
Chart 3: VEIL - Historical Premium / Discount (3 years)
Source: Jefferies, Bloomberg

14 June 2017
page 8 of 14
This note has been prepared by sales or trading persons of Jefferies International Limited and may not be supported by independent
analysis. This document is a marketing communication and is not and should not be construed as investment research
Desk Note
Company Profile
Vietnam Opportunity Fund (VOF LN) Managed by Vinacapital and launched in 2003, VOF is a multi-asset class fund providing exposure
to a portfolio of listed equity, pre-listed equity and private equity, the latter being an area where the
manager has done well historically. The fund also has exposure to legacy real estate investments—
something that has given us reservations about VOF in the past—however this is now significantly
reduced and represents just 5.1% of NAV.
Like VEIL, VOF has a Premium Listing on the London Stock Exchange and is a FTSE All Share
constituent.
Chart 4: VOF – Asset Allocation
Listed Equity, 53.70%
Cash, 13.80%
OTC Stocks, 12.40%
Private Equity, 8.20%
Real Estate Projects, 5.10%
Net receivables & Other, 4.80%
Operating Assets, 1.30%
Overseas Equity, 0.70%
Source: Company data. As of 30 April 2017.
One potential concern for those bullish on Vietnam and seeking immediate exposure may be VOF’s
large cash & net receivables balance of c. 19% of NAV (~$170m, as of 30 April 2017) which
includes $100m tied up in proceeds to be received over two annual payments from the sale of the
Sofitel Legend Metropole Hotel. Vinacapital reportedly has a $200m pipeline to put some of this
cash to work, in private equity, PIPEs, and IPOs. As its CIO Andy Ho concedes, however, it is
currently a ‘seller’s market’ for private equity making the deployment of cash difficult. Allaying
some of our concerns, we note the fund has what is recognised as a strong, shareholder-friendly
board and is an active ongoing buyer of its own shares with surplus cash. In an effort to cap the
discount on which VOF trades, the company has repurchased more than 86.5m shares since 2013
and c. 6.9m shares so far this year.
Vinacapital was founded in 2003 and manages over $1.3bn in listed and unlisted equity and real
estate. The company is headquartered in HCMC.
Table 2: VOF – Top 10 Holdings (Estimated)
Name Ticker Est. % NAV
Vinamilk VNM VN 15.5%
Hoa Phat Group HPG VN 8.3%
Quang Ngai Sugar QNS VN 5.9%
Khang Dien House KDH VN 5.3%
Airports Corp of Vietnam ACV VN 4.9%
Phu Nhuan Jewellery PNJ VN 4.6%
Novaland NVL VN 4.0%
International Dairy Products n/a 3.9%
Eximbank EIB VN 3.3%
Coteccons CTB VN 3.2%
Source: Company data, Jefferies estimates

14 June 2017
page 9 of 14
This note has been prepared by sales or trading persons of Jefferies International Limited and may not be supported by independent
analysis. This document is a marketing communication and is not and should not be construed as investment research
Desk Note
Company Profile
Chart 5: VOF - Historical Premium / Discount (3 years)
Source: Jefferies, Bloomberg, Company data

14 June 2017
page 10 of 14
This note has been prepared by sales or trading persons of Jefferies International Limited and may not be supported by independent
analysis. This document is a marketing communication and is not and should not be construed as investment research
Desk Note
Company Profile
Vietnam Holding (VNH LN) VNH is managed by Vietnam Holding Asset Management, a Cayman Islands-domiciled manager
with representative offices in HCMC where the investment team sit. VNH has a strong
Environmental, Social and Governance (ESG) focus – though other funds would argue similarly—
and is differentiated from VEIL and VOF by its skew towards mid-cap companies which turns a
negative – its small size – to its advantage. VNH’s portfolio is based on the three long-term growth
drivers of urbanisation, consumption, and agriculture, with investments selected on the expectation
that these companies can deliver earnings growth in excess of 20% p.a. for the next few years, and
sized according to conviction levels.
We note a performance comparison of VNH vs. other funds and indeed the index is muddied by
two bonus issues of warrants that have diluted NAV/share returns over the past 5 years. Supported
by shareholders, these warrant issues have been used to help the company grow with the goal of
increasing liquidity in the shares and enhancing the fund’s appeal with investors, at a time when
the fund has traded at a discount to NAV. Investors’ actual experience will naturally depend on
whether they were on the register at the time of the bonus warrant issues and have been in a
position to avoid this dilution. VNH currently has no warrants outstanding and we are told there is
no intention to do any further issues.
Table 3: VNH – Top 10 Holdings
Name Ticker % NAV
Traphaco TRA VN 12.9%
Phu Nhuan Jewellery PNJ VN 8.5%
FPT Corp FPT VN 7.0%
Binh Minh Plastic BMP VN 6.2%
Viconship VSC VN 6.1%
Thien Long Group Corp TLG VN 5.0%
Hoa Phat Group HPG VN 4.7%
Petrovietnam Transportation PVT VN 3.6%
Vinamilk VNM VN 3.4%
Transimex-Saigon TMS VN 3.3%
Source: Company data
Chart 6: VNH - Historical Premium / Discount (3 years)
Source: Jefferies, Bloomberg
For any further details, or to trade, please contact a member of the Jefferies Investment
Companies team or email [email protected]

14 June 2017
Desk Note
Company Profile
page 11 of 14
This note has been pr epar ed by sa les or t r ading per sons of Jef fer ies Inter nat ional Limited and may not be suppor ted by independent
analysis. This document is a mar k et ing communicat ion and is not and should not be construed as investment r esearch.
Jefferies Investment Companies Team
Jefferies Investment Companies Team is a full-service, thirteen person team offering four core functions in emerging, frontier and
alternative investment companies: corporate broking and advisory (though Jefferies Hoare Govett); primary and secondary sales;
investment company research and analysis; and investment company trading and sales-trading.
Sales
Tom Harris Mark Mulholland Peter Regan Mark James Charles Stagg
+44 20 7898 7792 +44 20 7898 7106 +44 20 7898 7120 +44 20 7898 7114 +44 20 7898 7118
[email protected] [email protected] [email protected] [email protected] [email protected]
Trading Sales Trading
Paul Frankel Michele White Trevor Hunt
+44 20 7898 7790 +44 20 7898 7127 +44 20 7898 7791
[email protected] [email protected] [email protected]
Desk Strategy Research
Mark Ambrose, CFA Matthew Hose
+44 20 7898 7107 +44 20 7029 8557
[email protected] [email protected]
Corporate Broking
Andrew Morris Gary Gould Stuart Klein
+44 20 7029 8173 +44 20 7029 8682 +44 20 7029 8703
[email protected] [email protected] [email protected]
STX
Sales: 76797
Market-making: 76900
Bloomberg
JCEF <GO>, JEFR <GO>

14 June 2017
page 12 of 14
This note has been prepared by sales or trading persons of Jefferies International Limited and may not be supported by independent
analysis. This document is a marketing communication and is not and should not be construed as investment research
Desk Note
Company Profile
IMPORTANT DISCLOSURES THIS MESSAGE CONTAINS INSUFFICIENT INFORMATION TO MAKE AN INVESTMENT DECISION. Please contact your Jefferies representative for copies of the most recent
research reports on individual companies. This material has been produced by one of the following affiliates of Jefferies Group LLC (“Jefferies”):
United States: Jefferies LLC, an SEC-registered broker dealer, a CFTC-registered introducing broker and a member of FINRA and NFA; Jefferies Bache LLC, a CFTC-
registered futures commission merchant and a member of NFA; Jefferies Bache Financial Services, Inc., a CFTC-provisionally registered swap dealer and pending
membership with NFA; and Jefferies Derivative Products, LLC, CFTC-provisionally registered swap dealer and pending membership with NFA, each located at 520
Madison Avenue, New York, NY 10022.
United Kingdom: Jefferies International Limited, authorized and regulated by the Financial Conduct Authority and registered in England and Wales No. 1978621; and
Jefferies Bache Limited, authorized and regulated by the Financial Conduct Authority and registered in England and Wales No. 512397, each with their registered offices
at Vintners Place, 68 Upper Thames Street, London EC4V 3BJ.
Hong Kong: Jefferies Hong Kong Limited, licensed by the Securities and Futures Commission of Hong Kong, CE number ATS546; located at Suite 2201, 22nd Floor,
Cheung Kong Center, 2 Queen's Road Central, Hong Kong.
India: Jefferies India Private Limited, licensed by the Securities and Exchange Board of India for: NSE Capital Market Segment INB231491037; BSE Capital Market
Segment INB011491033 and Merchant Banker INM000011443, located at 42/43, 2 North Avenue, Maker Maxity, Bandra-Kurla Complex, Bandra (East) ,Mumbai 400
051.
Japan: Jefferies (Japan) Limited, Tokyo Branch, registered by the Financial Services Agency of Japan and member of the Japan Securities Dealers Association; located at
Hibiya Marine Bldg, 3F, 1-5-1 Yuraku-cho, Chiyoda-ku, Tokyo 100-0006.
Singapore: Jefferies Singapore Limited, registered in Singapore No. 200605049K and licensed by the Monetary Authority of Singapore; located at 80 Raffles Place #15-
20, UOB Plaza 2, Singapore 048624.
This material is a marketing communication and is not and should not be construed as investment research or a research report prepared by a research analyst. Any views portrayed in this material may differ from those of the research department of Jefferies. This material has not been prepared in accordance with legal requirements designed to promote the independence of investment research, and is not subject to any prohibition on dealing ahead of the
dissemination of investment research. Jefferies has employed appropriate expertise, and is of the belief that this material is clear, fair and not misleading. The
information set forth herein was obtained from sources believed to be reliable, but has not been independently verified by Jefferies. Therefore, except for any obligation
under applicable rules we do not guarantee its accuracy.
14 June 2017
page 13 of 14
This note has been prepared by sales or trading persons of Jefferies International Limited and may not be supported by independent
analysis. This document is a marketing communication and is not and should not be construed as investment research
Desk Note
Company Profile
This material is being furnished for informational purposes only and does not constitute an offer to sell or the solicitation of an offer to purchase [or otherwise trade] any
security, future, commodity, option or other financial instrument or product. This material does not constitute a personal recommendation or take into account the
particular investment objectives, financial situations, or needs of individual clients. This material is not intended to form the basis of an investment decision and has not
been verified. Jefferies makes no recommendation or representation as to, and accepts no responsibility or liability for, the accuracy or completeness of the information
contained herein. Jefferies is not an adviser as to legal, tax, accounting or regulatory matters in any jurisdiction, and is not providing any advice as to any such matter to
the recipient of this material. You should be aware of the risks of trading equities, fixed income, foreign exchange, futures, commodities or derivative instruments or in
non-liquid or emerging market investments. Derivatives generally involve leverage and are therefore more volatile than their underlying cash investments. Trading in
futures and options on futures is not appropriate for all persons, as the risk of loss is substantial. Your capital may be at risk. You should make your own independent
decision regarding any investment in the securities or instruments described herein and any such decision should be made only after reviewing the related final
documentation, conducting such investigations as you deem necessary and consulting your own legal, tax, financial, accounting and regulatory advisors in order to make
an independent determination of the suitability, risks and consequences of an investment in such securities or instruments.
The information and any opinions contained here are as of the date of this material and, if applicable, the time indicated, and Jefferies does not undertake any obligation
to update the information. All market prices, data and other information are not warranted as to completeness or accuracy and are subject to change without notice. Past
performance is not a guide to future performance, future returns are not guaranteed, and a loss of original capital may occur. Fluctuations in exchange rates could have
adverse effects on the value or price of, or income derived from, certain investments. The price and value of any investments referred to herein and the income from them
may fluctuate. Any simulations, projections, valuations and statistical analyses contained herein have been provided to assist the recipient in the evaluation of the matters
described herein; such simulations, projections, valuations and analyses may be based on subjective assessments and assumptions and may utilize one among alternative
methodologies that produce differing results; accordingly, such simulations, projections, valuations and statistical analyses (historical or otherwise) are not to be viewed as
facts and should not be relied upon as an accurate representation of future events. The information contained herein is based on data obtained from recognized statistical
services and other sources believed to be reliable. However, such information has not necessarily been verified by Jefferies, and Jefferies does not make any representations
as to its accuracy, timeliness, reliability, effectiveness, or completeness. Jefferies may from time to time issue futures reports based on fundamentals, such as expected
trends in supply and demand, as well as reports based on technical factors, such as price and volume movements. Since such reports rely upon different criteria, there
may be instances when Jefferies’ conclusions in individual reports are not in concert. Any market views or opinions expressed herein are those of the individual sender,
except where such views or opinions are expressly attributed to Jefferies or a named individual. Market views and opinions are current opinions only; Jefferies and the
individual sender accept no responsibility to update such views and opinions or to notify the recipient when they have changed.
Jefferies and its affiliates, officers, directors and employees may, directly or indirectly, effect or have effected a transaction for Jefferies’ own account in any investment
referred to herein, either before or after this material is published, or may give advice to customers which may differ from or be inconsistent with the information and
opinions contained herein or may from time to time hold long or short positions in, buy or sell (on a principal basis or otherwise), or act as market maker in, securities,
derivatives, futures or other financial instruments or products related to matters discussed herein and may make trading decisions that are different from or contrary to any
of those which may be discussed herein.
This material may contain information obtained from third parties, including ratings from credit ratings agencies such as Standard & Poor's. Reproduction and distribution
of third party content in any form is prohibited except with the prior written permission of the related third party. Third party content providers do not guarantee the
accuracy, completeness, timeliness or availability of any information, including ratings, and are not responsible for any errors or omissions (negligent or otherwise),
regardless of the cause, or for the results obtained from the use of such content. Third party content providers give no express or implied warranties, including, but not
limited to, any warranties of merchantability or fitness for a particular purpose or use. Third party content providers shal l not be liable for any direct, indirect, incidental,
exemplary, compensatory, punitive, special or consequential damages, costs, expenses, legal fees, or losses (including lost income or profits and opportunity costs) in
connection with any use of their content, including ratings. Credit ratings are statements of opinions and are not statements of fact or recommendations to purchase,
hold or sell securities. They do not address the suitability of securities or the suitability of securities for investment purposes, and should not be relied on as investment
advice.
U.S. OPTIONS ARE NOT SUITABLE FOR ALL INVESTORS. Please ensure that you have read and understand the current U.S. options risk disclosure document before
entering into any U.S. option transaction. The U.S. options disclosure document can be accessed at the following web address:
http://optionsclearing.com/about/publications/character-risks.jsp. For additional information on trading U.S. options, please contact Mike George, Head of Equity
Derivative Trading at +1 212 284-3499 or Jason Roelke, Head of New York Flow Sales at +1 212 284-2454.
In the United Kingdom and European Economic Area this material is issued and/or approved for distribution by Jefferies International Limited and Jefferies Bache Limited
and is intended for use only by persons who have, or have been assessed as having, suitable professional experience and expertise, or by persons to whom it can be
otherwise lawfully distributed. In the member states of the European Economic Area this material is for distribution only to persons who are “qualified investors” within
the meaning of article 2(1)(e) of The Prospectus Directive.
For Canadian investors, this material is intended for use only by professional or institutional investors. None of the investments or investment services mentioned or
described herein is available to other persons or to anyone in Canada who is not a “Designated Institution” as defined by the Securities Act (Ontario).
In Singapore, this material is distributed by Jefferies Singapore Limited and is intended for use only by accredited, expert or institutional investors (as defined by the
Securities and Futures Act (Cap. 289) of Singapore (the “SFA”)). Jefferies Singapore Limited is licensed under the SFA as a capital markets services license holder for the
regulated activities of “dealing in securities” and “trading in futures contracts”, and is also an exempt financial adviser under the Financial Advisers Act for advising on
securities (including collective investment schemes), futures contracts and contracts or arrangements for the purposes of foreign exchange trading. Jefferies Singapore
Limited is also exempt from licensing as a commodity broker (and therefore trading in commodity contracts) under the Commodity Trading Act (Cap. 48A of Singapore)
(“CTA”) insofar as such trading is only with accredited investors as defined under the CTA. Apart from the foregoing, Jefferies Singapore Limited is not licensed to carry
out or produce or issue any materials relating to any other regulated activities not otherwise described above.
In Japan this material is issued and/or approved for distribution by Jefferies (Japan) Limited, Tokyo Branch to institutional investors only. Jefferies (Japan) Limited will not
issue or approve for distribution any material relating to any product that Jefferies (Japan) Limited is not licensed to deal in or provide services for, including commodities,
foreign exchange, futures and options.
In Hong Kong, this material is issued and/or approved for distribution by Jefferies Hong Kong Limited and is intended for use only by professional investors as defined in
the Hong Kong Securities and Futures Ordinance and its subsidiary legislation. Jefferies Hong Kong Limited is not licensed by the Securities and Futures Commission to
conduct leveraged foreign exchange trading. Accordingly, any communications relating to leveraged foreign exchange contracts (as defined in the Securities and Futures
Ordinance) are not issued or approved for distribution by Jefferies Hong Kong Limited or its staff.
In India this material is issued and/or approved for distribution by Jefferies India Private Limited. Jefferies India Private Limited is not permitted to be associated with or
carry on any business relating to commodities or foreign exchange and therefore any material or communications relating to commodities or foreign exchange are not
issued or approved for distribution by Jefferies India Private Limited or its staff.

14 June 2017
page 14 of 14
This note has been prepared by sales or trading persons of Jefferies International Limited and may not be supported by independent
analysis. This document is a marketing communication and is not and should not be construed as investment research
Desk Note
Company Profile
In Australia this material is issued and/or approved for distribution by one of Jefferies LLC, Jefferies Bache LLC, Jefferies International Limited, Jefferies Bache Limited,
Jefferies Hong Kong Limited or Jefferies Singapore Limited. It is directed solely at wholesale clients within the meaning of the Corporations Act 2001 of Australia (the
“Corporations Act”), in connection with their consideration of any investment or investment service that is the subject of this material. Any offer or issue that is the subject
of this material does not require, and this material is not, a disclosure document or product disclosure statement within the meaning of the Corporations Act. Jefferies
LLC, Jefferies Bache LLC, Jefferies International Limited, Jefferies Bache Limited, Jefferies Hong Kong Limited and Jefferies Singapore Limited are each respectively authorized
and regulated as described herein in their home jurisdictions all of which differ from Australian laws and have each obtained relief under Australian Law, which
conditionally exempts them from holding an Australian financial services license under the Corporations Act in respect of the provision of certain financial services to
wholesale clients.
Recipients of this material in any jurisdiction should inform themselves about and observe any applicable legal requirements in relation to the receipt of this material.
Products and services mentioned herein may not be eligible for sale or available to residents of certain countries or certain categories of investors. The information
contained herein does not constitute an offer or solicitation to buy or sell or otherwise deal in any security, currency, investment or any other product, service or
information to anyone in any jurisdiction in which an offer or solicitation is not authorized or cannot legally be made, nor does it constitute an offer or solicitation by a
Jefferies entity to any person to whom it is unlawful for the Jefferies entity to make an offer or solicitation.
This document and all information herein is comprised of information, data and other material owned by either Jefferies or its data providers, which is protected under
copyright, trademark and other intellectual property laws. Jefferies and its data providers, as applicable, own all rights, t itle and interest, including without limitation, all
copyrights, in and to all content of this document. All trademarks, service marks, and logos used in the document are the trademarks service marks, or logos of Jefferies or
its data providers, as applicable. You may not use such names or logos without prior written consent of the relevant owner thereof. Other than the right to access the
document and view information contained therein under the terms and conditions set forth herein, you acquire no ownership, ti tle, right of interest, of any kind in or to
any of the content of this document.
THIS PUBLICATION AND ALL CONTENT HEREOF ARE PROVIDED SOLELY ON AN AS IS BASIS, WITHOUT ANY REPRESENTATION OR WARRANTY OF ANY KIND, EXPRESS OR
IMPLIED, AND JEFFERIES HEREBY DISCLAIMS ALL SUCH REPRESENTATIONS AND WARRANTIES OF FITNESS FOR A PARTICULAR PURPOSE AND NON-INFRINGEMENT. ANY
USE OF OR RELIANCE UPON THIS PUBLICATION, IN WHOLE OR IN PART, IS SOLELY AT THE USER’S OWN RISK.
Jefferies makes no representation that (i) the content hereof is appropriate or available for use in any particular location or (ii) that any futures, options-on-futures or other
products discussed in this document are appropriate or available for use or sale in any jurisdiction. Each user who accesses this material from any location does so on his
or her own initiative and at his or her own risk, and is responsible for compliance with all applicable local laws. Jefferies reserves the right to limit the availability of this
document to any person, geographic area, or jurisdiction it desires, at any time and in its sole discretion.
All information contained herein is intended solely for your own personal, informational use, and you are not permitted to reproduce, retransmit, disseminate, sell,
license, distribute, republish, broadcast, post, circulate or commercially exploit the information in any manner or media without the express written consent of Jefferies, or
to use the information for any unlawful purpose.
© 2017 Jefferies Group, Inc.