Vibration Spectral Analysis to Predict Asset Failures by...
15
1 Paper SAS527-2017 Vibration Spectral Analysis to Predict Asset Failures by Integrating R in SAS ® Asset Performance Analytics Adriaan Van Horenbeek, SAS Institute Inc. ABSTRACT In industrial systems, vibration signals are the most important measurements indicating asset health. Based on these measurements, an engineer with expert knowledge on the assets, industrial process and vibration monitoring can perform spectral analysis to identify failure modes. However, this is still a manual process that heavily depends on the experience and knowledge of the engineer analyzing the vibration data. Moreover, when measurements are performed continuously, it becomes impossible to act in real time on this data. Therefore, the objective of this paper is to use analytics to perform vibration spectral analysis in real time to predict asset failures. The first step in this approach is to translate engineering knowledge/features into analytic features to perform predictive modeling. This is done by converting the time signal into the frequency domain by applying a Fast Fourier Transform. Based on the specific design characteristics of the asset, it is possible to derive the relevant features of the vibration signal to predict asset failures. This approach is illustrated using a bearing data set available from the Prognostics Data Repository of NASA. The modeling part is done using R and is integrated within SAS ® Asset Performance Analytics. In essence, this approach helps the engineers to make better data-driven decisions. This paper illustrates the strength of combining expert engineering knowledge with advanced data analytics techniques to improve asset performance. INTRODUCTION Looking at the recent trends within manufacturing like Industry 4.0, smart factories, and the Industrial Internet of Things (IIoT), it is obvious that manufacturing assets and equipment will only generate more data in the coming years. Sensors are becoming cheaper, signal processing capabilities have improved, and wireless data acquisition of these sensor measurements is becoming mainstream. One of the most promising fields within manufacturing to use this data is within asset management, more specifically predictive maintenance. So what does it mean and where did it originate? Many definitions on maintenance exist, but when considering the bottom line, it can be best defined as a set of activities required to keep equipment, installations, and other physical assets in the desired operating condition or to restore them to this condition (Pintelon and Van Puyvelde 2006). However, this definition is too simple and narrow to define maintenance in all its complexities; therefore, the term asset management has been recently defined. Asset management, even more profound than maintenance management, focuses on the entire life cycle of an asset, including strategy, risk measurement, safety and environment, and human factors. The focus of this paper lies within physical asset management. A publicly available specification for the optimized management of physical assets published by the British Standards Institution (PAS 55:2008) defines physical asset management as follows: “Asset management can be defined as the systematic and coordinated activities and practices through which an organization optimally and sustainably manages its assets and asset systems, their associated performance, risks and expenditures over their life cycles for the purpose of achieving its organizational strategic plan.” (PAS 55:2008) Maintenance, as such, is thus part of a bigger asset management strategy. In the last several decades, maintenance practice has gone through a process of change due to the increasing awareness of its importance. In the 1950s, corrective or reactive maintenance (run-to-failure) was the predominant maintenance policy. In the 1960s, preventive maintenance (time- or use-based maintenance) became popular. Regular component replacements were scheduled in order to try to avoid any possible— unscheduled—failure, regardless of the health status of a physical asset. In the second half of the 1980s, more and more companies were wondering whether they were not overdoing maintenance by replacing components that could have lasted longer, for example. Therefore, condition monitoring and diagnostic technologies were developed, and consequently, condition-based maintenance (CBM) emerged.
Transcript of Vibration Spectral Analysis to Predict Asset Failures by...

1
Paper SAS527-2017
Vibration Spectral Analysis to Predict Asset Failures by Integrating R in SAS® Asset Performance Analytics
Adriaan Van Horenbeek, SAS Institute Inc.
ABSTRACT
In industrial systems, vibration signals are the most important measurements indicating asset health. Based on these measurements, an engineer with expert knowledge on the assets, industrial process and vibration monitoring can perform spectral analysis to identify failure modes. However, this is still a manual process that heavily depends on the experience and knowledge of the engineer analyzing the vibration data. Moreover, when measurements are performed continuously, it becomes impossible to act in real time on this data. Therefore, the objective of this paper is to use analytics to perform vibration spectral analysis in real time to predict asset failures. The first step in this approach is to translate engineering knowledge/features into analytic features to perform predictive modeling. This is done by converting the time signal into the frequency domain by applying a Fast Fourier Transform. Based on the specific design characteristics of the asset, it is possible to derive the relevant features of the vibration signal to predict asset failures. This approach is illustrated using a bearing data set available from the Prognostics Data Repository of NASA. The modeling part is done using R and is integrated within SAS® Asset Performance Analytics. In essence, this approach helps the engineers to make better data-driven decisions. This paper illustrates the strength of combining expert engineering knowledge with advanced data analytics techniques to improve asset performance.
INTRODUCTION Looking at the recent trends within manufacturing like Industry 4.0, smart factories, and the Industrial Internet of Things (IIoT), it is obvious that manufacturing assets and equipment will only generate more data in the coming years. Sensors are becoming cheaper, signal processing capabilities have improved, and wireless data acquisition of these sensor measurements is becoming mainstream. One of the most promising fields within manufacturing to use this data is within asset management, more specifically predictive maintenance. So what does it mean and where did it originate?
Many definitions on maintenance exist, but when considering the bottom line, it can be best defined as a set of activities required to keep equipment, installations, and other physical assets in the desired operating condition or to restore them to this condition (Pintelon and Van Puyvelde 2006). However, this definition is too simple and narrow to define maintenance in all its complexities; therefore, the term asset management has been recently defined. Asset management, even more profound than maintenance management, focuses on the entire life cycle of an asset, including strategy, risk measurement, safety and environment, and human factors. The focus of this paper lies within physical asset management. A publicly available specification for the optimized management of physical assets published by the British Standards Institution (PAS 55:2008) defines physical asset management as follows:
“Asset management can be defined as the systematic and coordinated activities and practices through which an organization optimally and sustainably manages its assets and asset systems, their associated performance, risks and expenditures over their life cycles for the purpose of achieving its organizational strategic plan.” (PAS 55:2008)
Maintenance, as such, is thus part of a bigger asset management strategy. In the last several decades, maintenance practice has gone through a process of change due to the increasing awareness of its importance. In the 1950s, corrective or reactive maintenance (run-to-failure) was the predominant maintenance policy. In the 1960s, preventive maintenance (time- or use-based maintenance) became popular. Regular component replacements were scheduled in order to try to avoid any possible—unscheduled—failure, regardless of the health status of a physical asset. In the second half of the 1980s, more and more companies were wondering whether they were not overdoing maintenance by replacing components that could have lasted longer, for example. Therefore, condition monitoring and diagnostic technologies were developed, and consequently, condition-based maintenance (CBM) emerged.
2
Condition-based maintenance is defined according to the European standard (EN 13306:2010) as follows: “preventive maintenance which includes a combination of condition monitoring and/or inspection and/or testing, analysis and the ensuing maintenance actions”. In this way, CBM attempts to avoid unnecessary maintenance activities by triggering these actions only when there is evidence of deterioration or abnormal behavior by monitoring intermittently or continuously. In the beginning, this seemed to be reserved for the high-risk industries, but as it became cheaper, it found its way to the industry at large. Recently, prognostics, which deals with fault prediction before it occurs, made its introduction into maintenance management. Fault prediction determines whether a fault is impending and estimates how soon and how likely a fault will occur (Jardine, D. Lin, et al. 2006). A maintenance policy incorporating prognostics into the decision process is defined as a predictive maintenance policy (PdM). Predictive maintenance can be defined as: “condition-based maintenance carried out following a forecast (that is, remaining useful life [RUL]) derived from repeated analysis or known characteristics and evaluation of the significant parameters of the degradation of the item” (EN 13306:2010). This means that, compared to CBM, PdM incorporates more information into the maintenance decision process as information about future machine or component degradation, in the form of their remaining useful life by prognostics, is taken into account.
For condition monitoring of rotating equipment, the most widely used technology is vibration analysis. Depending on the application, the displacement, velocity, or acceleration is measured. The captured time signal is then converted to a frequency spectrum to identify the frequencies where you can see a change in amplitude to diagnose the specific failure mode of the asset. For more information about vibration analysis, I refer you to the book by Cornelius Scheffer and Paresh Girdhar cited in Recommended Reading. The current state of vibration analysis within manufacturing is that a technician walks around with route-based vibration analyzers and collects data points each month or each quarter. Only the really critical equipment has some continuous measurement systems in place. Moreover, the scope of analysis is limited to a single asset. Some issues arise from this approach:
After the condition monitoring round is done by the technician, the data is analyzed by spectral analysis to identify failure modes by an engineer with expert knowledge on the assets, industrial process, and vibration monitoring techniques. The engineer compares the current measurement to previous measurements by a mostly manual approach. Therefore, it is a process that heavily depends on the experience and knowledge of the engineer analyzing the vibration data and it is very resource-intensive.
The features that have to be monitored are derived purely from an engineering perspective. This process is time-consuming as the features are different for each type of equipment.
Finding the right skilled people to do this analysis is challenging.
Only intermittent data is available on a weekly, monthly, or quarterly basis. As such, the probability of missing out on failures increases.
Because of the recent evolutions in sensors, data acquisition, and signal processing, and as a result the advent of Industry 4.0 and the Industrial Internet of Things, companies are looking to solve these issues with the traditional condition monitoring approach. Due to the decreasing cost of sensors, it is possible to install permanent sensors on the assets in order to continuously monitor the asset health. By doing so they reduce costs, as no people have to run around in the plant just to collect data. They have the opportunity to continuously monitor their assets rather than only intermittently monitoring them. However, doing so also introduces new challenges within manufacturing, which is, by the way, good news for analytics:
The challenge of scaling this approach to continuously monitored systems and data spawning sensors is huge. The right skilled people to handle this huge amount of data are not available and even for the right skilled, it is a challenge to analyze this amount of data without the proper tooling.
Due to the decreasing cost of sensors, it will even become interesting, from a business case perspective, to start monitoring non-critical equipment, which only makes the collected, to-be-analyzed data bigger.
If all assets are equipped with sensors, you need specific information about each piece of equipment

3
to determine the relevant features to be monitored. As this has to be done by people with engineering skills, this is a major issue regarding the resources necessary to do so.
The opportunity to react in real time (which comes by implementing continuous monitoring) to alerts disappears when the data still needs to be analyzed by an engineer.
Due to the huge amounts of data that will be collected, it becomes even more difficult to find the real issues and prioritize these issues and the generated alerts.
When you combine vibration data with other condition monitoring data (for example, thermography or current measurements) or even process data, maintenance data, quality data, and so on, the real challenge arises.
The good thing is that analytics provides an answer to all the above challenges that manufacturing companies are facing when making the transition toward the integration of the Internet of Things for condition monitoring. Therefore, the objective of this paper is to provide insight on how analytics can be leveraged to generate value within asset management. More specifically, you will get insight on how SAS® Asset Performance Analytics, which was designed for this purpose, provides a solution for manufacturing companies. Moreover, a detailed and scoped example on how to use the SAS Asset Performance Analytics solution to perform vibration analysis is given. The focus is on how to scale the vibration spectral analysis when continuous measurements become available, on how to make this analysis available to non-experts through SAS Asset Performance Analytics, and on illustrating the strength of combining expert engineering knowledge with advanced data analytics techniques to improve asset performance in the era of the Internet of Things.
The detailed vibration spectral analysis is illustrated using a bearing data set available from the Prognostics Data Repository of NASA. The modeling part is done using R and is integrated within SAS Asset Performance Analytics. I hear you say: “Why do you do this in R and not SAS®?” I played around with the vibration data set in the past, before I started at SAS. I did it in open-source software, more specifically in R. As I already did the work in the past, I didn’t want to invest time to just copy my work in SAS code. I wanted to use the R code I developed earlier and industrialize it so that everybody can use it through the SAS Asset Performance Analytics interface. This perfectly mimics a situation we regularly encounter at our manufacturing customers.
By reading this paper I hope you will gain insight into how to use SAS Asset Performance Analytics to improve asset performance. You will learn how to perform vibration spectral analysis, how to integrate R code into SAS Asset Performance Analytics, and finally how to make it available for other people and scalable to an entire manufacturing plant. Moreover, I will give some insight into how to further develop this approach.
ANALYTICS WITHIN ASSET MANAGEMENT
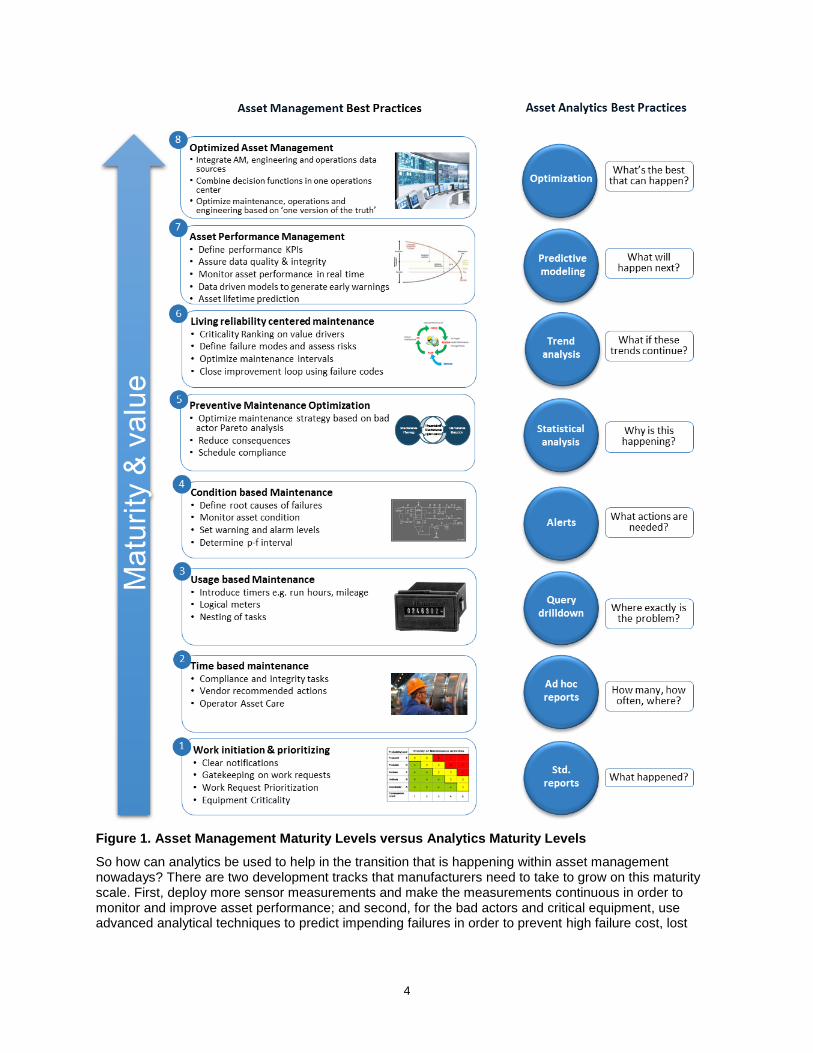
Within asset management it is crucial to consider the different maturity levels as defined, for example, in standards like PAS 55:2008 and ISO 55000. All manufacturing companies use these maturity scales to benchmark themselves compared to a world-class company. Moreover, they use it to build their strategy on how to improve their asset management strategy. These maturity levels can be summarized as shown in Figure 1. It is valuable to note that SAS Asset Performance Analytics (further discussed in SAS Asset Performance Analytics solution) covers the entire spectrum of maturity steps in asset management, from standard reporting capabilities to reliability modeling and trend analysis to advanced predictive modeling and optimization. As such, it provides an end-to-end solution for asset management within manufacturing.
Most manufacturing companies are somewhere between level 4 and 5 of this asset management maturity scale, so there is still quite some improvement potential at stake. What has analytics to do with this asset management maturity scale? Definitely a lot. If we look at the analytics maturity levels defined by Thomas H. Davenport, it is striking to see that these map very well on the maturity levels defined within asset management. When you think about it, this is logical. To get to higher levels on the asset management maturity level, you have to make better use of data. And this is exactly where analytics comes into play.
4
Figure 1. Asset Management Maturity Levels versus Analytics Maturity Levels
So how can analytics be used to help in the transition that is happening within asset management nowadays? There are two development tracks that manufacturers need to take to grow on this maturity scale. First, deploy more sensor measurements and make the measurements continuous in order to monitor and improve asset performance; and second, for the bad actors and critical equipment, use advanced analytical techniques to predict impending failures in order to prevent high failure cost, lost

5
production, downtime, and safety and environmental issues. These two approaches are shown in Figure 2 and discussed more in detail in the following paragraphs.
Figure 2. How Analytics Can Be Used to Further Develop Asset Management Maturity
The first path that I will discuss is how to scale your data-driven decisions (indicated by number ‘1’ in Figure 2). Currently in most manufacturing companies, there is some sort of reliability modeling and condition monitoring happening. However, most of the time, it is still limited to a scope of a single asset and based on ad hoc analysis performed by the engineers. There are two major reasons why it stays limited to a single asset. The first reason is that the analysis becomes too complex, cumbersome, and resource-intensive when it is scaled to an entire plant. The second reason is that currently the asset health features that are monitored are defined by engineering knowledge and these must be specified for each asset separately. This becomes challenging when many assets have to be considered. As more sensor data becomes available on a continuous basis, the first step is to automate the analysis of this continuously measured condition monitoring data for a single asset. By automating this, engineers can spend time only on the real issues, rather than wasting time on analyzing all data, and resolve these faster. Furthermore, analytics can be used to automatically derive the relevant features to monitor that makes you scale fast. When issues arise on a specific asset, a deep dive can be made by the engineer, and engineering knowledge-based features can be incorporated into the analysis or advanced predictive models can be developed. As such, a continuous improvement program can be introduced. The automation of the analysis and feature definition becomes even more important when we scale the condition monitoring approach to multiple assets, the entire plant, and even the entire company. Analytics provides an answer to these challenges.
The second path is to develop advanced predictive models to predict remaining useful life for the bad actor assets. For rotating equipment, condition monitoring is performed by measuring specific asset-oriented variables like vibration. Based on the analysis of known failure modes, degradation patterns, and aging, it is possible to develop predictive models. Prognostics is currently only implemented when there is sound knowledge of the failure mechanisms that are likely to cause failure. Although still useful for certain

6
assets, most prognostic solutions are limited in scope by a considerable narrow scope of data that is used for the analysis and only a limited set of known failure modes that can be detected. The data used will typically only be condition monitoring data like vibration, thermal, and oil analysis results. As such, most manufacturers still ignore the most important factors to predict asset failures like how the asset is operated, changes in product composition, variability in process conditions, and so on. It is only when combining the traditional condition monitoring measurements with additional process data, maintenance data, engineering data, and quality data that the real health of an asset can be determined and predicted. This however introduces additional challenges like the amount of data that has to be integrated and analyzed, the complexity of linking operations and maintenance, and the introduction of asset interdependencies into the analysis. Advanced analytics provides an answer to address these challenges to develop predictive maintenance models considering all relevant asset data and failure modes. This approach introduces predictive maintenance based on evolving knowledge of operation history and anticipated usage of the machinery, as well as the physics and dynamics of material degradation in critical components.
In this paper, I will focus on how to approach the first development path on how to scale your data-driven decisions from a single asset to the entire company by automatically deriving the relevant features to monitor and by making the analysis available through the pre-defined analysis workspace of the SAS Asset Performance Analytics workspace.
SAS ASSET PERFORMANCE ANALYTICS SOLUTION
SAS Asset Performance Analytics is the part of the SAS Quality Analytic Suite that monitors equipment sensors and machine-to-machine (M2M) data to identify hidden patterns that predict slowdowns and failures. The advanced analytics, data mining, and data visualization capabilities allow engineers to identify the real drivers of performance issues out of hundreds or even thousands of measures and conditions. By doing so a predictive maintenance culture is introduced into an organization by implementing SAS Asset Performance Analytics. This foresight gives operations personnel time to bring the equipment down in a planned and controlled way to address the following issues: avoiding unplanned downtime, excessive maintenance costs, revenue losses and environment, and health and safety issues. SAS Asset Performance Analytics also helps you reduce personnel and maintenance costs by pinpointing problems and aligning resources. It also allows you to detect and correct issues earlier to mitigate the risk of failures and downtimes.
Next to the predictive capabilities of SAS Asset Performance Analytics, SAS® Quality Analytic Suite provides common features such as the report and dashboard library, visualization and exploration tools, and pre-defined analytical models (that is, stability monitoring and root cause analysis).
SAS Asset Performance Analytics is packaged with domain-specific data management including:
data model (single, integrated, and aggregated view of all relevant data and information) and methods to easily build data sets for modeling (for example, to build predictive failure models) and root cause analysis
unique modeling techniques for assets
business rules and processes designed to address the complexity of "dirty" sensor data and set threshold based alarms and alerts
unique user interfaces, including sensor, event and asset visualization
standard, pre-built reports for asset performance management and to assess and improve data quality.
SAS Asset Performance Analytics is an analytics-driven solution that helps manufacturers to achieve the goal of optimally managing their assets by addressing all asset management maturity levels like shown in Figure 1.
Due to the automated monitoring and alerts, engineers are directed toward issues and can focus on the issues that need fast problem resolution rather than having to focus on analyzing non-relevant data. Automatic monitoring is introduced by implementing basic to advanced alarms and alerts. Basic alerts are

7
for example, threshold or rate-of-change based, while advanced alerts are triggered by advanced predictive models that predict remaining useful lifetime. Once an alert is triggered, notifications can be sent via email, text, or pager, as part of a workflow or integrated into your operational systems. Alerts guide engineers directly to the supporting control charts and supplemental reports can be supplied for analysis. Users can easily drill down to better understand the root cause of the issue. Workflows are initiated and case management provides a knowledge repository for standardized problem resolution, enabling auditability for asset and process changes. Advanced predictive modeling accurately and reliably finds hidden patterns in the data that indicate an impending failure or performance degradation. New models are developed based on historical events by not only taking into account condition monitoring data (as in the traditional Condition-Based Maintenance [CBM] technologies) but also for example, process parameters. Moreover, traditional CBM technologies focus on one piece of equipment at a time, while the advanced predictive models and analytics are not limited to one piece of equipment because of their capability to analyze massive amounts of data at once. As such, it is possible to take into account data from the entire process line to develop these predictive models. In the dawn of the Internet of Things era, high-performance analytics ensures virtually limitless scalability to continuously monitor the health of your assets. You can test new sensor data against defined rules, thresholds, and predictive scoring models to give you ample time to take the appropriate corrective actions.
Altogether, SAS Asset Performance Analytics provides analytic and predictive capabilities that your organization can use to ensure peak performance and minimal downtime for crucial assets and equipment. AS Asset Performance Analytics provides data integration, advanced analytics, data visualization, and exploration capabilities. It allows engineers, business users, and data scientists to identify the real drivers of performance issues out of hundreds or even thousands of measures and conditions and different data sources. As such it supports both your short-term and daily decision processes as well as your long-term asset management strategy. Moreover, by illustrating how to integrate R programming into SAS Asset Performance Analytics and making the analysis available as a guided point-and-click analysis (this can, of course, also be done for SAS programs), manufacturers are able to extend their analytical knowledge and insights well beyond their core analytics team. Engineers are not statisticians and/or programmers.
In the following paragraphs, I will illustrate how to perform vibration spectral analysis, how to integrate the R code into SAS Asset Performance Analytics and industrialize the analysis so that everybody can use it through the SAS Asset Performance Analytics interface. I will show how to use this to detect and predict failures.
INTRODUCTION TO THE DATA SET
In rotating industrial equipment, vibration signals are the most important measurements indicating asset health. These vibration measurements generate high frequency time series data. Vibration spectral analysis is performed by converting the time signal into the frequency domain by applying a Fast Fourier Transform. Based on this vibration spectrum it is possible to identify potential asset failures. This approach is illustrated using a bearing data set available from the Prognostics Data Repository of NASA. The data was generated by the NSF I/UCR Center for Intelligent Maintenance Systems with support from Rexnord Corp. in Milwaukee, WI.
The data does not allow us to build advanced predictive models as we do not have enough failure events and it is impossible to find an open data source that does. So in this paper I will focus on how you can scale the condition-based activities. However, based on this, I will also give some insight into how to start building predictive models based on the work done.
TEST RIG SETUP
Four bearings were installed on a shaft. The rotation speed was kept constant at 2000 RPM by an AC motor coupled to the shaft via rub belts. A radial load of 6000 lbs is applied onto the shaft and bearing by a spring mechanism. All bearings are force lubricated.
Rexnord ZA-2115 double row bearings were installed on the shaft as shown in Figure 3. PCB 353B33 High Sensitivity Quartz ICP accelerometers were installed on the bearing housing (two accelerometers for each bearing [x- and y-axes] for data set 1, and one accelerometer for each bearing for data sets 2 and

8
3). Sensor placement is also shown in Figure 3. All failures occurred after exceeding the designed life time of the bearing, which is more than 100 million revolutions. More details can be found in (Qiu, H., J. Lee et al., 2006).
Figure 3. Bearing Test Rig and Sensor Placement (Qiu, H., J. Lee et al., 2006)
VIBRATION DATA SET
Three data sets are included. Each data set describes a test-to-failure experiment. Each data set consists of individual files (2156 files to be precise for the first test) that are 1,024-second vibration signal snapshots recorded at specific intervals. Each file consists of 20,480 points with the sampling rate set at 20 kHz. The filename indicates when the data was collected. Each record (row) in the data files is a data point. Data collection was facilitated by a National Instruments data acquisition card (NI DAQ Card 6062E). Larger intervals of time stamps indicate resumption of the experiment in the next working day. For this paper, I focus on the first test-to-failure experiment. At the end of the first test-to-failure experiment, an inner race defect occurred in bearing 3 and a roller element defect and outer race defect occurred in bearing 4. For this paper, I will focus on the failure on bearing 4 as an illustration.
VIBRATION SPECTRAL ANALYSIS TO PREDICT ASSET FAILURES BY INTEGRATING R IN SAS ASSET PERFORMANCE ANALYTICS
Display 1 shows the custom SAS Asset Performance Analytics analysis used to demonstrate the SAS open-source integration capabilities using a simple five-step approach. Step 1 identifies which analysis to run. Step 2 initializes the data selections that can be used for the vibration analysis. Step 3 prompts the user to select an SAS Asset Performance Analytics data selection as input to the R analysis. Step 4 prepares the SAS Asset Performance Analytics data for R using simple SAS DATA step code and performs the selected vibration analysis in R. Step 5 generates the saved plots from the R analysis in the SAS Asset Performance Analytics user interface.
The SAS Asset Performance Analytics stored process incorporates R using the IML procedure with the Submit /R statement, and the R output is temporarily saved as a PNG file. Finally, a %include statement and GSLIDE procedure iframe statement is used to call the R code and display analysis results within the SAS Asset Performance Analytics user interface environment. This approach allows users to easily access and modify the PROC IML program and enhance their SAS Asset Performance Analytics analysis workspace with open-source analytics.
9
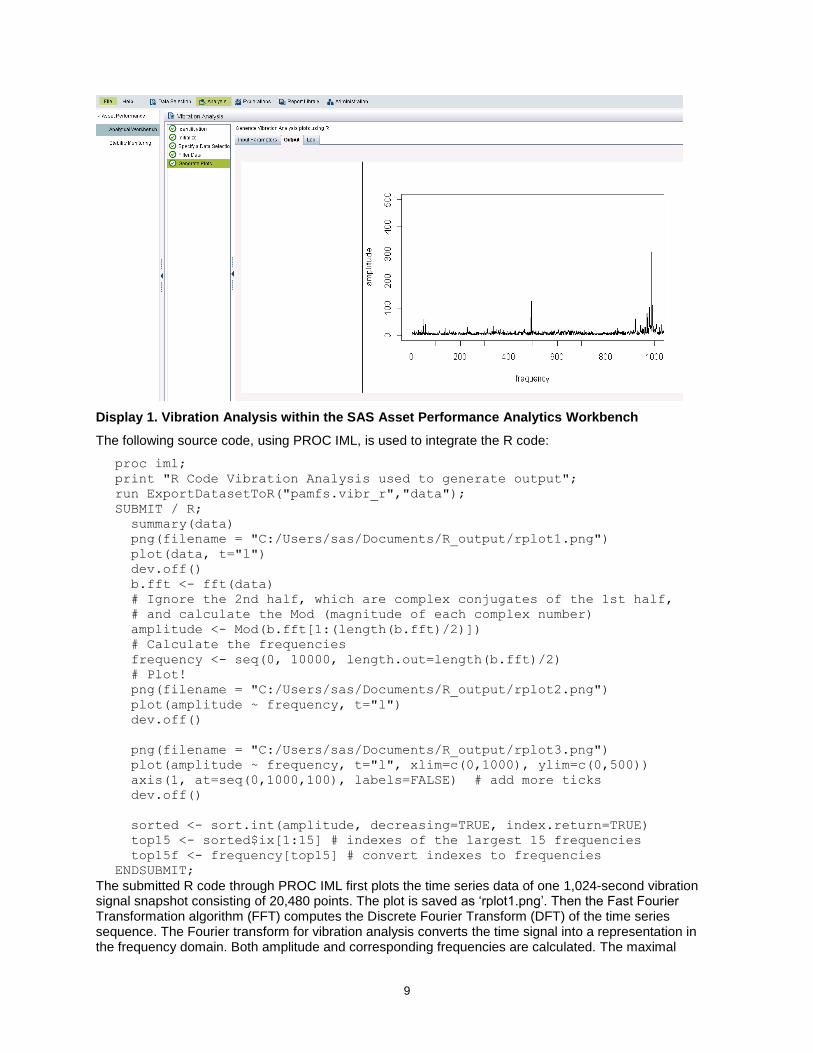
Display 1. Vibration Analysis within the SAS Asset Performance Analytics Workbench
The following source code, using PROC IML, is used to integrate the R code:
proc iml;
print "R Code Vibration Analysis used to generate output";
run ExportDatasetToR("pamfs.vibr_r","data");
SUBMIT / R;
summary(data)
png(filename = "C:/Users/sas/Documents/R_output/rplot1.png")
plot(data, t="l")
dev.off()
b.fft <- fft(data)
# Ignore the 2nd half, which are complex conjugates of the 1st half,
# and calculate the Mod (magnitude of each complex number)
amplitude <- Mod(b.fft[1:(length(b.fft)/2)])
# Calculate the frequencies
frequency <- seq(0, 10000, length.out=length(b.fft)/2)
# Plot!
png(filename = "C:/Users/sas/Documents/R_output/rplot2.png")
plot(amplitude ~ frequency, t="l")
dev.off()
png(filename = "C:/Users/sas/Documents/R_output/rplot3.png")
plot(amplitude ~ frequency, t="l", xlim=c(0,1000), ylim=c(0,500))
axis(1, at=seq(0,1000,100), labels=FALSE) # add more ticks
dev.off()
sorted <- sort.int(amplitude, decreasing=TRUE, index.return=TRUE)
top15 <- sorted$ix[1:15] # indexes of the largest 15 frequencies
top15f <- frequency[top15] # convert indexes to frequencies
ENDSUBMIT;
The submitted R code through PROC IML first plots the time series data of one 1,024-second vibration signal snapshot consisting of 20,480 points. The plot is saved as ‘rplot1.png’. Then the Fast Fourier Transformation algorithm (FFT) computes the Discrete Fourier Transform (DFT) of the time series sequence. The Fourier transform for vibration analysis converts the time signal into a representation in the frequency domain. Both amplitude and corresponding frequencies are calculated. The maximal
10
frequency is 10,000 Hz, which is the Nyquist frequency and equals half the sampling rate (20,000 Hz). A plot of the frequency spectrum is made and saved to ‘rplot2.png’. A third plot with a zoom on the frequency range from 0 Hz to 1000 Hz is made and saved to ‘rplot3.png’. As the last step, the 15 strongest frequency components from the spectrum are extracted as features. If you would like to add additional analysis within R, this can be easily done by modifying the PROC IML program.
Finally, a %include statement and PROC GSLIDE iframe statement are used to call the result of the R code and display analysis results within the SAS Asset Performance Analytics user interface environment:
%include "C:\Program Files\R\R_code.sas";
%let inhtml=" C:/Users/sas/Documents/R_output/rplot1.png";
proc gslide iframe=&inhtml imagestyle=fit; run;
PREREQUISITES TO RUN R CODE IN SAS ASSET PERFORMANCE ANALYTICS
To be able to perform the developed vibration analysis within the SAS Asset Performance Analytics pre-defined analysis workspace, some prerequisite activities need to be done:
1. Download and install R version 2.15.0 or later.
2. Update the sasv9.cfg file to include the R language. To do so, open the sasv9.cfg file with Notepad and add option “–RLANG” to this file. I recommend adding -RLANG below the -TRAINLOC "" statement. Save the updated sasv9.cfg file and then close the file.
3. Import the SAS Asset Performance Analytics vibration analysis R code stored process package into SAS Asset Performance Analytics.
RUN VIBRATION SPECTRAL ANALYSIS IN SAS ASSET PERFORMANCE ANALYTICS
The vibration analysis can now be run through the pre-defined analysis within the SAS Asset Performance Analytics workbench. There are five steps in the vibration analysis.
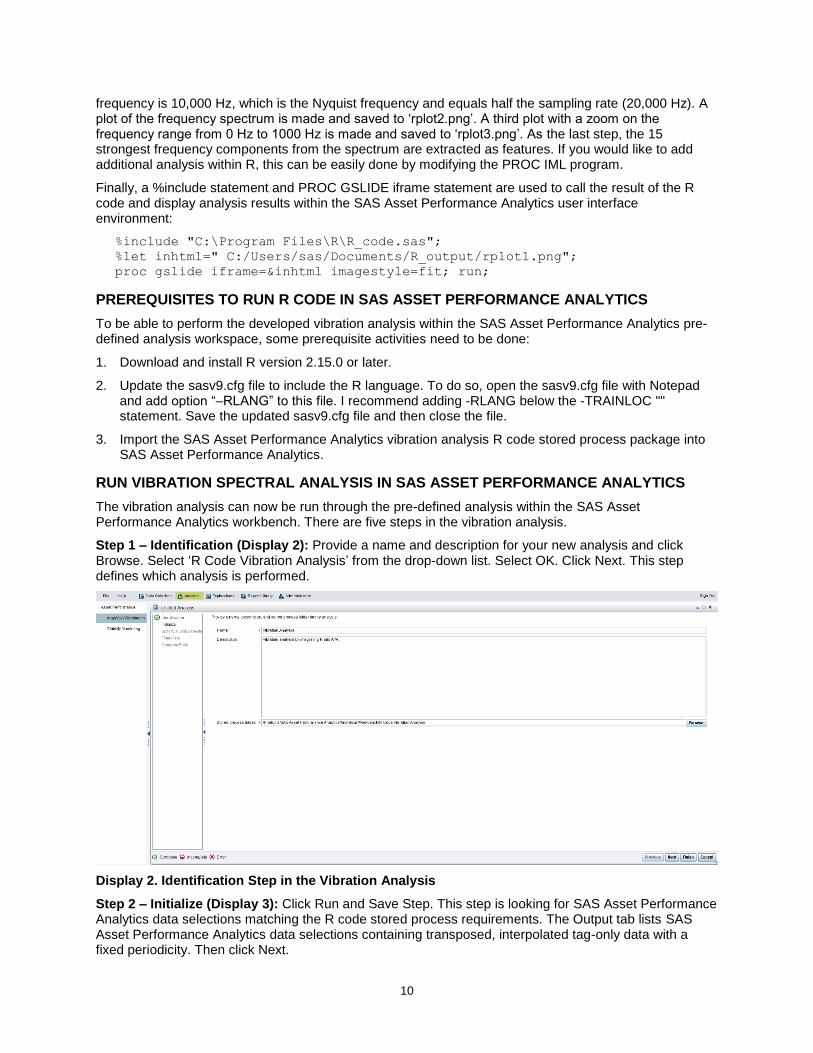
Step 1 – Identification (Display 2): Provide a name and description for your new analysis and click Browse. Select ‘R Code Vibration Analysis’ from the drop-down list. Select OK. Click Next. This step defines which analysis is performed.
Display 2. Identification Step in the Vibration Analysis
Step 2 – Initialize (Display 3): Click Run and Save Step. This step is looking for SAS Asset Performance Analytics data selections matching the R code stored process requirements. The Output tab lists SAS Asset Performance Analytics data selections containing transposed, interpolated tag-only data with a fixed periodicity. Then click Next.

11
Display 3. Initialization Step in the Vibration Analysis
Step 3 – Specify a data selection (Display 4): Select an SAS Asset Performance Analytics data selection as input for the R code. Then click Run and Save Step. The Output tab shows a sample of the selected data set. Then click Next.
Display 4. Data Selection Step in the Vibration Analysis
Step 4 – Filter data (Display 5): Here you can define through the drop-down menu which data to include in the R code vibration analysis and which type of analysis you want to run. Then click Run and Save Step. The Output tab shows the result of the selected analysis in table format. For example, a means procedure is run on the frequency component with the highest amplitude through time for each sensor on the bearings.

12
Display 5. Filter Data Step in the Vibration Analysis
Step 5 – Generate plots (Display 6): Click Run and Save Step to see the visual output of the analysis. For example, the Output tab shows the frequency spectrum based on a Fast Fourier Transform for one of the bearing measurements.
Display 6. Generate Plots Step in the Vibration Analysis
RESULTS AND NEXT STEPS
Based on the pre-defined vibration analysis, it is possible to identify anomalies and trigger an alert when a potential failure will happen. The anomalies can automatically be identified by monitoring, for example, the frequencies with the highest amplitude and their change, crest factor, true peak, and RMS or engineering-based features.
The analysis still falls short on diagnosing the exact failure mode. (This is a nice opportunity for advanced analytics and future work). The result of the analysis tells you when the normal pattern has changed, but still has no clue on how the specific asset works and therefore can’t tell you which failure mode is developing. Fortunately, this is exactly the time for vibration analysis specialists to step in. They can draw on their deep understanding of the asset to identify and solve the specific failure mode. However, all repetitive work of sifting out abnormalities from the billions of data points has already been done. By

13
scheduling and automating this analysis and anomaly detection in SAS Asset Performance Analytics, engineers only focus on the alerts that are generated, and they do not waste anytime on analyzing irrelevant data as is currently the case in most manufacturing companies. Furthermore, the engineers can run the analysis on an ad hoc basis without needing expert knowledge on the underlying algorithms. When you look at Figure 4, you can clearly see how the vibration spectrum of bearing 4 changes as the degradation evolves through time. The failure happened on 25/11/2003.
Figure 4. Evolution of Degradation in Vibration Spectrum of Bearing 4
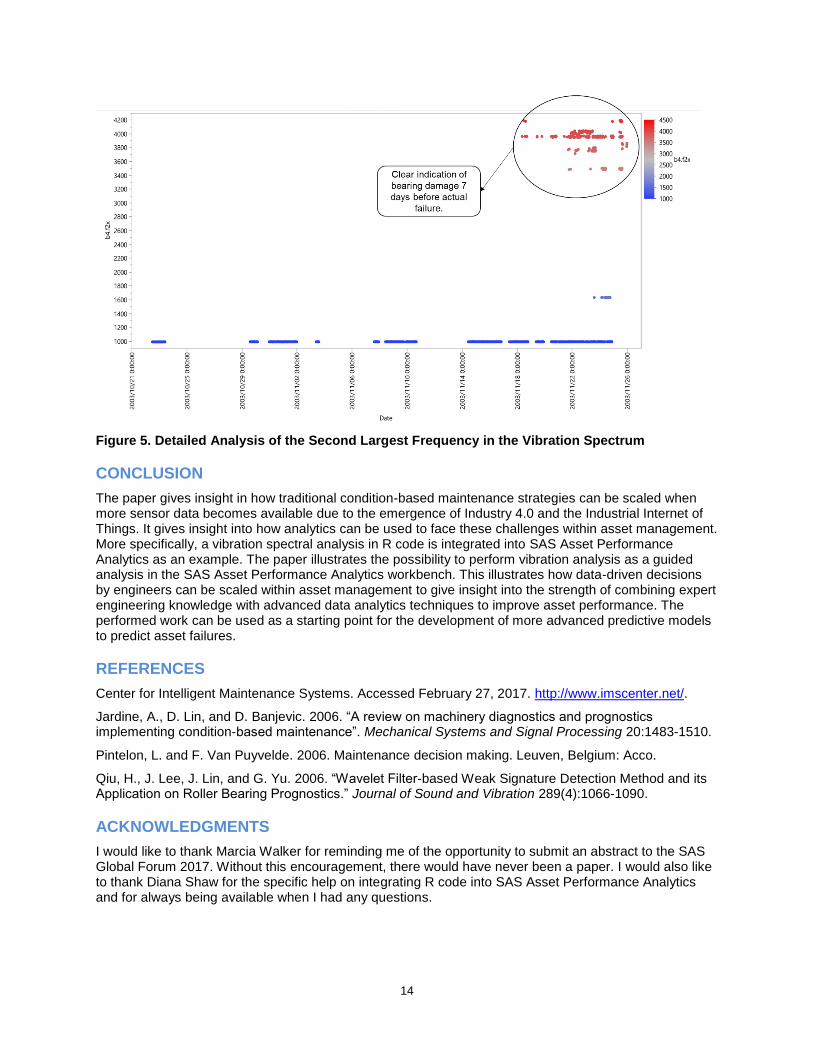
When you look more in detail to the extracted features (15 strongest frequency components in the vibration spectrum), the same conclusion is true. If you look to the second strongest frequency component (strongest one is the DC component) over time for the x-axis of bearing 4 in Figure 4, you can see a clear shift 7 days before the failure happened. Based on this feature, an alert is triggered and a specialist can investigate this more in detail.
For next steps and further development, you can add the extraction of additional features to the vibration analysis. Moreover, you can use these features as an input for advanced analytical models to predict failures, given that you have enough historical failure events. Another option is to define a failure catalog based on the ‘finger prints’ of historical failures and use these on new data to predict and categorize failure modes accordingly. Another important next step is to add process and operational data, quality data and so on to the traditional condition monitoring data to enhance failure prediction.
14
Figure 5. Detailed Analysis of the Second Largest Frequency in the Vibration Spectrum
CONCLUSION
The paper gives insight in how traditional condition-based maintenance strategies can be scaled when more sensor data becomes available due to the emergence of Industry 4.0 and the Industrial Internet of Things. It gives insight into how analytics can be used to face these challenges within asset management. More specifically, a vibration spectral analysis in R code is integrated into SAS Asset Performance Analytics as an example. The paper illustrates the possibility to perform vibration analysis as a guided analysis in the SAS Asset Performance Analytics workbench. This illustrates how data-driven decisions by engineers can be scaled within asset management to give insight into the strength of combining expert engineering knowledge with advanced data analytics techniques to improve asset performance. The performed work can be used as a starting point for the development of more advanced predictive models to predict asset failures.
REFERENCES
Center for Intelligent Maintenance Systems. Accessed February 27, 2017. http://www.imscenter.net/.
Jardine, A., D. Lin, and D. Banjevic. 2006. “A review on machinery diagnostics and prognostics implementing condition-based maintenance”. Mechanical Systems and Signal Processing 20:1483-1510.
Pintelon, L. and F. Van Puyvelde. 2006. Maintenance decision making. Leuven, Belgium: Acco.
Qiu, H., J. Lee, J. Lin, and G. Yu. 2006. “Wavelet Filter-based Weak Signature Detection Method and its Application on Roller Bearing Prognostics.” Journal of Sound and Vibration 289(4):1066-1090.
ACKNOWLEDGMENTS
I would like to thank Marcia Walker for reminding me of the opportunity to submit an abstract to the SAS Global Forum 2017. Without this encouragement, there would have never been a paper. I would also like to thank Diana Shaw for the specific help on integrating R code into SAS Asset Performance Analytics and for always being available when I had any questions.

15
RECOMMENDED READING
Practical Machinery Vibration Analysis and Predictive Maintenance by Cornelius Scheffer and Paresh Girdhar. 2004.
CONTACT INFORMATION
Your comments and questions are valued and encouraged. Contact the author at:
Adriaan Van Horenbeek SAS Institute Inc. +32 499 56 56 98 [email protected]
SAS and all other SAS Institute Inc. product or service names are registered trademarks or trademarks of SAS Institute Inc. in the USA and other countries. ® indicates USA registration.
Other brand and product names are trademarks of their respective companies.