Vibration Monitor - mmf.de · Bus Connectors ... Bar Indicator ... Stud bolt smooth surface...
51
Instruction Manual Manfred Weber Metra Mess- and Frequenztechnik in Radebeul e.K. Meissner Str. 58 - D-01445 Radebeul Tel. +49-351 849 21 04 Fax +49-351 849 21 69 Email: [email protected] Internet: www.MMF.de Vibration Monitor M14
-
Upload
phungkhanh -
Category
Documents
-
view
227 -
download
1
Transcript of Vibration Monitor - mmf.de · Bus Connectors ... Bar Indicator ... Stud bolt smooth surface...

Instruction Manual
Manfred Weber
Metra Mess- and Frequenztechnik in Radebeul e.K.
Meissner Str. 58 - D-01445 Radebeul
Tel. +49-351 849 21 04 Fax +49-351 849 21 69
Email: [email protected] Internet: www.MMF.de
Vibration Monitor
M14

Published by:
Manfred Weber
Metra Mess- and Frequenztechnik in Radebeul e.K.
Meißner Str. 58
D-01445 Radebeul
Tel. 0351-836 2191
Fax 0351-836 2940
Email [email protected]
Internet www.MMF.de
Note: The latest version of this manual can be found at:
http://www.mmf.de/produ c t_literatur e .htm
Specifications subject to change.
© 2018 Manfred Weber Metra Mess- and Frequenztechnik in Radebeul e.K.
Full or partial reproduction subject to prior written approval.
Jun/ 18
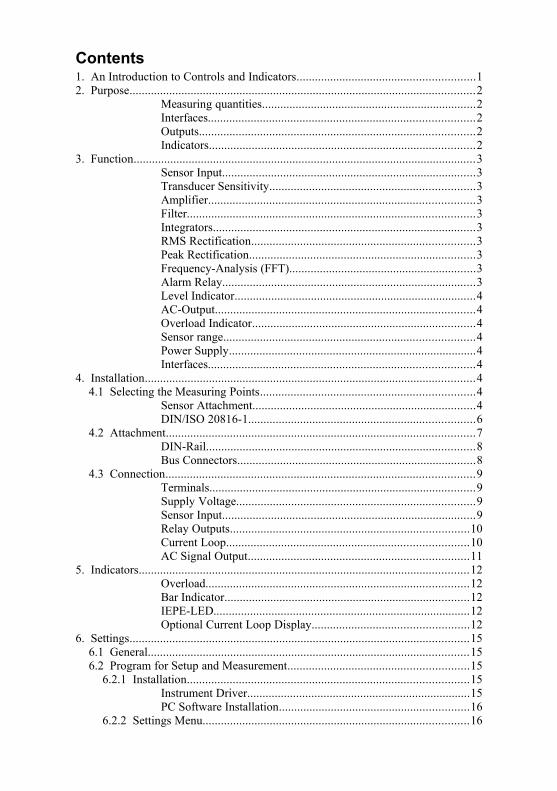
Contents1. An Introduction to Controls and Indicators..........................................................12. Purpose.................................................................................................................2
Measuring quantities......................................................................2 Interfaces.......................................................................................2 Outputs..........................................................................................2 Indicators.......................................................................................2
3. Function................................................................................................................3 Sensor Input...................................................................................3 Transducer Sensitivity...................................................................3 Amplifier.......................................................................................3 Filter..............................................................................................3 Integrators......................................................................................3 RMS Rectification.........................................................................3 Peak Rectification..........................................................................3 Frequency-Analysis (FFT).............................................................3 Alarm Relay...................................................................................3 Level Indicator...............................................................................4 AC-Output.....................................................................................4 Overload Indicator.........................................................................4 Sensor range..................................................................................4 Power Supply.................................................................................4 Interfaces.......................................................................................4
4. Installation............................................................................................................44.1 Selecting the Measuring Points......................................................................4
Sensor Attachment.........................................................................4 DIN/ISO 20816-1..........................................................................6
4.2 Attachment.....................................................................................................7 DIN-Rail........................................................................................8 Bus Connectors..............................................................................8
4.3 Connection.....................................................................................................9 Terminals.......................................................................................9 Supply Voltage..............................................................................9 Sensor Input...................................................................................9 Relay Outputs..............................................................................10 Current Loop...............................................................................10 AC Signal Output........................................................................11
5. Indicators............................................................................................................12 Overload......................................................................................12 Bar Indicator................................................................................12 IEPE-LED....................................................................................12 Optional Current Loop Display...................................................12
6. Settings...............................................................................................................156.1 General.........................................................................................................156.2 Program for Setup and Measurement...........................................................15
6.2.1 Installation............................................................................................15 Instrument Driver.........................................................................15 PC Software Installation..............................................................16
6.2.2 Settings Menu.......................................................................................16
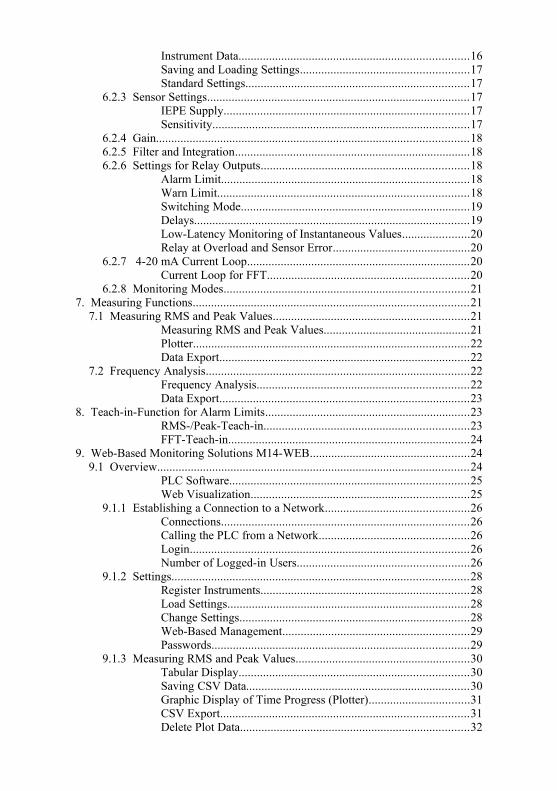
Instrument Data...........................................................................16 Saving and Loading Settings.......................................................17 Standard Settings.........................................................................17
6.2.3 Sensor Settings......................................................................................17 IEPE Supply................................................................................17 Sensitivity....................................................................................17
6.2.4 Gain......................................................................................................186.2.5 Filter and Integration.............................................................................186.2.6 Settings for Relay Outputs....................................................................18
Alarm Limit.................................................................................18 Warn Limit..................................................................................18 Switching Mode...........................................................................19 Delays..........................................................................................19 Low-Latency Monitoring of Instantaneous Values......................20 Relay at Overload and Sensor Error.............................................20
6.2.7 4-20 mA Current Loop.........................................................................20 Current Loop for FFT..................................................................20
6.2.8 Monitoring Modes................................................................................217. Measuring Functions..........................................................................................21
7.1 Measuring RMS and Peak Values................................................................21 Measuring RMS and Peak Values................................................21 Plotter..........................................................................................22 Data Export..................................................................................22
7.2 Frequency Analysis......................................................................................22 Frequency Analysis.....................................................................22 Data Export..................................................................................23
8. Teach-in-Function for Alarm Limits...................................................................23 RMS-/Peak-Teach-in...................................................................23 FFT-Teach-in...............................................................................24
9. Web-Based Monitoring Solutions M14-WEB....................................................249.1 Overview......................................................................................................24
PLC Software..............................................................................25 Web Visualization.......................................................................25
9.1.1 Establishing a Connection to a Network...............................................26 Connections.................................................................................26 Calling the PLC from a Network.................................................26 Login...........................................................................................26 Number of Logged-in Users........................................................26
9.1.2 Settings.................................................................................................28 Register Instruments....................................................................28 Load Settings...............................................................................28 Change Settings...........................................................................28 Web-Based Management.............................................................29 Passwords....................................................................................29
9.1.3 Measuring RMS and Peak Values.........................................................30 Tabular Display...........................................................................30 Saving CSV Data.........................................................................30 Graphic Display of Time Progress (Plotter).................................31 CSV Export.................................................................................31 Delete Plot Data...........................................................................32
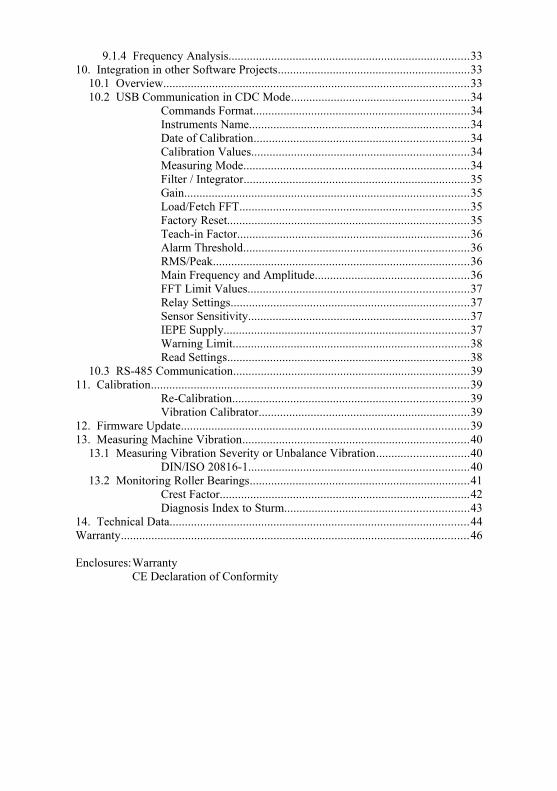
9.1.4 Frequency Analysis...............................................................................3310. Integration in other Software Projects...............................................................33
10.1 Overview....................................................................................................3310.2 USB Communication in CDC Mode..........................................................34
Commands Format.......................................................................34 Instruments Name........................................................................34 Date of Calibration......................................................................34 Calibration Values.......................................................................34 Measuring Mode..........................................................................34 Filter / Integrator..........................................................................35 Gain.............................................................................................35 Load/Fetch FFT...........................................................................35 Factory Reset...............................................................................35 Teach-in Factor............................................................................36 Alarm Threshold..........................................................................36 RMS/Peak....................................................................................36 Main Frequency and Amplitude..................................................36 FFT Limit Values........................................................................37 Relay Settings..............................................................................37 Sensor Sensitivity........................................................................37 IEPE Supply................................................................................37 Warning Limit.............................................................................38 Read Settings...............................................................................38
10.3 RS-485 Communication.............................................................................3911. Calibration........................................................................................................39
Re-Calibration.............................................................................39 Vibration Calibrator.....................................................................39
12. Firmware Update..............................................................................................3913. Measuring Machine Vibration..........................................................................40
13.1 Measuring Vibration Severity or Unbalance Vibration..............................40 DIN/ISO 20816-1........................................................................40
13.2 Monitoring Roller Bearings........................................................................41 Crest Factor..................................................................................42 Diagnosis Index to Sturm............................................................43
14. Technical Data..................................................................................................44Warranty..................................................................................................................46
Enclosures:WarrantyCE Declaration of Conformity

1. An Introduction to Controls and Indicators
1
Figure 1: Front view
Figure 3: Connectors
Figure 2: Back view
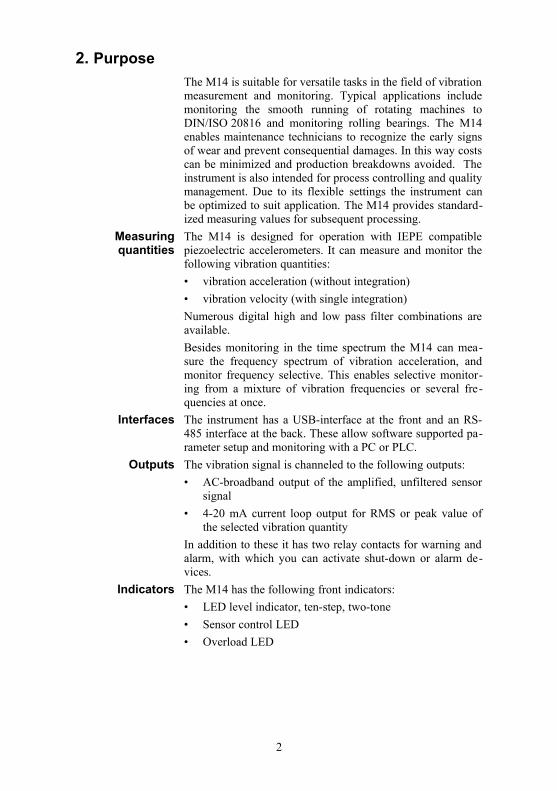
2. Purpose
The M14 is suitable for versatile tasks in the field of vibrationmeasurement and monitoring. Typical applications includemonitoring the smooth running of rotating machines toDIN/ISO 20816 and monitoring rolling bearings. The M14enables maintenance technicians to recognize the early signsof wear and prevent consequential damages. In this way costscan be minimized and production breakdowns avoided. Theinstrument is also intended for process controlling and qualitymanagement. Due to its flexible settings the instrument canbe optimized to suit application. The M14 provides standard-ized measuring values for subsequent processing.
Measuringquantities
The M14 is designed for operation with IEPE compatiblepiezoelectric accelerometers. It can measure and monitor thefollowing vibration quantities:
• vibration acceleration (without integration)
• vibration velocity (with single integration)
Numerous digital high and low pass filter combinations areavailable.
Besides monitoring in the time spectrum the M14 can mea-sure the frequency spectrum of vibration acceleration, andmonitor frequency selective. This enables selective monitor-ing from a mixture of vibration frequencies or several fre-quencies at once.
Interfaces The instrument has a USB-interface at the front and an RS-485 interface at the back. These allow software supported pa-rameter setup and monitoring with a PC or PLC.
Outputs The vibration signal is channeled to the following outputs:
• AC-broadband output of the amplified, unfiltered sensorsignal
• 4-20 mA current loop output for RMS or peak value ofthe selected vibration quantity
In addition to these it has two relay contacts for warning andalarm, with which you can activate shut-down or alarm de-vices.
Indicators The M14 has the following front indicators:
• LED level indicator, ten-step, two-tone
• Sensor control LED
• Overload LED
2
3. Function
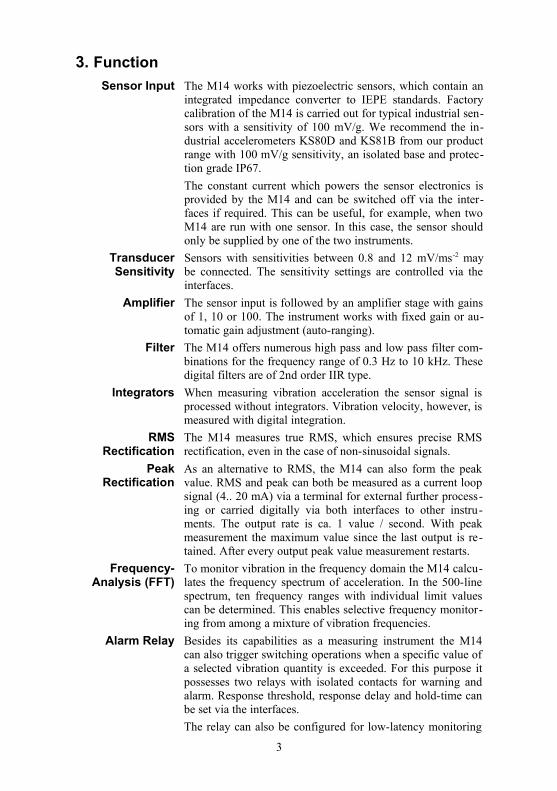
Sensor Input The M14 works with piezoelectric sensors, which contain anintegrated impedance converter to IEPE standards. Factorycalibration of the M14 is carried out for typical industrial sen-sors with a sensitivity of 100 mV/g. We recommend the in-dustrial accelerometers KS80D and KS81B from our productrange with 100 mV/g sensitivity, an isolated base and protec-tion grade IP67.
The constant current which powers the sensor electronics isprovided by the M14 and can be switched off via the inter-faces if required. This can be useful, for example, when twoM14 are run with one sensor. In this case, the sensor shouldonly be supplied by one of the two instruments.
TransducerSensitivity
Sensors with sensitivities between 0.8 and 12 mV/ms-2 maybe connected. The sensitivity settings are controlled via theinterfaces.
Amplifier The sensor input is followed by an amplifier stage with gainsof 1, 10 or 100. The instrument works with fixed gain or au-tomatic gain adjustment (auto-ranging).
Filter The M14 offers numerous high pass and low pass filter com-binations for the frequency range of 0.3 Hz to 10 kHz. Thesedigital filters are of 2nd order IIR type.
Integrators When measuring vibration acceleration the sensor signal isprocessed without integrators. Vibration velocity, however, ismeasured with digital integration.
RMSRectification
The M14 measures true RMS, which ensures precise RMSrectification, even in the case of non-sinusoidal signals.
PeakRectification
As an alternative to RMS, the M14 can also form the peakvalue. RMS and peak can both be measured as a current loopsignal (4.. 20 mA) via a terminal for external further process-ing or carried digitally via both interfaces to other instru-ments. The output rate is ca. 1 value / second. With peakmeasurement the maximum value since the last output is re-tained. After every output peak value measurement restarts.
Frequency-Analysis (FFT)
To monitor vibration in the frequency domain the M14 calcu-lates the frequency spectrum of acceleration. In the 500-linespectrum, ten frequency ranges with individual limit valuescan be determined. This enables selective frequency monitor-ing from among a mixture of vibration frequencies.
Alarm Relay Besides its capabilities as a measuring instrument the M14can also trigger switching operations when a specific value ofa selected vibration quantity is exceeded. For this purpose itpossesses two relays with isolated contacts for warning andalarm. Response threshold, response delay and hold-time canbe set via the interfaces.
The relay can also be configured for low-latency monitoring
3
of instantaneous values.
Level Indicator The LED bar indicator shows the modulation of the moni-tored vibration quantity between 10 and 100 % of the speci-fied alarm threshold. The indicator remains green until itreaches the warning threshold, upon which it turns red.
AC-Output At the connection terminals there is the analogue sensor sig-nal which is amplified, but unfiltered. It can be used forfunction checks or for connecting data loggers and analyzers.
OverloadIndicator
At the front there is an OVL LED, which signals overload af-ter the input stage and at the outputs of amplifier and integra-tor. When it starts to light up, the signal has reached the mea-suring range limit.
Sensor range The LED “IEPE” indicates the condition of the sensor. If islights up yellow, the sensor is fine. Red means either that thesensor circuit has been interrupted or that the input has beenshort-circuited. These states are detected from the sensor biasvoltage at the input. The valid range is between 1 and 20 V.
Power Supply To operate the M14 requires a DC voltage between 8 and30 V. The current consumption is below 100 mA. The higherthe supply voltage, the lower the current. The supply voltagecan be fed through the terminals or the bus connector at theback of the instrument (see figure 3 on page 1).
Interfaces The M14 possesses two digital interfaces for parameter set-ting and measuring. A mini USB Socket is located at thefront. The instrument communicates in virtual COM portmode via ASCII commands. Parameter and measuring soft-ware for Windows PC’s is available (see section 6.2).
Furthermore there is a 485-interface at the back, which like-wise functions with ASCII-commands. Up to 32 instrumentscan be operated on one interface. The addressing is via the se-rial numbers. One advantage of the RS-485 standards is thatyou can use simple two-wire cables with a length of severalhundred meters. Apart from this the interface is widespread incontrol engineering.
4. Installation
4.1 Selecting the Measuring Points
SensorAttachment
Before putting the instrument into operation, suitable measur-ing points on the machine must be found. For this it is advis-able to call upon personnel with experience in machine moni-toring.
The forces arising from vibration are normally transferredacross bearings and bearing housings to the machine housing.That is why bearing housings or their immediate surround-ings are preferable measuring points. Light or mechanicallyflexible machine parts are unsuitable as measuring points.
4
Uneven surface
Rough surface
Flexible part
F
Sensor coupling with besttransmission properties:
Stud boltsmoothsurface
Stainless steel disk
Epoxy gluedor welded
A thin layer of grease improveshigh frequency transmission.
Figure 4: Recommendations for sensor coupling
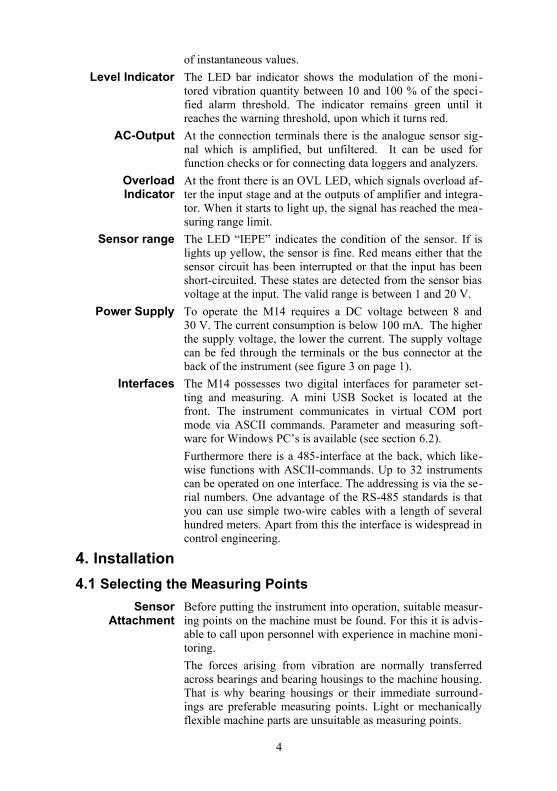
A flat connection between the sensor and the measuring ob-ject is indispensable for an accurate vibration transfer. Un-even, scratched or too small coupling surfaces cause measur-ing errors, especially in the frequency range above 1 kHz.
For optimal transfer conditions we recommend sticking orwelding a small steel measuring disk with an even couplingsurface (e.g. model 229 from Metra). The diameter should beat least the size of the accelerometer base.
The sensor is usually attached with stud screws. A thin greasyfilm (e.g. silicone grease) improves the quality of the connec-tion.
For temporary measurements of vibration severity, clampingmagnets are a suitable means of coupling the sensor.
5
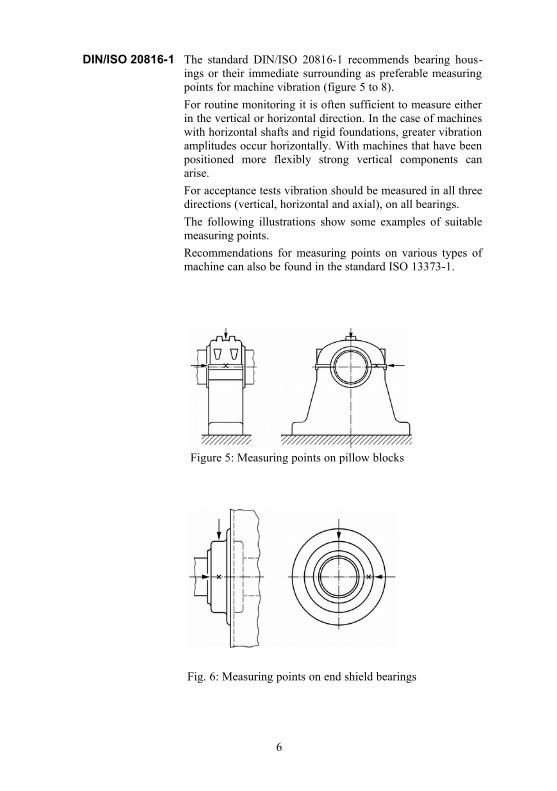
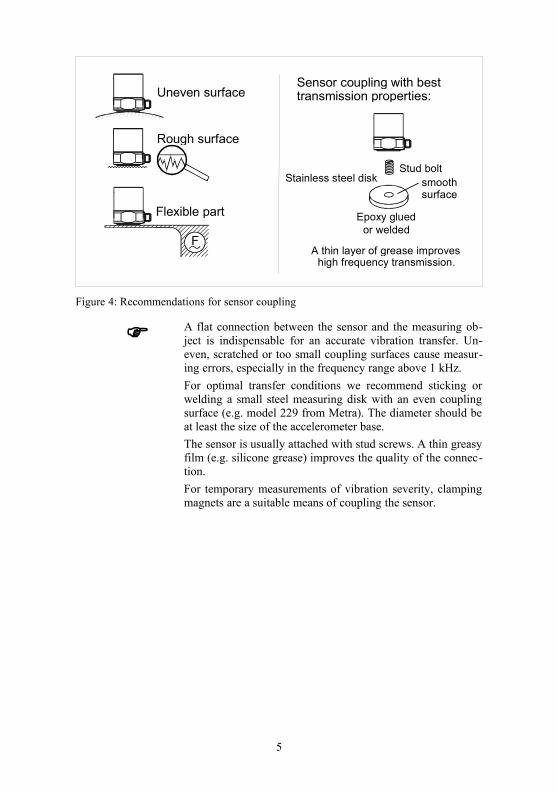
DIN/ISO 20816-1 The standard DIN/ISO 20816-1 recommends bearing hous-ings or their immediate surrounding as preferable measuringpoints for machine vibration (figure 5 to 8).
For routine monitoring it is often sufficient to measure eitherin the vertical or horizontal direction. In the case of machineswith horizontal shafts and rigid foundations, greater vibrationamplitudes occur horizontally. With machines that have beenpositioned more flexibly strong vertical components canarise.
For acceptance tests vibration should be measured in all threedirections (vertical, horizontal and axial), on all bearings.
The following illustrations show some examples of suitablemeasuring points.
Recommendations for measuring points on various types ofmachine can also be found in the standard ISO 13373-1.
6
Fig. 6: Measuring points on end shield bearings
Figure 5: Measuring points on pillow blocks

4.2 Attachment
The M14 is designed for attaching to a 35 mm DIN rail,which needs to be mounted horizontally. The instrumentshould be installed in a dust-free moisture-proof environment,preferably in a switch cabinet.
Due to its small width of 12.5 mm the M14 doesn’t requiremuch space in the switch cabinet.
Do not position any sources of electromagnetic fields in theimmediate vicinity of the instruments, such as clocked powersupplies or frequency converters. Otherwise interference withthe measuring signal may occur.
7
Figure 8: Measuring points on reciprocating machines
Figure 7: Measuring points on electric motors

DIN-Rail
Bus Connectors
With the bottom notch at the back of the instrument the mod-ule slides on to the DIN-rail and is locked in place (see figure9). The image shows a DIN-rail with bus connectors for RS-485 and supply voltage. The bus connectors M14-BUS (Fig-ure 11) are slotted into each other sideways and clipped on tothe DIN-rail. When locked in place all the supply voltageconnections and RS-485-interfaces of all the modules areconnected with each other, which significantly simplifies thewiring. The terminal configuration of the bus connectors isshown in figure 2 on page 1.
Figure 11: Bus connector M14-BUS
8
Figure 9: DIN rail attachment with bus connector
Figure 12: Bus termination M14-BUS2
Figure 10: Connection terminal M14-BUS1
One bus connector M14-BUS is included with the instrumentand as with the connection terminal M14-BUS1, can be usedfor transfer to cables (Figure 10). It can also be ordered sepa-rately. A bus termination M14-BUS2 is needed on the rightend of the row. It includes a 120 Ω termination resistor.
The M14 is dissembled by pulling out the metal sliding lockat the top with a screw driver.
4.3 Connection
Terminals All connections are executed as cage clamp terminals. Thewire range is 0.2 to 2.5 mm² or AWG 24-14 for single wiredand flexible cables.
The configuration of the connection terminals is shown infigure 3 on page 1.
Supply Voltage The M14 requires DC voltage between 8 and 30 V for opera-tion, which is usually available in switch cabinets. 24 Vpower supply units are well suited for DIN rail installation.The negative terminal of the supply voltage is connected withsignal ground. Power consumption is between 25 and 80 mAdepending on the supply voltage. The M14 is is protectedagainst false polarization and short over-voltage transients.When the instrument is supplied via the DIN rail bus connec-tors (see section 4.2), the supply terminals remain uncon-nected.
Sensor Input The M14 is suitable for connection with all types of ac-celerometers to IEPE standards. The built-in constant currentsource for the sensor electronics delivers approximately4 mA. A compliance voltage of 24 V ensures a full dynamicinput range independent of the sensor bias voltage. The con-stant current source is activated by an interface command (seesection 6.2.3). This can be useful when non-IEPE signalsources are connected or when two M14 are being operatedwith one sensor, whereby the power supply should only beprovided by one instrument.
The IEPE sensor circuit is monitored. The LED “IEPE” lightsup red when the circuit is interrupted or shorted and is yellowunder normal operation. A sensor error signals the alarm sta-tus at the relay output and offsets the current loop in to theoverflow (24 mA).
IEPE compatible piezoelectric accelerometers with sensitivi-ties between 0.8 and 12 mV/ms-2, that is 8 to 120 mV/g, canbe connected to the M14. The sensitivity is entered via the in-terface (see section 6.2.3).
The M14 input is protected against surge impulses.
The vibration sensor is connected up with a coaxial cable or amulti-core shielded cable. Cable lengths of 100 m or more arepermissible. Limits are determined by electromagnetic inter-
9
ference and cable capacitance.
Important: please ensure that the sensor ground and sensorsignal are never mixed up when connecting! This leads to im-mediate irreparable damage for many sensors. Please get incontact with the manufacturer if you require assistance whenassigning the cables.
Ground loops can cause noisy signals. In order to prevent thisyou should preferable use accelerometers with insulatedhousing or ensure isolated mounting on the machine.
Relay Outputs The M14 has two relay outputs, which are usually used forpre-alarms (warning) or the main alarm. The M14 uses solid-state PhotoMOS relays with a switching capacity of 60 V ACand 0.5 A. The switch contacts are galvanically isolated fromthe rest of the circuitry. They can be parameterized asnormally open or closed contacts (see section 6.2.6).
Current Loop The vibration acceleration or velocity being monitored can beselected as RMS or peak value for the current loop. Theadvantage of 4-20 mA loop signals lies in its robustnesswhich allows the use of inexpensive shielded two-wire cablesacross distances of up to several kilometers.
The minimum current of 4 mA corresponds to the zero pointof the vibration quantity. The maximum current of 20 mA isthe alarm limit value, which corresponds to 100 % on theLED-bar indicator (see section 6.2.6). A vibration level be-longing to a specific loop current (S) is calculated as follows:
S=A⋅( I loop−4mA)
16mA
A is the selected measuring range.
The loop output is isolated from the rest of the instrument.
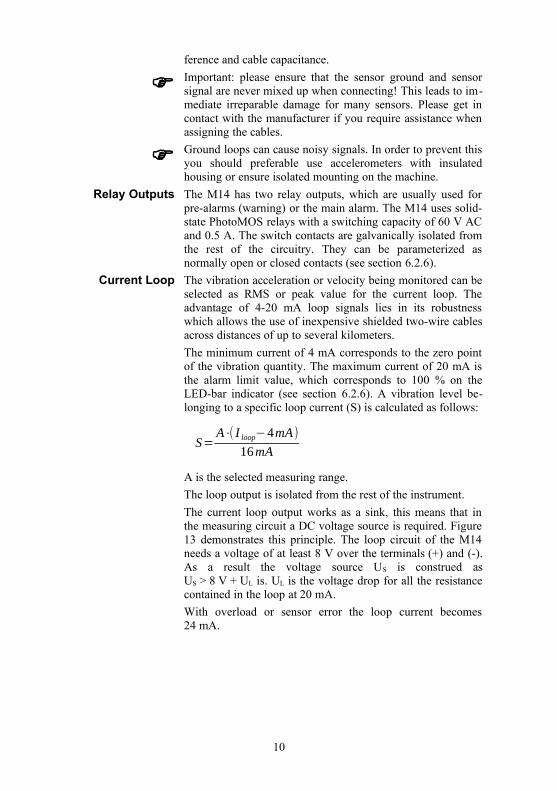
The current loop output works as a sink, this means that inthe measuring circuit a DC voltage source is required. Figure13 demonstrates this principle. The loop circuit of the M14needs a voltage of at least 8 V over the terminals (+) and (-).As a result the voltage source US is construed asUS > 8 V + UL is. UL is the voltage drop for all the resistancecontained in the loop at 20 mA.
With overload or sensor error the loop current becomes24 mA.
10
The voltage at the terminals +I and -I must not exceed 30 V.
AC SignalOutput
The signal output provides the amplified, unfiltered sensorsignal. It can be used for connecting data loggers andanalyzers or for function tests. The maximum outputamplitude is ±2 V. The frequency bandwidth is over 100 kHz.
11
Figure 13: 4-20 mA Loop

5. Indicators
Overload If overload LED “OVL” lights up, the gain should be low-ered. In auto-ranging this happens automatically.
If the overload indicator flashes this does not necessarilymean, that the RMS or peak value is too high. It may occurthat the signal from the sensor contains dominant parts out-side of the filter pass band, which overload the analog or dig-ital signal path. The overload indicator of the M14 monitorsthe amplifier output as well as the amplitudes before and afterfiltering or integration.
When communicating via the RS-485 interface the “OVL”flashes briefly to indicate which module has just been ad-dressed. This does not mean an overload.
Bar Indicator The 10-level LED bar shows the height of the RMS or peakvalue (according to the monitoring quantity) referred to thealarm limit in steps of 10 %. When all LED’s light up thiscorresponds to 100 % of the alarm limit.
In FFT monitoring mode the LED bar shows the amplitude ofthe largest spectral line in percent referred to the alarm limitof the belonging frequency interval.
Above the warning limit the LED’s light up red instead ofgreen.
IEPE-LED The LED “IEPE” lights up red at interruption or short circuitof the sensor cable and yellow under normal operation.
Optional CurrentLoop Display
The vibration level display M12DIS is available as an op-tional accessory for M14. It enables the numerical display ofthe measured vibration quantity. Depending on the M14 set-ting this can be RMS or peak value of vibration accelerationor velocity. M12DIS is a 3 ½ digit LCD digital display mod-ule for connecting to the current loop output of the M14. Thedisplay is powered by the 4-20 mA loop. Backlighting can beactivated by a separate supply voltage.
The connection is made as explained in section 4.3 at thecurrent loop output of M14. The display module uses thescrew terminals I+ and I-. It causes a maximum voltage dropof 6 V in the loop. Additional measuring instruments can alsobe powered from the current loop, as long as the loop supplyvoltage is high enough to guarantee the minimal voltage dropof 8 V. The 24 V-supply voltage of the M14 can also be usedto power the loop.
12
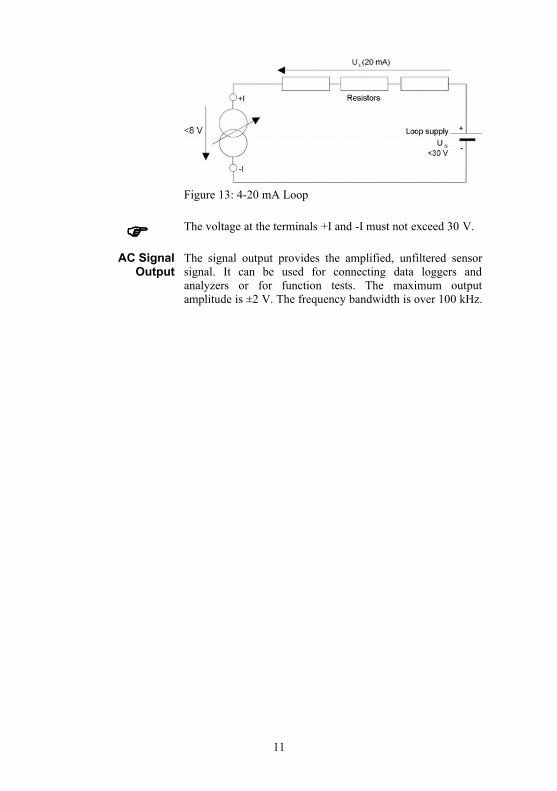
Figure 14: Current loop instrument M12-DIS
If desired LED background lighting can be switched on. Thisrequires a separate DC voltage UBL, which is applied via a se-ries resistor RBL on the BL+ and BL- terminals. The currentrequirement is 30 mA.
The series resistor is calculated as follows:
RBL=U - 5 VBL
30 mA
If the supply voltage UBL is 5 V 0,25 V, the series resistorRBL can be omitted.
The display module can be attached to front panels, switchboards, switch cabinet doors and other flat objects. For thispurpose a mounting bezel is supplied with the M12DIS. Thefollowing drawings show the dimensions of the opening andhow the display is mounted.
13
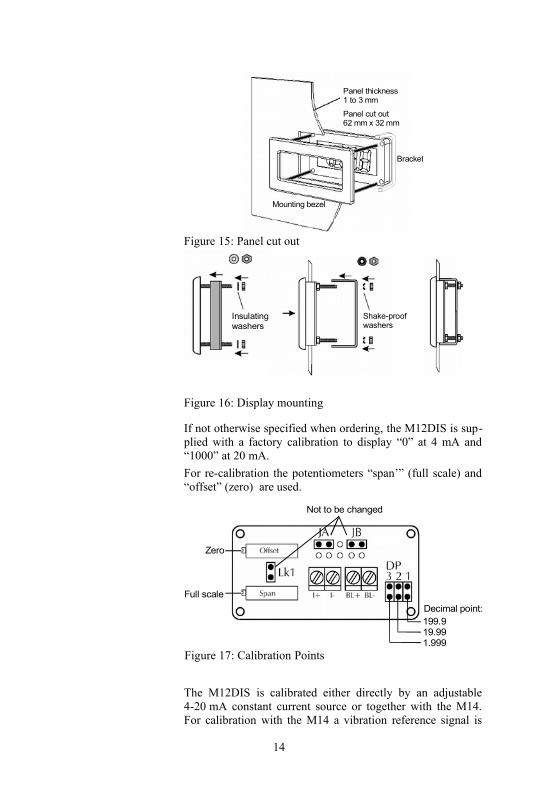
Figure 15: Panel cut out
Figure 16: Display mounting
If not otherwise specified when ordering, the M12DIS is sup-plied with a factory calibration to display “0” at 4 mA and“1000” at 20 mA.
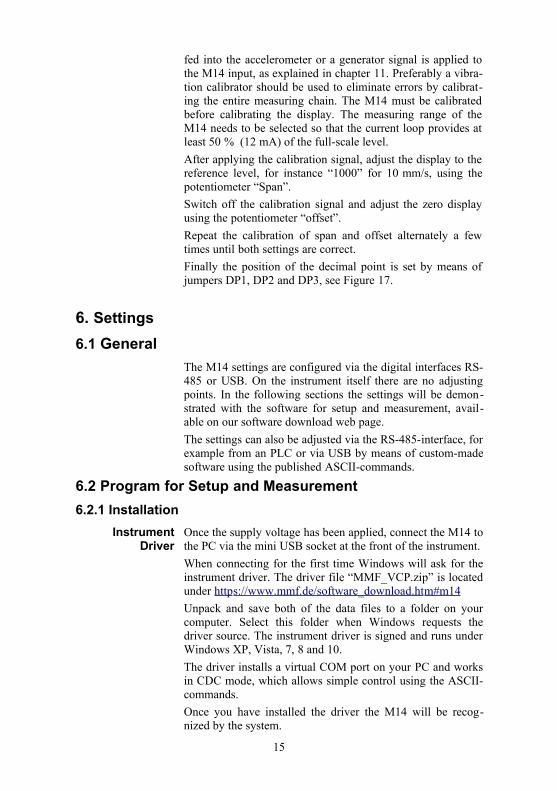
For re-calibration the potentiometers “span’” (full scale) and“offset” (zero) are used.
The M12DIS is calibrated either directly by an adjustable4-20 mA constant current source or together with the M14.For calibration with the M14 a vibration reference signal is
14
Figure 17: Calibration Points
Insulatingwashers
Shake-proofwashers
Panel thickness1 to 3 mm
Panel cut out62 mm x 32 mm
Mounting bezel
Bracket
Full scale
Zero
Decimal point:199.919.991.999
Not to be changed
fed into the accelerometer or a generator signal is applied tothe M14 input, as explained in chapter 11. Preferably a vibra-tion calibrator should be used to eliminate errors by calibrat-ing the entire measuring chain. The M14 must be calibratedbefore calibrating the display. The measuring range of theM14 needs to be selected so that the current loop provides atleast 50 % (12 mA) of the full-scale level.
After applying the calibration signal, adjust the display to thereference level, for instance “1000” for 10 mm/s, using thepotentiometer “Span”.
Switch off the calibration signal and adjust the zero displayusing the potentiometer “offset”.
Repeat the calibration of span and offset alternately a fewtimes until both settings are correct.
Finally the position of the decimal point is set by means ofjumpers DP1, DP2 and DP3, see Figure 17.
6. Settings
6.1 General
The M14 settings are configured via the digital interfaces RS-485 or USB. On the instrument itself there are no adjustingpoints. In the following sections the settings will be demon-strated with the software for setup and measurement, avail-able on our software download web page.
The settings can also be adjusted via the RS-485-interface, forexample from an PLC or via USB by means of custom-madesoftware using the published ASCII-commands.
6.2 Program for Setup and Measurement
6.2.1 Installation
InstrumentDriver
Once the supply voltage has been applied, connect the M14 tothe PC via the mini USB socket at the front of the instrument.
When connecting for the first time Windows will ask for theinstrument driver. The driver file “MMF_VCP.zip” is locatedunder http s ://www.mmf.de/software_download.ht m#m14
Unpack and save both of the data files to a folder on yourcomputer. Select this folder when Windows requests thedriver source. The instrument driver is signed and runs underWindows XP, Vista, 7, 8 and 10.
The driver installs a virtual COM port on your PC and worksin CDC mode, which allows simple control using the ASCII-commands.
Once you have installed the driver the M14 will be recog-nized by the system.
15
PC SoftwareInstallation
On our software download web-page:https://mmf.de/software-download.htm#m14
you can download our free program for parameter setup andmeasurement. The program is based on LabView 2014. Uponrequest we will grant you access to the project data as a basisfor your own LabView projects.
Unzip the file m14_pc.zip into a folder on your PC and startsetup.exe. You can change the installation directory later ifdesired. The LabView application contains several compo-nents of the LabView run-time environment from National In-struments. You will find the installed program in the startmenu of your computer under Metra Radebeul.
6.2.2 Settings Menu
The program is divided into three subsections each with itsown tab:
• Settings (setup), opens after startup
• Measurement in time domain (RMS/Peak)
• Measurement in frequency domain (FFT)
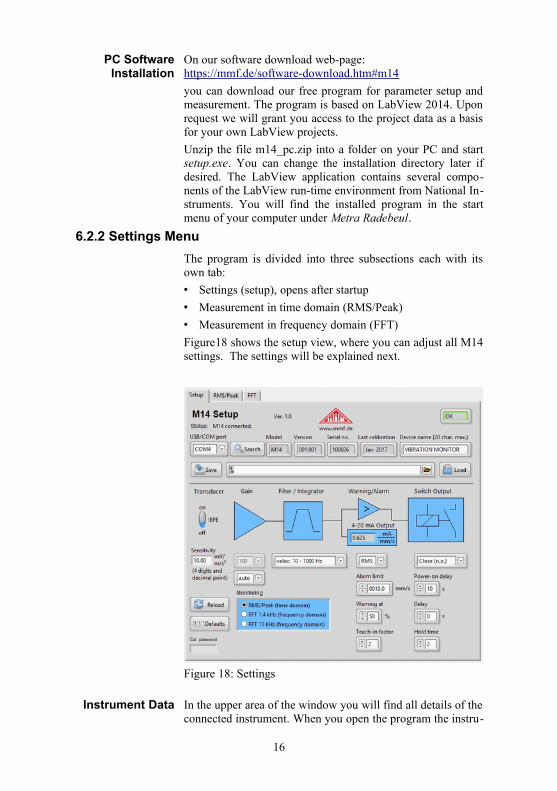
Figure18 shows the setup view, where you can adjust all M14settings. The settings will be explained next.
Instrument Data In the upper area of the window you will find all details of theconnected instrument. When you open the program the instru-
16
Figure 18: Settings
ment will be located and the interface is displayed. Next tothis you will see the version, serial number, last date of cali-bration and the instrument name. You can change the instru-ments name by overwriting it.
A steady connection to M14 is indicated by the green framed“OK”.
If the instrument fails to be recognized (“ERROR”), click“search” to restart the search. In this case it may be necessaryto briefly unplug the USB cable.
Saving andLoadingSettings
The buttons “Save” and “Load” are for saving and loading thesettings on your PC. The location and data name can be en-tered in the data dialogue box. The settings are saved in XMLformat and are automatically transferred to M14 when youload them.
StandardSettings
Click “Defaults” to revert to factory settings.
All entries are sent to M14 immediately after the mousepointer leaves the entry.
To check if the operation has been successful, click on“Reload”, which uploads all the settings from M14 to the PCprogram.
6.2.3 Sensor Settings
IEPE Supply
Sensitivity
The M14 is designed for connection with an IEPE compatibleaccelerometer. In Figure 1 on page 3 you will find the con-nection terminals for the sensor.
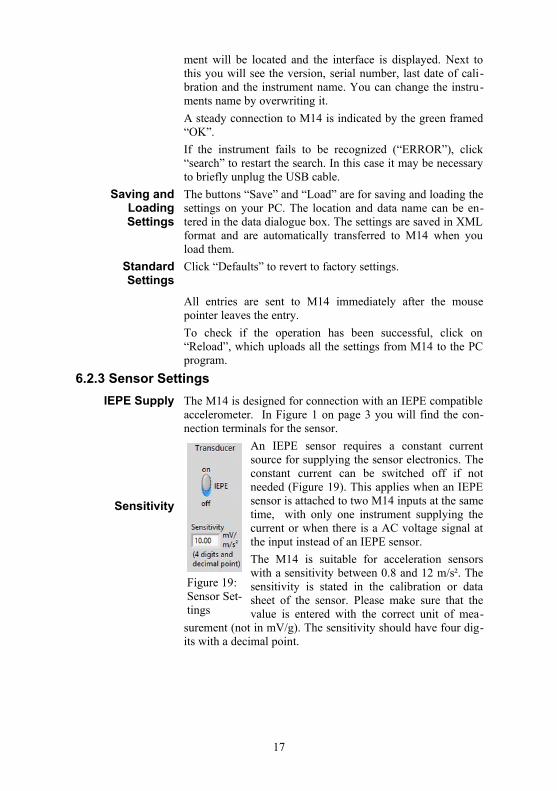
An IEPE sensor requires a constant currentsource for supplying the sensor electronics. Theconstant current can be switched off if notneeded (Figure 19). This applies when an IEPEsensor is attached to two M14 inputs at the sametime, with only one instrument supplying thecurrent or when there is a AC voltage signal atthe input instead of an IEPE sensor.
The M14 is suitable for acceleration sensorswith a sensitivity between 0.8 and 12 m/s². Thesensitivity is stated in the calibration or datasheet of the sensor. Please make sure that thevalue is entered with the correct unit of mea-
surement (not in mV/g). The sensitivity should have four dig-its with a decimal point.
17
Figure 19: Sensor Set-tings

6.2.4 Gain
Before analog-to-digital conversion the sensorsignal passes an analogue amplifier. The gainfactor is switchable between 1, 10 and 100. Al-ternatively the instrument can adjust the gain au-tomatically (“auto”) to the signal level, which isappropriate in most cases.
6.2.5 Filter and Integration
The M14 possesses a numberof high and low pass filters.
The filters are 2nd order IIRdigital filters. The specifiedfrequencies are -3dB values.
An integrator can be acti-vated for measuring vibrationvelocity.
6.2.6 Settings for Relay Outputs
Alarm Limit
Warn Limit
The M14 has two relay out-puts for warning (1) andalarms (2). The connectors areshown in Figure 3 on page 1.
The function of the relay out-puts differs depending onwhether you are monitoring intime or frequency domain.Next we will explain the set-tings in time domain(RMS/peak).
Below “Alarm limit” enter the limit value, at which the alarmrelay should switch. The entry should have four digits beforethe decimal point and one after it in m/s², that is mm/s (for in-tegration).
Below “Warning at” select a percentage value between 10 and90 %, referring to the alarm limit at which the warning relayshould react.
18
Figure 20: Gain
Figure 21: Filters/Integrators
Figure 22: Relay settings

Switching Mode
Delays
By selecting RMS/peak you can determine whether the alarmlimit is interpreted as RMS or peak value.
You can choose whether the relay opens (“n.o.”, normallyopen) or closes (“n.c.”, normally closed) when the alarm issignaled. Selecting “n.c.” enables a self-monitoring functionof the M14 supply voltage, as well as the relay cabling, Thishappens because in both cases the relay circuit opens wheninterrupted, thereby signaling an alarm.
The time response of the relay outputs is determined by threeparameters. Under “Power-on delay”, enter the time from 0and 99 seconds after which the relay outputs become acti-vated, once the supply voltage has been connected.
Below “Delay”, enter the time td from 0 to 99 seconds, for theduration of which, the alarm condition must persist before therelay switches. If the signal already falls below the alarm limitbefore the delay is over, triggering will not occur. “old time”determines the minimum hold time th of an alarm’s switchingstatus from 0 to 9 seconds. Figure 23 displays the effect ofboth delay times in a graph.
t
Alarmthreshold
Alarm on
Alarm off
t d ttd
1 2
3
4
7
6
5
t hon
Figure 23: Alarm triggering
The upper section of the diagram displays the progress of asignal which can represent RMS or peak values, the lowersection shows the switching state of the alarm relay.
At time point the alarm threshold has been exceeded. Nowthe alarm delay time td begins. Due to the fact that at point the signal level already falls below the alarm threshold, beforethe delay time elapsed, the alarm will not be triggered afterthe set delay time td point . This guarantees that the occur-rence of short limit value exceedance, such as, when startingup the machine, in the case of electrical switching interferenceor shock impact on the measuring point, does not trigger thealarm, if the appropriate delay time has been selected. Atpoint the alarm threshold has once again been exceeded
19
and the delay time starts anew. This time the alarm has beentriggered because after the time td has elapsed at reaching timepoint the alarm threshold is still being exceeded. The alarmis now active until time point when the alarm level falls be-low the threshold. Now the alarm hold time begins th,. Afterthe hold time elapses at the alarm goes off. The aim of afixed minimum hold time is that safe switching of connectedexternal components, e.g. electric contactors, is guaranteed.
To avoid false alarms after switching on the supply voltage, astart-up delay can be set, during which the relay output is in-active.
Low-LatencyMonitoring of
InstantaneousValues
In some applications a short response time of the relay out-puts is crucial. This may be the case, for example, in emer-gency shut-down installations to avoid damage.
The M14 relay output can be set for response times in therange of some milliseconds after tripping the alarm limit. Inthis mode the instantaneous value of the vibration is moni-tored instead of RMS or peak values. It is activated by choos-ing peak monitoring with “Delay” set to zero. To reach short-est response times it is recommended to use fixed gain insteadof auto-ranging (see page 18).
Relay atOverload andSensor Error
At overload of the signal path (LED “OVL”) and error in thesensor circuit (LED “IEPE”) both relay outputs switch toalarm status. The entered delay and hold times also apply forthis type of alarm.
The parameter “teach-in factor” is explained in chapter 8.
6.2.7 4-20 mA Current Loop
Current Loopfor FFT
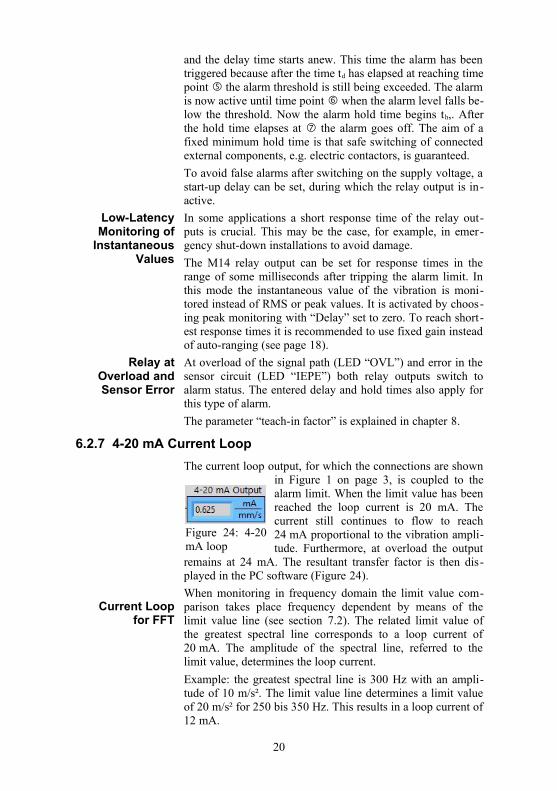
The current loop output, for which the connections are shownin Figure 1 on page 3, is coupled to thealarm limit. When the limit value has beenreached the loop current is 20 mA. Thecurrent still continues to flow to reach24 mA proportional to the vibration ampli-tude. Furthermore, at overload the output
remains at 24 mA. The resultant transfer factor is then dis-played in the PC software (Figure 24).
When monitoring in frequency domain the limit value com-parison takes place frequency dependent by means of thelimit value line (see section 7.2). The related limit value ofthe greatest spectral line corresponds to a loop current of20 mA. The amplitude of the spectral line, referred to thelimit value, determines the loop current.
Example: the greatest spectral line is 300 Hz with an ampli-tude of 10 m/s². The limit value line determines a limit valueof 20 m/s² for 250 bis 350 Hz. This results in a loop current of12 mA.
20
Figure 24: 4-20mA loop

6.2.8 Monitoring Modes
In this menu you can determinewhether the M14 should moni-tor RMS and peak values or op-erate as FFT monitoring device(Figure 25). Alternatively, youcan switch to the tabs“RMS/peak” or “FFT” in the
PC software. The selected mode remains active when theUSB cable is unplugged from the M14 or when it is discon-nected or reconnected to the power supply.
7. Measuring Functions
7.1 Measuring RMS and Peak Values
In addition to monitoring limit values the M14 can providemeasurement values. These can be used, for example, to re-trieve the current vibration level with via PLC with a webbrowser. In the PC software you will find the measurementvalue display under the tab RMS/peak (figure 26).
Measuring RMSand Peak Values
In the upper section of the measuring window you can see thecurrent RMS and peak values. With a high pass frequency of0.3 Hz a measurement value is recorded every 2.8 seconds,and with all other high pass frequencies every 1.4 seconds.
At overload, “OVER” is displayed instead of a measurementvalue.
21
Figure 25: Monitoringmode
Figure 26: Measuring RMS and peak

Plotter The time history of the RMS or peak value is displayed in agraph. You can select the quantity for recording at the topright of the screen. You can also choose whether the ampli-tude axis should automatically adjust to the signal (“Au-toscale”). Further scaling options, including the time axis, areavailable by right clicking on the diagram. Similarly, you canre-scale the axis by editing the number values of the axis la-bel. This can be useful, for example, when skipping to a spe-cific time point.
Press “Stop” to end the recording. “Restart” begins a newrecording, and deletes the contents of the previous diagram.
Data Export To export the diagram data or the graph you can copy it to the
clipboard or transfer the data as a table to an Excel diagram.
7.2 Frequency Analysis
FrequencyAnalysis
Click on the “FFT” tab to start the frequency analysis (27).
The diagram displays a 500 line spectrum.
Two bandwidths are available to choose from:
• 5 to 1400 Hz
• 50 to 11000 Hz
The cursor rests on the largest spectral line. Frequency andamplitude are visible in the top right corner. You can movethe cursor with the mouse by clicking on and dragging theyellow dotted line.
The amplitude axis can be switched between the linear and
22
Figure 27: Frequency analysis
logarithmic view. Below the diagram you will find 10 entryfields each for both frequency and amplitude, with the help ofwhich you can define a step-form limit value line.
The frequency points can be selected as desired within thelimits of the frequency range. The only condition is that thefrequencies should ascend from left to right. The amplitudebelow the frequency applies until the next greater frequency.The tenth amplitude applies until the upper limit frequency.
You can hide and show the limit value line on the diagram,without it having any influence on the M14. This comparesthe spectral lines in FFT monitoring mode with the limitvalue belonging to each frequency. When the limit values areexceeded the alarm relay switches, or if the percentage warn-ing limit is exceeded the warning relay switches. As withRMS/peak the delay times programmed under “Setup” apply.
When overload occurs, “Overload!” will appear on the dia-gram.
Data Export To export the diagram you can copy the diagram data or thegraph to the clipboard or transfer the data as a table to an Ex-cel diagram.
8. Teach-in-Function for Alarm Limits
With the help of the teach-in function the M14 can determinethe alarm limit automatically on the basis of the currentlypending vibrations.
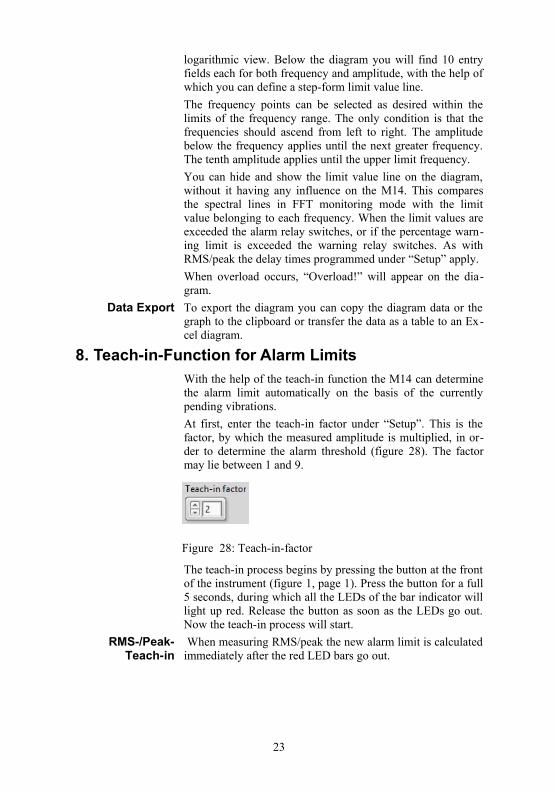
At first, enter the teach-in factor under “Setup”. This is thefactor, by which the measured amplitude is multiplied, in or-der to determine the alarm threshold (figure 28). The factormay lie between 1 and 9.
The teach-in process begins by pressing the button at the frontof the instrument (figure 1, page 1). Press the button for a full5 seconds, during which all the LEDs of the bar indicator willlight up red. Release the button as soon as the LEDs go out.Now the teach-in process will start.
RMS-/Peak-Teach-in
When measuring RMS/peak the new alarm limit is calculatedimmediately after the red LED bars go out.
23
Figure 28: Teach-in-factor

FFT-Teach-in When measuring FFT the teach-in process takes slightlylonger. It is signalized by the bar LEDs lighting red and greenalternately. During the teach-in phase the vibration signal hasto be representative of the monitoring task, and stable. In or-der to avoid distortions the accelerometer should not betouched. The teach-in process is completed after 15 to 30 sec-onds and the instrument reverts to monitoring operation. TheLED bar should then display around 100 % divided by theteach-in factor.
In FFT mode 10 frequency/amplitude pairs form the limitvalue line. The frequency range of 1.4 or 11 kHz is subdi-vided into 10 equally broad frequency bands. In each fre-quency band the limit value is determined by the amplitude ofthe greatest spectral line, multiplied by the teach-in factor. Ifthe greatest spectral line lies on the border of an interval, theneighboring interval will be set at the same limit value.
Teach-in starts with an FFT band width of 11 kHz. If fre-quency of the resulting maximum amplitude is lower than800 Hz, the measurement will be repeated once 1.4 kHz bandwidth.
You can check the result of the teach-in process in the PCsoftware by reloading the settings (“Reload”).
9. Web-Based Monitoring Solutions M14-WEB
9.1 Overview
Due to its entirely digital design and RS-485 bus, the M14can be easily connected via a PLC to field buses or to the in-ternet. This enables it to take vibration measurements, ana-lyze frequency spectra or adjust settings, remotely.
Metra offers a ready-to-use solution for remote monitoringbased on a PLC from WAGO model PFC200. You can con-nect between 1 and 32 M14 channels to one PLC. Due to thefact that the PFC200 has a built in RS-485 interface, it pro-vides a compact and cost-effective solution without requiringperipheral modules (Figure 29). The only cabling required isa connection from the supply voltage and the interface to thebus connector (M14-BUS1), and a connection of the sensors.
24
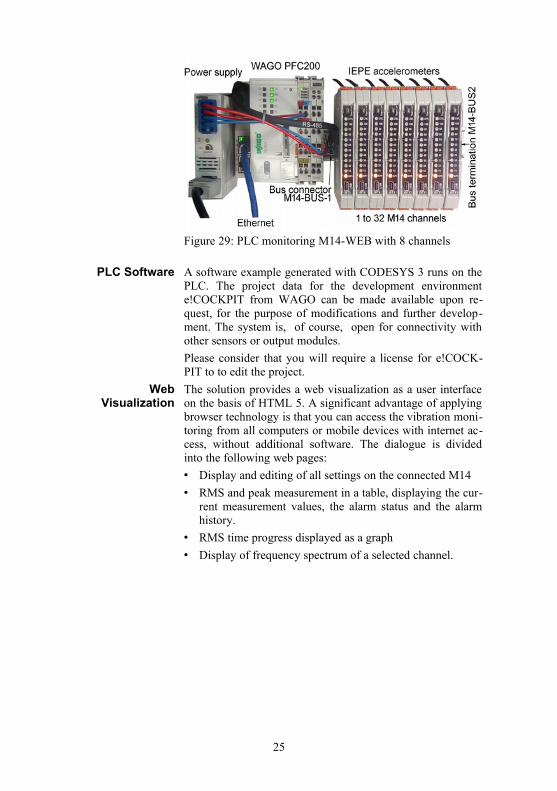
PLC Software A software example generated with CODESYS 3 runs on thePLC. The project data for the development environmente!COCKPIT from WAGO can be made available upon re-quest, for the purpose of modifications and further develop-ment. The system is, of course, open for connectivity withother sensors or output modules.
Please consider that you will require a license for e!COCK-PIT to to edit the project.
WebVisualization
The solution provides a web visualization as a user interfaceon the basis of HTML 5. A significant advantage of applyingbrowser technology is that you can access the vibration moni-toring from all computers or mobile devices with internet ac-cess, without additional software. The dialogue is dividedinto the following web pages:
• Display and editing of all settings on the connected M14
• RMS and peak measurement in a table, displaying the cur-rent measurement values, the alarm status and the alarmhistory.
• RMS time progress displayed as a graph
• Display of frequency spectrum of a selected channel.
25
Figure 29: PLC monitoring M14-WEB with 8 channels

9.1.1 Establishing a Connection to a Network
Connections The M14 modules are mounted on to a DIN rail with bus con-nectors (M14-BUS) and connection terminal M14-BUS1(see section 4.2). The terminal configuration is shown in fig-ure 2 on page 1. A 24 V power supply is connected to “+Us”and “GND”. The cable M14-RS is connected to “RS-485+”and “RS-485-”. Its other end is plugged into the socket on X3of the PLC. The PLC is likewise connected to the 24 V powersupply via its terminals “0V” and “24V”. The Ethernet con-nector X1 is connected to the network.
For the RS-485 connection a terminator (M14-BUS2) withresistor should be connected to the open end of the bus termi-nal block.
Calling the PLCfrom a Network
The PLC PFC200 is factory set for dynamic IP configuration(DHCP). It is allocated to an IP address by the server. Furtherinformation about the PFC200 can be found underhttps://mmf.de/produ c t_literatur e .htm#m14 .
Enter this IP address in the address field of the browser to-gether with the attached page address /webvisu/m14.htm (payattention to the correct casing), e.g.
https://192.168.181.47/webvisu/m14.htm.
The browser should then display the login page (Figure 30).
Login
Click on “Login”. When logging in for the first time you willneed to enter “m14-web” as both user name and password.The registration dialog box will now open up (Figure 31).
Number ofLogged-in Users
Due to the limited hardware resources of the PLC, the maxi-mum number of users (clients) logged in at once is restrictedto three. Additional users receive an error message until oneof the three current users has logged off (Figure 32).
26
Figure 30: M14-WEB – Web visualization login

The default user data should always be replaced by your owndata. Click on “Users” to go to user management (Figure 33).Here you can delete or create new users. Next use the mouseto select an empty line in the user list. Enter a new user namein the field “User name”. Optionally you can enter your com-plete name under “Full name”. Then enter your passwordtwice and select the user group “Operators”. By clicking onthe symbol in the top left (“Add or insert user”) you can addthe new user.
After successfully testing your own user data, open up theuser management once again and delete the standard userm14-web (click on “X” in the top left corner).
The login remains active until you logout or close the web-site.
Note: the user management distinguishes between upper andlower casing.
By clicking on “Open monitoring screen” you will access themeasured value display. Before measuring results can beviewed, a few more settings are necessary.
27
Figure 33: User management
Figure 31: Login dialogFigure 32: User error

9.1.2 Settings
RegisterInstruments
To enable the PLC to communicate with the M14 modules,the serial numbers of the instruments need to be entered in thePC software. This can be done on the web page “channelList”, which you can reach by clicking on “Setup” (Figure34).
The table contains the registered M14 instruments and theirsettings. The table is empty at first. Under “Ser. No.” you canenter thee 6-digit serial numbers from the model labels of theconnected instruments. The order of the units is not relevant.
Load Settings By clicking on “Load all” you can load the settings of the in-struments into the table. Here you will find all settings in -cluding the instruments name, sensor sensitivity, filter, gain,and alarm limit values.
Change Settings To change the settings of an M14 click on “Settings” behindits serial number. A page will open up, on which you can editthe settings. The parameters are explained in more detail insection 6.2.
28
Figure 34: M14-WEB – Channel list
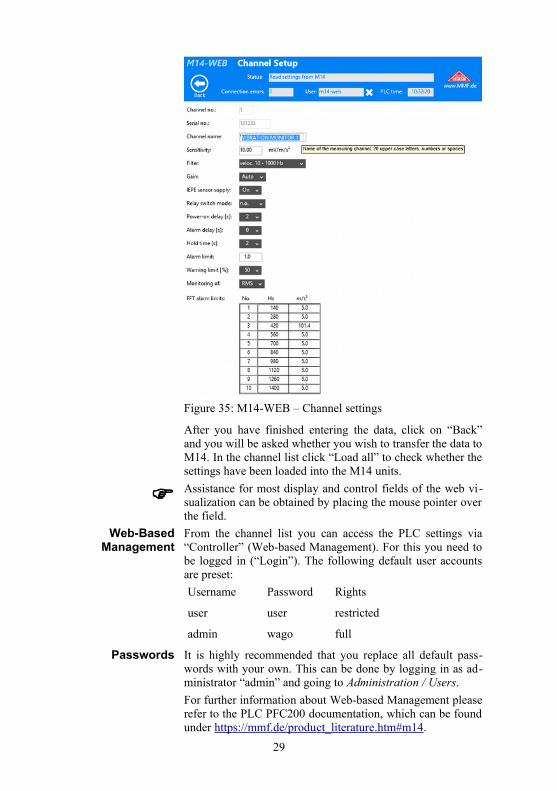
After you have finished entering the data, click on “Back”and you will be asked whether you wish to transfer the data toM14. In the channel list click “Load all” to check whether thesettings have been loaded into the M14 units.
Assistance for most display and control fields of the web vi-sualization can be obtained by placing the mouse pointer overthe field.
Web-BasedManagement
From the channel list you can access the PLC settings via“Controller” (Web-based Management). For this you need tobe logged in (“Login”). The following default user accountsare preset:
Username Password Rights
user user restricted
admin wago full
Passwords It is highly recommended that you replace all default pass-words with your own. This can be done by logging in as ad-ministrator “admin” and going to Administration / Users.
For further information about Web-based Management pleaserefer to the PLC PFC200 documentation, which can be foundunder https://mmf.de/produ c t_literatur e .htm#m14 .
29
Figure 35: M14-WEB – Channel settings
9.1.3 Measuring RMS and Peak Values
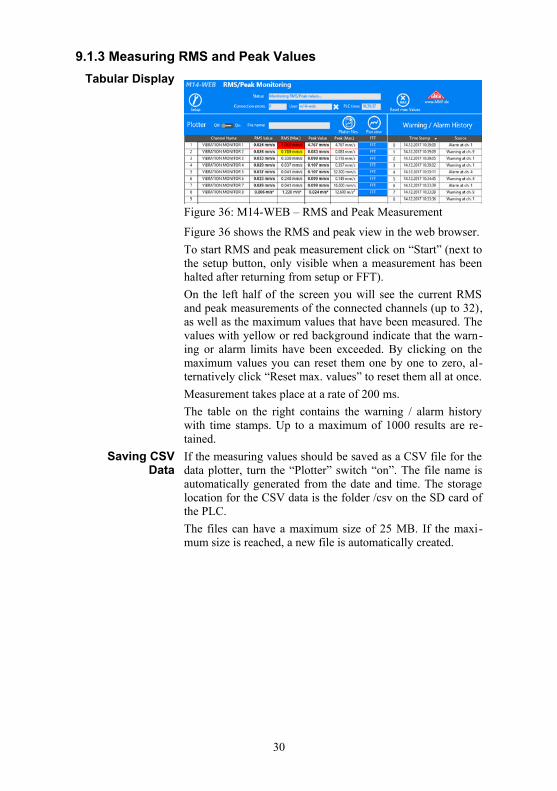
Tabular Display
Figure 36 shows the RMS and peak view in the web browser.
To start RMS and peak measurement click on “Start” (next tothe setup button, only visible when a measurement has beenhalted after returning from setup or FFT).
On the left half of the screen you will see the current RMSand peak measurements of the connected channels (up to 32),as well as the maximum values that have been measured. Thevalues with yellow or red background indicate that the warn-ing or alarm limits have been exceeded. By clicking on themaximum values you can reset them one by one to zero, al-ternatively click “Reset max. values” to reset them all at once.
Measurement takes place at a rate of 200 ms.
The table on the right contains the warning / alarm historywith time stamps. Up to a maximum of 1000 results are re-tained.
Saving CSVData
If the measuring values should be saved as a CSV file for thedata plotter, turn the “Plotter” switch “on”. The file name isautomatically generated from the date and time. The storagelocation for the CSV data is the folder /csv on the SD card ofthe PLC.
The files can have a maximum size of 25 MB. If the maxi-mum size is reached, a new file is automatically created.
30
Figure 36: M14-WEB – RMS and Peak Measurement
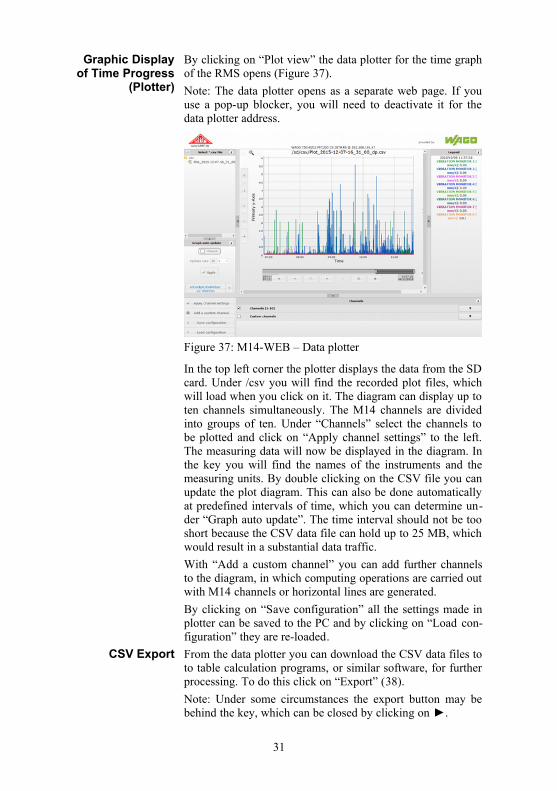
Graphic Displayof Time Progress
(Plotter)
By clicking on “Plot view” the data plotter for the time graphof the RMS opens (Figure 37).
Note: The data plotter opens as a separate web page. If youuse a pop-up blocker, you will need to deactivate it for thedata plotter address.
In the top left corner the plotter displays the data from the SDcard. Under /csv you will find the recorded plot files, whichwill load when you click on it. The diagram can display up toten channels simultaneously. The M14 channels are dividedinto groups of ten. Under “Channels” select the channels tobe plotted and click on “Apply channel settings” to the left.The measuring data will now be displayed in the diagram. Inthe key you will find the names of the instruments and themeasuring units. By double clicking on the CSV file you canupdate the plot diagram. This can also be done automaticallyat predefined intervals of time, which you can determine un-der “Graph auto update”. The time interval should not be tooshort because the CSV data file can hold up to 25 MB, whichwould result in a substantial data traffic.
With “Add a custom channel” you can add further channelsto the diagram, in which computing operations are carried outwith M14 channels or horizontal lines are generated.
By clicking on “Save configuration” all the settings made inplotter can be saved to the PC and by clicking on “Load con-figuration” they are re-loaded.
CSV Export From the data plotter you can download the CSV data files toto table calculation programs, or similar software, for furtherprocessing. To do this click on “Export” (38).
Note: Under some circumstances the export button may bebehind the key, which can be closed by clicking on ►.
31
Figure 37: M14-WEB – Data plotter
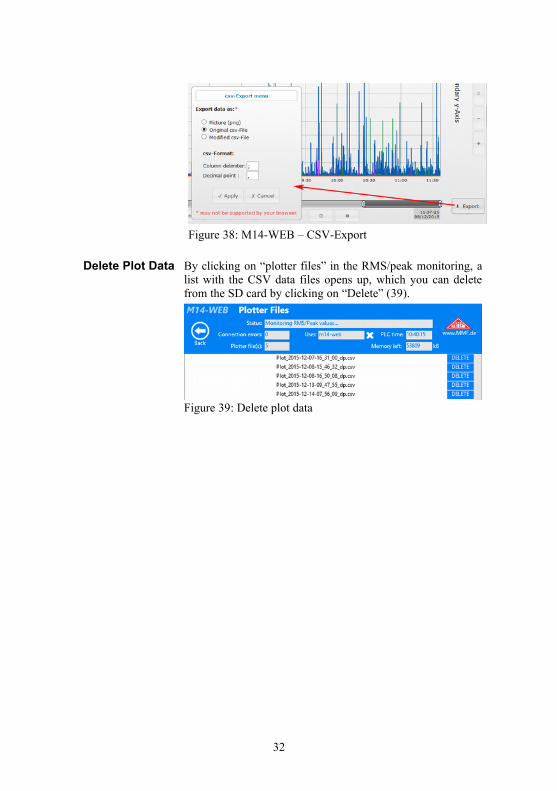
Delete Plot Data By clicking on “plotter files” in the RMS/peak monitoring, alist with the CSV data files opens up, which you can deletefrom the SD card by clicking on “Delete” (39).
32
Figure 38: M14-WEB – CSV-Export
Figure 39: Delete plot data
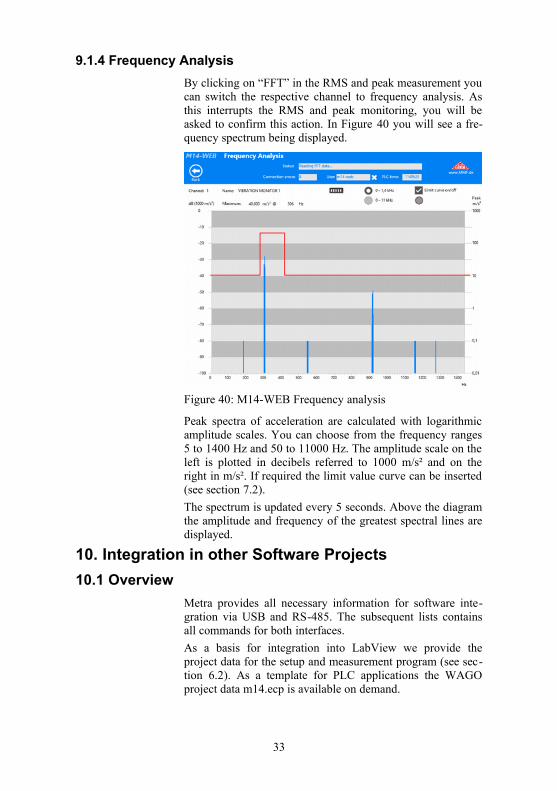
9.1.4 Frequency Analysis
By clicking on “FFT” in the RMS and peak measurement youcan switch the respective channel to frequency analysis. Asthis interrupts the RMS and peak monitoring, you will beasked to confirm this action. In Figure 40 you will see a fre-quency spectrum being displayed.
Peak spectra of acceleration are calculated with logarithmicamplitude scales. You can choose from the frequency ranges5 to 1400 Hz and 50 to 11000 Hz. The amplitude scale on theleft is plotted in decibels referred to 1000 m/s² and on theright in m/s². If required the limit value curve can be inserted(see section 7.2).
The spectrum is updated every 5 seconds. Above the diagramthe amplitude and frequency of the greatest spectral lines aredisplayed.
10. Integration in other Software Projects
10.1 Overview
Metra provides all necessary information for software inte-gration via USB and RS-485. The subsequent lists containsall commands for both interfaces.
As a basis for integration into LabView we provide theproject data for the setup and measurement program (see sec-tion 6.2). As a template for PLC applications the WAGOproject data m14.ecp is available on demand.
33
Figure 40: M14-WEB Frequency analysis

10.2 USB Communication in CDC Mode
CommandsFormat
The commands and the answers are ASCII strings. Line breaksymbol is <CR>.
The return always ends with /a + <LF> or at errors with /n +<LF>.
InstrumentsName
#Bnnnnnnnnnnnnnnnnnnnn: write instrument name n: Name, 20 characters (capital letters, numbers ,spaces)acknowledgment of command: /aerror message, if no parameter text: /n
Date ofCalibration
#Cmmyy: write calibration datem: month (01-12), 2 digitsy: year (last 2 digits)acknowledgment of command: /a error message, no parameter digits or outside entry range: /n
CalibrationValues
#Dnccccc: write calibration valuesn: calibration value index; A = amplitude calibration value; B = 4-20 mA loop – zero point; C = 4-20 mA loop end valuec: calibration value, 06000 to 14000 (5 digits)acknowledgment of command: /a error message if no parameter or out of range: /n
Measuring Mode #Em: set measuring mode m: 0 = RMS and peak measurement, fetch with #M 1 = FFT with 1.4 kHz band width, fetch with #H or main frequency and amplitude, fetch with #N 2 = FFT with 11 kHz band width, fetch with #H or main frequency and amplitude with #Nacknowledgment of command: /a error message, if parameter is no number or too high: /n
34
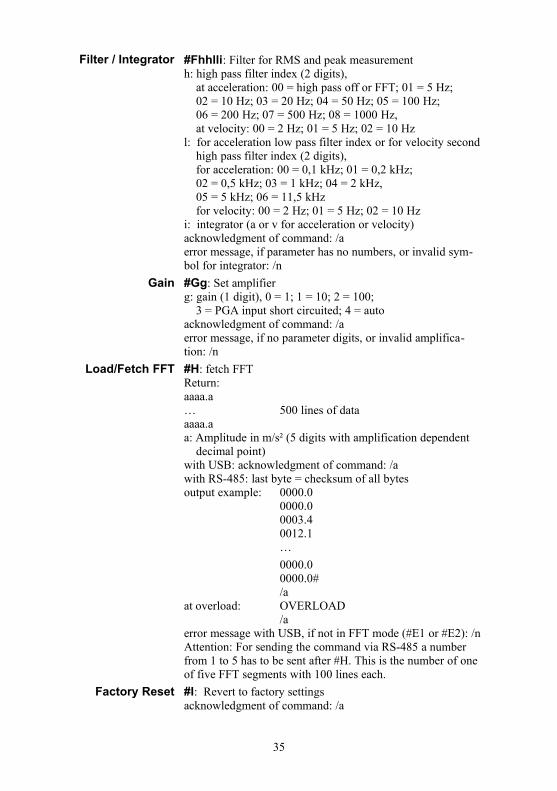
Filter / Integrator #Fhhlli: Filter for RMS and peak measurementh: high pass filter index (2 digits), at acceleration: 00 = high pass off or FFT; 01 = 5 Hz; 02 = 10 Hz; 03 = 20 Hz; 04 = 50 Hz; 05 = 100 Hz; 06 = 200 Hz; 07 = 500 Hz; 08 = 1000 Hz, at velocity: 00 = 2 Hz; 01 = 5 Hz; 02 = 10 Hzl: for acceleration low pass filter index or for velocity second high pass filter index (2 digits), for acceleration: 00 = 0,1 kHz; 01 = 0,2 kHz; 02 = 0,5 kHz; 03 = 1 kHz; 04 = 2 kHz, 05 = 5 kHz; 06 = 11,5 kHz for velocity: 00 = 2 Hz; 01 = 5 Hz; 02 = 10 Hzi: integrator (a or v for acceleration or velocity)acknowledgment of command: /a error message, if parameter has no numbers, or invalid sym-bol for integrator: /n
Gain #Gg: Set amplifierg: gain (1 digit), 0 = 1; 1 = 10; 2 = 100; 3 = PGA input short circuited; 4 = autoacknowledgment of command: /a error message, if no parameter digits, or invalid amplifica-tion: /n
Load/Fetch FFT #H: fetch FFT Return:aaaa.a… 500 lines of dataaaaa.aa: Amplitude in m/s² (5 digits with amplification dependent decimal point)with USB: acknowledgment of command: /a with RS-485: last byte = checksum of all bytes output example: 0000.0
0000.00003.40012.1…
0000.00000.0#/a
at overload: OVERLOAD/a
error message with USB, if not in FFT mode (#E1 or #E2): /nAttention: For sending the command via RS-485 a number from 1 to 5 has to be sent after #H. This is the number of one of five FFT segments with 100 lines each.
Factory Reset #I: Revert to factory settingsacknowledgment of command: /a
35
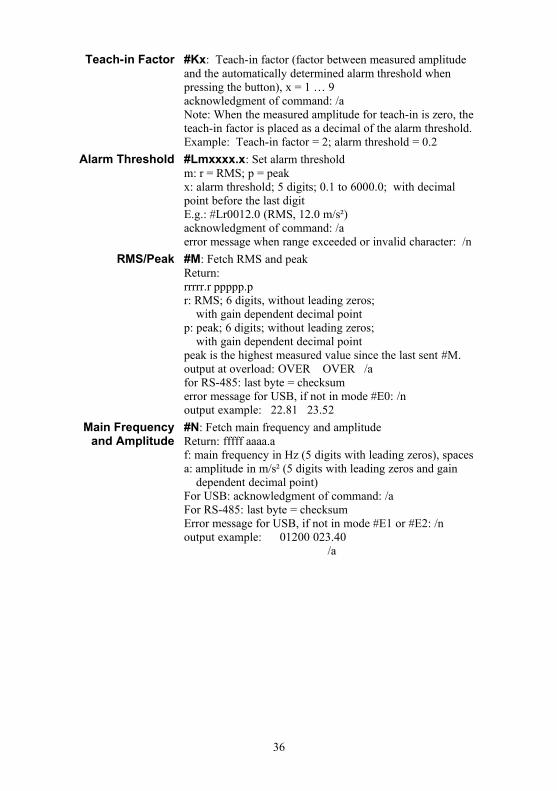
Teach-in Factor #Kx: Teach-in factor (factor between measured amplitude and the automatically determined alarm threshold when pressing the button), x = 1 … 9acknowledgment of command: /a Note: When the measured amplitude for teach-in is zero, the teach-in factor is placed as a decimal of the alarm threshold. Example: Teach-in factor = 2; alarm threshold = 0.2
Alarm Threshold #Lmxxxx.x: Set alarm thresholdm: r = RMS; p = peakx: alarm threshold; 5 digits; 0.1 to 6000.0; with decimal point before the last digit E.g.: #Lr0012.0 (RMS, 12.0 m/s²)acknowledgment of command: /a error message when range exceeded or invalid character: /n
RMS/Peak #M: Fetch RMS and peakReturn: rrrrr.r ppppp.pr: RMS; 6 digits, without leading zeros; with gain dependent decimal pointp: peak; 6 digits; without leading zeros; with gain dependent decimal pointpeak is the highest measured value since the last sent #M.output at overload: OVER OVER /a for RS-485: last byte = checksum error message for USB, if not in mode #E0: /noutput example: 22.81 23.52
Main Frequencyand Amplitude
#N: Fetch main frequency and amplitude Return: fffff aaaa.af: main frequency in Hz (5 digits with leading zeros), spacesa: amplitude in m/s² (5 digits with leading zeros and gain dependent decimal point)For USB: acknowledgment of command: /a For RS-485: last byte = checksum Error message for USB, if not in mode #E1 or #E2: /noutput example: 01200 023.40
/a
36
FFT LimitValues
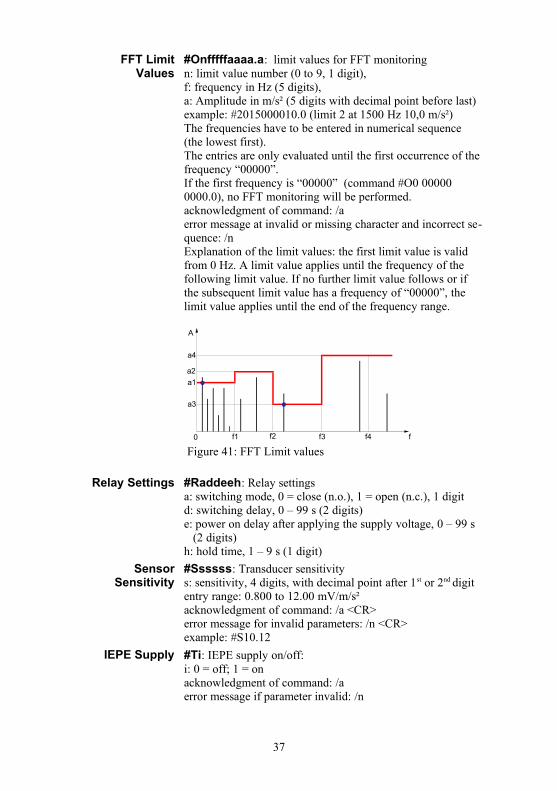
#Onfffffaaaa.a: limit values for FFT monitoring n: limit value number (0 to 9, 1 digit), f: frequency in Hz (5 digits), a: Amplitude in m/s² (5 digits with decimal point before last)example: #2015000010.0 (limit 2 at 1500 Hz 10,0 m/s²)The frequencies have to be entered in numerical sequence (the lowest first).The entries are only evaluated until the first occurrence of thefrequency “00000”. If the first frequency is “00000” (command #O0 00000 0000.0), no FFT monitoring will be performed.acknowledgment of command: /a error message at invalid or missing character and incorrect se-quence: /n Explanation of the limit values: the first limit value is valid from 0 Hz. A limit value applies until the frequency of the following limit value. If no further limit value follows or if the subsequent limit value has a frequency of “00000”, the limit value applies until the end of the frequency range.
Relay Settings #Raddeeh: Relay settingsa: switching mode, 0 = close (n.o.), 1 = open (n.c.), 1 digitd: switching delay, 0 – 99 s (2 digits)e: power on delay after applying the supply voltage, 0 – 99 s (2 digits)h: hold time, 1 – 9 s (1 digit)
SensorSensitivity
#Ssssss: Transducer sensitivity s: sensitivity, 4 digits, with decimal point after 1st or 2nd digitentry range: 0.800 to 12.00 mV/m/s²acknowledgment of command: /a <CR>error message for invalid parameters: /n <CR>example: #S10.12
IEPE Supply #Ti: IEPE supply on/off:i: 0 = off; 1 = onacknowledgment of command: /a error message if parameter invalid: /n
37
A
ff10 f2 f4
a1
a2
a3
a4
f3
Figure 41: FFT Limit values

Warning Limit #Www: Warning limit w: warning limit in % of the alarm limit (10 – 90 %), 2 digitsacknowledgment of command: /a error message, if no parameter numbers or range exceeded: /n
Read Settings #X: Read instruments data and settingsAnswer: tttt Ver. sss.hhh Ser. xxxxxx t: Type code (M14 , 4 characters) s: software version (3 digits) h: hardware version (3 digits) x: serial no. (6 digits)B: bbbbbbbbbbbbbbbbbbbb b: instruments name (20 upper case / numbers / spaces)C: mm yyyy Cal.-date, m: month* (3 characters), y: year (4 digits)) DA: ddddd d: amplitude calibration value (5 digits) DB: ddddd d: 4-20 mA loop zero point calibration value (5 digits)DC: ddddd d: 4-20 mA loop full scale calibration value (5 digits)E: e e: measuring mode (1 digit)F: hhlli h: high pass index (2 digits) l: low pass index (2 digits) i: integrator (0 = a / 1 = v); (1 charcter)G: ggg m g: gain (1 / 10 / 100; 3 s, (with leading space i.a.) m: f = fixed, a = automatic, z = zero point calibration (1 character)K: k k: teach-in factorL: xllll.l x: r = RMS, p = peak (1 character) l: alarm threshold (5-digits, with leading space i.a,; decimal point before the last digit)Www: w: warning limit (10 to 90 as a percentage; 2 digits)R: mddooh m: relay switching mode d: switching delay o: power on delay h: hold timeT:t t: IEPE supply, 0 = on, 1 = offO0: fffff aaaa.a limit values for FFT monitoring f: frequency in Hz (5 digits)
38

a: FFT limit value 1 (5 digits, decimal point before last)...O9: fffff aaaa.a S: sssss s: sensor sensitivity, 4 digits and decimal point
line break with <CR>for USB: acknowledgment of command: /a for RS-485: last byte = checksum of all previous bytes
#Z: Only for instrument detection, always returns /a
10.3 RS-485 Communication
The complete set of commands is available via the RS-485interface. In contrast to the USB commands the 6-digit serialnumber of the instrument has to be inserted after the #-sym-bol. This allows you to address each RS-485 Bus module sep-arately.
Interface: 57600 Baud, 8 data bits, 1 stop bit, no parity
Example: #123456G2 The amplification of the M14 unit with the serial number123456 is set to 100
11. Calibration
Re-Calibration The M14 is factory calibrated so that after entering the cor-rect sensor sensitivity (see section 6.2.3) you can accuratelymeasure amplitudes.
VibrationCalibrator
The calibration can be carried out in a simply way with a vi-bration calibrator of the ‘VC’ series from Metra. A precisemechanical vibration signal of 10 m/s² or 10 mm/s with a fre-quency of 159.15 Hz is fed into the sensor and the measuredRMS or peak values of M14 are tested (see. section 7.1).
12. Firmware Update
The instrument software of M14 can be updated via the USB-interface. You can find the version installed on your com-puter with the help of the setup and measurement programunder setup (figure 18 on page 16). The first 3 charactersshow the hardware version, the second three the software ver-sion.
Under https://mmf.de/software_download.htm#m14 you cancheck whether a newer firmware version exists. Unpack thefile m14.zip in a directory of your choice.
Close the setup and measurement program and install the pro-gram “Firmware Updater” from the above named website.
Start the “Firmware Updater”, then select the instrument type“M14” and the virtual COM-Port, which the M14 USB inter-face is connected to.
39
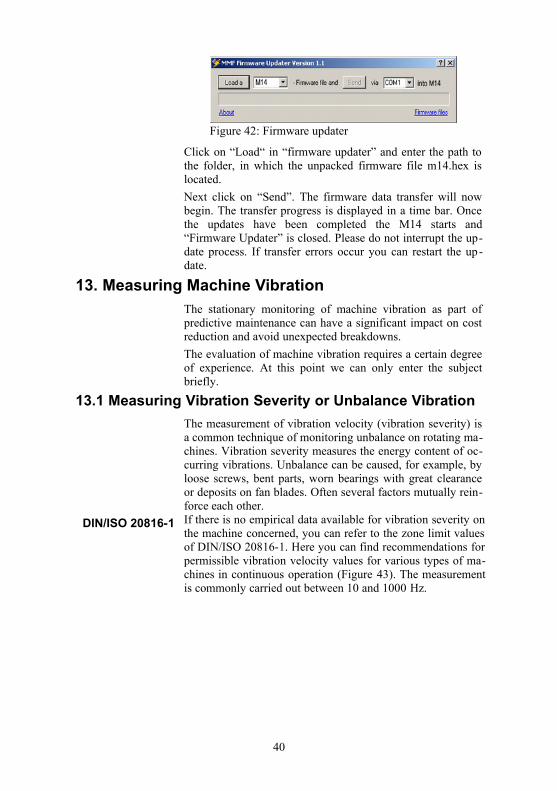
Click on “Load“ in “firmware updater” and enter the path tothe folder, in which the unpacked firmware file m14.hex islocated.
Next click on “Send”. The firmware data transfer will nowbegin. The transfer progress is displayed in a time bar. Oncethe updates have been completed the M14 starts and“Firmware Updater” is closed. Please do not interrupt the up-date process. If transfer errors occur you can restart the up-date.
13. Measuring Machine Vibration
The stationary monitoring of machine vibration as part ofpredictive maintenance can have a significant impact on costreduction and avoid unexpected breakdowns.
The evaluation of machine vibration requires a certain degreeof experience. At this point we can only enter the subjectbriefly.
13.1 Measuring Vibration Severity or Unbalance Vibration
The measurement of vibration velocity (vibration severity) isa common technique of monitoring unbalance on rotating ma-chines. Vibration severity measures the energy content of oc-curring vibrations. Unbalance can be caused, for example, byloose screws, bent parts, worn bearings with great clearanceor deposits on fan blades. Often several factors mutually rein-force each other.
DIN/ISO 20816-1 If there is no empirical data available for vibration severity onthe machine concerned, you can refer to the zone limit valuesof DIN/ISO 20816-1. Here you can find recommendations forpermissible vibration velocity values for various types of ma-chines in continuous operation (Figure 43). The measurementis commonly carried out between 10 and 1000 Hz.
40
Figure 42: Firmware updater

13.2 Monitoring Roller Bearings
While the procedure shown in in section 13.1 to DIN/ISO20816 deals with vibration, arising due to unbalance, this sec-tion concerns vibration of rolling bearings.
Typical causes of damage to roller bearings are fatigue, corro-sion, cage damage, poor lubrication, wear due to too high de-mands.
The consequences are damage to the raceways (pitting), in-creased temperature, noise, and clearance, bumpy operationeven to cage breakage and total breakdown of the machine.
When rolling over damaged areas impulses arise, which causethe system to vibrate. These vibrations can be measured, onthe bearing housing, for example.
The vibrations generated on rolling bearings are normallyabove 1 kHz. The vibration acceleration is usually recorded.
Damage on roller bearings can be diagnosed in frequency ortime domain. Diagnosis in the frequency spectrum deliversmore detailed information about the bearings under assess-ment. It does, however, require a high degree of experience.
The procedure in time domain (RMS and peak of accelera-tion) provides, on the other hand, more simple results and re-
41
Figure 43: Zone limit values for vibration velocity to DIN/ISO20816-1
quires less costly instruments. In the majority of cases theyprovide sufficient information about the condition of a rollerbearing.
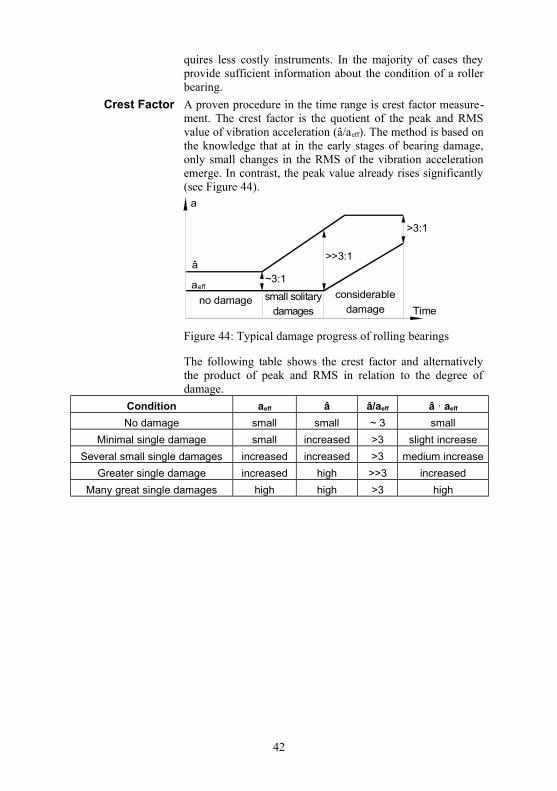
Crest Factor A proven procedure in the time range is crest factor measure-ment. The crest factor is the quotient of the peak and RMSvalue of vibration acceleration (â/aeff). The method is based onthe knowledge that at in the early stages of bearing damage,only small changes in the RMS of the vibration accelerationemerge. In contrast, the peak value already rises significantly(see Figure 44).
a
~3:1
>3:1
>>3:1
no damage small solitary damages
considerable
damage
â
aeff
Time
Figure 44: Typical damage progress of rolling bearings
The following table shows the crest factor and alternativelythe product of peak and RMS in relation to the degree ofdamage.
Condition aeff â â/aeff â · aeff
No damage small small ~ 3 small
Minimal single damage small increased >3 slight increase
Several small single damages increased increased >3 medium increase
Greater single damage increased high >>3 increased
Many great single damages high high >3 high
42

Diagnosis Indexto Sturm
A further method for monitoring roller bearings in the timerange is the diagnostic coefficient DK(t) according to Sturm.This is calculated from the RMS and peak value of accelera-tion in a good condition (0) and in the condition at the mo-ment of assessment (t):
kD (t) =a (0)eff â (0)a (t) â (t)eff
According to Sturm the following can be found:
DK(t) Rolling bearing condition
> 1 Improvement
1 ... 0.5 Good operating condition
0.5 ... 0.2 Accelerating influence to the damaging process
0.2 ... 0.02 Progressive damaging process
< 0.02 Damage
43
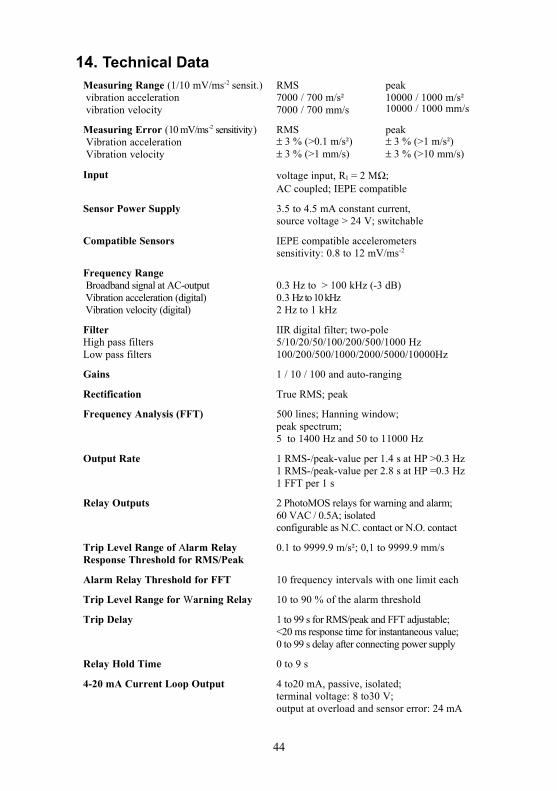
14. Technical DataMeasuring Range (1/10 mV/ms-2 sensit.) vibration acceleration vibration velocity
RMS7000 / 700 m/s²7000 / 700 mm/s
peak10000 / 1000 m/s²10000 / 1000 mm/s
Measuring Error (10 mV/ms-2 sensitivity) Vibration acceleration Vibration velocity
RMS 3 % (>0.1 m/s²) 3 % (>1 mm/s)
peak 3 % (>1 m/s²) 3 % (>10 mm/s)
Input voltage input, RI = 2 M; AC coupled; IEPE compatible
Sensor Power Supply 3.5 to 4.5 mA constant current, source voltage > 24 V; switchable
Compatible Sensors IEPE compatible accelerometerssensitivity: 0.8 to 12 mV/ms-2
Frequency Range Broadband signal at AC-output Vibration acceleration (digital) Vibration velocity (digital)
0.3 Hz to > 100 kHz (-3 dB) 0.3 Hz to 10 kHz 2 Hz to 1 kHz
FilterHigh pass filtersLow pass filters
IIR digital filter; two-pole5/10/20/50/100/200/500/1000 Hz100/200/500/1000/2000/5000/10000Hz
Gains 1 / 10 / 100 and auto-ranging
Rectification True RMS; peak
Frequency Analysis (FFT) 500 lines; Hanning window; peak spectrum;5 to 1400 Hz and 50 to 11000 Hz
Output Rate 1 RMS-/peak-value per 1.4 s at HP >0.3 Hz1 RMS-/peak-value per 2.8 s at HP =0.3 Hz1 FFT per 1 s
Relay Outputs 2 PhotoMOS relays for warning and alarm;60 VAC / 0.5A; isolatedconfigurable as N.C. contact or N.O. contact
Trip Level Range of Alarm RelayResponse Threshold for RMS/Peak
0.1 to 9999.9 m/s²; 0,1 to 9999.9 mm/s
Alarm Relay Threshold for FFT 10 frequency intervals with one limit each
Trip Level Range for Warning Relay 10 to 90 % of the alarm threshold
Trip Delay 1 to 99 s for RMS/peak and FFT adjustable; <20 ms response time for instantaneous value;0 to 99 s delay after connecting power supply
Relay Hold Time 0 to 9 s
4-20 mA Current Loop Output 4 to20 mA, passive, isolated; terminal voltage: 8 to30 V;output at overload and sensor error: 24 mA
44
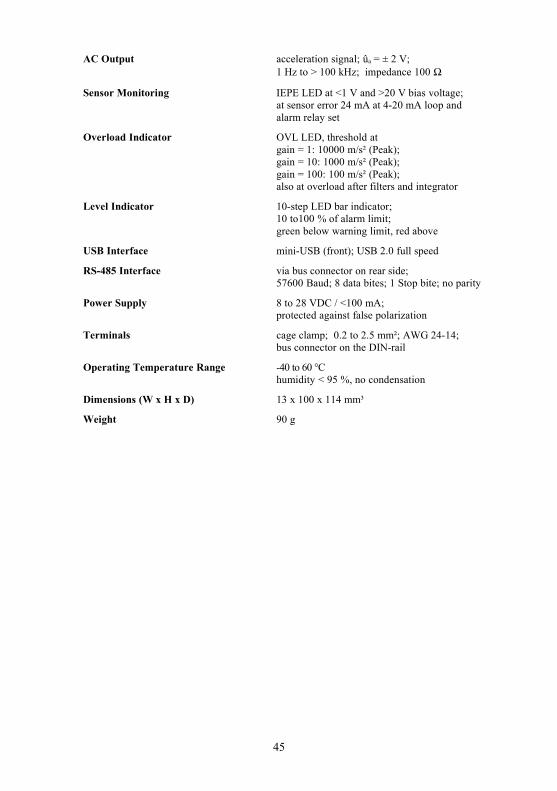
AC Output acceleration signal; ûa = ± 2 V;1 Hz to > 100 kHz; impedance 100
Sensor Monitoring IEPE LED at <1 V and >20 V bias voltage;at sensor error 24 mA at 4-20 mA loop and alarm relay set
Overload Indicator OVL LED, threshold atgain = 1: 10000 m/s² (Peak);gain = 10: 1000 m/s² (Peak);gain = 100: 100 m/s² (Peak);also at overload after filters and integrator
Level Indicator 10-step LED bar indicator;10 to100 % of alarm limit;green below warning limit, red above
USB Interface mini-USB (front); USB 2.0 full speed
RS-485 Interface via bus connector on rear side; 57600 Baud; 8 data bites; 1 Stop bite; no parity
Power Supply 8 to 28 VDC / <100 mA;protected against false polarization
Terminals cage clamp; 0.2 to 2.5 mm²; AWG 24-14;bus connector on the DIN-rail
Operating Temperature Range -40 to 60 °C humidity < 95 %, no condensation
Dimensions (W x H x D) 13 x 100 x 114 mm³
Weight 90 g
45

Warranty
Metra warrants for a period of
24 months
that its products will be free from defects in material or workmanship
and shall conform to the specifications current at the time of shipment.
The warranty period starts with the date of invoice.
The customer must provide the dated bill of sale as evidence.
The warranty period ends after 24 months. Repairs do not extend the warranty period.
This limited warranty covers only defects which arise as a result of normal use ac-cording to the instruction manual.
Metra’s responsibility under this warranty does not apply to any improper or inadequate maintenance or modification
and operation outside the product’s specifications.
Shipment to Metra will be paid by the customer.
The repaired or replaced product will be sent back at Metra’s expense.
Declaration of ConformityTo EU Guidelines 2014/30/EU
Product: Vibration Monitor
Type: M14
Hereby is certified that the above mentioned products comply
with the demands pursuant to the following standards
EN 61326-1: 2013EN 61010-1: 2011DIN 45669-1: 2010
The producer responsible for this declaration is
Manfred Weber Metra Mess- und Frequenztechnik in Radebeul e.K.
Meißner Str. 58
D-01445 RadebeulDeclared by
Michael Weber, Radebeul, 5th December 2017
46