Vibration-induced electrical noise in a cryogen-free ...
13
Vibration-induced electrical noise in a cryogen-free dilution refrigerator: Characterization, mitigation, and impact on qubit coherence Rachpon Kalra, Arne Laucht, Juan Pablo Dehollain, Daniel Bar, Solomon Freer, Stephanie Simmons, Juha T. Muhonen, and Andrea Morello Citation: Review of Scientific Instruments 87, 073905 (2016); doi: 10.1063/1.4959153 View online: http://dx.doi.org/10.1063/1.4959153 View Table of Contents: http://scitation.aip.org/content/aip/journal/rsi/87/7?ver=pdfcov Published by the AIP Publishing Articles you may be interested in Design of a scanning gate microscope for mesoscopic electron systems in a cryogen-free dilution refrigerator Rev. Sci. Instrum. 84, 033703 (2013); 10.1063/1.4794767 A cryogen-free dilution refrigerator based Josephson qubit measurement system Rev. Sci. Instrum. 83, 033907 (2012); 10.1063/1.3698001 A completely self-contained cryogen-free dilution refrigerator, the TritonDR TM Low Temp. Phys. 34, 404 (2008); 10.1063/1.2911663 Faithful qubit transmission against collective noise without ancillary qubits Appl. Phys. Lett. 91, 144101 (2007); 10.1063/1.2794433 Calorimetric Realization of Low‐Temperature Fixed Points Using a Cryogen‐Free Refrigerator System AIP Conf. Proc. 684, 969 (2003); 10.1063/1.1627254 Reuse of AIP Publishing content is subject to the terms at: https://publishing.aip.org/authors/rights-and-permissions. Download to IP: 130.102.42.98 On: Thu, 06 Oct 2016 02:56:21
Transcript of Vibration-induced electrical noise in a cryogen-free ...

Vibration-induced electrical noise in a cryogen-free dilution refrigerator:Characterization, mitigation, and impact on qubit coherenceRachpon Kalra, Arne Laucht, Juan Pablo Dehollain, Daniel Bar, Solomon Freer, Stephanie Simmons, Juha T.Muhonen, and Andrea Morello Citation: Review of Scientific Instruments 87, 073905 (2016); doi: 10.1063/1.4959153 View online: http://dx.doi.org/10.1063/1.4959153 View Table of Contents: http://scitation.aip.org/content/aip/journal/rsi/87/7?ver=pdfcov Published by the AIP Publishing Articles you may be interested in Design of a scanning gate microscope for mesoscopic electron systems in a cryogen-free dilution refrigerator Rev. Sci. Instrum. 84, 033703 (2013); 10.1063/1.4794767 A cryogen-free dilution refrigerator based Josephson qubit measurement system Rev. Sci. Instrum. 83, 033907 (2012); 10.1063/1.3698001 A completely self-contained cryogen-free dilution refrigerator, the TritonDR TM Low Temp. Phys. 34, 404 (2008); 10.1063/1.2911663 Faithful qubit transmission against collective noise without ancillary qubits Appl. Phys. Lett. 91, 144101 (2007); 10.1063/1.2794433 Calorimetric Realization of Low‐Temperature Fixed Points Using a Cryogen‐Free Refrigerator System AIP Conf. Proc. 684, 969 (2003); 10.1063/1.1627254
Reuse of AIP Publishing content is subject to the terms at: https://publishing.aip.org/authors/rights-and-permissions. Download to IP: 130.102.42.98 On: Thu, 06 Oct
2016 02:56:21

REVIEW OF SCIENTIFIC INSTRUMENTS 87, 073905 (2016)
Vibration-induced electrical noise in a cryogen-free dilution refrigerator:Characterization, mitigation, and impact on qubit coherence
Rachpon Kalra,a) Arne Laucht, Juan Pablo Dehollain,b) Daniel Bar, Solomon Freer,Stephanie Simmons,c) Juha T. Muhonen,d) and Andrea Morelloe)
Centre for Quantum Computation and Communication Technology, School of Electrical Engineeringand Telecommunications, UNSW Australia, Sydney NSW 2052, Australia
(Received 10 March 2016; accepted 7 July 2016; published online 27 July 2016)
Cryogen-free low-temperature setups are becoming more prominent in experimental science due totheir convenience and reliability, and concern about the increasing scarcity of helium as a naturalresource. Despite not having any moving parts at the cold end, pulse tube cryocoolers introducevibrations that can be detrimental to the experiments. We characterize the coupling of these vibrationsto the electrical signal observed on cables installed in a cryogen-free dilution refrigerator. The domi-nant electrical noise is in the 5–10 kHz range and its magnitude is found to be strongly temperaturedependent. We test the performance of different cables designed to diagnose and tackle the noise, andfind triboelectrics to be the dominant mechanism coupling the vibrations to the electrical signal.Flattening a semi-rigid cable or jacketing a flexible cable in order to restrict movement withinthe cable, successfully reduces the noise level by over an order of magnitude. Furthermore, wecharacterize the effect of the pulse tube vibrations on an electron spin qubit device in this setup.Coherence measurements are used to map out the spectrum of the noise experienced by the qubit,revealing spectral components matching the spectral signature of the pulse tube. Published by AIPPublishing. [http://dx.doi.org/10.1063/1.4959153]
I. INTRODUCTION
Traditional “wet” dilution refrigerators rely on liquefiedhelium, which is a limited natural resource that is becomingincreasingly scarce and, therefore, expensive. While a systemcan be installed for reliquefaction, the necessary equipmentand infrastructure is quite expensive and, even then, ∼10%losses are common. Further disadvantages of wet fridgesinclude the small size of the sample space, limited by thenarrow-neck Dewars required to minimize helium boil-off,and the need to refill the helium Dewar every 2-4 days whichmay interrupt sensitive experiments. These factors have ledto the increasing popularity of cryogen-free systems, where apulse tube (PT) cooler is used to cool the dilution unit to below4 K. These “dry fridges” do, however, have major sources ofvibrational and acoustic noise.1,2 The necessary compressorand rotary valve, used in modern systems, are the sources oftangible vibrations external to the cryostat. Inside the pulsetube, the dynamics of the helium gas can produce acousticvibrations that are directly coupled to the cold head.
Significant efforts have been made by manufacturers andresearchers3,4 to minimize the coupling of these vibrationsto the sample-space in the cryostat, as will be describedin Section II. For example, atomic scale microscopy in
a)Now at School of Mathematics and Physics, University of Queensland,Brisbane QLD 4072, Australia.
b)Now at QuTech and Kavli Institute of Nanoscience, TU Delft, 2628CJDelft, The Netherlands.
c)Now at Physics Department, Simon Fraser University, British Columbia,Canada.
d)Now at Center for Nanophotonics, FOM Institute AMOLF, Science Park104, 1098 XG Amsterdam, The Netherlands.
e)Electronic mail: [email protected]
cryogen-free systems required further in-house modificationsto achieve extreme mechanical isolation.5,6 In the context ofqubit experiments, mechanical vibrations can contribute todephasing through motion in an inhomogeneous magneticfield, or resulting electrical noise on control lines (Sections IVand V).
In this paper, we report on how vibrational noise fromthe pulse tube significantly couples to the electrical signalmeasured on our cables, over a bandwidth of up to 40 kHz.We characterize this noise and, by testing the performance ofdifferent types of cables, learn that the dominant mechanismthrough which the vibrations couple into the electrical signalis via triboelectric effects.7 We then use the cables that yieldthe minimum amount of voltage noise and current noise totest the coherence of an electron spin qubit. Performing noisespectroscopy clearly reveals that the vibrations from the pulsetube translate into noise that contributes to qubit decoherence.
II. MEASUREMENT SETUP
Figure 1 shows the schematics of our BlueFors BF-LD400dilution refrigerator setup. Pre-cooling to <4 K is provided bya two-stage Cryomech PT-415 pulse tube cryocooler, whichis driven by a CP1000 helium compressor. As shown in theschematics, the low and high pressure lines in and out ofthe compressor are connected to a rotary valve. This has aninternal disc that is incrementally rotated at a frequency of140 Hz by a stepper motor with a full rotation frequency of1.4 Hz. With each half rotation, the rotary valve switches theconnection of the pulse tube between the low and high pressurelines. The valve is mounted on a metal plate, along with thehelium gas reservoirs, which stands on rubber posts to isolate
0034-6748/2016/87(7)/073905/12/$30.00 87, 073905-1 Published by AIP Publishing. Reuse of AIP Publishing content is subject to the terms at: https://publishing.aip.org/authors/rights-and-permissions. Download to IP: 130.102.42.98 On: Thu, 06 Oct
2016 02:56:21

073905-2 Kalra et al. Rev. Sci. Instrum. 87, 073905 (2016)
FIG. 1. (a) Schematics of the cryogen-free dilution refrigerator measurementsetup. The two stages of the pulse tube cooler (black) are connected tothe 50 K and 4 K plates inside the cryostat (gray) with copper braids forvibration isolation. The coaxial cables (orange) run from the measurementsetup into the cryostat and down to a filter box (brown), thermalized at eachflange with either a bulkhead (filled circle) or a clamp (empty circle). (b)Block diagram of the measurement instrumentation used for either current orvoltage measurements. In both cases, a digital oscilloscope acquires the finalsignal.
the 140 Hz vibrations from the cryostat. The pulse tube isdesigned to be vibrationally isolated from the cryostat, wheresoft copper braids are used to thermally link the cold heads totheir respective plates in the dilution refrigerator.
The cables run from the “measurement box,” as shown inFigure 1, from room temperature down to the mixing chamberplate. Our standard setup uses cupronickel semi-rigid cablesfrom COAX CO, part number SC-219/50-CN-CN (we refer tothis cable as “UT85 cupronickel”). We have SMA bulkheadsfrom Huber-Suhner at two stages. The hermetically sealed34_SMA-50-0-3/111 is used at the top plate and the standard34_SMA-50-0-1/111 is used at the 4 K plate. On the 50 K,1 K, and cold plates, we use copper clamps made in-house forthermalization of the cables without the need for bulkheads.Finally, these cables go to a filter box made in-house at themixing chamber plate. The filter box houses a printed circuitboard where, for each line, a Mini-Circuits LFCN-80+ LC-pi low-pass filter cuts off frequencies greater than 80 MHz.This provides effective attenuation up to ∼3 GHz. To filterout noise beyond this frequency, each line is counter-woundaround an ECCOSORB rod and the box is filled with copper
powder. Not shown in this figure is the space in which thesample is mounted below the mixing chamber plate and thesuperconducting vector magnet from American Magnetics.Also not shown is a constantan twisted-pair “loom” wire usedto carry our low-frequency signals to the device that goesthrough a separate filter box.
We perform measurements on gated silicon nanostruc-tures for spin-qubit experiments.8–11 For these experiments,it is important to minimize vibrations of the sample withrespect to the field applied by the superconducting magnet.Furthermore, vibrations can affect spin-qubit measurementsthrough the creation of voltage noise on the gate electrodesof the device and the addition of noise to the measurementsignal. The measured signal is the current flowing througha single-electron transistor (SET), which is switched offand on by single-electron tunneling events to and from anearby 31P donor. These events occur with a frequency of100 Hz–100 kHz and modulate the current with a typicalcontrast of 1 nA.
Figure 1(b) shows our typical signal measurement setup.For current measurement, we use the FEMTO DLPCA-200transimpedance amplifier set to low-noise mode with a gainof 107 V/A, which has an input impedance of 150 Ω and apassband from DC to 50 kHz. The signal is then amplified bya Stanford Research Systems (SRS) SIM910 voltage amplifiermodule on a SIM900 mainframe with gain 10 V/V. The inputshield is set to floating to break a ground loop. The output ispassed through a SIM965 analog filter module set to a low-passfourth order Bessel filter with a cutoff frequency of 40 kHz andnegligible output impedance. An AlazarTech ATS9440 PCIdigitizer card acquires the final signal. As shown in the figure, adifferent instrument is used to perform voltage measurements.While we do not typically measure voltages within the scopeof our experiments, this was set up to measure the noise onour lines, as we will discuss later in the paper. For voltagemeasurements, we use the SR560 voltage amplifier set to again of either 103 or 104 V/V, with a low-pass filter at 100 kHzwith 12 dB/oct roll-off. The amplifier has an input impedanceof 100 MΩ and output impedance of 50 Ω. The digitizerused to acquire the final signal has an input impedance of50 Ω as well, which halves the gain of our voltage amplifierchain. The use of the SR560 here introduces a ground loopin the system, but we focus on the spectral components ofinterest.
III. PULSE TUBE NOISE
With the system at its base temperature of ∼11 mK, weset up our measurement of the current through the SET. A2-s trace of the current acquired with 200 kSa/s is shown inFigure 2(a), labeled “PT on.” The gain of the amplifier chain(0.1 V/nA) has been taken into account to plot the magnitudeof the current. We observe noise that coincides with the chirp-ing of the pulse tube. Chirping refers to the audible 1.4 Hzcycle of connecting the pulse tube to the high and low pres-sure lines from the compressor. With an amplitude exceeding10 nA, the noise would completely overwhelm our experi-mental signal. We temporarily switch off the pulse tube cooler,such that both the compressor and the rotary valve are switched
Reuse of AIP Publishing content is subject to the terms at: https://publishing.aip.org/authors/rights-and-permissions. Download to IP: 130.102.42.98 On: Thu, 06 Oct
2016 02:56:21

073905-3 Kalra et al. Rev. Sci. Instrum. 87, 073905 (2016)
FIG. 2. (a) Current traces measured on a UT85 cupronickel cable run fromroom temperature to the sample at 10 mK. The green and black traces aretaken when the pulse tube is on and off, respectively. (b) Audio recording ofthe pulse tube chirps. (c) Amplitude spectral density of the current trace witha zoom-in of the 5–12 kHz range shown in (d). (e) Amplitude spectral densityof the audio trace. (f) Vibration spectral density measurement taken with anaccelerometer.
off, without interrupting the dilution refrigeration to acquirethe trace labeled “PT off.” The noise amplitude reduces by afactor of 8, clearly indicating that the noise is caused by theoperation of the pulse tube.
Figure 2(b) shows an audio recording of the chirpingnext to the setup, taken with the standard sampling rate of44.1 kSa/s. Note that traces (a) and (b) were not taken
simultaneously. Figure 2(c) shows the amplitude spectraldensity of the current trace. The dominant noise spectrum isbetween 5 and 10 kHz, which overlaps with the bandwidth ofthe spin readout experiment we typically perform.8 We alsoobserve a peak at 140 Hz, caused by vibrations of the rotaryvalve, but this is negligible compared to the dominant noise.
Figure 2(d) shows a zoom-in of the dominant noise. Weobserve sharp peaks in the 5–10 kHz range that are regularlyspaced with a separation of ∼400 Hz. We also calculate theamplitude spectral density of the audio signal and show azoom-in of the same frequency region in Figure 2(e). Weobserve the same pattern, with the frequency peaks match-ing those from the current measurements. In another test, wetook vibration measurements with a Wilcoxon Research 731Aseismic accelerometer. While this model is low-pass filtered at450 Hz, we still managed to acquire an appreciable signal inthe kHz range. We placed the accelerometer at the top of theframe on which the fridge is mounted. Figure 2(f) shows theamplitude spectral density of the vibration velocity in the samefrequency range for an average of 100 traces. We observe thesame characteristic 400 Hz spacing between peaks, again withthe frequencies matching the previous traces.
Figure 3 plots the spectrograms of both the current andaudio signals to reveal how their spectra vary with time. Thespectrograms are obtained by dividing the signals into 20 mswindows, with an overlap between adjacent windows of 10 msfor smoothing. A Hamming window is used to reduce spectralleakage. The power spectral density is then calculated fromthe Fourier transform, and the spectrograms are plotted to40 kHz for the current signal in Figure 3(a) and to 20 kHzfor the audio signal in Figure 3(b). The spectrograms revealhow the regularly spaced peaks in the 5–10 kHz range fromFigures 2(d)-2(f) are produced. Figure 3 shows three chirps ofthe pulse tube, occurring at times ∼0.1 s, ∼0.8 s, and ∼1.5 s.We see that with each chirp, the 400 Hz-spaced peaks arenot produced simultaneously, but rather each peak occurs inquick succession. Each subsequent peak is spaced by roughly400 Hz in frequency and by 10–20 ms in time. Following apeak, there appears to be a finite decay time in the magnitudeof noise at that frequency. This is shown more clearly in thespectrogram of the audio signal, where the result is a “slantedcomb” structure. This comb also appears in between chirps,at ∼0.5 s and ∼1.2 s, when the rotary valve connects the lowpressure line from the compressor. It is interesting that these
FIG. 3. Spectrograms of (a) the current trace shown in Figure 2(a), and of (b) the audio record shown in Figure 2(b). Reuse of AIP Publishing content is subject to the terms at: https://publishing.aip.org/authors/rights-and-permissions. Download to IP: 130.102.42.98 On: Thu, 06 Oct
2016 02:56:21

073905-4 Kalra et al. Rev. Sci. Instrum. 87, 073905 (2016)
combs are slanted in the same direction as the ones where thehigh pressure line is connected, although they have a loweramplitude and a longer delay between successive peaks.
With the understanding that the observed electrical noiseoriginates from (or is at least strongly correlated with) vibra-tional noise, we perform further tests to gain insight into theproblem. We first test the effect of ambient acoustics by playinga 3 kHz tone next to the cryostat to see if it couples to themeasured signal. With the volume set much louder than thechirps of the pulse tube, the amplitude spectrum still showsthat the magnitude of the tone is significantly lower thanthe 5–10 kHz peaks (data not shown). This suggests that theproblematic vibrations are not coupling via acoustics throughthe air to the top flange. We then attempt to reduce the noiseby replacing the default step driver to the rotary valve witha linear ramp driver. We try this with the LNII linear micro-stepping drive from Precision Motion Controls. While thisslightly reduces the amplitude of the 140 Hz peak as measuredboth by the accelerometer and the current signal, it does notmake a difference to the dominant noise in the 5–10 kHz range(data not shown).
Next we test the hypothesis that the vibrations may beoriginating from the gas reservoir and rotary valve, combinedwith an ineffective damping from the rubber posts supportingthat plate. We therefore detach the entire plate and lift it a fewcm over the frame. The helium lines are, of course, still con-nected to the pulse tube. Analyzing the amplitude spectra of thetwo traces, this does not make any difference to the dominant5–10 kHz noise observed. However, the 140 Hz peak causedby the vibrations of the rotary valve reduces in amplitude by afactor of 11 (data not shown). This led us to investigate whetherthe 140 Hz peak actually couples to the room-temperature partof the measurement setup as opposed to the cable in the cryo-stat. Careful positioning of the room-temperature connectionto the transimpedance amplifier reduces the 140 Hz peak closeto the noise floor, while the higher frequency noise associatedwith the pulse tube chirps remains unaffected. This supportsthe hypothesis that the 140 Hz peak is being coupled throughthe room-temperature part of the setup.
Finally, we investigate the dependence of the magnitudeof the noise on the temperature of the system. For this test,we use a UT85 cupronickel line that terminates at an open-circuit bulkhead at the 4 K plate. Figure 4(a) plots the current
FIG. 4. The current is measured at different temperatures of the second stageof the pulse tube during a cool-down. The UT85 cupronickel cable is runfrom the room-temperature flange to the 4 K plate. (a) The current traces areplotted for four selected temperatures. (b) The RMS current is plotted as afunction of temperature.
traces at different temperatures, clearly showing the increasein the magnitude of the noise with decreasing temperature.Figure 4(b) plots the root-mean-square (RMS) values of thecurrent traces as a function of temperature, suggesting anexponential dependence.
While the pulse tube chirps reduce by over an order-of-magnitude from 4 K to 240 K, the 140 Hz peak reduces by lessthan a factor of two. This also supports the hypothesis that the140 Hz vibrations are largely coupling in to the signal via theroom-temperature cables.
The dependence of the magnitude of the pulse tube chirpson temperature must come from the origin of the vibrationswithin the pulse tube itself and/or the mechanism by whichthey couple to the electrical signal. The volume of the soundmade by the pulse tube during the cool-down does not varysignificantly. If this is a good measure of the magnitude ofthe vibrations at the source, then this would suggest that thetemperature dependence lies in the coupling mechanism.
The amplitude of the current noise of the trace shown inFigure 2(a), where a cable reaching the device enclosure wastested, is approximately 3 times larger than that of the 4 Ktrace shown in Figure 4(a), where the cable stops at the 4 Kplate. The dependence of the noise magnitude with cold cablelength is consistent with vibration-to-signal coupling occurr-ing within the cables. We have two models for how vibrationscan couple to the electrical signal, both of which are basedon the fact that the dielectric of the coaxial cable undergoesa greater thermal contraction than the outer conductor.
The dielectric should undergo the majority of its thermalcontraction at a relatively high temperature. From Figure 4(b),however, the noise appears to continually increase withdecreasing temperature down to 4 K. Recall that the cabletested is fixed on one end to the room-temperature plate andon the other to the 4 K plate, resulting in a thermal gradient.Therefore, the length of the cable that is cold, and that cantherefore translate vibrations to electrical noise, continuallyincreases with decreasing temperature at the cold end.
The first candidate model is the creation of noise dueto microphonics. We refer specifically to the effect used in acapacitor microphone, where acoustic vibrations cause fluctu-ations in capacitance. A current is produced that is proportionalto these fluctuations and the voltage applied across the capac-itor. In our cables, the thermal contraction of the dielectriccauses it to be squeezed around the inner conductor and resultsin a gap being formed between it and the outer conductor. Thus,vibrations can cause movement of the dielectric and innerconductor with respect to the outer conductor, which translatesto variations in the effective capacitance of the line. While wehave not intentionally applied a voltage on the line, one maybe created by the thermoelectric effect. A voltage differenceon the order of millivolts would be induced between the coldand room temperature ends of the line, and a difference maybe present between the inner and outer conductors dependingon their construction and assembly.
We test if the dominant mechanism is microphonics byapplying a voltage on the line while measuring the current,which can be achieved with the FEMTO DLPCA-200 tran-simpedance amplifier. Applying biases of up to 5 V on theline, we find that the current measured is independent of the
Reuse of AIP Publishing content is subject to the terms at: https://publishing.aip.org/authors/rights-and-permissions. Download to IP: 130.102.42.98 On: Thu, 06 Oct
2016 02:56:21

073905-5 Kalra et al. Rev. Sci. Instrum. 87, 073905 (2016)
applied bias (data not shown). Based on this, we believe thatthe dominant effect is not capacitor microphonics.
The second candidate is the creation of noise via thetriboelectric effect.7 When the dielectric is rubbed againsteither the inner or outer conductor, any friction experiencedwill facilitate the transfer of charge that can be measured aseither a current or a voltage depending on the setup. Theshrinking of the dielectric with decreasing temperature allowsmore room for sliding and rubbing between the dielectric andouter conductor. The amount of friction and charge transferinside a cable will vary significantly with the construction ofand materials in the cable. Therefore, we proceed by installingand measuring several different types of cables in our setup,which will be discussed in detail in Sec. IV.
IV. CABLE COMPARISON
We prepare a measurement of the noise on different typesof cables with the aim of understanding the coupling mecha-nism and of identifying ways to reduce the noise as much aspossible. We test four variations of semi-rigid cables and fourvariations of flexible cables. For fair comparison, all of thesecables run from room temperature to open-circuit terminatedbulkheads at the 4 K plate. The semi-rigid cables tested areclamped at the 50 K stage for thermalization as describedbefore. The flexible cables are thermalized by taping and tyingthem to posts both above the 50 K and 4 K plates. The system iscooled to <4 K and the dilution unit is not operated. We recordboth the voltage noise and current noise present on the cables.Measurements are performed as described previously.
Figures 5 and 6 show the results for the semi-rigid andflexible cables tested, respectively. The first column showsthe schematics of the cable, with dimensions and materialslabeled. The second column shows the time traces of the cur-rent and voltage noise, where available. The traces plotted herehave been filtered digitally to remove components that are notrepresentative of the noise created in the cable. A notch filter isused to remove the 140 Hz signal that couples to both the cur-rent and voltage measurements in the room-temperature setup.Additionally, the voltage measurement introduces a peak at∼30 kHz independent of the cable, which we also removewith a notch filter. The RMS values labeled in the figure arecalculated using the filtered traces. The third column shows theamplitude spectral density of the unfiltered current and voltagetraces, so that the 140 Hz and 30 kHz peaks are visible here.Note that the voltage noise and current noise measurements arenot normalized to the length of the cable, as they are installedwith the necessary length to reach the 4 K plate with thethermalization steps in our setup.
The first cable presented in Figure 5 is the original cabletested, the semi-rigid UT85 cupronickel cable from COAXCO. The RMS values for the current and voltage noise tracesare 620 pA and 54 µV. From this, we estimate the effectiveoutput impedance, Rn, of this “noise source” between the innerand outer conductors of the cable to be 90 kΩ. This is an impor-tant quantity in determining whether or not this noise is detri-mental to a particular experiment. We thus analyse our setupin relation to the measurement of the current through the SETand on the voltage biases applied to electrodes on the device.
The setup for measuring the SET current is as described beforeand is summarized in Figure 7(a). A transimpedance amplifierwith an input impedance of 150Ω sits at room temperature andis connected to a cable that runs inside the cryostat. The outputof the cable is connected to an LC-pi 80 MHz low-pass filter atthe mixing chamber plate which can be ignored in the contextof the∼kHz pulse tube noise, and is thus omitted from Figure 7.The output of the filter is then connected to the drain contactof the SET. The impedance of the SET to the source contactvaries between ∼100 kΩ and an open-circuit, depending onwhether it is biased to a conductance peak or in Coulombblockade. This means that the noise source at the cable “sees” ahigh impedance to its right (the SET) and a low impedance toits left (the transimpedance amplifier). Therefore, the major-ity of the noise current in flows through the transimpedanceamplifier, corrupting the experimental signal of the currentthrough the SET. Techniques such as lock-in modulation andRF reflectometry12 are able to modulate the readout signal to ahigher frequency, thus avoiding the ∼10 kHz pulse tube noise.However, care must still be taken in considering the effect ofthis noise on the voltage biasing of the gate electrodes.
The experiments we conduct are sensitive to voltage noisepresent at the gate electrodes of the device.13 The gates weintend to pulse with moderately high frequencies are con-nected through 80 MHz low-pass filters which, again, canbe ignored in the context of the ∼kHz pulse tube noise. Atroom temperature, a passive voltage summer-divider circuit,with resistors in the order ∼kΩ, is used to combine a DCvoltage from an SRS SIM928 isolated voltage source andvoltage pulses from a Teledyne-Lecroy ArbStudio 1104 arbi-trary waveform generator. This means that the noise source atthe cable “sees” an open circuit to its right (the gate electrode)and a resistance of ∼3 kΩ to its left (the output of the roomtemperature summer-divider circuit). In this configuration, thevoltage noise at the gate electrode would only be a few percentof the voltage noise vn produced by the cable, since Rn ismuch larger than the output impedance of the voltage divider-combiner. In Section V, we quantify the effect of this noise inour experiments.
The second row of Figure 5 shows the noise measuredon an identical cable that has been flattened with a vise. Theentire length of the cable is flattened apart from the sectionsthat are looped for strain relief and thermalization of the innerconductor. The purpose of the flattening is to restrict move-ment of the dielectric when the cable is cooled to reducetriboelectric effects. Comparing the RMS values for the currentand voltage traces, the flattening yields an improvement offactor 10 and 3, respectively. From the amplitude spectra, wesee that the pulse tube noise near 10 kHz has reduced by anorder of magnitude for both current and voltage measurements.While the current signal for the standard cable is dominatedby the spectral components in this region, the voltage noisehas lower frequency contributions with comparable amplitude.The noise in the lower frequency region (30–3000 Hz) is notreduced by flattening the cable.
The third and fourth rows of Figure 5 show the noisemeasured on a thinner cable made of the same material (UT47cupronickel) and a cable of the same dimensions made withstainless steel (UT85 stainless), both from COAX CO. The
Reuse of AIP Publishing content is subject to the terms at: https://publishing.aip.org/authors/rights-and-permissions. Download to IP: 130.102.42.98 On: Thu, 06 Oct
2016 02:56:21

073905-6 Kalra et al. Rev. Sci. Instrum. 87, 073905 (2016)
FIG. 5. Each row shows the noise measurements for a particular semi-rigid cable, terminating in an open-circuit at a bulkhead on the 4 K plate. Schematics ofthe cable is shown in the first column. The second column shows the current and voltage traces, with their RMS values written in the top-right corner of eachgraph. The third column shows the amplitude spectral density of the current and voltage traces.
thinner cable is the SC-119/50-CN-CN and the stainless steelcable is the SC-219/50-SS-SS. The noise amplitudes are of thesame order as that of the standard UT85 cupronickel cable.
Figure 6 shows the noise measurements on four typesof flexible cables. The first row shows the noise measuredon the “ultra miniature coaxial cable” Type SS from LakeShore Cryotronics. This cable, as the drawing shows, has stain-
less steel strands for the center conductor, Teflon insulation,braided stainless steel wire as the outer conductor, and a Teflonjacket. The current and voltage noise are significantly lower ascompared to the standard semi-rigid cables, with RMS valuesof 37 pA and 12 µV, respectively. We conjecture that the Teflonjacket serves to squeeze the braided outer conductor onto thedielectric to prevent movement within the cable when cooled.
Reuse of AIP Publishing content is subject to the terms at: https://publishing.aip.org/authors/rights-and-permissions. Download to IP: 130.102.42.98 On: Thu, 06 Oct
2016 02:56:21

073905-7 Kalra et al. Rev. Sci. Instrum. 87, 073905 (2016)
FIG. 6. Each row shows the noise measurements for a particular flexible cable, terminating in an open-circuit at a bulkhead on the 4 K plate. Schematics ofthe cable is shown in the first column. The second column shows the current and voltage traces, where available, with their RMS values written in the top-rightcorner of each graph. The third column shows the amplitude spectral density of the current and voltage traces.
We thus take an identical cable and strip it of the jacket, asshown in the second row of the figure. The current trace hasan RMS value of 420 pA, which is a factor of 11 worse thanthe jacketed version. The amplitude spectrum shows that thisorder of magnitude increase in the noise is across the entirefrequency range. The record for the voltage measurement isnot available for this cable.
The final cable we test is a graphite-coated cable given tous by David Goldhaber-Gordon. In their paper on vibrational
noise in a pulse-tube system, Pelliccione et al. reported the useof a cable with graphite coating on the outside of the dielectricto reduce triboelectric effects due to rubbing against the outerconductor.5 The graphite is a conductive solid-state lubricantthat is meant to reduce friction between the dielectric and outerconductor and to rapidly return any charges displaced due totriboelectrics to and from the outer conductor.7 As stated intheir paper, this cable from Calmont Wire and Cable comprisesof a single 36 AWG cupronickel wire for the inner conductor
Reuse of AIP Publishing content is subject to the terms at: https://publishing.aip.org/authors/rights-and-permissions. Download to IP: 130.102.42.98 On: Thu, 06 Oct
2016 02:56:21
073905-8 Kalra et al. Rev. Sci. Instrum. 87, 073905 (2016)
FIG. 7. (a) Schematics of the current measurement setup with the Nortonequivalent of the noise source shown. (b) Schematics of the setup for applyingDC and AC voltages to a gate electrode with the Thevenin equivalent of thenoise source shown.
and braided cupronickel for the outer conductor. The dielectricis FEP with graphite coating on the outside. This cable did notcome with an outer jacket. To further validate our hypothesisthat the jacket helps to reduce triboelectric effects, we madea jacket for the cable using 1.5/0.5 mm heat-shrink tubingfrom HellermannTyton. Schematics of the resulting cable isshown in the third column of Figure 6. The current noisemeasured is the best so far. The RMS current is 22 pA andthe peak amplitude during the chirps of the pulse tube is lessthan 200 pA. Note that the heat-shrink that was available to usbecomes brittle at low temperatures. Although we do not knowthe degree to which it thermally contracts before becomingbrittle, a Teflon jacket made by the cable manufacturer shouldimprove the noise performance of the cable further.
We then test an identical cable without the heat-shrinkjacket, shown in the last column of Figure 6. The magnitude ofthe noise is significantly increased, as expected, with an RMScurrent of 100 pA. However, the time trace looks quite differentcompared to the other cables tested. The amplitude spectrumreveals that the dominant noise is actually close to 20 kHz, asopposed to the usual peaks in the 5–10 kHz range. Surprisingly,the amplitudes of the peaks in the 5–10 kHz range for thejacketed and unjacketed graphite-coated cables are similar.A spectrogram of the current trace of the unjacketed cable(data not shown) reveals that the noise around 20 kHz doesnot appear in peaks, but as a smear, similar to the spectro-gram shown in Figure 3(a) for the semi-rigid UT85 cupro-nickel cable. The same pattern is observed in comparing thevoltage spectra of the jacketed and unjacketed cables. Whilethe voltage traces look similar and both have RMS values of13 µV, the noise near 20 kHz can be seen appearing above thenoise floor for the unjacketed cable. We do not understand whythe jacketing of the graphite cable reduces this 20 kHz noise,but does not affect the 5–10 kHz peaks.
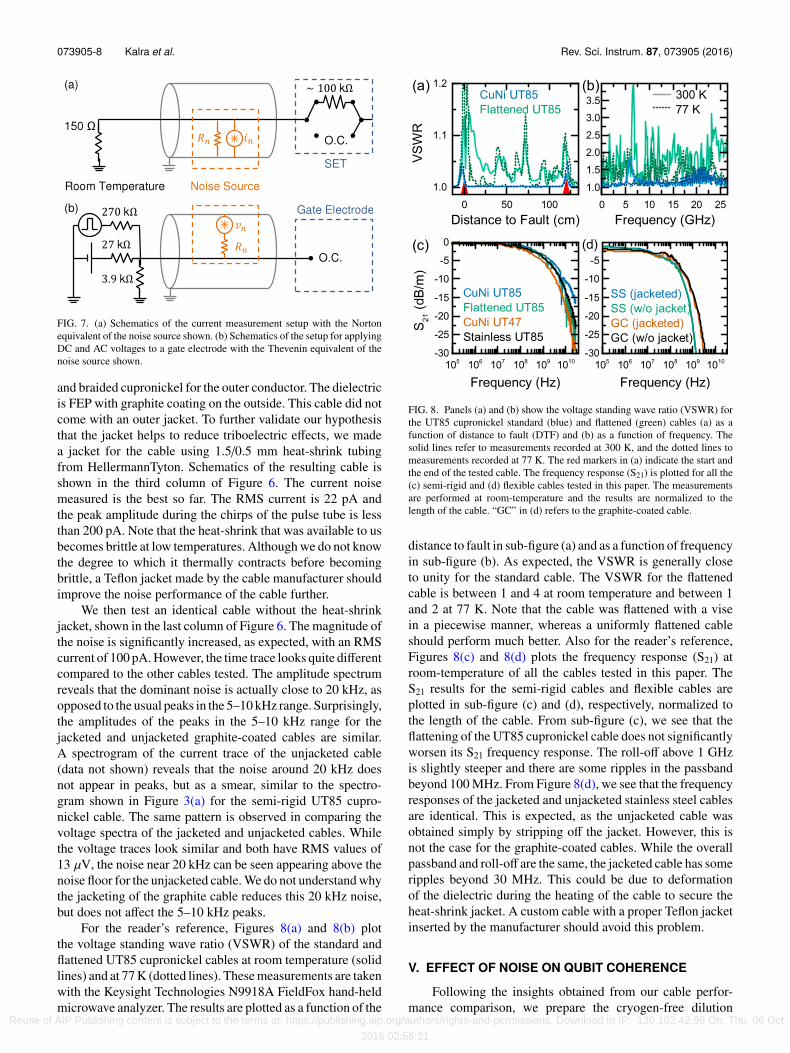
For the reader’s reference, Figures 8(a) and 8(b) plotthe voltage standing wave ratio (VSWR) of the standard andflattened UT85 cupronickel cables at room temperature (solidlines) and at 77 K (dotted lines). These measurements are takenwith the Keysight Technologies N9918A FieldFox hand-heldmicrowave analyzer. The results are plotted as a function of the
FIG. 8. Panels (a) and (b) show the voltage standing wave ratio (VSWR) forthe UT85 cupronickel standard (blue) and flattened (green) cables (a) as afunction of distance to fault (DTF) and (b) as a function of frequency. Thesolid lines refer to measurements recorded at 300 K, and the dotted lines tomeasurements recorded at 77 K. The red markers in (a) indicate the start andthe end of the tested cable. The frequency response (S21) is plotted for all the(c) semi-rigid and (d) flexible cables tested in this paper. The measurementsare performed at room-temperature and the results are normalized to thelength of the cable. “GC” in (d) refers to the graphite-coated cable.
distance to fault in sub-figure (a) and as a function of frequencyin sub-figure (b). As expected, the VSWR is generally closeto unity for the standard cable. The VSWR for the flattenedcable is between 1 and 4 at room temperature and between 1and 2 at 77 K. Note that the cable was flattened with a visein a piecewise manner, whereas a uniformly flattened cableshould perform much better. Also for the reader’s reference,Figures 8(c) and 8(d) plots the frequency response (S21) atroom-temperature of all the cables tested in this paper. TheS21 results for the semi-rigid cables and flexible cables areplotted in sub-figure (c) and (d), respectively, normalized tothe length of the cable. From sub-figure (c), we see that theflattening of the UT85 cupronickel cable does not significantlyworsen its S21 frequency response. The roll-off above 1 GHzis slightly steeper and there are some ripples in the passbandbeyond 100 MHz. From Figure 8(d), we see that the frequencyresponses of the jacketed and unjacketed stainless steel cablesare identical. This is expected, as the unjacketed cable wasobtained simply by stripping off the jacket. However, this isnot the case for the graphite-coated cables. While the overallpassband and roll-off are the same, the jacketed cable has someripples beyond 30 MHz. This could be due to deformationof the dielectric during the heating of the cable to secure theheat-shrink jacket. A custom cable with a proper Teflon jacketinserted by the manufacturer should avoid this problem.
V. EFFECT OF NOISE ON QUBIT COHERENCE
Following the insights obtained from our cable perfor-mance comparison, we prepare the cryogen-free dilution
Reuse of AIP Publishing content is subject to the terms at: https://publishing.aip.org/authors/rights-and-permissions. Download to IP: 130.102.42.98 On: Thu, 06 Oct
2016 02:56:21

073905-9 Kalra et al. Rev. Sci. Instrum. 87, 073905 (2016)
refrigerator for measurement of a well-characterized spin qubitdevice. The purpose of this is to determine whether or not thenew setup allows for successful measurement of the device,given our efforts in mitigating pulse tube noise. We thenperform coherence measurements to measure the effect of thisnoise on the electron spin qubit.
We use the device labeled “Device B” in Ref. 11, whichwas previously measured in an Oxford Kelvinox 100 wetdilution refrigerator, in order to perform a direct comparisonbetween the two different dilution refrigerator setups. Thequbit is the electron spin of a single 31P donor in isotopicallypurified 28Si.
Operation of this device requires four different typesof lines: (1) low-frequency lines, which maintain a constantvoltage over the period of an experiment; (2) pulsing lines,which need to be pulsed at frequencies on the order of∼1 MHz;(3) source-drain lines, which are used to detect current pulseson the order of ∼100 kHz; and (4) a broadband line, used tosend 10 MHz–50 GHz excitations to perform spin resonanceon the phosphorus atom. The low-frequency lines consistof constantan twisted-pair “loom” wire running from roomtemperature to the mixing chamber plate, where they gothrough a filter box similar to the one described in Sec-tion II, but with a 100 Hz second-order RC low pass fil-ter replacing the 80 MHz filter. For the pulsing lines andsource-drain lines, we use flattened semi-rigid UT85 cupro-nickel cables and jacketed graphite-coated cables, respec-tively. We do not use graphite cables for the pulsing lines dueto lack of cable at the time of the experiment. The broadbandline consists of a UT85 silver plated cupronickel coaxialcable (219/50-SCN-CN from COAX CO) running from roomtemperature to the device enclosure. Thermalization of thisline is achieved via a 10 dB attenuator at the 4 K plate anda 3 dB attenuator at the mixing chamber plate. The linealso contains a double DC block at room temperature andan inner-only DC block at the mixing chamber, both withnominal cutoff frequencies of 10 MHz. While this cablewill exhibit a significant degree of triboelectric noise (Sec-tion III), we currently do not have an alternative solutioncapable of delivering the ∼40 GHz signals required for qubitcontrol.
As expected, the modified setup with low-noise cablesallows us to successfully tune and measure the device in theBlueFors BF-LD400 dry fridge, without noticeably affectingthe measurement fidelity of the qubit. We then proceed toqubit coherence measurements, which allow probing of theenvironmental noise that causes dephasing of the electron spin.By measuring its coherence times (T2) using carefully designeddynamical decoupling sequences, we can extract the powerspectral density of the noise affecting the qubit, across thefrequency range relevant to the qubit operation and coherencetimes.14 This noise spectrum has been previously measuredin this device inside the Oxford Kelvinox 100 wet dilutionrefrigerator.11 We choose the parameters of the noise spectros-copy pulse sequences to map the noise spectrum over the range1–25 kHz, which coincides with the bandwidth over which wehave been studying the pulse tube noise.
Figure 9(a) plots the measured noise spectral density as afunction of frequency in this setup (blue circles). The figure
FIG. 9. Coherence measurements of an electron spin qubit in differentdilution refrigerator setups. In both panels, diamonds correspond to mea-surements taken inside an Oxford Kelvinox 100 liquid He bath dilutionrefrigerator, while circles correspond to measurements taken in a BlueForsLD400 cryogen-free dilution refrigerator. (a) Noise spectral density of thequbit, extracted from dynamical decoupling coherence time measurements.(b) Hahn echo coherence time measurements. The two dry fridge measure-ments correspond to normal operation (blue) and dilution unit operatingwhile the pulse tube is switched off (red). The time over which the pulsetube was switched off to obtain the latter measurement was ∼1 min.
also reproduces the data from the wet fridge measurementsfrom Ref. 11 for comparison (grey diamonds). We first notean increased level of lower-frequency noise around 1 kHz inthe dry fridge setup as compared to the wet fridge setup. Thislower-frequency f −α-type noise was attributed to movementof the spin inside the inhomogeneous field of the supercon-ducting magnet in Ref. 11, which suggests that the dry fridgesetup suffers from a greater magnitude of these vibrations. Sec-ond, the dry fridge measurements clearly show the signatureof the pulse tube vibrations studied in the first half of thiswork. We see a greater level of noise in the 5–10 kHz region,coinciding with the peaks observed in the characterizationpresented earlier. As the spectral resolution of our spectros-copy technique is limited, the sharp peaks presented in earliersections appear here as a broad peak centered at 8 kHz. Thisis a first indication that the pulse tube vibrations are couplinginto the resonance frequency of the electron spin qubit. This isconfirmed by a second experiment consisting of a quick Hahnecho T2 measurement,15 taken with the pulse tube temporarilyswitched off, without interrupting the operation of the dilutionunit. Figure 9(b) shows the echo decay traces with coherencetimes of T2 = 1.7(3) ms and T2 = 0.61(2) ms for the pulse tubebeing off and on, respectively. Therefore, we conclude thatnoise induced by the pulse tube reduces the Hahn echo T2 bya factor ∼3. For comparison, the Hahn echo coherence timemeasured in the Oxford Kelvinox 100 wet dilution refrigeratorwas T2 = 1.23(6) ms.
There are three possible mechanisms through which thevibrations caused by the pulse tube can couple to the resonancefrequency of the qubit, thus limiting its coherence. The firstis based on the fact that vibrations from the pulse tube createlarge current noise on the coaxial cable used for the broadband
Reuse of AIP Publishing content is subject to the terms at: https://publishing.aip.org/authors/rights-and-permissions. Download to IP: 130.102.42.98 On: Thu, 06 Oct
2016 02:56:21

073905-10 Kalra et al. Rev. Sci. Instrum. 87, 073905 (2016)
line via the triboelectric effect. The current noise created inthe section of the cable above the mixing chamber plate willbe attenuated by the 3 dB attenuator and the inner-only DCblock at that plate before reaching the device. The attenuationof the ∼10 kHz noise of the pulse tube achieved by the DCblock at base temperature is of order 80 dB. However, anothersection of cable connects the bottom of the mixing chamberplate to the transmission line on the device, designed to deliverthe ∼40 GHz signals to the spin qubit. From the perspective ofthe current noise created in this portion of the cable, the lowestimpedance shunting the majority of the current is exactly theshort-circuit microwave antenna adjacent to the qubit. There-fore, the vibrations of the pulse tube couple into the magneticfield experienced by the spin qubit via the creation of cur-rent noise that then flows through the antenna. Ideally, thiswould not have an effect on the coherence of the qubit as themagnetic field created would be exactly perpendicular to thequantization axis set by the large externally applied magneticfield. However, due to constraints in device design, a smallfraction (∼1/30) of the amplitude of the field created by theantenna is actually parallel to the quantization axis and cantherefore contribute to dephasing. Using this ratio, we canestimate the noise power experienced by the qubit. Based onFigure 3, the average power spectral density of the currentnoise in the 5–10 kHz range is of order 10−1 nA2/Hz. The re-sulting magnetic field noise at the site of the qubit is estimatedby approximating the short-circuit antenna as an infinitelylong wire 100 nm away from the donor. Using the electron’sgyromagnetic ratio (28 GHz/T), this is converted to noiseexperienced by the qubit with magnitude ∼10 (rad/s)2/Hz.This value is comparable to the observed noise power in the5–10 kHz range (Figure 9(a)), indicating that this mechanismmay have had a significant contribution. In future experiments,an additional DC block and attenuator should be inserteddirectly at the device enclosure to filter pulse tube noise createdfrom all sections of the cable. Additionally, the sample shouldbe reoriented to eliminate the component of the field producedby the antenna that is parallel to the quantization axis.
Another mechanism that could contribute to couplingvibrations to magnetic noise is via the displacement of thedevice in an inhomogeneous magnetic field. Despite our bestefforts, the exact location of the phosphorus atom might not beexactly in the center of the field, causing it to reside in a regionwhere a nonzero magnetic field gradient exists. Mechanicalvibrations, of either the magnet or the cold finger to whichthe device is attached, would thus directly result in magneticfield noise experienced by the qubit. For a qubit located within∼100 µm of the center of the field, we calculate a maximumfield gradient of ∼5 mT/m (for B0 = 1.55 T) by performingBiot–Savart simulations of the superconducting solenoid. Inthis field gradient, displacements on the order of ∼30 µmwould be sufficient to cause the experimentally observedqubit linewidth of 4 kHz (obtained from the measured freeinduction decay T∗2 = 80 µs with the pulse tube on, data notshown). A similar investigation was carried out by Brittonet al., where the same ESR-based spectroscopy technique wasused with ∼300 9Be+ ions in a Penning trap to probe the noiseresulting from mechanical vibrations (up to 1 kHz) within ahomogeneous magnetic field.16
The third and final possible mechanism for couplingvibrational noise to the qubit coherence is through the crea-tion of voltage noise via triboelectric effects on the cablesconnected to gate electrodes. This voltage noise would bepassed on to the gates thus creating electric field noise at theposition of the qubit. As our electron spin qubit is confinedby a 31P donor, the resonant frequency of the qubit wouldthen be affected via Stark shift of the hyperfine interactionand of the electron’s g-factor.13 As discussed in Section IV,the voltage dividers used at the room-temperature side ofthe pulsing lines and source-drain lines significantly reducethe amount of voltage noise created at the cable which reachesthe device electrodes. From the effective impedance of the“noise source” for the cables used in this setup, we find thatvoltage noise would be attenuated by at least a factor of 100.Therefore we expect gate noise in our device to be on the orderof 100 nV. From the results of an experiment presented inRef. 11, we find that a gate noise >100 µV is needed in orderto observe a similar amplitude of the noise spectral densityas observed in our experiment. This evidence suggests that themore probable mechanisms coupling vibrations from the pulsetube to our qubit is through displacements of the qubits withrespect to the applied magnetic field and current noise fromthe broadband line created by triboelectric effects.
It is interesting to note that the Hahn echo T2 with thepulse tube switched off (Figure 9(b), red circles), is 40% longerthan previously measured in the wet fridge (gray diamonds).This could be due to additional filtering of low-frequencythermal radiation on the broadband line achieved by the DCblock at the mixing chamber plate, which was not present inthe measurements of Ref. 11. The Hahn echo measurementsgive encouraging signs that our efforts will lead to betterqubit performance, once the effects of the pulse tube noise aremitigated further.
As a final experiment we test whether or not the electronspin coherence time can be improved by running the Hahnecho experiments synchronized to the chirps of the pulse tube(see Figure 10). This is inspired by experiments with atomsin ion traps that are synchronized to the 50 Hz cycle of thepower line.17 Of course, this does not work for experimentswith duration approaching the period of the pulse tube chirps.The coherence time of the electron spin qubit has been shownto approach 1 s with dynamical decoupling.11 Nonetheless, outof interest, we test the effect of synchronization with Hahnecho measurements (≪10 ms).
As a proof of principle test, we run the measurementwithout synchronization and then post-process the data basedon the PT noise superimposed on the measurement signal (graytrace in Figure 10) to obtainTdelay, the delay between the start ofthe experiment and the most recent PT noise peak. Hahn echoexperiments are run with 12000 shots per wait time τ to obtaina sufficient number of samples over the range of Tdelay. The dataare post-processed so that Tdelay is found for each shot. Thisallows us to bin the decay data into 50 time bins covering thewhole PT cycle. On average, this leaves us with 240 shots perτ and per Tdelay, and we have thus created a set of 50 Hahn echodecays for different times after the peak of the PT chirp. Wefit the set of Hahn echo decays using global variables for thecontrast, offset and exponent of the exponential decay, leaving
Reuse of AIP Publishing content is subject to the terms at: https://publishing.aip.org/authors/rights-and-permissions. Download to IP: 130.102.42.98 On: Thu, 06 Oct
2016 02:56:21

073905-11 Kalra et al. Rev. Sci. Instrum. 87, 073905 (2016)
FIG. 10. Hahn echo coherence time of an electron spin qubit in a BlueForsLD400 cryogen-free dilution refrigerator as a function of time after thepulse tube chirp, Tdelay. The black circles correspond to T2 obtained fromcorrelating Hahn echo data to the phase of the pulse tube noise. The graycurve in the background is the corresponding SET readout trace referencingthe data to the current noise.
T2 as the only independent parameter. The T2 values are plottedin Figure 10 as black circles. The error bar corresponds to thefitting error.
The Hahn echo T2 clearly displays oscillations as a func-tion of Tdelay, ranging between 0.38 ms and 0.60 ms. Note thatthe maximum is still well below the Hahn echo T2 measuredwhen the PT was turned off (Figure 9(b)). This is not surprisinggiven that some level of vibrations persists through the entire0.7 s period of the pulse tube cycle (Figure 3). The T2 dataexhibit two clear local minima within a single period, corre-sponding to the rotary valve connecting the PT to the high andlow pressure helium gas lines from the compressor. Recall thatthis results in helium flowing in and out of the PT, as indicatedby the red and blue regions in Figure 10. One interestingobservation is that the minimum T2 time does not coincide withthe maximum current noise in the cables. This phase delaymay help in determining which of the proposed mechanisms isresponsible for coupling the pulse tube noise to the dephasingof the qubit. If we assume that the noise in the semi-rigid cableconnected to the antenna and the noise in the flexible cableused for the readout signal are created simultaneously, then theobserved delay rules out the conjecture that dephasing is due tocurrent-noise in the antenna. This then supports the conjecturethat dephasing is due to movement of the sample inside theinhomogeneous magnetic field, where the delay may comefrom the inertia of the cold-finger or the solenoid.
VI. CONCLUSION
To conclude, we measure electrical noise in our cablesthat is caused by vibrations originating from the pulse tubecooler. We observe the same spectral comb of peaks in both theelectrical signal and in an audio recording of the chirping of thepulse tube. The magnitude of the noise is strongly temperaturedependent. We believe that triboelectric effects are the mech-anism through which the vibrations couple to the electricalsignal. This is consistent with the temperature dependence ofthe noise amplitude given our model of the cable dielectricundergoing the greatest thermal contraction, leaving room forit to slide against the outer conductor. Flattening a semi-rigidcable or jacketing a flexible cable to reduce movement of thecable dielectric and inner conductor successfully and consis-
tently reduces the pulse tube noise by over an order of magni-tude. The two jacketed flexible cables tested perform compa-rably in terms of both voltage and current noise, both with asignificant improvement from the standard semi-rigid cable.While this improvement is sufficient for our purposes, recentwork by Mykkänen et al.18 shows the use of vacuum-insulatedcables to efficiently suppress vibration-induced noise.
Aside from introducing current and voltage noise in themeasurement and control lines, the pulse tube vibrations alsotranslate into noise that contributes to the decoherence of thespin qubit. Noise spectroscopy measurements on the qubitshow a noise spectrum that is qualitatively similar to the pulsetube noise spectrum. It is most likely that this coupling occursvia a combination of mechanical vibrations of the magnet orcold finger and current noise from the broadband line createdby triboelectric effects. Future work to address the first issueincludes improving the rigidity of the cold finger and furthervibrational damping and decoupling. Alternatively, it may bepossible to use strong permanent magnets that are bolted tothe sample enclosure to replace the superconducting magnet.The second issue can be significantly mitigated by adding aDC block on the broadband line at the device enclosure andby reorienting the sample with respect to the externally appliedmagnetic field.
ACKNOWLEDGMENTS
We thank David Goldhaber-Gordon for the sample of thegraphite-coated cable, Matthew Stead from Resonate Acous-tics for the use of the accelerometer, Timothy Duty for the useof the linear micro-stepper driver, Rob Blaauwgeers, LievenVandersypen, and Alexander Hamilton for insightful discus-sions, and David Barber and Rodrigo Ormeno Cortes for tech-nical assistance. We also acknowledge the team involved inthe fabrication of the qubit device: Fay E. Hudson, Kohei M.Itoh, David N. Jamieson, Jeffrey C. McCallum, and Andrew S.Dzurak. This research was funded by the Australian ResearchCouncil Centre of Excellence for Quantum Computation andCommunication Technology (Project No. CE110001027) andthe US Army Research Office (No. W911NF-13-1-0024).
1T. Tomaru, T. Suzuki, T. Haruyama, T. Shintomi, A. Yamamoto, T. Koyama,and R. Li, “Vibration analysis of cryocoolers,” Cryogenics 44(5), 309–317(2004).
2S. Riabzev, A. Veprik, H. Vilenchik, and N. Pundak, “Vibration generationin a pulse tube refrigerator,” Cryogenics 49(1), 1–6 (2009).
3S. Baer, “Transport spectroscopy of confined fractional quantum Hall sys-tems,” Ph.D. thesis, ETH Zurich, 2014.
4Y. Tian, H. Yu, H. Deng, G. Xue, D. Liu, Y. Ren, G. Chen, D. Zheng, X. Jing,L. Lu et al., “A cryogen-free dilution refrigerator based Josephson qubitmeasurement system,” Rev. Sci. Instrum. 83(3), 033907 (2012).
5M. Pelliccione, A. Sciambi, J. Bartel, A. J. Keller, and D. Goldhaber-Gordon, “Design of a scanning gate microscope for mesoscopic electronsystems in a cryogen-free dilution refrigerator,” Rev. Sci. Instrum. 84(3),033703 (2013).
6A. den Haan, G. Wijts, F. Galli, O. Usenko, G. van Baarle, D. van der Zalm,and T. Oosterkamp, “Atomic resolution scanning tunneling microscopy ina cryogen free dilution refrigerator at 15 mK,” Rev. Sci. Instrum. 85(3),035112 (2014).
7P. Ong, “Supersensitive electrical measurements and their associated tech-niques,” Eur. J. Phys. 8(4), 280 (1987).
8A. Morello, J. J. Pla, F. A. Zwanenburg, K. W. Chan, K. Y. Tan, H. Huebl,M. Möttönen, C. D. Nugroho, C. Yang, J. A. van Donkelaar, A. D. C.
Reuse of AIP Publishing content is subject to the terms at: https://publishing.aip.org/authors/rights-and-permissions. Download to IP: 130.102.42.98 On: Thu, 06 Oct
2016 02:56:21

073905-12 Kalra et al. Rev. Sci. Instrum. 87, 073905 (2016)
Alves, D. N. Jamieson, C. C. Escott, L. C. L. Hollenberg, R. G. Clark, andA. S. Dzurak, “Single-shot readout of an electron spin in silicon,” Nature(London) 467, 687–691 (2010).
9J. J. Pla, K. Y. Tan, J. P. Dehollain, W. H. Lim, J. J. L. Morton, D. N.Jamieson, A. S. Dzurak, and A. Morello, “A single-atom electron spin qubitin silicon,” Nature (London) 489, 541–545 (2012).
10J. J. Pla, K. Y. Tan, J. P. Dehollain, W. H. Lim, J. J. L. Morton, F. A.Zwanenburg, D. N. Jamieson, A. S. Dzurak, and A. Morello, “High-fidelityreadout and control of a nuclear spin qubit in silicon,” Nature (London) 496,334–338 (2013).
11J. T. Muhonen, J. P. Dehollain, A. Laucht, F. E. Hudson, R. Kalra, T.Sekiguchi, K. M. Itoh, D. N. Jamieson, J. C. McCallum, A. S. Dzurak et al.,“Storing quantum information for 30 s in a nanoelectronic device,” Nat.Nanotechnol. 9(12), 986–991 (2014).
12S. Angus, A. Ferguson, A. Dzurak, and R. Clark, “A silicon radio-frequency single electron transistor,” Appl. Phys. Lett. 92(11), 112103(2008).
13A. Laucht, J. T. Muhonen, F. A. Mohiyaddin, R. Kalra, J. P. Dehollain, S.Freer, F. E. Hudson, M. Veldhorst, R. Rahman, G. Klimeck et al., “Electri-cally controlling single-spin qubits in a continuous microwave field,” Sci.Adv. 1, e1500022 (2015).
14G. A. Álvarez and D. Suter, “Measuring the spectrum of colored noise bydynamical decoupling,” Phys. Rev. Lett. 107(23), 230501 (2011).
15E. Hahn, “Spin echoes,” Phys. Rev. 80, 580–594 (1950).16J. W. Britton, J. G. Bohnet, B. C. Sawyer, H. Uys, M. J. Biercuk, and
J. J. Bollinger, “Vibration-induced field fluctuations in a superconductingmagnet,” Phys. Rev. A 93, 062511 (2016).
17C. Roos, T. Zeiger, H. Rohde, H. C. Nägerl, J. Eschner, D. Leibfried, F.Schmidt-Kaler, and R. Blatt, “Quantum state engineering on an opticaltransition and decoherence in a Paul trap,” Phys. Rev. Lett. 83, 4713–4716(1999).
18E. Mykkänen, J. Lehtinen, A. Kemppinen, C. Krause, D. Drung, J. Nissilä,and A. Manninen, “Reducing current noise in cryogenic experiments byvacuum-insulated cables,” e-print arXiv:1604.03903 (2016).
Reuse of AIP Publishing content is subject to the terms at: https://publishing.aip.org/authors/rights-and-permissions. Download to IP: 130.102.42.98 On: Thu, 06 Oct
2016 02:56:21