VIBRATION ANALYSIS OF INFLATED TORUS STRUCTURE … · ISSS National Conference on MEMS Smart...
6
ISSS National Conference on MEMS Smart Materials, Structures and Systems September 28-30, 2016, IIT Kanpur, Kanpur, India VIBRATION ANALYSIS OF INFLATED TORUS STRUCTURE USING FREQUENCY RESPONSE TRANSMISSIBILITY Arun Kumar Sharma, Bishakh Bhattacharya and A. C. Mathur* Department of Mechanical Engineering, IIT Kanpur, India *Space Applications Centre - ISRO, Ahmedabad, India e-mail: [email protected] Abstract In the present work, transmissibility based vibration study of an inflated torus structure has been attempted to study the effect of internal pressure. Experiment has been performed using Macro fiber composites (MFC) as an actuator and Laser Doppler Vibrometer (LDV) as a sensor to study the transmissibility of torus. Keywords: Inflated Torus Structure; MFC; LDV; Transmissibility 1. Introduction With the advancement in satellite technology, there has been a parallel increase in the mass and size of satellite antenna. Thus, it seems an arduous task to launch the satellites with large and heavy antennas with current rocket technology. The inflated structures being light weight, possessing high strength-to-mass ratio as well as high packing efficiency is an emerging area in the field of light weight structures for space applications. The torus shaped inflated structure acts as a support for the antenna and hence the efficiency of communication system depends largely on the performance of torus. Anticipating the criticality of this problem NASA started exploring the pertinence of inflatable structures to satellite technology and launched first inflatable communication satellite ECHO-I in 1960 and ECHO-II 1964. Apart from communication satellites, NASA also launched the EXPLORER and PAGEOS series of climate research satellites ( Cassapakis & Thomas, 1995) and explored the applicability inflatable flexible composites structures for space suits, habitats, transfer vehicles and depots for the Moon and Mars mission (Cassapakis, Love, & Palisoc, 1998). Figure 1. Torus antenna In a typical communication satellite, reflector lens is supported by an inflated torus structure which is connected to the main satellite body with inflatable struts as shown in Figure 1. Torus because of its dual curvature is selected as the main supporting structure (E. J. Ruggiero, 2003), is susceptible to shock and harmonic vibrations and prone to damage due to its low structural stiffness. This makes its damage detection and system identification a vital issue. Vibration behavior of the torus has been studied by several researchers. (Liepins, 1965) has performed free vibration study using Finite difference method and reported that the pre-stress due to internal pressure has an effect on lower fundamental frequencies only. (Jha, Inman, & Plaut, 2002) have analyzed free vibration behavior of a pre-stressed inflated torus membrane using Sander’s theory. (Park, Ruggiero, & Inman, 2002) and (Sodano, Park, & Inman, 2004) carried out experimental investigations on torus structure and demonstrated the feasibility of smart materials such as Polyvinylidene fluoride (PVDF) and macro-fiber composites (MFC) as sensors and actuators for modal testing. 2. Experimental Configuration The test structure is a synthetic rubber torus of ring diameter 0.84 m, tube diameter 0.26 m and thickness 3 mm suspended as shown in Figure 2. Suspensions just give support to the structure and do not restrict any operational degree of freedom. Internal pressure of torus is varied between 5 to 9 kPa. Total weight of the torus system inflated at 9.5 kPa is 4 kg.
Transcript of VIBRATION ANALYSIS OF INFLATED TORUS STRUCTURE … · ISSS National Conference on MEMS Smart...

ISSS National Conference on MEMS Smart Materials, Structures and Systems
September 28-30, 2016, IIT Kanpur, Kanpur, India
VIBRATION ANALYSIS OF INFLATED TORUS STRUCTURE USING
FREQUENCY RESPONSE TRANSMISSIBILITY
Arun Kumar Sharma, Bishakh Bhattacharya and A. C. Mathur*
Department of Mechanical Engineering, IIT Kanpur, India
*Space Applications Centre - ISRO, Ahmedabad, India
e-mail: [email protected]
Abstract
In the present work, transmissibility based vibration study of an inflated torus structure has been attempted to study the effect of
internal pressure. Experiment has been performed using Macro fiber composites (MFC) as an actuator and Laser Doppler
Vibrometer (LDV) as a sensor to study the transmissibility of torus.
Keywords: Inflated Torus Structure; MFC; LDV; Transmissibility
1. Introduction
With the advancement in satellite technology, there has been a parallel increase in the mass and size of satellite antenna.
Thus, it seems an arduous task to launch the satellites with large and heavy antennas with current rocket technology. The inflated
structures being light weight, possessing high strength-to-mass ratio as well as high packing efficiency is an emerging area in
the field of light weight structures for space applications. The torus shaped inflated structure acts as a support for the antenna
and hence the efficiency of communication system depends largely on the performance of torus. Anticipating the criticality of
this problem NASA started exploring the pertinence of inflatable structures to satellite technology and launched first inflatable
communication satellite ECHO-I in 1960 and ECHO-II 1964. Apart from communication satellites, NASA also launched the
EXPLORER and PAGEOS series of climate research satellites ( Cassapakis & Thomas, 1995) and explored the applicability
inflatable flexible composites structures for space suits, habitats, transfer vehicles and depots for the Moon and Mars mission
(Cassapakis, Love, & Palisoc, 1998).
Figure 1. Torus antenna
In a typical communication satellite, reflector lens is supported by an inflated torus structure which is connected to the main
satellite body with inflatable struts as shown in Figure 1. Torus because of its dual curvature is selected as the main supporting
structure (E. J. Ruggiero, 2003), is susceptible to shock and harmonic vibrations and prone to damage due to its low structural
stiffness. This makes its damage detection and system identification a vital issue.
Vibration behavior of the torus has been studied by several researchers. (Liepins, 1965) has performed free vibration study using
Finite difference method and reported that the pre-stress due to internal pressure has an effect on lower fundamental frequencies
only. (Jha, Inman, & Plaut, 2002) have analyzed free vibration behavior of a pre-stressed inflated torus membrane using Sander’s
theory. (Park, Ruggiero, & Inman, 2002) and (Sodano, Park, & Inman, 2004) carried out experimental investigations on torus
structure and demonstrated the feasibility of smart materials such as Polyvinylidene fluoride (PVDF) and macro-fiber composites
(MFC) as sensors and actuators for modal testing.
2. Experimental Configuration
The test structure is a synthetic rubber torus of ring diameter 0.84 m, tube diameter 0.26 m and thickness 3 mm suspended
as shown in Figure 2. Suspensions just give support to the structure and do not restrict any operational degree of freedom. Internal
pressure of torus is varied between 5 to 9 kPa. Total weight of the torus system inflated at 9.5 kPa is 4 kg.

ISSS National Conference on MEMS Smart Materials, Structures and Systems
September 28-30, 2016, IIT Kanpur, Kanpur, India
Figure 2. Torus
Excitation
The structure is excited with the help of Macro Fiber Composite (MFC) developed at NASA’s Langley Research Center in 1996,
commercially available through Smart Material Corp. It consists of rectangular piezo ceramic rods sandwiched between layers
of adhesive, electrodes and polyimide film as shown in Figure 3.
Table 1. MFC Specifications
Figure 3. Macro Fiber Composite
Sensing
Displacement at various points are measured with the Laser Doppler Vibrometer as shown in Figure 4, which is a non-contact
vibration measurement device and works on the principle of Doppler effect and interferometry for vibration measurement. It
senses the frequency shift of light scattered back from a moving surface.
Table 2. LDV Specifications
Figure 4. Laser Doppler Vibrometer
Actuator - MFC (Type M8557P1)
Active area 85 x 57 mm2
Volume density 5.44 g/cm3
Piezo ceramic rod
(Rectangular)
180 μm thickness
350 μm fiber width
d33 effect
Blocking force 923 N
Free strain 1800 ppm
Operating Voltage -500 V to 1500 V
Temperature -40 oC to +85 oC
3-D Laser Doppler Vibrometer
Make: Polytec GmbH
Type: He-Ne Laser (λ = 633 nm)
Minimum Detectable Vibration speed = 5 μm/s
Maximum Detectable Vibration speed = 50 m/s at 1 Hz resolution
Bandwidth = 30 MHz
Operating distance = 0.5 – 50 m
ISSS National Conference on MEMS Smart Materials, Structures and Systems
September 28-30, 2016, IIT Kanpur, Kanpur, India
Experimental Procedure
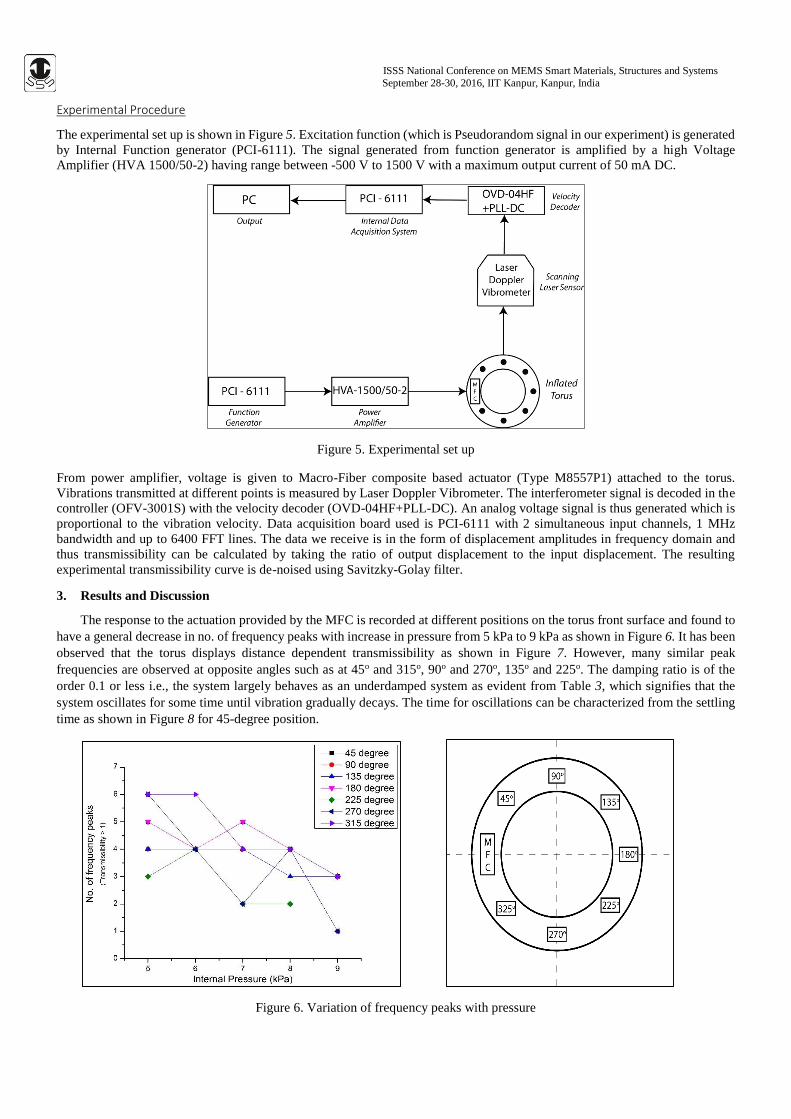
The experimental set up is shown in Figure 5. Excitation function (which is Pseudorandom signal in our experiment) is generated
by Internal Function generator (PCI-6111). The signal generated from function generator is amplified by a high Voltage
Amplifier (HVA 1500/50-2) having range between -500 V to 1500 V with a maximum output current of 50 mA DC.
Figure 5. Experimental set up
From power amplifier, voltage is given to Macro-Fiber composite based actuator (Type M8557P1) attached to the torus.
Vibrations transmitted at different points is measured by Laser Doppler Vibrometer. The interferometer signal is decoded in the
controller (OFV-3001S) with the velocity decoder (OVD-04HF+PLL-DC). An analog voltage signal is thus generated which is
proportional to the vibration velocity. Data acquisition board used is PCI-6111 with 2 simultaneous input channels, 1 MHz
bandwidth and up to 6400 FFT lines. The data we receive is in the form of displacement amplitudes in frequency domain and
thus transmissibility can be calculated by taking the ratio of output displacement to the input displacement. The resulting
experimental transmissibility curve is de-noised using Savitzky-Golay filter.
3. Results and Discussion
The response to the actuation provided by the MFC is recorded at different positions on the torus front surface and found to
have a general decrease in no. of frequency peaks with increase in pressure from 5 kPa to 9 kPa as shown in Figure 6. It has been
observed that the torus displays distance dependent transmissibility as shown in Figure 7. However, many similar peak
frequencies are observed at opposite angles such as at 45o and 315o, 90o and 270o, 135o and 225o. The damping ratio is of the
order 0.1 or less i.e., the system largely behaves as an underdamped system as evident from Table 3, which signifies that the
system oscillates for some time until vibration gradually decays. The time for oscillations can be characterized from the settling
time as shown in Figure 8 for 45-degree position.
Figure 6. Variation of frequency peaks with pressure

ISSS National Conference on MEMS Smart Materials, Structures and Systems
September 28-30, 2016, IIT Kanpur, Kanpur, India
Figure 7. Effect of measuring position
Table 3. Peak frequencies and Damping ratio

ISSS National Conference on MEMS Smart Materials, Structures and Systems
September 28-30, 2016, IIT Kanpur, Kanpur, India
Figure 8. Settling time (45-degree position)
4. Future Work
The future work in this direction includes the measurement of in-planes modes at the corresponding pressures using MFC as a
sensor also, thus replacing LDV which will be followed by simulating the same on a finite element software and eventually
carrying out similar investigations on the torus of various materials such as Kapton, Kevlar, etc.
Peaks (Hz) Damping ratio Peaks (Hz) Damping ratio Peaks (Hz) Damping ratio Peaks (Hz) Damping ratio Peaks (Hz) Damping ratio
5.2 0.27 10 0.18 4.4 0.37 1.87 0.48 11.5 0.13
10 0.12 71.8 0.018 10.3 0.12 11 0.14 54 0.03
14 0.05 128 0.025 73.7 0.015 78.7 0.015 88.7 0.025
45.2 0.09 152 0.03 136.3 0.016 177 0.02 Nil Nil
64.4 0.02 Nil Nil 164.8 0.018 Nil Nil Nil Nil
4.4 0.22 5.3 0.35 5 0.34 1.9 0.47 11.5 0.14
10.4 0.11 9.7 0.14 10 0.12 11 0.15 Nil Nil
14 0.06 19.4 0.07 19.4 0.07 16 0.07 Nil Nil
64.7 0.02 71.6 0.02 73.8 0.02 78.9 0.02 Nil Nil
6 0.15 10 0.15 6 0.36 1.8 0.48 4.4 0.25
9.7 0.11 15 0.09 11.2 0.15 11 0.15 11.6 0.11
28.3 0.05 18 0.06 18 0.11 79 0.016 56.2 0.05
64.7 0.02 71.7 0.016 74 0.02
4 0.4 11.2 0.15 5.4 0.27 1.8 0.55 4.4 0.25
10.3 0.11 13.7 0.09 10.3 0.15 11 0.15 11.6 0.11
14 0.02 29.4 0.06 30.3 0.08 54.4 0.05 56 0.05
29 0.09 71.8 0.02 51.5 0.07 74.8 0.02 Nil Nil
64.4 0.025 Nil Nil 73.7 0.02 Nil Nil Nil Nil
4.4 0.3 4.4 0.4 4.4 0.45 1.85 0.47 Nil Nil
10.3 0.12 11.2 0.08 74 0.017 79.2 0.016 Nil Nil
64.3 0.02 15 0.098 Nil Nil Nil Nil Nil Nil
Nil Nil 71.5 0.015 Nil Nil Nil Nil Nil Nil
4.4 0.32 2 0.89 10 0.14 2 0.42 11.7 0.15
7 0.04 11.2 0.12 74 0.016 5.3 0.02 Nil Nil
9 0.12 18 0.05 Nil Nil 10 0.24 Nil Nil
14 0.05 74 0.016 Nil Nil 79 0.012 Nil Nil
17.8 0.04 Nil Nil Nil Nil Nil Nil Nil Nil
65.3 0.02 Nil Nil Nil Nil Nil Nil Nil Nil
4.4 0.36 11.2 0.09 5 0.55 2 0.44 13 0.12
10.3 0.11 15 0.08 30 0.07 31.3 0.07 31.8 0.09
14 0.04 18 0.03 52.6 0.15 59.3 0.09 60.6 0.08
28.2 0.08 29.8 0.05 73.8 0.016 78.8 0.016 Nil Nil
44.7 0.07 57.5 0.06 Nil Nil Nil Nil Nil Nil
64.4 0.02 71.8 0.016 Nil Nil Nil Nil Nil Nil
270 degree
315 degree
0 degree
9 kPa
PressureActuator
position
Sensor
location
90 degree
45 degree
5 kPa 6 kPa 7 kPa 8 kPa
135 degree
180 degree
225 degree

ISSS National Conference on MEMS Smart Materials, Structures and Systems
September 28-30, 2016, IIT Kanpur, Kanpur, India
5. Acknowledgement
The authors acknowledge the support of this research from the ISRO Space Technology Cell, Sponsored project
ME/IITK/2014086.
References
1. Cassapakis, C., & Thomas, M. (1995). Inflatable structures technology development overview. AIAA.
2. Cassapakis, C., Love, A., & Palisoc, A. (1998). Inflatable space antennas-a brief overview. IEEE Aerospace Conference
Proceedings (pp. 453-459). IEEE.
3. E. J. Ruggiero, (2003). A literature review of ultra-light and inflated toroidal satellite components. The Shock and
vibration digest, 35, 171-181.
4. Jha, A., Inman, D., & Plaut, R. (2002). Free vibration analysis of an inflated toroidal shell. Journal of Vibration and
Acoustics, 124(3), 387-396.
5. Liepins, A. A. (1965). Free vibrations of prestressed toroidal membrane. AIAA, 3(10), 1924-1933.
6. Park, G., Ruggiero, E., & Inman, D. (2002). Dynamic testing of inflatable structures using smart materials. Smart
Materials and Structures, 11(1), 147-155.
7. Sodano, H., Park, G., & Inman, D. (2004). An investigation into the performance of macro-fiber composites for sensing
and structural vibration applications. Mechanical Systems and Signal Processing, 18(3), 683-697.