
VIBRATION ANALYSIS OF A HAND-HELD PERCUSSION … · among the operators of the power tools, ......
172
VIBRATION ANALYSIS OF A HAND-HELD PERCUSSION TOOL COUPLED WITH THE HAND-ARM SYSTEM Shu Wang A Thesis in The Department of Mechanical and Industrial Engineering Presented in Partial Fulfillment of the Requirements for The Degree of Master of Applied Science at Concordia University Montreal, Quebec, Canada June 2014 © Shu Wang 2014
Transcript of VIBRATION ANALYSIS OF A HAND-HELD PERCUSSION … · among the operators of the power tools, ......

VIBRATION ANALYSIS OF A HAND-HELD PERCUSSION TOOL COUPLED WITH THE HAND-ARM SYSTEM
Shu Wang
A Thesis
in
The Department
of
Mechanical and Industrial Engineering
Presented in Partial Fulfillment of the Requirements for
The Degree of Master of Applied Science at
Concordia University Montreal, Quebec, Canada
June 2014
© Shu Wang 2014

CONCORDIA UNIVERSITY
SCHOOL OF GRADUATE STUDIES This is to certify that the Thesis prepared,
By: Shu Wang
Entitled: “Vibration Analysis of a Hand-Held Percussion Tool Coupled with
the Hand-Arm System”
and submitted in partial fulfillment of the requirements for the Degree of
Master of Applied Science (Mechanical Engineering)
complies with the regulations of this University and meets the accepted standards with respect to originality and quality.
Signed by the Final Examining Committee:
_________________________________________ Chair Dr. M. Paraschivoiu _________________________________________ Examiner Dr. M. Packirisamy _________________________________________ Examiner Dr. A. Bagchi External Building, Civil and Environmental Engineering _________________________________________ Supervisor Dr. S. Rakheja
_________________________________________ Co-Supervisor Dr. P-E. Boileau
Approved by: __________________________________________________ Dr. S. Narayanswamy, MASc Graduate Program Director Department of Mechanical and Industrial Engineering
Date: ______________________
______________________________________ Dr. C. Trueman, Interim Dean Faculty of Engineering & Computer Science
iii
ABSTRACT
VIBRATION ANALYSIS OF A HAND-HELD PERCUSSION TOOL COUPLED WITH THE HAND-ARM SYSTEM
Shu Wang, Master of Applied Science
Concordia University, 2014
Exposure to hand-transmitted vibration (HTV) arising from hand power tools has
long been associated with several disorders of the hand and arm, which are collectively
termed as hand-arm vibration syndrome (HAVS). Owing to high prevalence of HAVS
among the operators of the power tools, particularly the percussive tools, the desire to
develop low vibration tool designs, has been widely recognized. The design of vibration
isolators or assessment of vibration performance of tools necessitates development of
dynamic model of the tool coupled with that of the hand-arm system (HAS) to account
for energy absorption within the HAS.
This dissertation research is aimed at development of dynamic model of a
percussive chipping hammer together with a biomechanical model of the hand-arm
system. The model could serve as an essential tool for identifying effective vibration
attenuation design features. The dynamic model of the tool is formulated considering
identifications of various component contact pairs and the air flows between the primary
piston and the striker. A tool tip-workpiece contact model is integrated to the tool model
to describe the interactions between the tool and an energy dissipator. A biomechanical
model of the hand-arm system is implemented to the tool model to develop a coupled
hand-tool system, which could be applied to determine the hand vibration responses as a

iv
function of the push force. The properties of different impact pairs are identified from the
theory of visco-elastic collision between rigid bodies. The validity of the hand-tool model
is examined on the basis of available measured data under selected levels of the hand
push force. A simple model of an anti-vibration glove is further introduced to study its
effectiveness in limiting the vibration exposure.
The simulation results show that the percussive tool model coupled with the
biomechanical hand-arm model can yield reasonably good trends in view of the hand-
transmitted vibration. The results suggest that the tool vibration transmitted to the hand is
more sensitive to variations in push force and the operating speed. Slight increases in the
diameter of the upper chamber orifices and the weight of the tool body, together with
lower the striker mass, could yield notable reductions in the magnitudes of vibration
transmitted to the hand-arm system. The results further show that the anti-vibration
gloves yield very minimal vibration attenuation.

v
ACKNOWLEDGMENTS
I wish to express my sincere gratitude to my supervisors, Dr. Subhash Rakheja and
Dr. Paul-Emile Boileau, for their guidance, encouragement, supervision and support
during all stages of this research. The contributions and assistance of the Department of
Mechanical and Industrial Engineering at Concordia University are also appreciated and
acknowledged.
Appreciation is also due to my friends, Ning Zhou, Danying Zheng, Tengfei Han,
Yuxiang Li and Yuming Yin, and my colleagues for their assistance during my study.
Finally, I would like to thank my parents, aunt, grandparents and other family
members for their love, patience, understanding and support throughout this research. I
sincerely appreciate everything you all did for me.

vi
CONTENTS
ABSTRACT ....................................................................................................................... iii
ACKNOWLEDGMENTS .................................................................................................. v
CONTENTS ....................................................................................................................... vi
LIST OF FIGURES ............................................................................................................ x
LIST OF TABLES ........................................................................................................... xiv
LIST OF ABBREVIATIONS AND SYMBOLS ............................................................ xvi
CHAPTER 1 LITERATURE REVIEW AND OBJECTIVES ........................................... 1
1.1 General ...................................................................................................................... 1
1.2 Literature Review...................................................................................................... 3
1.2.1 The Hand-Arm Vibration Syndrome (HAVS) ................................................... 3
1.2.2 Hand-Transmitted Vibration (HTV) and Exposure Assessments ...................... 6
1.2.3 HTV Control Strategies ................................................................................... 10
1.2.4 Biodynamic Hand-Arm Models ....................................................................... 16
1.2.5 Hand-Held Power Tools and Modeling of Coupled System ........................... 19
1.3 Scope and Objectives of the Dissertation Research ................................................ 24
1.4 Dissertation Organization ....................................................................................... 25
CHAPTER 2 BIOMECHANICAL MODEL OF THE HAND-ARM SYSTEM WITH
ANTI-VIBRATION GLOVE ........................................................................................... 27
2.1 Introduction ............................................................................................................. 27
2.2 Biomechanical Model of the Hand-Arm System .................................................... 29
2.3 Development of the Biomechanical Model of the Hand-Arm System Coupled with
the Anti-Vibration Glove .............................................................................................. 34
2.4 Parameters of the Bent-Arm Model ........................................................................ 37

vii
2.5 Natural Frequency Analysis .................................................................................... 39
2.6 Static Deflection Analysis....................................................................................... 40
2.7 Biodynamic Responses Analysis ............................................................................ 45
2.7.1 Diving Point Mechanical Impedance Response Analysis ............................... 46
2.7.2 DPMI Responses of the Bent-Arm Model under Two Different Push Forces 47
2.7.3 Vibration Transmissibility Response Analysis ................................................ 49
2.7.4 Vibration Transmissibility Responses of the Bent-Arm Model with and
without the Anti-Vibration Glove under Two Different Push Forces ...................... 51
2.8 Summary ................................................................................................................. 56
CHAPTER 3 DEVELOPMENT OF ANALYTICAL MODELS OF PERCUSSIVE
CHIPPING HAMMER AND WORKPIECE ................................................................... 57
3.1 Introduction ............................................................................................................. 57
3.2 Description of the Percussive Tool ......................................................................... 58
3.3 Development of the Chipping Hammer Model ...................................................... 62
3.3.1 Displacement Coordinates ............................................................................... 62
3.3.2 Piston Displacement......................................................................................... 63
3.3.3 Air Pressure and Density Variations ................................................................ 64
3.3.4 Modeling of Tool Components ........................................................................ 71
3.4 Development of the Tool Tip-Workpiece Contact Model ...................................... 75
3.5 Component Contact Pair Models ............................................................................ 79
3.6 Laboratory Measurements ...................................................................................... 85
3.7 Parameter Identification .......................................................................................... 87
3.7.1 Component Contact Pairs Model Parameter Identification ............................. 91
3.7.2 Validation for the Contact Pairs ....................................................................... 93
3.8 Summary ................................................................................................................. 96

viii
CHAPTER 4 VALIDATION AND ANALYSIS OF INTEGRATED SYSTEM
MODELS .......................................................................................................................... 97
4.1 Introduction ............................................................................................................. 97
4.2 Comparisons of Different Hand-Arm Vibration (HAV) Models Integrated to the
Tool Model.................................................................................................................... 98
4.2.1 Single-DOF HAV Model ............................................................................... 101
4.2.2 Four-DOF HAV Model .................................................................................. 104
4.2.3 Six-DOF Biomechanical HAV Model ........................................................... 105
4.2.4 Discussions .................................................................................................... 107
4.3 Analyses of Interactions among the Impact Pairs ................................................. 110
4.4 Design Parameter Sensitivity Analyses ................................................................ 113
4.4.1 Diameter of the Upper Chamber Orifices ...................................................... 113
4.4.2 Tool Body Weight.......................................................................................... 116
4.4.3 Weights of the Striker, the Impact bolt and the Tool Bit ............................... 120
4.4.4 Discussions .................................................................................................... 121
4.4.5 Anti-Vibration Glove ..................................................................................... 122
4.5 Influences of Tool Operating Factors ................................................................... 125
4.5.1 Static Push Force ............................................................................................ 125
4.5.2 Tool Speed ..................................................................................................... 130
4.5.3 Tool Tip-Workpiece Contact Model .............................................................. 133
4.6 Summary ............................................................................................................... 135
CHAPTER 5 CONCLUSIONS AND RECOMMENDATIONS FOR FUTURE WORK
......................................................................................................................................... 136
5.1 Major Contributions of the Study ......................................................................... 136
5.2 Conclusions ........................................................................................................... 137

ix
5.3 Recommendations for Future Studies ................................................................... 138
REFERENCE .................................................................................................................. 140
APPENDIX ..................................................................................................................... 151

x
LIST OF FIGURES
Figure 1.1 : Coordinate systems for the human hand-arm (ISO 5348, 1998) ..................... 7
Figure 1.2 : Frequency-weighting curve for hand-transmitted vibration (ISO 5349-1, 2001)
........................................................................................................................ 8
Figure 2.1 : (a) Schematic of the hand grasping the tool handle (b) schematic of the bent-
arm model with 90°elbow angle; and (c) experimental set-up (Adewusi,
2009) ............................................................................................................. 31
Figure 2.2 : Schematic of the dynamic hand forces .......................................................... 33
Figure 2.3 : Schematic of the gloved hand-arm model in bent-arm posture ..................... 36
Figure 2.4 : The hand model integrating the glove model ................................................ 36
Figure 2.5 : Schematic of the biomechanical hand arm model under a static force ......... 42
Figure 2.6 : Structure of the biodynamic hand-arm models: (a) single-DOF; and (b) four-
DOF .............................................................................................................. 43
Figure 2.7 : Comparison of 𝑧ℎ-axis DPMI responses of the biomechanical model under
30 N grip force and 50 N push force with mean measured data (Adewusi,
2009) ............................................................................................................. 48
Figure 2.8 : Comparison of 𝑧ℎ-axis DPMI responses of the biomechanical model under
30 N grip force and 75 N push force with mean measured data (Adewusi,
2009) ............................................................................................................. 49
Figure 2.9 : Comparisons of 𝑧ℎ-axis vibration transmissibility responses of the bare and
gloved hand-arm models at the wrist with the mean measured responses of
the bare hand (grip force=30 N, push force=50 N) ...................................... 53
Figure 2.10 : Comparisons of 𝑧ℎ-axis vibration transmissibility responses of the bare and
gloved hand-arm models at the elbow with the mean measured responses of
the bare hand (grip force=30 N, push force=50 N) ...................................... 53
Figure 2.11 : Comparisons of 𝑧ℎ-axis vibration transmissibility responses of the bare and
gloved hand-arm models at the shoulder with the mean measured responses
of the bare hand (grip force=30 N, push force=50 N) .................................. 54
Figure 2.12 : Comparisons of 𝑧ℎ-axis vibration transmissibility responses of the bare and
gloved hand-arm models at the wrist with the mean measured responses of
the bare hand (grip force=30 N, push force=75 N) ...................................... 54

xi
Figure 2.13 : Comparisons of 𝑧ℎ-axis vibration transmissibility responses of the bare and
gloved hand-arm models at the elbow with the mean measured responses of
the bare hand (grip force=30 N, push force=75 N) ...................................... 55
Figure 2.14 : Comparisons of 𝑧ℎ-axis vibration transmissibility responses of the bare and
gloved hand-arm models at the shoulder with the mean measured responses
of the bare hand (grip force=30 N, push force=75 N) .................................. 55
Figure 3.1 : Pictorial view of the BOSCH 11313EVS percussion chipping hammer
(BOSCH Co. Ltd.) ........................................................................................ 60
Figure 3.2 : Schematic of the chipping hammer illustrating the major components ........ 61
Figure 3.3 : Displacement coordinates used for modeling of different impact pairs ........ 63
Figure 3.4 : Schematic of the slider-crank mechanism ..................................................... 64
Figure 3.5 : Air flow through the orifices in the upper and lower chambers .................... 66
Figure 3.6 : Schematic of the striker ................................................................................. 66
Figure 3.7 : Relative positions of the control bushing and orifices .................................. 69
Figure 3.8 : The static and dynamic hand forces imposed on the tool handle (a) by the
biomechanical model; and (b) by the biodynamic model ............................ 73
Figure 3.9 : (a) A schematic of the tool mounted in an energy dissipator; and (b) idealized
tool tip-workpiece contact model ................................................................. 78
Figure 3.10 : Model illustrating visco-elastic collision between two rigid bodies ........... 80
Figure 3.11 : Minimum distances between different contact pairs at the instant of the
contact ........................................................................................................... 84
Figure 3.12 : (a) Experimental set-up illustrating the chipping hammer mounted in an
energy dissipator; and (b) the hand-arm posture of the subject (Adewusi,
2009) ............................................................................................................. 86
Figure 3.13 : (a) Time-history of tool bit acceleration measured during two subsequent
blows; and (b) acceleration time-history zoomed around the impact (1830
bpm and 78 N push force) ............................................................................ 88
Figure 3.14 : Time-history of acceleration measured at the tool handle (1830 bpm and 78
N push force) ................................................................................................ 89
Figure 3.15 : Procedure for determining stiffness and damping parameters for the contact
pair ................................................................................................................ 93

xii
Figure 3.16 : (a) Relative deformation; and (b) velocity responses of the striker and the
impact bolt pair ............................................................................................. 95
Figure 3.17 : (a) Relative deformation; and (b) velocity responses of the impact bolt and
the tool bit pair .............................................................................................. 95
Figure 3.18 : (a) Relative deformation; and (b) velocity responses of the tool body and the
impact bolt pair ............................................................................................. 95
Figure 4.1 : Time-history of acceleration measured at the tool bit (1830 bpm and 78 N
push force) .................................................................................................. 100
Figure 4.2 : Time-history of acceleration measured at the tool handle (1830 bpm and 78
N push force) .............................................................................................. 100
Figure 4.3 : (a) Acceleration response of the tool body of the percussive tool coupled with
the single-DOF HAV model; and (b) zoomed acceleration response (1830
bpm and 75 N push force) .......................................................................... 102
Figure 4.4 : (a) Acceleration response of the tool bit of the percussive tool coupled with
the single-DOF HAV model; and (b) zoomed acceleration response (1830
bpm and 75 N push force) .......................................................................... 103
Figure 4.5 : Acceleration response of the tool body of the percussive tool coupled with
the four-DOF HAV model (1830 bpm and 75 N push force) .................... 104
Figure 4.6 : Acceleration response of the tool bit of the percussive tool coupled with the
four-DOF HAV model (1830 bpm and 75 N push force) .......................... 105
Figure 4.7 : Acceleration response of the tool body of the percussive tool coupled with
the six-DOF HAV model (1830 bpm and 75 N push force) ...................... 106
Figure 4.8 : Acceleration response of the tool bit of the percussive tool coupled with the
six-DOF HAV model (1830 bpm and 75 N push force) ............................ 106
Figure 4.9 : Pressure variations in the upper chamber of the percussive tool coupled with
the six-DOF HAV model (1830 bpm, 30N grip and 75N push forces) ..... 111
Figure 4.10 : Acceleration response of the striker of the percussive tool coupled with the
six-DOF HAV model (1830 bpm, 30N grip and 75N push forces) ........... 112
Figure 4.11 : Acceleration response of the impact bolt of the percussive tool coupled with
the six-DOF HAV model (1830 bpm, 30N grip and 75N push forces) ..... 112

xiii
Figure 4.12 : Influence of orifice diameter on the pressure variations in the upper
chamber (1830 bpm, 30 N grip and 75 N push) ......................................... 115
Figure 4.13 : Influence of orifice diameter on the effective opening of the upper chamber
orifices (1830 bpm, 30 N grip and 75 N push) ........................................... 116
Figure 4.14 : Influence of tool body weight on the effective opening of the upper chamber
orifices (1830 bpm, 30 N grip and 75 N push) ........................................... 118
Figure 4.15 : Influence of tool body weight on the acceleration response of the tool body
(1830 bpm, 30 N grip and 75 N push) ........................................................ 119
Figure 4.16 : Influence of tool body weight on the response of the spring force (1830 bpm,
30 N grip and 75 N push) ........................................................................... 119
Figure 4.17 : Influence of push force on the effective opening of the upper chamber
orifices (1830 bpm and 30 N grip force) .................................................... 127
Figure 4.18 : Influence of push force on the pressure variations in the upper chamber
(1830 bpm and 30 N grip force) ................................................................. 128
Figure 4.19 : Influence of push force on the acceleration response of the impact bolt
(1830 bpm and 30 N grip force) ................................................................. 128
Figure 4.20 : Influence of push force on the acceleration response of the tool bit (1830
bpm and 30 N grip force) ........................................................................... 129
Figure 4.21 : Influence of push force on the response of the spring force (1830 bpm and
30 N grip force) .......................................................................................... 129
Figure 4.22 : Influence of tool speed on the pressure variations in the upper chamber
(30N grip and 75N push forces) ................................................................. 131
Figure 4.23 : Influence of tool speed on the acceleration response of the tool bit (30N grip
and 75N push forces) .................................................................................. 132
Figure 4.24 : Influence of tool speed on the acceleration response of the tool body (30N
grip and 75N push forces) .......................................................................... 132
Figure 4.25 : Influence of tool speed on the response of the spring force (30N grip and
75N push forces) ......................................................................................... 133

xiv
LIST OF TABLES
Table 1.1 : The ranges of magnitude of vibration and the associated VWF prevalence of
different vibrating tools (Gurram, 1993; Nemani, 2005) ............................. 20
Table 1.2 : Frequency ranges and direction of dominant vibrations of various hand-held
power tools (Gurram, 1993) ......................................................................... 21
Table 2.1 : Parameters of the air bladder glove model (Dong et al., 2009) ...................... 37
Table 2.2 : Parameters of the bent-arm model under different push forces (Adewusi, 2009)
...................................................................................................................... 38
Table 2.3 : Natural frequency and dominate deflection mode of the bent-arm model under
two different levels of push force ................................................................. 39
Table 2.4 : Parameters of the single-DOF hand-arm vibration model (Reynolds and
Soedel, 1972) ................................................................................................ 44
Table 2.5 : Parameters of the four-DOF hand-arm vibration model (ISO 10068, 1998) . 44
Table 2.6 : Comparison of the total static deflection of the biomechanical model with
those of the single- and four-DOF hand-arm vibration models ................... 44
Table 3.1 : Parameters of the tool tip-workpiece contact model ...................................... 87
Table 3.2 : Mean measured impact durations for different component contact pairs ....... 90
Table 3.3 : Determined coefficient of restitutions for different contact pairs .................. 90
Table 3.4 : Stiffness and damping parameters of different contact pairs .......................... 93
Table 3.5 : Comparisons of the target and the simulated impact durations for each impact
pair ................................................................................................................ 96
Table 4.1 : Peak tool bit acceleration magnitudes of the percussive tool measured in the
lab (Adewusi, 2009) ................................................................................... 101
Table 4.2 : Peak un-weighted handle acceleration, and un-weighted and frequency-
weighted r.m.s. handle accelerations of the percussive tool measured in the
lab (Adewusi, 2009) ................................................................................... 101
Table 4.3 : Comparisons of peak handle acceleration responses of the percussive tool
coupled with different hand-arm vibration models with the mean measured
values .......................................................................................................... 108

xv
Table 4.4 : Comparisons of peak tool bit acceleration responses of the percussive tool
model coupled with different HAV models with the mean measured values
.................................................................................................................... 109
Table 4.5 : Comparisons of un-weighted and frequency-weighted r.m.s. handle
acceleration responses of different hand-tool system models with the
measured values .......................................................................................... 110
Table 4.6 : Influence of variations in the orifice diameter on the upper chamber pressure
and acceleration responses of the tool bit and the tool body ...................... 114
Table 4.7 : Influence of variations in the tool body weight on the upper chamber pressure
and acceleration responses of the tool bit and the tool body ...................... 117
Table 4.8 : Influence of variations in the striker weight on the upper chamber pressure
and acceleration responses of the tool bit and the tool body ...................... 120
Table 4.9 : Influence of variations in the impact bolt weight on the upper chamber
pressure and acceleration responses of the tool bit and the tool body ........ 121
Table 4.10 : Influence of variations in the tool bit weight on the upper chamber pressure
and acceleration responses of the tool bit and the tool body ...................... 121
Table 4.11 : Influence of variations in the glove material properties on the un-weighted
r.m.s. accelerations distributed at different HAS segments ........................ 123
Table 4.12 : Influence of variations in the push force on the peak tool-tip cutting force
and acceleration responses of the tool bit and the tool body ...................... 126
Table 4.13 : Influence of variations in the tool speed on the peak tool-tip cutting force
and acceleration responses of the tool bit and the tool body ...................... 130
Table 4.14 : Influence of variations in the parameters of the tool tip-workpiece contact
model on the acceleration responses of the tool bit and the tool body ....... 134

xvi
LIST OF ABBREVIATIONS AND SYMBOLS
A(8) Total daily vibration dosage
𝑎ℎ𝑖 Root mean square acceleration recorded at each center frequency
𝑎ℎ𝑤 Frequency-weighted R.M.S acceleration
𝐴𝐿𝐶 Effective cross section area of lower chamber
𝐴𝐿𝐻 Total cross section area of lower orifices
𝐴𝑈𝐶 Cross section area of upper chamber
𝐴𝑈𝐻 Total cross section area of upper orifices
bpm Blow per minute
𝑐1, 𝑐2… Damping coefficients in relative hand arm models
𝐶𝑎 Assumed damping coefficient of contact pair
𝐶𝐴𝑈 Fraction of upper orifices opening in upper chamber
𝐶𝑏 Rotational damping coefficient of trunk
𝑐𝐵𝑇 Damping coefficient at impact bolt-tool tip contact pair
𝑐𝐶𝐵 Damping coefficient at tool body-impact bolt contact pair
𝑐𝑒 Damping coefficient at elbow
𝐶𝑒 Rotational damping coefficient at elbow
𝑐𝑔, 𝑐𝑔1, 𝑐𝑔2, Damping coefficients of selected anti-vibration glove
𝐶𝑃 Damping coefficient of workpiece plastic zone
𝑐𝑠 Damping coefficient at shoulder
𝐶𝑠 Rotational damping coefficient at shoulder
𝑐𝑆𝐵 Damping coefficient at striker-impact bolt contact pair
𝑐𝐹𝑇 Fluid friction coefficients at lubricant viscous layer between tool tip holder and tool tip

xvii
𝑐𝐹𝑆 Fluid friction coefficients at lubricant viscous layer between guide tube and striker
𝑐𝑤 Damping coefficient at wrist
𝐷𝐿𝐻 Diameter of lower orifices
𝐷𝑈𝐻 Diameter of upper orifices
𝐹𝐵𝑇 Contact force between impact bolt and tool tip
𝐹𝐶𝐵 Contact force between tool body and impact bolt
𝐹𝑑𝑓𝑖𝑛𝑔𝑒𝑟 Dynamic finger force exerted by operator on tool handle
𝐹𝑑ℎ Dynamic force exerted by operator’s hand on tool handle
𝐹𝑑𝑝𝑎𝑙𝑚 Dynamic palm force exerted by operator on tool handle
𝐹𝑝𝑢𝑠ℎ Static push force exerted by operator’s hand
𝐹𝑆𝐵 Contact force between striker and impact bolt
𝐹𝑆 Restoring force generated by the spring wrapping around guide tube
(𝐹𝑆)𝑚𝑖𝑛 Initial resorting spring force when the control bushing sits upon the lower control disk
𝐹𝑠𝑓𝑖𝑛𝑔𝑒𝑟 Static finger force exerted by operator on tool handle
𝐹𝑠ℎ Static force exerted by operator’s hand on tool handle
𝐹𝑠𝑝𝑎𝑙𝑚 Static palm force exerted by operator on tool handle
𝐹𝑇𝐺 Contact force between tool tip and workpiece
𝐹𝐹𝑇 Idealized viscous friction between tool tip holder and tool tip
𝐹𝐹𝑆 Idealized viscous friction between guide tube and striker
g Gravitational acceleration
h Height of lumped trunk
𝑘1, 𝑘2… Stiffness coefficients in relative hand arm models

xviii
𝐾𝑎 Assumed stiffness coefficient of contact pair
𝐾𝑏 Torsional stiffness of trunk
𝑘𝐵𝑇 Stiffness coefficient at impact bolt-tool tip contact pair
𝑘𝐶𝐵 Stiffness coefficient at tool body-impact bolt contact pair
𝑘𝑒 Stiffness coefficient at elbow
𝐾𝑒 Torsional stiffness coefficient at elbow
𝑘𝑔, 𝑘𝑔1, 𝑘𝑔2, Stiffness coefficients of selected anti-vibration glove
𝐾𝑃 Stiffness coefficient of workpiece plastic zone
𝐾𝐸 Stiffness coefficient of workpiece elastic zone
𝑘𝑠 Stiffness coefficient at shoulder
𝐾𝑠 Torsional stiffness coefficient at shoulder
𝑘𝑆𝐵 Stiffness coefficient at striker-impact bolt contact pair
𝑘𝑆 Stiffness coefficient of spring wrapping around control bushing
𝑘𝑤 Stiffness coefficient at wrist
(𝐿𝐵𝐶)𝑚𝑖𝑛 Displacement of impact bolt relative to tool body at their contact
(𝐿𝐵𝑆)𝑚𝑖𝑛 Displacement of impact bolt relative to striker at their contact
(𝐿𝐶𝐵𝐶)𝑚𝑎𝑥 Displacement of control bushing relative to tool body when it sits on upper control disk
𝐿𝐶𝐵 Length of control bushing
𝑙𝑟𝑜𝑑 Effective length of connecting rod
𝐿𝑆𝐿, 𝐿𝑆𝑈 Length of lower and upper striker thicknesses
(𝐿𝑆𝑃)𝑚𝑖𝑛 Displacement of striker relative to piston at their contact
(𝐿𝑇𝐵)𝑚𝑖𝑛 Displacement of tool tip relative to impact bolt at their contact
𝐿𝑈𝐶𝐷 Displacement of impact bolt relative to control bushing when control bushing is supported by lower control disk

xix
𝑙𝑢𝑒, 𝑙𝑢𝑠 Distances from the center of upper-arm mass to the joints of elbow and shoulder respectively
𝐿𝑈𝐻, 𝐿𝐿𝐻 Relative displacements of upper and lower orifices
𝑚1, 𝑚2… Equivalent masses in relative hand arm models
𝑀𝑏 Mass of impact bolt
𝑚𝑏 Lumped mass of trunk
𝑀𝑐 Lumped mass of tool body
𝑚𝑓 Lumped mass of fingers
𝑚𝑓𝑎 Lumped mass of fore-arm
𝑚𝑝 Lumped mass of palm
𝑀𝑠 Mass of striker
𝑀𝑡 Mass of tool tip
𝑚𝑡𝑓 Lumped mass of finger tissue
𝑚𝑡𝑓𝑔 Lumped mass of finger tissue and glove material
𝑚𝑡𝑝 Lumped mass of palm tissue
𝑚𝑡𝑝𝑔 Lumped mass of palm tissue and glove material
𝑚𝑢𝑎 Lumped mass of upper arm
𝑃𝑎 Atmospheric pressure
𝑃𝐿𝐶 Air pressure of lower chamber
𝑃𝑈𝐶 Air pressure of upper chamber
𝑟𝑐 Effective crank radius
t Time
𝑉𝑎𝑝𝑝 Approaching velocity
𝑉𝑈𝐸 Outward flow velocity for upper chamber

xx
𝑉𝑈𝐼 Inward flow velocity for upper chamber
𝑉𝑠𝑒𝑝 Velocity of separation
𝑤𝑖 Defined weighting factor for related one-third-octave band
𝑥ℎ, 𝑦ℎ, 𝑧ℎ ISO defined coordinate system
𝑧𝐵𝐶 Displacement of impact bolt relative to tool body
𝑧𝐶 Displacement of tool body
𝑧𝐶𝐵𝐶 Displacement of control bushing relative to tool body
𝑧𝐸 Displacement of workpiece elastic zone lower end
𝑧𝑓 Displacement of fingers
𝑧𝑓𝑎 Displacement of fore-arm
𝑧ℎ Static deflection of hand
𝑧𝑝 Displacement of palm
𝑧𝑃𝐶 Displacement of piston relative to tool body
𝑧𝑆𝐶 Displacement of striker relative to tool body
𝑧𝑇𝐶 Displacement of tool tip relative to tool body
𝑧𝑢𝑎 Displacement of upper arm
�̇�𝐵𝐶 Velocity of impact bolt relative to tool body
�̇�𝐶 Velocity of tool body
�̇�𝐸 Velocity of workpiece elastic zone lower end
�̇�𝑓 Velocity of fingers
�̇�𝑓𝑎 Velocity of fore-arm
�̇�𝑝 Velocity of palm
�̇�𝑃𝐶 Velocity of piston relative to tool body
�̇�𝑆𝐶 Velocity of striker relative to tool body

xxi
�̇�𝑇𝐶 Velocity of tool tip relative to tool body
�̇�𝑢𝑎 Velocity of upper arm
𝛾 Adiabatic constant
𝜀 coefficient of restitution
𝜁 Damping ratio
𝜃 Defined crank angle
𝜃𝑏 Angular displacement of trunk
𝜃𝑢𝑎 Angular displacement of upper arm
𝜏 Impact duration
𝜔𝐶 Angular velocity of crank
𝜔𝑑 Damped frequency
𝜔𝑛 Natural frequency

1
CHAPTER 1
LITERATURE REVIEW AND OBJECTIVES
1.1 General
Hand-held power tools, widely used in the industrial sectors, are known to transmit
substantial vibrations to the operator’s hand and arm. Depending on the operating
conditions and other related determinants, exposure to hand-transmitted vibration (HTV)
has been associated with an array of adverse health effects, including vascular,
neurological and musculoskeletal disorders, collectively termed as hand-arm vibration
syndrome (HAVS) (Gemne and Taylor, 1983; Bovenzi, 1998). In the U.S.A, over one
million workers are continually exposed to HTV (NIOSH, 1989; BLS, 2004). A
Canadian study estimated that approximately 200,000 operators are occupationally
subjected to HTV (Brammer, 1984).
Over the past few decades, substantial clinical and epidemiological efforts have
been made to explore and comprehend the phenomenon of HAVS. In the U.S.A, NIOSH
(1989) has reported that the HAVS prevalence among the vibrating tools operator
population ranges from 6% to 100%, with an average of about 50%. A number of
standardized methods have also evolved to assess the HTV exposure in view of probable
risk of HAVS (ISO 5349, 1986; ISO 5349-1, 2001). Considerable efforts have also been
made to characterize mechanical properties of the human hand arm system (HAS) in
terms of driving-point mechanical impedance, vibration power absorption, and vibration
transmissibility of different segments of the HAS (Goel and Kwan, 1987; ISO 10068,
1998; 2012; Rakheja et al., 2002c; Dong et al., 2005; Adewusi, 2009).

2
The diversity in physical characteristics of the operators and variabilities in the
environmental conditions such as temperature have been judged as the contributory
factors to HTV-induced health effects. The characteristics of HTV, however, such as
frequency and magnitude, and the cumulative exposure, have been of the primary
concern (Griffin, 1990; Pelmear and Wasserman, 1998). Considerable efforts have been
towards designs of anti-vibration gloves (Gurram et al., 1994; Hewitt, 1998; Pinto et al.,
2001; Dong et al., 2005; 2009) and handle vibration isolators (Suggs and Abrams, 1983;
Strydom et al., 2002; Oddo et al., 2004; Ko et al., 2011). Control of vibration at the
source through designs of low vibration tools, however, has been attempted in a very few
studies. This is most likely due to highly compact tool designs, and complexities
associated with modeling and characterization of highly nonlinear interactions among the
tools’ subsystems. Consequently, analytical design tools do not yet exist, particularly for
hand-held percussion tools.
Analyses of vibration transmission properties of hand-held power tools involve
characterizations of subsystems and their interactions together with an appropriate model
of the human hand arm system. This dissertation research is aimed at development of an
analytical model of a hand-held percussion tool coupled with a comprehensive HAS
dynamic model. The model is developed for a chipping hammer through integration of
various impact pair models. The properties of each impact pair are characterized in terms
of equivalent stiffness and damping, which are identified from the elastic-plastic impact
theory. A six degrees-of-freedom biomechanical model of the HAS is integrated to the
tool handle, and the anti-vibration glove effect is incorporated assuming linear stiffness
and damping properties of the glove. The validity of the model is also explored using the

3
data acquired with the tool operating in an energy dissipator. The variations in different
design parameters on the vibration emission characteristics of the tool are finally
investigated to seek essential design guidance.
1.2 Literature Review
The study of vibration emission properties of a hand-held power tool
encompasses various challenges in assessments of HTV, hand-arm vibration syndrome,
tool design and tool subsystems’ characterization and modeling, vibration isolation
mechanisms and vibration absorption characteristics of the HAS. The reported relevant
studies are thus reviewed to build essential background and knowledge on appropriate
methods and the design issues. These, grouped under the relevant topics, are summarized
below.
1.2.1 The Hand-Arm Vibration Syndrome (HAVS)
Continuous exposure to hand-transmitted vibration (HTV) can induce excessive
stress and deformations in the substructures of the hand-arm system (HAS) such as nerve
cells, tissues and bones, which may cause several disorders or injuries. Numerous
epidemiological and clinical investigations have reported high prevalence of vascular,
neural and musculoskeletal disorders among hand-tools operators (Brammer and Taylor,
1982; Brammer, 1984; NIOSH, 1997). The complex biological properties of the HAS and
wide variations in HTV, together with various confounders such as working posture,
hand forces, and types of tool and task, make it very difficult to identify specific
causative factors of the HAVS. The reported studies have classified HAVS into four

4
groups of disorders, namely, vascular, neurological, muscular, and bones and joints
disorders.
Intermittent episodes of blanching in the fingers and palm were reported as the
early signs of vascular disorders associated with HTV coupled with exposure to cold
(Iwata, 1968; Miyashita et al., 1983; Brubaker et al., 1986; Taylor, 1988). Increased
frequency and severity of such episodes have been reported with continued HTV
exposure. When exposed to cold temperatures, the vibration-induced contraction changes
in muscles and vessels may markedly limit or completely block the blood supply towards
the affected segment, resulting in severe pain and white finger (Pyykkö et al., 1976 and
1978; Griffin, 1990; Bovenzi et al., 2000). Such symptoms have been typically termed as
the Raynaud’s syndrome (Griffin, 1990; Bovenzi, 1998). Owing to such pathology,
vibration-induced white finger (VWF) has the greatest prevalence in regions where the
risk of exposure to cold is the highest (Riera et al., 1993; Maricq et al., 1993 and 1997;
Bovenzi, 1998). Due to the dynamic strains from HTV, the distorted shapes of capillaries
and blood vessels may lead to partial reductions in the blood flow, which is regarded as
one of the contributory factors of Raynaud’s syndrome, while the effects of other
confounders such as gender, age, tobacco, and general health have not yet been
understood (Palesch et al., 1999; Fraenkel al., 1999).
The typical symptoms of the peripheral neural disorder have been mostly referred
to as pins and needles like tingling. The potentially affected segments can mostly be
fingers, while palm or wrist may also be affected. Along with episodic swelling,
operators may temporally experience the reduction in the sense of temperature, touch and
manual sensitivity (Hjortsberg et al., 1989; Bovenzi, 1998). The growth in the intensity as

5
well as the daily dosage of HTV tends to enhance such symptoms with decrease or loss in
sensory perception, manipulative dexterity and tactile sensibility, which are more
resistant than the vascular ones (Bovenzi, 1998). Clinical and epidemiology studies have
indicated that operators using chipping hammers or grinders have higher prevalence of
neurological disorders (Griffin 1990; Gemne et al., 1993).
It has been also suggested that disorders of the central nervous system may be a
products of the prolonged HTV exposure. Several central nervous symptoms such as
over-activity of the cardiovascular responses (Hyvärinen et al., 1973), autonomic
dysfunction (Banister and Smith, 1972), headache and insomnia (Watanabe, 1966) have
been widely reported. However, owing to the complexity of the central nervous system
and the inadequate prevalence data, the primarily causative factor is not yet clearly
known.
Prolonged and excessive HTV exposure may likewise cause serious muscular
disorders known as muscle fatigue, perennial muscular weakness and muscle force
degeneration. High occurrences of muscle fatigue in the hands and arms of forest workers
have been reported in various studies (Matsumoto et al., 1977; Farkkila et al., 1982),
which are attributed to inadequate muscle contraction under extensive dosage of HTV.
Associated with vibration-induced digital neural disorder or direct mechanical injury,
these muscular disorders can lead to a remarkable reduction in the manipulative dexterity
such as decrease of hand and finger-grip strength (Bannister et al., 1972). In some
extreme cases, these muscle disorders can even become a form of disability such as
chronic disturbance or even loss of fine motor control ability.

6
High prevalence of bone injuries among vibration-exposed operators, such as
decalcification, vacuoles and cysts in hands and wrists, has also been reported in some
early radiology studies. A relatively higher risk of ossifications in elbow tendon insertion
and elbow arthritis exists among the coal miners, metal working workers and road
construction workers, who are exposed to low-frequency but high magnitude vibration
(Gemne and Saraste, 1987). Other studies, however, reported this risk to be only slightly
higher than the manual workers, when the influence of age is taken into account
(Härkönen et al., 1984; Bovenzi et al., 1987). Accordingly, it has been suggested that
apart from HTV, awkward hand-arm position, overload due to heavy manual work in
joints and other bio-mechanical factors can also contribute to higher prevalence of bone
and joint disorders (Taylor and Brammer, 1982; Härkönen et al., 1984; Bovenziet al.,
1987; Gemne and Saraste, 1987). Consequently, at present, a definite pathology of
vibration-induced bone and joint disorders has not yet been identified.
1.2.2 Hand-Transmitted Vibration (HTV) and Exposure Assessments
Owing to the well-established correlations between the HTV exposure and various
health disorders, considerable efforts have been made towards measurements and
assessment of HTV. The International Organization for Standardization (ISO) has
defined standardized methods for measurements, evaluations and risk assessments of
HTV. The standard, ISO 5349-1 (2001), defines a dose-response relation for assessing
probable vibration-induced white finger (VWF) risk of HTV exposure, and frequency
weighting to determine the exposure, often expressed by eight-hour energy-equivalent
vibration total value. The standard also provides vibration measurement method apart
from guidance for assessing risk of VWF. The ISO 5349-2 (2001) recommends practical

7
regulations for measurements at the workplace such as the measurement procedure and
the measurement uncertainty. Laboratory methods for measurements of HTV of different
hand-held power tools have been described in ISO 8662 standards (1988; 1999).
The vast majority of hand-held power tools transmit vibration along multi-axes.
The standard ISO 5348 (1998) defines two coordinate systems, basicentric and
biodynamic, which provide guidance for mounting of transducers and measurements for
handgrip and flat palm postures, respectively. Figure 1.1 shows the proposed handgrip
position coordinate systems.
a) ------ Biodynamic coordinate system; and b) —— Basicentric coordinate system
Figure 1.1 : Coordinate systems for the human hand-arm (ISO 5348, 1998)
The HTV is measured along each orthogonal axis simultaneously, while the
defined frequency-weighting and band-limiting filters are used to obtain HTV exposure
in terms of frequency-weighted root-mean-square (r.m.s.) acceleration or eight-hour

8
equivalent energy for assessing the exposure risk (ISO 5349, 1986; 2001). Figure 1.2
illustrates the frequency-weighting, 𝑊ℎ, defined in ISO-5349-1 (2001).
The frequency-weighted r.m.s. acceleration, 𝑎ℎ𝑤 , due to vibratrion exposure, is
obtained from:
2( )hw hi hii
a a w= ∑ (1.1)
where 𝑎ℎ𝑖 is the r.m.s. acceleration due to vibration in the 𝑖𝑡ℎ center frequency, 𝑓𝑖, of the
one-third-octave band and 𝑤ℎ𝑖 is the weighting factor corresponding to the center
frequency 𝑓𝑖.
Figure 1.2 : Frequency-weighting curve for hand-transmitted vibration (ISO 5349-1, 2001)
The standard assumes identical frequency weighting along each orthogonal axis to
compute the total value of vibration exposure as the vector sum of weighted accelerations

9
along the three axes, and the total daily vibration dosage in terms of eight-hour energy,
A(8) (ISO 5349-1, 2001).
This proposed guidance for assessing the HTV exposure risk has been further
adopted by the directive of the European Union (EU, 2002) and the ANSI (ANSI S2.70,
2006). The EU directive limits exposure value for hand-arm vibration to no greater than 5
𝑚/𝑠2. The directive also recommends a daily exposure action value of 2.5 𝑚/𝑠2 as the
threshold of hand-transmitted vibration induced syndrome. Accordingly, appropriate
HTV-protections are recommended to attenuate the vibration exposure exceeding 2.5
𝑚/𝑠2.
Despite their wide usage, the dose-response relation and the frequency-weighting
defined in ISO 5349-1 (2001) have been broadly criticized. A number of studies have
shown substantial deviations between the recommended method and the actual
prevalence observed in the field (Brubaker et al., 1986; Tasker, 1986; Walker et al., 1986;
Dandanell and Engstrom, 1986; Engstrom and Dandanell, 1986; Bovenzi et al., 1980 and
1988; Bovenzi, 1998; Seppalainen et al., 1986; Starck and Pyykkö, 1986; Pelmear et al.,
1989; Tominaga, 1993; Griffin et al., 2003). These studies have suggested various
limitations of both the 𝑤ℎ-weighting filter and exposure limit values. This may in-part be
attributed to limited knowledge on the human hand-arm bio-dynamics and roles of
various operational factors such as hand grip and push forces, working posture, tool-type
and individuals’ work habits. The frequency weighting could potentially overestimate the
adverse effects of vibration in the low frequency range, and underestimate the risks under
exposure to high frequency vibrations (Dong et al., 2001; 2005c; and 2006). The
prevalence of VWF syndrome reported in several epidemiological studies also suggests

10
considerable bias in the standardized health risk assessment guides. Griffin (2003) and
Bovenzi (2010) suggested that the un-weighted vibration dose may yield a better
prediction of VWF than the equivalent weighted vibration dose.
Griffin (2004) further stated that the exposure action and limit values,
recommended by the EU, may underestimate the risks associated with short term
exposure to extremely high-magnitudes vibrations. Operators exposed to such vibration,
commonly encountered in the construction industry, may suffer from a high prevalence
of VWF even when their vibration doses are below the recommended action value.
Owing to lack of agreements with the standardized dose-response relation, frequency-
weighting, and limiting dose values, the need for further epidemiologic and pathological
studies has been widely recognized. Irrespective of the disagreements on the standards,
the control of HTV is considered most essential for the prevention of vibration-induced
injuries and health risks.
1.2.3 HTV Control Strategies
The nature of hand transmitted vibration (HTV) strongly depends upon many
operating factors, such as tool speed, hand-grip and push forces, hand-arm posture and
the type of task, apart from the tool and handle designs. The HTV exposure could be
limited by limiting the tool speed and the daily exposure duration, irrespective of the tool
design, nature of the task and the other operating conditions (Mallick, 2008; 2010). Such
an approach, however, may not be generally acceptable in view of the reduced work rate.
Furthermore, it is difficult to control the vast majority of the operating factors considering
wide variations in the workplace environment, the tasks and individuals’ working habits.

11
It is thus vital to limit the HTV exposure through designs of low vibration tools and
handles in addition to the anti-vibration gloves.
Control of HTV while operating a hand-held vibrating tool may be realized through:
i) Isolating hands from the vibrating handles using anti-vibration materials or gloves;
ii) Isolating tool handles from the vibration source through designs of handle vibration isolators; and
iii) Designs of power tools integrating effective vibration control mechanisms.
The current design practice is primarily based on the isolation of the hands from
the vibrating handles using either anti-vibration materials covering the tool handle or
anti-vibration gloves or a combination of the two. Different resilient materials with visco-
elastic properties are normally applied to the handle to achieve some degree of vibration
attenuation. Suggs and Abrams (1983) investigated the vibration transmissibility of two
plastic foams wrapped tool handles under a white noise excitation. Both the materials
provided substantial vibration reduction, while the thinner and softer foam material
resulted in greater reduction of vibration in the lower frequency range. The vibration
isolation performance of the soft foam, however, will be limited under high magnitudes
of grip and push forces due to excessive deformation of the foam. Moreover, thick foam
layers may yield larger size of the handle and limit hand dexterity.
A wide range of anti-vibration gloves have been developed to realize suppression
of HTV apart from protecting the operators’ hands from cuts and cold/hot environments.
Gloves have been designed with different vibration isolation materials such as gel, air
bladders and rubber layers. The vibration isolation properties of different gloves have
been extensively studied through laboratory experiments (Brown, 1990; Griffin, 1998;

12
Pinto et al., 2001; Dong et al., 2003; 2005; 2009; Rakheja et al., 2002a). These have
shown that the vibration transmission characteristics of anti-vibration gloves are strongly
dependent upon the nonlinear visco-elastic properties of the coupled hand-glove system
(Griffin et al., 1982), hand forces and vibration excitation levels (Gurram et al., 1994;
Griffin, 1998). The vibration attenuation characteristics of different gloves have been
measured in the laboratory under vibration spectra of different tools apart from the M-
and H-spectra recommended in ISO 10819 (1996) (Griffin, 1998; Pinto et al., 2001;
Rakheja et al., 2002a). These studies have shown that vibration isolation effectiveness of
a glove is not only tool-specific but also depends on the hand forces.
The laboratory methods involve design of an instrumented handles and
measurement methods to assess anti-vibration effectiveness of gloves. The laboratory
measurement method has been standardized in an International Standard (ISO 10819,
1996). The standardized method recommends assessments under medium (M) and high
(H) frequency spectra, and the design of an instrumented palm-adapter for measurement
of vibration transmitted to the palm of the hand. A number of studies have identified
many technical problems with the standard method, namely, the recommended spectra
and misalignments of the palm-adapter (Griffin, 1998; Hewitt, 1998; Dong et al., 2002;
Welcome D.E. et al., 2012). Different laboratory studies of the same gloves thus resulted
in widely different performance characteristics.
Rakheja et al. (2002c) attempted a systematic comparison between the vibration
spectra defined in ISO 10819 and those measured from a series of power tools. It was
shown that the vibration measured from a nut runner, a sander and a pneumatic chipping
hammer were closer to the M-spectrum in view of the frequency contents, while the

13
magnitudes were substantially higher than those of the M-spectrum. The vibration spectra
of a rivet gun, a chain saw and a pneumatic road breaker were comparable to the
frequency range of the H-spectrum, while the spectral magnitudes were lower than the
recommended values. The revised standard (ISO 10819, 2013) proposes the
measurements under a single vibration spectrum in the 25 to 1600 Hz frequency range.
The assessments, however, are required in the M- and H-frequency ranges. A glove is
considered an anti-vibration, when its transmissibility magnitude in the M- and H-
frequency ranges is ≤ 1.0 and ≤ 0.6, respectively.
Gurram et al. (1994) compared vibration transmissibility characteristics of nine
different gloves and concluded that all of the gloves provided only very limited vibration
reduction in specific frequency bands. Some of the gloves resulted in amplification of the
handle vibration at frequencies below 100 Hz. Dong R. et al. (2009) proposed a dynamic
model of the gloved hand-arm system using the five-DOF biodynamic model of the hand-
arm system proposed by Dong J. et al. (2008) to predict vibration transmissibility of the
gloves. The study concluded that the anti-vibration gloves may not provide effective
attenuation of HTV at frequencies below 100 Hz, as stated by Gurram et al. (1994).
The reported studies have generally show anti-vibration effectiveness of gloves at
relatively higher frequencies. The effectiveness of a glove may be enhanced by using
thick vibration isolation materials, which could significantly impair the manual agility of
the operator. A further concern associated with the use of anti-vibration gloves is the
issue of durability. The effect of wear and tear on the glove’s vibration attenuation
performance remains uncertain (Hewitt, 1996; Pinto et al., 2001).

14
Alternatively, a few studies have proposed the isolation of the tool handles from the
tool-generated vibration. A number of suspended handle designs have been proposed,
where rubber or metal spring isolators are mounted between the tool body and the
handles. The effectiveness of such handle isolators have been evaluated for different tools,
such as chain saws, grass trimmer and rock drill (Suggs et al. 1968; Miwa, 1968;
Brammer, 1975; Politschuk and Oblivin, 1975). Ko et al. (2011) evaluated the vibration
attenuation performance of four different suspended anti-vibration handles installed on a
petrol-driven grass trimmer. The study included a commercially available polymer
material handle and three steel and aluminum handles of different lengths mounted on a
grass trimmer through two rubber mounts. The study thus permitted the evaluations of the
effect of spacing between two rubber mounts. The test results revealed that not all the
rubber mounts can effectively reduce HTV. The mild steel handle with closely spaced
rubber isolators revealed the best vibration isolation along all the three axes.
The effectiveness of rubber or metal spring handle vibration isolators mounted on
chain saws was measured by Suggs et al. (1968). It was shown that such isolators are
effective in limiting the transmission of high frequency vibrations (above 250 Hz), and
may even amplify the low frequency vibrations. Such handle isolators would thus yield
only limited isolation performance for tools powered by reciprocating engines or most
types of pneumatic drills operating at relatively low frequencies around 35-45 Hz (Oddo
et al., 2004).
Considering high magnitudes of HTV of jackleg drills in the vicinity of the blow
frequency, Oddo et al. (2004) evaluated two different designs of anti-vibration suspended
handles based on a robust spring-mass system. Parallel combinations of visco-elastic

15
mounts or helicoidal spring were tuned and employed as suspensions for attenuating tool
vibrations. Owing to the high magnitudes of grip and push forces applied on the handle
when initiating a drilling operation, relatively stiff suspended handles were designed so
as to limit the deformations under push forces as high as 200 N. The measurements
revealed superior vibration attenuation effectiveness of both the tuned handles in the low
frequency range, especially around 35 Hz. The viscoelastic mounts resulted in enhanced
vibration attenuation around the primary operating frequency of 35 Hz, whereas the
helicoidal springs showed more linear character characteristics and considerable
adaptability to the environment involving temperature variations or oil.
A few studies have also proposed dynamic vibration absorbers for attenuation of
tool vibration. Strydom et al. (2002) proposed the design of a hydraulic vibration
absorber for a rock drill, where the drill’s percussion frequency was identified as the
target absorber frequency. Through experiments, it was shown that tuning the fluid flow
area could yield variable degree of vibration attenuation. Ko et al. (2011) investigated the
effectiveness of a tuned vibration absorber for an electric grass trimmer within the
frequency range of 1-1024 Hz. The resonance frequency of proposed vibration absorber
was set to 220 Hz to match the grass trimmer’s operating frequency, while the optimum
mounting location of vibration absorber was evaluated analytically and experimentally.
The field tests revealed up to 95% reduction in the acceleration due to HTV along the 𝑋ℎ
axis. The tuned vibration absorber, however, would cause amplification of vibration
during tool’s idling or start-up, which was not addressed in the study.
Designs of low-vibration power tools are widely believed to be far more effective
in limiting the HTV, compared to the gloves and handle isolators. Carefully optimizing

16
the design parameters of power tools, such as handle position, tool size, component
materials, may yield control of HTV. However, owing to extremely complex interactions
among tool components as well as highly compact tool designs, very few efforts have
been attempted to optimize tools’ design parameters for the purpose of HTV control,
which are discussed in section 1.2.5.
1.2.4 Biodynamic Hand-Arm Models
Human hand-arm system (HAS) plays an essential role in the dynamics of
integrated hand-tool-workpiece system. Owing to considerable absorption of the
transmitted vibration in the HAS, it is essential to evaluate a tool design in the presence
of coupling with a HAS model. Hence, the application of a valid biodynamic hand-arm
model is critical and it can yield better understanding of the vibration transmission
characteristics of the HAS under different excitations, vibration energy distributions, the
developments in mechanical-equivalent simulators or test-rigs to estimate the dynamic
performances of different vibrating tools, and evaluations of potential vibration reduction
mechanisms (Mishoe and Suggs, 1977; Reyonlds and Falkenberg, 1982; 1984; Jahn and
Hesse, 1986; Gurram et al., 1995; Rakheja et al., 2002c).
Considerable efforts have been made during the past few decades towards
developments in effective mechanical-equivalent hand-arm vibration (HAV) models.
However, since most of the hand-arm models have been derived from the laboratory-
measured driving point mechanical impedances (DPMI), the excessive differences among
measurements and laboratory test conditions can contribute to significant differences
observed among the biodynamic responses of various hand-arm models (Mishoe, 1974;
Rakheja et al., 2002c).

17
Accordingly, the reported analytical hand-arm models can be divided into three
types, including the distributed-parameter biodynamic models, lumped-parameter
biodynamic models and biomechanical models. Wood et al. (1978) proposed two
distributed-parameter models for the hand-forearm system and the entire hand-arm
system, respectively. These models presented the hand through two lumped masses
coupled to a single driving point and two parallel combinations of stiffness and damping
elements. The hand-forearm model consisted of radius and ulna bones and attached soft
tissues described by two homogeneous flexural beams with distributed stiffness and
damping. The entire HAS model integrated a single beam as the upper arm humerus bone
to the hand-forearm model. Both the models considered 90° elbow angle and yh axis
vibration, while considerable deviations were reported in the DPMI response of the
model when compared with the experimental data (Rakheja et al., 2002c).
The vast majority of the reported lumped-parameter HAV models consist of linear
stiffness and damping elements. These include the single-DOF models by Abram (1971),
Reynolds and Soedel (1972) and Abram and Suggs (1977); 2-DOF models by Miwa et al.
(1979) and Mishoe and Suggs (1977); 3-DOF models by Mishoe and Suggs (1977), ISO
10068 (1998), Reynolds and Falkenberg (1982; 1984), Meltzer (1981), Daikoku and
Ishikawa (1990), and Gurram et al. (1995); and 4-DOF models by Gurram (1993),
Reynolds and Falkenberg (1984) and ISO 10068 (1998). Such lumped-parameter models
do not describe the contributions due to hand push and grip forces, and the hand-arm
posture. Furthermore, these models do not relate to the anatomical structure and
properties of the HAS. Mishoe and Suggs (1977) proposed three different linear models
corresponding to three different hand grip forces in order to account for the effect of grip

18
force on the biodynamic response. Gurram et al. (1996) proposed three and four-DOF
HAS models with grip force-dependent stiffness and damping elements. The effect of
hand push force, however, was ignored.
The vast majority of the lumped-parameter hand-arm models have been derived
from laboratory-measured DPMI data using either curve-fitting techniques or error
minimization methods. It has been suggested that the resulting models are not unique and
multiple sets of model parameters could be identified that satisfy the measured DPMI
data (Rakheja et al., 1993; 2002c; Adewusi, 2009). Moreover, the high-order lumped-
parameter models defined in ISO 10068 (1998) exhibit very low masses and stiffness
values, which limit their applications in tool models and in designs of hand-arm
simulators (Rakheja et al., 2002c).
Rakheja et al. (2002c) performed relative evaluations of 12 reported hand-arm
biodynamic models. Considering three criteria: (i) the static deflection of model under a
static feed force of 50 N; (ii) the ability of the model to describe the DPMI characteristics
of the HAS as per ranges defined in ISO 10068; and (iii) the natural frequencies and
damping ratios of the models. The results revealed excessive static deflections of a
number of reported models under a low-level of push force. This was particularly very
high for the three- and four-DOF lumped parameter models. The single lumped-
parameter models and the distributed-parameter models, however, revealed reasonably
low static deflections in the static deflection test. The three- and four-DOF models
revealed good agreements in the DPMI responses with the idealized ranges defined in
ISO 10068, while the single DOF and distributed-parameter models showed considerable
deviations. Furthermore, considerable differences were observed in the natural

19
frequencies and damping ratios of the reported models. It was concluded that none of the
models is well-suited for applications in tool modeling and for developing HAS
simulators.
In recent years, alternate HAS models employing two driving points (finger-handle
and palm-handle interfaces) and biomechanical structure of the HAS have been proposed
(Dong J. et al., 2008; Adewusi, 2009). These biomechanical models provide reasonable
deformation responses and good predictions of vibration transmissibility apart from the
DPMI. These models are thus considered more suited for integration in the tool model,
and are described in section 2.2.
1.2.5 Hand-Held Power Tools and Modeling of Coupled System
The nature of vibration emitted by a tool strongly depends on many design and
operating factors. For instance, the type of tool and task, rate of doing work, tool
maintenance, hand-arm posture and hand forces contribute immensely to the magnitude
and frequency components of HTV. The hand transmitted vibration of different tools
have been generally characterized through field measurements.
Considering the diversity among the tool types, maintenance states, working speeds,
treated materials, etc., a number of studies have suggested that the vibration frequencies
of hand-held power tools are concentrated in the 20-1250 Hz frequency range, while the
vibration magnitudes may vary from 10 𝑚/𝑠2(weighted) to 2014 𝑚/𝑠2(un-weighted) and
the dominant vibration direction differs for different tools and the working postures.
Table 1.1 and 1.2 summarize the range of magnitudes and dominant frequencies of
vibration due to different tools (Gurram, 1993; Nemani, 2005). Wide variations in the

20
vibration characteristics of the power tools also contribute to broad differences in the
prevalence of HAVS among the vibrating tool workers. The prevalence of vibration-
induced white finger (VWF) associated with different power tools is also presented in
Table 1.1.
A number of studies have reported the vibration exposure of specific tools, which
have contributed to developments in the designs of vibration attenuation systems for
those specific tools. For instance, a few studies have described the nature of vibration
transmitted to the chain saw operators (Suggs et al., 1968; Abrams and Suggs, 1969 and
1977; Futatsuka and Ueno, 1985; Pitts et al., 2004). The primary sources of vibration
have been identified as the drive and the cutting processes, which involve large
magnitude dynamic forces and torques. It is shown that the magnitudes of vibration of a
chain saw strongly depend on the cutting depth of the rotary chain. Excessive vibration,
which is detrimental not only for the human hand-arm but also for the saw, may occur
when the cutting gauge is too low. Furthermore, prolonged exposure to chain saw noise
may contribute to mental disorders among the operators (Miyakita et al., 1987).
Table 1.1 : The ranges of magnitude of vibration and the associated VWF prevalence of different vibrating tools (Gurram, 1993; Nemani, 2005)
Tool Type Magnitude of Vibration (m/𝑠2)
Prevalence of VWF Syndrome (%)
Chipping hammers 251-2014 47-80 Riveters 10*-1183 25-75
Jack-led drills 20*-362 45-80 Pavement breakers 195 10
Grinders 20-205 31-35 Chain saws 75 38
*weighted acceleration

21
Table 1.2 : Frequency ranges and direction of dominant vibrations of various hand-held power tools (Gurram, 1993)
In a similar manner, a few studies have described the nature and sources of
vibration of grinding tools (Agate et al., 1946; Hempstock and O’connor, 1975; Pelmear
et al., 1974; Bovenzi et al., 1980; Reynolds et al., 1982; Starck et al., 1983; Daikoko and
Ishikawa, 1990). Such tools can produce moderate levels of vibration attributed to
unbalance of the grinding disk, and the offsets in the installation of associated
mechanisms. Automatic balancing disks comprising moving balls within a guided race
have been successfully implemented to reduce the effects of wheel unbalance
(Rajalingham and Rakheja, 1998). Rotary tools, such as impact wrenches, electric
screwdrivers, and nut runners, are the typical hand held torque tools used in the assembly
and disassembly processes. These compact and light tools are mostly driven by
pneumatic power to achieve high torques. Electric screwdrivers and nut-runners may not
be as powerful as impact wrenches, but they can yield considerable levels of vibration as
well as dynamic torque.
Compared with rotary tools, the percussive tools, such as chipping hammers,
chisels, riveters and drillers, transmit considerably high magnitudes of dynamic forces
and vibrations to the operator’s hand-arm (Iwata, 1968; Matsumato et al., 1979; 1982;
Tool Type Frequency Range (Hz) Direction of Dominant Vibration
Chipping hammers 25-125 𝑍ℎ Bush cleaner 100-150 𝑋ℎ Garden tool 63-80 𝑋ℎ
Grinders 40-250 𝑋ℎ ,𝑌ℎ,𝑍ℎ Orbital sanders 60-100 𝑋ℎ ,𝑌ℎ,𝑍ℎ
Chain saws 63-150 𝑋ℎ ,𝑌ℎ,𝑍ℎ

22
Robert et al., 1977; Chatterjee et al., 1978; Taylor et al., 1981 and 1984; Behrens et al.,
1984; Walker et al., 1985; Brubaker et al., 1986). Chipping hammers are widely used in
the infrastructure or mining industry for crushing or drilling in hard materials. These tools
are thus designed to produce high-magnitude impulses. Riveting hammers, mostly
pneumatically powered, are designed in relatively compact size to install rivets in the
aerospace industry. Needle-scalers are generally applied in the shipbuilding or
automotive industry for the metal surface treatments such as rust, paint and loose scale
cleaning.
The general operating principle of a percussive tool is very different from that of a
rotary tool. Percussive tools develop high forces resulting from impacts between different
components of the tool. Such impulses repetitively produce high magnitude cutting forces.
The excessive impacts among tool components and between the tool tip and the work-
piece are generally regarded as the major sources of harmful vibration. Such tools also
emit higher magnitudes of HTV in the 20-125 Hz frequency range (Table 1.2). It has
been suggested that percussive tool operators exhibit a relatively higher prevalence of
VWF than operators of the other tools (Table 1.1).
A thorough understanding of dynamic characteristics of hand-held vibrating tools
coupled with the human HAS is judged essential for design of low vibration tools and for
identification of favorable operating conditions. The highly complex and compact
designs of hand-held power tools together with highly nonlinear tool-workpiece
interactions, however, pose difficult challenges in developing reliable analytical models.
Despite the extensive studies on HAVS and the strong desire to limit the HTV dosage,
the modeling of power tools and vibration isolation mechanisms has been attempted in a

23
very few studies. Abrams and Suggs (1969) experimentally investigated a vibration
isolator for chainsaws and concluded that the isolator was particularly effective in
attenuating high frequency vibration. Nemani (2005) proposed a multi-degree-of-freedom
(DOF) analytical model of a hand-held angle grinder coupled with a gloved hand to
evaluate the HTV along the three orthogonal axes in the presence of a rotating unbalance.
The simulation results revealed that an increase in the grinding wheel unbalance would
yield substantially higher levels of HTV along each axis. The study also showed
considerable vibration attenuation by the anti-vibration glove, which was represented by
a combination of linear spring and damping elements.
Golycheva et al. (2003; 2004) refined the analytical model of an electro-pneumatic
hammer that was initially proposed by Babitsky (1998) to explore different vibration
isolation mechanisms. The refinements involved considerations of the tool geometry and
coupling with a single DOF hand-arm vibration model. Two vibration absorbers were
introduced to the tool handle to limit HTV in two distinct frequency bands, together with
a vibration isolator to suppress the high frequency handle vibration. The study showed
superior effectiveness of vibration absorbers in limiting the low-frequency vibration. The
acceleration response of the hand-mass, however, was observed to be highly asymmetric
with negative acceleration peak substantially larger than the positive peak. This was most
likely caused by the linear hand-arm system model. A nonlinear model of an electro-
pneumatic percussive chipping hammer, coupled with the 3-DOF hand arm vibration
model defined in ISO 10068 (1998), was developed by Rakheja et al. (2002b). The model
involved many simplifying assumptions, associated with orifices geometry and air flows,
while the simulation results revealed in reasonably good agreement only with respect to

24
the fundamental frequency of the tool. Considerable deviations were observed between
the simulation results and the experimental data in terms of vibration magnitudes of the
tool and the hand-arm system. The observed deviations from the measured data were
attributed to very low stiffness of the standardized hand-arm vibration model, particularly
the excessive static deflection under a 50 N push force (Rakheja et al., 2002c).
1.3 Scope and Objectives of the Dissertation Research
From the review of literature, it is evident that only minimal efforts have been
made to develop reliable models of the hand-held power tools, which could serve as
essential analytical means for design of low vibration power tools. Furthermore, despite
considerable developments in anti-vibration gloves and handle vibration isolators, the
need for developing low vibration emission tools has been widely emphasized. The
primary objective of this dissertation research is thus to contribute towards development
of a reliable analytical model of a hand-held percussive chipping hammer through
considerations of components interactions in a systematic manner. The specific
objectives include the following:
a. Develop an analytical model of a hand-held percussive tool through
identifications of various contact pairs and the fluid flows between the primary
piston and the striker;
b. Propose a tool tip-workpiece contact model to describe the energy dissipator used
in experimental studies;
c. Integrate a biomechanical model of the hand-arm system to the tool model and
evaluate hand-tool system responses under selected push forces;

25
d. Explore the model validity using the laboratory-measured data and identify
desirable design parameters through parametric sensitivity analyses;
e. Investigate the effectiveness of an anti-vibration glove in controlling the tool
vibration.
1.4 Dissertation Organization
This dissertation is organized in five chapters. The first chapter is devoted to the
review of reported studies on health effects and assessment methods of hand transmitted
vibration (HTV) exposure, developments in control strategies for HTV, and analytical
models of the hand-arm system and power tools. The scope and the objectives of the
dissertation research were formulated on the basis of the reviewed studies.
In the second chapter, a biomechanical model of the human hand-arm in the bent-
arm posture (elbow angle=90°) reported by Adewusi (2009) is formulated and reviewed
in terms of static deflections, natural frequencies, driving point mechanical impedance
(DPMI) and vibration transmissibility responses, respectively. The hand-arm biodynamic
model is subsequently refined to incorporate the model of an anti-vibration glove (ISO
10068, 2010) to study the vibration attenuation effectiveness of the anti-vibration glove.
An analytical model of a hand-held percussive power tool is formulated in Chapter
3 by integrating various subsystem models describing dynamics of different impact pairs.
The parameters of these contact pairs (striker-impact bolt; impact bolt-tool body; and
impact bolt –tool bit) are identified from the rigid body impact theory. A tool bit-
workpiece impact model is also proposed on the basis of the available experimental data.

26
The equations of motion of the integrated hand-tool-workpiece system model with an
anti-vibration glove are subsequently formulated.
In Chapter 4, the validity of the proposed integrated hand-tool-workpiece system
model is examined using the available measured data in terms of tool handle and tool bit
accelerations, and biodynamic responses of the hand-arm system without the glove. The
simulations are performed to study vibration attenuation effects of various design-
parameters. On the basis of the simulation results, a design guidance is proposed to
reduce the magnitudes of HTV. The major conclusions and recommendations for future
studies are finally presented in Chapter 5.

27
CHAPTER 2
BIOMECHANICAL MODEL OF THE HAND-ARM SYSTEM WITH ANTI-
VIBRATION GLOVE
2.1 Introduction
Understanding of the biodynamic responses of the human hand-arm system (HAS)
to HTV is considered vital for design of vibration isolation systems for power tools, and
for derivations of alternate frequency weightings and vibration power flow analyses
(Rakheja et al., 2002c). The biodynamic responses of the HAS have thus been
extensively measured in many laboratory studies in terms of driving point mechanical
impedance, vibration transmitted to different segments of the hand-arm and vibration
power absorption (Mishoe and Suggs, 1977; Reyonlds and Falkenberg, 1982; 1984; Jahn
and Hesse, 1986; Gurram et al., 1995). A few studies have proposed different
mechanical-equivalent models of the HAS, ranging from single to many-degrees-of-
freedom, to described the mean biodynamic responses to vibration and the vibration
power distributions within the HAS (Rakheja et al., 2002c; Dong J., 2007; Adewusi,
2009). A few studies have also proposed hand-arm-vibration simulators on the basis of
the biodynamic models for estimating the dynamic performances of different vibrating
tools, and evaluations of potential vibration reduction mechanisms (Abrams and Suggs,
1969; Jahn and Hesse, 1986; Golysheva et al., 2004).
Rakheja et al. (2002c) performed a systematic comparison of 12 reported hand-arm
vibration models considering three criteria: (i) ability to predict mechanical impedance
properties; (ii) static deflections under a 50 N push force; and (iii) natural frequencies and
damping ratios. The study concluded that none of the reported models were suited for

28
developing HAV simulators and assessment of coupled hand-tool systems. The lower
order models revealed reasonably low static deflections under the specified push force
but resulted in substantial deviations with respect to standardized DPMI ranges (ISO
10068, 1998). Conversely, the higher order models revealed good agreements in terms of
the DPMI responses but showed excessive static deflections under a low-level of feed
force. The study also concluded that the evaluated models yield no agreement in terms of
the natural frequencies of the human HAS.
The reported lumped parameters do not represent anatomical structure of the HAS.
Fritz (1991) and Cherian et al. (1996) proposed biomechanical models of the human HAS
considering the elbow angles of 60⁰ and 90⁰, respectively, and the anatomical structures
of the forearm and the upper-arm. Dong J. et al. (2008) proposed a hand-arm model
comprising biomechanical structure of the hand, while the forearm and the upper-arm
were represented by a lumped mass. Alternatively, Adewusi (2009) proposed two
biomechanical models of the HAS considering two different postures with the elbow
angles of 90⁰ and 180⁰, respectively, together with biomechanical structures of the hand
and the arm. Furthermore, unlike the reported models that are based upon measured
DPMI alone, the proposed models were identified using the simultaneously measured
vibration transmissibility and DPMI responses.
The study of the vibration characteristics of a power tool necessitates the
application of a HAS model to account for the energy absorption by the human HAS. It
has been shown that application of the lumped-parameter models, recommended in ISO-
10068 (1998), to the tool model yield poor predictions of the tool handle vibration due to
excessive static deflection of the model (Rakheja et al., 2002b). In this study, the

29
biomechanical model, proposed by Adewusi (2009), is explored for the analysis of the
couple hand-tool system vibration responses along the 𝑧ℎ- axis. The model reported for
the bent-arm posture (elbow angle=90⁰) is re-formulated and analyzed to assess its
suitability for application to the tool model. This HAS model responses are assessed in
terms of: (i) the static deflections under two different levels of the static push force (50 N
and 75 N); (ii) the natural frequencies and normal modes of the model; (iii) the ability to
predict DPMI characteristics of the HAS; and (iv) the ability to predict vibration
transmissibility responses of HAS near the wrist, elbow and shoulder joints.
2.2 Biomechanical Model of the Hand-Arm System
The application of a valid biodynamic hand-arm model is critical to attain a better
understanding of the dynamic characteristics of the HAS under the tool-generated
vibrations, and evaluations of vibration performances of different hand-held power tools
and vibration isolation mechanisms. Considering that the tools’ vibrations generally
dominate along the 𝑧ℎ- axis, the bent-arm biomechanical model of the HAS, proposed by
Adewusi (2009), is investigated for its application to the power tool model. The reported
studies have generally considered the bent-arm posture (elbow angle=90⁰ and shoulder
abduction=0⁰) for the measurement of biodynamic responses and model development,
which does not represent the postures observed in the field (Adewusi, 2009). Owing to
the lack of models for more representative posture, the bent-arm biomechanical model is
considered better suited for application to power tools as it describes the anatomical
structure of HAS and yields relatively lower static deflection under a feed force.

30
Figure 2.1 illustrates the structure of the six-degrees-of-freedom HAS model. The
model employs a clamp-like structure of the hand, as proposed by Dong et al. (2005),
which permits considerations of the two driving points formed by the fingers-handle and
palm-handle interfaces to describe corresponding dynamic interactions. The bones of the
fingers and palm-wrist are represented by lumped masses, 𝑚𝑓 and 𝑚𝑝, respectively. The
masses of the skins and tissues overlaying the contacting areas between the hand and tool
handle are designated by 𝑚𝑡𝑓 for the fingers and 𝑚𝑡𝑝 for the palm-wrist, while the visco-
elastic properties of corresponding tissues are represented by linear damping and stiffness
constants (𝑐1 and 𝑘1), and (𝑐2 and 𝑘2), respectively.
The visco-elastic properties of the carpals and metacarpals connecting the fingers to
palm-wrist are also described by lumped damping and stiffness constants (𝑐3 and 𝑘3).
The masses due to the bones, tissues and skin of the forearm are represented by 𝑚𝑓𝑎,
while corresponding visco-elastic properties of the wrist and elbow joints are expressed
by 𝑐𝑤 and 𝑘𝑤, and 𝑐𝑒 and 𝑘𝑒, respectively. Similarly, the lumped mass, 𝑚𝑢𝑎, represents
the sum of masses of the bones, tissues and skin of the upper-arm. Associated visco-
elastic properties of the shoulder joint are shown as 𝑐𝑠 and 𝑘𝑠. The entire trunk of the
operator is represented by a lumped mass 𝑚𝑏 of height h coupled to the shoulder joint, as
shown in the Figure 2.1. Furthermore, based on experimental observations, rotary
motions are considered at the elbow, shoulder and pelvic joints but are ignored at the
wrist. Consequently, corresponding linear rotational visco-elastic properties of the elbow,
shoulder and pelvic joints are described by (𝐶𝑒 and 𝐾𝑒), (𝐶𝑠 and 𝐾𝑠), and (𝐶𝑏 and 𝐾𝑏),
respectively.

31
The motion of the tool handle coupled to the hand is represented by 𝑧𝑐 along the
𝑧ℎ-axis. In a similar manner, 𝑧𝑖 is used to denote the 𝑧ℎ-axis displacements of different
substructures of the HAS, where the subscript i can be f, p, fa, ua, representing the fingers,
palm-wrist, forearm and upper-arm, respectively. Moreover, the rotational motions of the
upper-arm and trunk are designated by 𝜃𝑢𝑎 and 𝜃𝑏, respectively.
Figure 2.1 : (a) Schematic of the hand grasping the tool handle (b) schematic of the bent-
arm model with 90°elbow angle; and (c) experimental set-up (Adewusi, 2009)

32
The equations describing the motions of the lumped fingers and palm-wrist masses
are formulated as:
1 1 3 3( ) ( ) ( ) ( ) 0c c p pf f f f f fm z k z z c z z k z z c z z+ − + − + − + − =
(2.1)
2 2 3 3( ) ( ) ( ) ( )( ) ( ) 0
p p p c p c p pf f
w p w pfa fa
m z k z z c z z k z z c z zk z z c z z
+ − + − + − + −
+ − + − =
(2.2)
Similarly, the equation describing the motion of the forearm is formulated as:
( ) ( ) ( )
( ) 0w p w p e ua ue uefa fa fa fa fa
e ua ue uefa
m z k z z c z z k z z l
c z z l
θ
θ
+ − + − + − +
+ − + =
(2.3)
The equations describing the 𝑧ℎ axis and rotational motions of the upper-arm are derived
as:
( ) ( )
( ) ( ) 0ua ua e ua ue ue e ua ue uefa fa
s ua us ua s ua us uab b
m z k z l z c z l z
k z l h c z l h
θ θ
θ θ θ θ
+ − − + − −
+ + − + + − =
(2.4)
( ) ( )[ ( ) ( )]
[ ( ) ( )] 0
ua ua e ua e ua s ua s uab b
ue e ua ue ua e ua ue uafa fa
us s ua us ua s ua us uab b
J K C K Cl k z l z c z l z
l k z l h c z l h
θ θ θ θ θ θ θ
θ θ
θ θ θ θ
+ + + − + −
− − − + − −
+ + − + + − =
(2.5)
where 𝐽𝑢𝑎 denotes the mass moment of inertia of the upper-arm, and 𝑙𝑢𝑎 defines the
length of the upper-arm. 𝑙𝑢𝑒 and 𝑙𝑢𝑠 are the distances from the mass center of upper-arm
to the elbow joint and the shoulder joint, respectively.
The equation describing the rotational motion of the trunk is derived as:
( ) ( )
[ ( ) ( )] 0b b b b b b s b ua s b ua
s ua us ua b s ua us ua b
J K C K C
h k z l h c z l h
θ θ θ θ θ θ θ
θ θ θ θ
+ + + − + −
− + − + + − =
(2.6)

33
where 𝐽𝑏 is the mass moment of inertia of the trunk about the pelvic joint.
As shown in Figure 2.2, the total dynamic force (𝐹𝑑ℎ) developed at the tool handle
interfaces can be formulated as:
dh dpalm dfingerF F F= +
(2.7)
where the dynamic hand forces developed at the finger side (𝐹𝑑𝑓𝑖𝑛𝑔𝑒𝑟), and palm side
(𝐹𝑑𝑝𝑎𝑙𝑚) can be calculated from:
1 1( ) ( ) tfdfinger c c cf fF k z z c z z m z= − + − +
(2.8)
2 2( ) ( ) tpdpalm p c p c cF k z z c z z m z= − + − + (2.9)
Figure 2.2 : Schematic of the dynamic hand forces
Eqs. (2.1) to (2.6) describe the motions of different segments of the hand-arm
system subject to handle vibration. These equations also yield driving-point mechanical
impedance responses at the two driving points formed by the fingers-handle and palm-
handle interfaces, which are derived in section 2.7. It should be noted that the Eq. (2.5),

34
describing the rotational motion of the upper-arm, differed from that reported in
Adewusi’s study (2009). This difference was due to an error that was discovered in the
reported equation.
2.3 Development of the Biomechanical Model of the Hand-Arm System Coupled
with the Anti-Vibration Glove
As stated in section 1.2.3, the control of HTV can be realized through isolating
hands from vibrating tool handles. Considerable efforts thus have been made towards
designs of anti-vibration gloves (Brown, 1990; Griffin, 1998; Pinto et al., 2001; Dong et
al., 2003; 2005; 2009; Rakheja et al., 2002a). Gloves with different vibration isolation
materials have been widely proposed to obtain some degree of vibration suppression. Air
bladder glove is one of the anti-vibration gloves utilized in the industrial sectors. The air
enclosed in tiny plastic bladders provides vibration isolation effects between hands and
tool handle under HTVs in specific frequency ranges (Dong et al., 2009). In this
dissertation research, an air bladder anti-vibration glove model proposed by Dong et al.
(2009) is integrated to the biomechanical model of HAS to investigate its vibration
isolation effectiveness. The applied glove model exhibits different visco-elastic properties
at two diving points formed by the finger- and palm-handle interfaces, respectively.
Similar to the bent-arm posture model, the gloved hand-arm model is formulated upon
consideration of the motions of the masses due to the tissues and glove materials covering
the contacting areas between the hand and tool handle, as shown in Figure 2.3.
The equations describing the motions of the masses 𝑚𝑡𝑓𝑔 and 𝑚𝑡𝑝𝑔, for the tissues
and glove materials covering the finger and the palm-wrist, are formulated as:

35
1 1 1 1( ) ( ) ( ) ( )tfg tf f tf f tf g c tf g c tfm z k z z c z z k z z c z z= − + − + − + −
(2.10)
2 2 2 2( ) ( ) ( ) ( )tpg tp p tp p tp g c tp g c tpm z k z z c z z k z z c z z= − + − + − + −
(2.11)
where 𝑚𝑡𝑓𝑔 and 𝑚𝑡𝑝𝑔 are derived as:
1tfg tfm m m= + (2.12)
2tpg tpm m m= + (2.13)
𝑚1 and 𝑚2 present the lumped glove material masses distributed at the finger- and palm-
glove interfaces. Let 𝑘𝑔1 and 𝑐𝑔1, and 𝑘𝑔2 and 𝑐𝑔2 denote the linear stiffness and damping
properties of the anti-vibration glove covering the fingers and the palm, respectively.
The equation describing the motion of the fingers is derived as:
1 1 3 3( ) ( ) ( ) ( )f f tf f tf f p f p fm z k z z c z z k z z c z z= − + − + − + −
(2.14)
Similarly, the equation describing the motion of the palm-wrist can be determined as:
2 2 3
3
( ) ( ) ( )( ) ( ) ( )
p p tp p tp p pf
p w p w pf fa fa
m z k z z c z z k z zc z z k z z c z z
= − + − + −
+ − + − + −
(2.15)
As shown in Figure 2.4, the dynamic hand forces developed at the finger side 𝐹𝑑𝑓𝑖𝑛𝑔𝑒𝑟,
and palm side 𝐹𝑑𝑝𝑎𝑙𝑚 can be expressed as:
1 1( ) ( )dfinger c cg gtf tfF k z z c z z= − + −
(2.16)
2 2( ) ( )dpalm c ctp tpg gF k z z c z z= − + −
(2.17)
The total dynamic hand force (𝐹𝑑ℎ ) developed on the tool-handle interfaces can be
formulated as:

36
dpalm dfingerdh FF F+=
(2.18)
Figure 2.3 : Schematic of the gloved hand-arm model in bent-arm posture
Figure 2.4 : The hand model integrating the glove model

37
The motions of the forearm, upper arm and trunk are identical to those formulated
in Eqs. (2.3) to (2.6), and the model parameters of the air bladder glove along 𝑧ℎ- axis are
tabulated in Table 2.1 (Dong et al., 2009).
Table 2.1 : Parameters of the air bladder glove model (Dong et al., 2009)
Parameter Value 𝑚𝑔1 (kg) 0.02 𝑘𝑔1 (kN/m) 327.3 𝑐𝑔1 (Ns/m) 75.20 𝑚𝑔2 (kg) 0.0673 𝑘𝑔2 (kN/m) 177.4 𝑐𝑔2 (Ns/m) 88.80
2.4 Parameters of the Bent-Arm Model
The model parameters associated with different push forces (50 N and 75 N) and a
constant grip force of 30 N were identified by minimizing the errors between the model
and measured biodynamic responses in terms of DPMI and vibration transmissibility
responses, respectively (Adewusi, 2009). The reported model parameters are tabulated in
Table 2.2.
The comparison of the model parameters, as presented in Table 2.2, suggests an
increase in the push force will increase vast majority of the visco-elastic coefficients of
the bent-arm model. Increasing the push force from 50 N to 75 N yields substantial
increases in the stiffness of the elbow joint (𝐾𝑒 increased by 237.5%), the pelvic joint (𝐾𝑏
increased by 122.2%) and the shoulder (𝑘𝑠 increased by 74.7%). The greatest percentage
increase in the damping coefficients occurs at the elbow (𝑐𝑒 increased by 99.3%),
followed by that for the tissue covering the palm ( 𝑐2 increased by 49.9%). These

38
percentage increases may be attributed to the tightening effect of the tendons or tissues in
the HAS when the push force is increased.
Table 2.2 : Parameters of the bent-arm model under different push forces (Adewusi, 2009)
Parameters 30 N Grip force 50 N Push force 75 N Push force
𝑚𝑡𝑓 (kg) 0.02 𝑚𝑓 (kg) 0.11 𝑚𝑡𝑝 (kg) 0.03 𝑚𝑝 (kg) 0.47 𝑚𝑓𝑎 (kg) 1.09 𝑚𝑢𝑎 (kg) 1.73 𝑚𝑏 (kg) 29.51 𝑙𝑢𝑒 (cm) 11.56 𝑙𝑢𝑠 (cm) 8.94 ℎ (cm) 52.00
𝐽𝑢𝑎 (kg𝑚2) 0.061 𝐽𝑏 (kg𝑚2) 2.6598 𝑐1 (Ns/m) 103.14 109.10 𝑐2 (Ns/m) 33.68 50.48 𝑐3 (Ns/m) 2.09 1.05 𝑐𝑤 (Ns/m) 147.86 217.91 𝑐𝑒 (Ns/m) 103.99 207.25 𝑐𝑠 (Ns/m) 28.90 13.85
𝐶𝑒 (Nms/rad) 2.24 3.36 𝐶𝑠 (Nms/rad) 2.52 2.52 𝐶𝑏 (Nms/rad) 53.49 74.59 𝑘1 (N/m) 94714.0 96342.0 𝑘2 (N/m) 53750.0 86729.0 𝑘3 (N/m) 6478.0 3239.0 𝑘𝑤 (N/m) 14155.0 18566.0 𝑘𝑒 (N/m) 2763.6 449.1 𝑘𝑠 (N/m) 4467.0 7804.4
𝐾𝑒 (Nm/rad) 537.1 1812.7 𝐾𝑠 (Nm/rad) 605.3 828.7 𝐾𝑏 (Nm/rad) 1353.3 3007.7
An increase in the push force also yields considerable reductions in the stiffness of
the tissues coupling the fingers and palm (𝑘3 decreased by 50.0%) and the elbow (𝑘𝑒

39
decreased by 83.7%). Similarly, the damping effects of the tissues coupling the fingers
and palm, and the shoulder joint reduce by 49.8% and 52.1%, respectively. However,
these reductions have not yet been explained. Generally, these observed percentage
changes in the model parameters of the bent-arm model suggest that an increase in the
push force will significantly affected the dynamic responses of the entire human hand
arm system.
2.5 Natural Frequency Analysis
In this section, the natural frequencies of the bent-arm model are evaluated through
the formulation and solution of an eigenvalue problem. The natural frequencies are
identified for two different levels of the push force (50 N and 75 N), and a constant grip
force of 30 N, using the model parameters presented in Table 2.2. The results are
summarized in Table 2.3 together with the dominant deflection mode.
Table 2.3 : Natural frequency and dominate deflection mode of the bent-arm model under two different levels of push force
Hand forces 30 N Grip and 50 N Push
30 N Grip and 75 N Push
Dominate deflection mode
Natural Frequencies
(Hz)
4.05 5.42 Trunk rotation 10.13 11.85 Upper arm mass 18.28 19.06 Forearm mass 63.64 76.94 Palm-wrist mass 71.33 106.47 Upper are rotation 152.74 151.46 Finger mass
The computed natural frequencies revealed very good agreements with the resonant
frequencies reported by Adewusi (2009), although slight differences were observed,
which was attributed to the error discovered in Eq. (2.5) in the reported study. The
highest natural frequencies (152.74 and 151.46 Hz), corresponding to the selected push

40
forces, were related to the lumped finger mass, while the lower frequencies (63.64 and
76.94 Hz) were associated with the lumped palm-wrist mass, and were referred to as the
characteristic frequencies of the palm. The remaining frequencies for the two push forces
(18.28 and 19.06 Hz, and 10.13 and 11.85 Hz) were related to the natural frequencies of
the forearm and upper-arm masses. The whole body rotation occurred at a very low
frequency (4.05 Hz) for the lower push force of 50 N, and it increased to 5.42 Hz with
increase in the push force to 75 N. The upper arm rotation modes occurred at 71.33 and
106.47 Hz, for the 50 N and 75 N push force, respectively.
The comparison of the natural frequencies of the bent-arm model under two
different push forces suggests that an increase in the push force tends to increase the
characteristic frequencies of the entire human hand-arm system, especially at the palm
(from 63.64 Hz at 50 N to 76.94 Hz at 75 N) and at the upper arm rotation (from 71.33
Hz at 50 N to 106.47 Hz at 75 N). These increases can be attributed to the fact that the
associated muscles or tissues in the HAS tend to be stiffen when push force is increased.
Consequently, the entire HAS becomes stiffer especially in the wrist, the elbow and the
shoulder. The finger mass, however, formed an exception to this. The finger mode
frequency decreased slightly with an increase in the push force.
2.6 Static Deflection Analysis
It has been shown that the vast majority of the reported HAS models exhibit large
static deflections under a low level push force (Rakheja et al., 2002c). This is caused by
the presence of a very low stiffness element of the models. Such models are thus not
considered suited for applications in the coupled hand-tool system models. The total
static deflection (deflection of the driving point with respect to the fixed support) of the

41
biomechanical model is evaluated by applying a static push force along the 𝑧ℎ-axis. The
analysis is performed for the two hand grip and push force combinations, for which the
model parameters were available. The push and grip force combinations may also be
expressed in terms of finger- and palm-side forces using the definitions in ISO 15230
(2007), such that:
sfinger gripF F= (2.19)
spalm push gripF F F= + (2.20)
where 𝐹𝑠𝑓𝑖𝑛𝑔𝑒𝑟 and 𝐹𝑠𝑝𝑎𝑙𝑚 refer to the static forces applied to the finger- and palm side
driving points, respectively.
The static deflections were evaluated for the palm-wrist, elbow and the shoulder
joints under the net static push forces of 50 and 75 N, as shown in Figure 2.5. The finger
tissue deflection, however, was not of concern considering its high natural frequency.
The static deflections of the reported low natural frequency single-DOF (Reynolds and
Soedel, 1972) and the four-DOF (ISO 10068, 1998) hand-arm vibration models, shown in
Figure 2.6, are also evaluated for comparison purposes. The parameters of these two
biodynamic hand-arm vibration models along the 𝑧ℎ-axis are tabulated in Tables 2.4 and
2.5, respectively. It should be noted that the parameters off these models have not been
related to the hand forces. Identical parameters are thus assumed for both the levels of the
push force.
The static deflections of the palm-tissue (𝑧𝑡𝑝𝑠 ) and palm-wrist mass (𝑧𝑝𝑠), forearm
mass (𝑧𝑓𝑎𝑠 ), upper arm mass (𝑧𝑢𝑎𝑠 ), upper arm rotation (𝜃𝑢𝑎𝑠 ), trunk rotation (𝜃𝑏𝑠) are
evaluated from:

42
{ } { }1[ ]siz K F−=
(2.21)
where
{ } Ts s s s s s si tp p fa ua ua bz z z z z θ θ = (2.22)
{ } 0 0 0 0 0T
pushF F = (2.23)
Figure 2.5 : Schematic of the biomechanical hand arm model under a static force
Table 2.6 compares the total static deflections of the biomechanical model with
those of the two lumped parameter models (Figure 2.6) under two different levels of
static push force. The total deflection of the biomechanical model refers to the deflection
of the palm tissue mass with respect to the fixed body support. For the single and four-
DOF models, it is defined as the deflection of the hand-handle contact mass (𝑚1) with
respect to the fixed support. The single-DOF model yields the lowest static deflection

43
under the two push forces (13.70-20.55 mm), while the four-DOF model shows excessive
static deflection (276.67 mm) under the 50 N push force and 415.00 mm under the 75 N
push force. The lower deflection observed for the single-DOF model is considered more
reasonable for the human HAS. The single-DOF model, however, yields poor prediction
of the biodynamic response of the HAS. Moreover, the single-DOF model does not
permit analyses of distributed vibration responses or power absorption of the HAS. The
excessive static deflection responses of the four-DOF model, on the other hand, are
judged inadequate for the developments of mechanical hand-arm simulator and coupled
hand-tool system model, although this model yields good prediction of the biodynamic
response (Rakheja et al., 2002c).
Figure 2.6 : Structure of the biodynamic hand-arm models: (a) single-DOF; and (b) four-
DOF

44
Table 2.4 : Parameters of the single-DOF hand-arm vibration model (Reynolds and Soedel, 1972)
Parameter Value (zh axis) 𝑚1 (kg) 0.103 𝑘1 (N/m) 3.65e3 𝑐1 (Ns/m) 39.5
Table 2.5 : Parameters of the four-DOF hand-arm vibration model (ISO 10068, 1998)
Parameter Value (zh axis) 𝑚1 (kg) 0.019 𝑚2 (kg) 0.0947 𝑚3 (kg) 0.655 𝑚4 (kg) 4.290 𝑘1 (N/m) 3.00e5 𝑘2 (N/m) 6.80e4 𝑘3 (N/m) 1.99e2 𝑘4 (N/m) 2.04e3 𝑐1 (Ns/m) 591 𝑐2 (Ns/m) 203 𝑐3 (Ns/m) 199 𝑐4 (Ns/m) 239
Table 2.6 : Comparison of the total static deflection of the biomechanical model with those of the single- and four-DOF hand-arm vibration models
Hand-arm vibration model Static deflection (mm) 50 N 75 N
Single DOF model (Reynolds and Soedel, 1972) 13.70 20.55
Four DOF model (ISO 10068, 1998) 276.67 415.00
Six DOF bent-arm model (Grip 30N Push 50N) 40.75 -
Six DOF bent-arm model (Grip 30N Push 75N) - 187.06

45
The biomechanical model yielded reasonable static deflection responses under the
lower push force of 50 N with total deflection being 40.75 mm. The total deflection under
75 N push force, however, was high (187.06 mm). The biomechanical model also showed
reasonably good deformations for most of the individual HAS segments. For instance, the
static deflections observed for the palm-wrist mass (𝑥𝑝-𝑥𝑓𝑎) ranged from 3.53 to 4.04 mm
under the two push forces, while the deflections of the forearm (𝑥𝑓𝑎-𝑥𝑢𝑎+𝜃𝑢𝑎𝑙𝑢𝑒) was
relatively small (18.36 mm) under 50 N force, and it was quite large (167.33 mm) under
the 75 N push forces. The high total deflections of the bent-arm model under 75 N force
was attributed to the substantial decrease in the elbow joint stiffness (𝑘𝑒 decreased by
83.7%) with an increase in the push force, as evident in Table 2.2. The comparison in the
static defections of different hand-arm models suggests that the biomechanical model is
more suitable for the characterization of the distributed responses in the HAS, the
simulation of coupled hand-tool system model, and for realizing a mechanical equivalent
HAS simulator.
2.7 Biodynamic Responses Analysis
Occupational exposure to HTV can yield considerable dynamic stresses and
deformations within the biological structures of human hand arm system (HAS), which
may cause several health disorders. Due to the exceeding complexity of the human HAS,
such stresses and deformations, directly acting on the tissues and cells, cannot be reliably
measured (Dong J., 2007). Alternatively, the motion and force responses of the HAS
have been widely characterized in terms of mechanical impedance and vibration
transmissibility responses, which may be correlated with the vibration stresses and
deformations (Dong et al., 2005f).

46
2.7.1 Diving Point Mechanical Impedance Response Analysis
The validity of the six-DOF biomechanical model of the HAS is firstly evaluated
by comparing its driving-point mechanical impedance (DPMI) response with the reported
measured data.
Referring to the model in Figure 2.1, the DPMI (Z(j𝜔)) is derived from:
( )( )( )c
F jZ jj Z j
ωωω ω
=
(2.24)
where F(j𝜔 ) denotes the total dynamic force developed at the driving-points at the
excitation frequency 𝜔. Since the applied bent-arm model employs two diving points, the
dynamic forces developed at the two interfaces can be formulated in terms of the finger
force 𝐹𝑓 , and the palm force 𝐹𝑝. The dynamic force exerted on the finger-side can be
expressed as:
1 1( ) ( )f c f c f tf cF k z z c z z m z= − + − +
(2.25)
In a similar manner, the dynamic force developed on the palm-side interface can be
formulated as:
2 2( ) ( )p c p c p tp cF k z z c z z m z= − + − +
(2.26)
The total dynamic force, 𝐹ℎ , acting on the hand-handle interface is subsequently
evaluated from the sum of the finger- and palm-side forces:
h f pF F F= + (2.27)
The mechanical impendences distributed at the finger- and the palm-sides can be
computed from:

47
1 1( ) ( )( )( )
( )f c f
finger tfc c
F j k j c Z ZZ j j m
j Z j j Zω ω
ω ωω ω ω
+ −= = +
(2.28)
2 2( ) ( )( )( )
( )p c p
palm tpc c
F j k j c Z ZZ j j m
j Z j j Zω ω
ω ωω ω ω
+ −= = +
(2.29)
where 𝑍𝑓𝑖𝑛𝑔𝑒𝑟(𝑗𝜔) and 𝑍𝑝𝑎𝑙𝑚(𝑗𝜔) are the complex finger- and palm-side mechanical
impedances, and 𝑍𝑓, 𝑍𝑝 and 𝑍𝑐 are the magnitudes of motions of the finger mass, palm
mass and handle, respectively.
The DPMI response of the entire hand-arm model, Zh (jω) , can be subsequently
determined from the sum of 𝑍𝑓(j𝜔) and 𝑍𝑝(j𝜔) (Dong J., 2007):
( ) ( )( )( ) ( ) ( )( ) ( )
f phh finger palm
c c
F j F jF jZ j Z j Z jj z j j z j
ω ωωω ω ωω ω ω ω
+= = = +
(2.30)
2.7.2 DPMI Responses of the Bent-Arm Model under Two Different Push Forces
Figures 2.7 and 2.8 show the comparisons of the DPMI responses of the bent-arm
model along the 𝑧ℎ -axis with the mean measured responses. The measured DPMI
responses, corresponding to 50 N and 75 N push forces, respectively, were attained
through laboratory tests with six male subjects. The measured data were extracted for two
hand grip/push forces combinations (30/50 N and 30/75 N), and broad band 𝑧ℎ -axis
vibration in the 2.5 to 500 Hz frequency range (frequency-weighted r.m.s.
acceleration=5.25 𝑚/𝑠2).
The comparisons presented in Figures 2.7 and 2.8 show reasonably good
agreements of model responses with the mean measured data for the two hand forces
combinations (30 N grip, 50 N push; and 30 N grip, 75 N push). Some notable deviations

48
are also observed in nearly the entire frequency range. The DMPI phase responses of the
bent-arm model also show good agreements with the mean measured responses with
notable differences in the lower frequency range (2.5-9 Hz).
Figure 2.7 : Comparison of 𝑧ℎ-axis DPMI responses of the biomechanical model under
30 N grip force and 50 N push force with mean measured data (Adewusi, 2009)
It needs to be emphasized that the model parameters were identified through
minimization of errors in both the DPMI and vibration transmissibility responses of
different segments of the HAS model (Adewusi, 2009). While this approach offers a
good compromise in predicting both the DPMI and the vibration transmissibility
responses, it also contributes to notable errors in both the responses. Parameter
identification on the basis of the DPMI along could yield lower error between the DPMI

49
responses of the model and the measured data. The observed deviations in the DPMI
responses are thus believed to be caused by the method of parameters identification.
Figure 2.8 : Comparison of 𝑧ℎ-axis DPMI responses of the biomechanical model under
30 N grip force and 75 N push force with mean measured data (Adewusi, 2009)
2.7.3 Vibration Transmissibility Response Analysis
Apart from the DPMI response, a number of studies have also attempted to
characterize the biodynamic response of the human hand-arm system (HAS) in terms of
the vibrations transmitted to different segments of the HAS (Abrams and Suggs, 1969;
Pyykkö et al., 1976; Griffin et al., 1982). Vibration transmissibility has been defined as
the ratio of vibration measured a location of the HAS to the vibration measured at the tool
handle along the 𝑧ℎ-axis. The validity of the bent-arm biomechanical model of the hand-

50
arm system is thus examined through comparisons of the segmental vibration
transmissibility with the mean reported data.
In this dissertation, the 𝑧ℎ-axis vibration transmissibility responses distributed at
the wrist, the elbow and the shoulder joint are obtained through solutions of the equations
of motion for the bent-arm model, such that:
( )( )
( )p
wc
Z jT j
Z jω
ωω
=
(2.31)
( )( )( )
uae
c
Z jT jZ j
ωω
ω=
(2.32)
( ) ( )( )( )
ua us uas
c
Z j l jT jZ jω θ ω
ωω
+=
(2.33)
where 𝑇𝑤(𝑗𝜔), 𝑇𝑒(𝑗𝜔), and 𝑇𝑠(𝑗𝜔) designate the vibration transmissibility responses at
the wrist, the elbow and the shoulder joint, respectively, corresponding to excitation
frequency 𝜔.
The vibration transmissibility responses of the bare hand-arm model can be
derived from:
{ } [ ] [ ] [ ] { }12( ) ( )iT j K M j C F jω ω ω ω−
= − + (2.34)
where [𝑀], [𝐾] and [𝐶] denote the mass, stiffness and damping matrices of the bare
hand-arm model. {𝑇𝑖(𝑗𝜔)} is the vibration transmissibility vector, and {𝐹(𝑗𝜔)} denotes
the forcing vector, given by:
{ } 1 1 2 2( ) [( ) ( ) 0 0 0 0]TF j k j c k j cω ω ω= + + (2.35)

51
In a similar manner, the vibration transmissibility responses of the gloved hand-arm
model are derived from the equation as:
{ } { }12( ) ( )gi g g g gT j K M j C F jω ω ω ω−
= − + (2.36)
where [𝑀𝑔], [𝐾𝑔] and [𝐶𝑔] denote the mass, stiffness and damping matrices of the gloved
hand-arm model, as formulated in section 2.3. �𝑇𝑔𝑖(𝑗𝜔)� is the vibration transmissibility
vector, and �𝐹𝑔(𝑗𝜔)� expresses the forcing vector of the gloved hand-arm system, given
by:
{ } 1 1 2 2( ) [( ) ( ) 0 0 0 0 0 0]Tg g g g gF j k j c k j cω ω ω= + +
(2.37)
2.7.4 Vibration Transmissibility Responses of the Bent-Arm Model with and
without the Anti-Vibration Glove under Two Different Push Forces
Figures 2.9 to 2.14 show the comparisons of the vibration transmissibility
responses of the bent-arm model with and without the anti-vibration glove with the mean
measured data corresponding to two different levels of the push force (50 N and 75 N).
The models consider a constant grip force of 30 N and the mean measured data were
obtained from Adewusi (2009). The figures compare the vibration transmissibility
responses at the wrist, elbow and shoulder, respectively.
Under the application of 50 N push force, the bent-arm model yields generally
good agreements with the mean measured data, as shown in Figures 2.9 to 2.11. However,
noticeable deviations are observed in the lower frequency ranges in the transmissibility
responses at the wrist (8-30 Hz), at the elbow (2.5-100 Hz) and at the shoulder (2.5-50
Hz), respectively. The bent-arm model under 75 N push force also yields generally good

52
vibration transmissibility responses at all the joints, as shown in Figures 2.12 to 2.14.
However, the increase in the push force generally tends to increase the deviations in all
the transmissibility responses in the higher frequency range, and tends to decreases the
errors observed in the lower frequency range. The observed deviations can be attributed
to the minimization of errors in the DPMI and the vibration transmissibility responses for
the model parameter identifications.
The comparisons of the vibration transmissibility of the bare-hand and the gloved
hand models suggest that the anti-vibration glove under 30 N grip and 50 N push force
yields minimal vibration attenuation effects at the elbow and the shoulder in nearly entire
frequency range (Figures 2.10 and 2.11). The addition of the anti-vibration glove tends to
amplify the vibration slightly around the primary peaks near 12 Hz. The glove, however,
tends to attenuate wrist vibration in the 32 to 100 Hz frequency range, with slight
amplification around 12 Hz. Similar trends are also evident in the model responses under
30 N grip and 75 N push forces. In this case, the addition of the glove causes relatively
greater amplification of vibration transmitted to the wrist, elbow and the shoulder joints
around 14 Hz. The results suggest that an anti-vibration glove may not yield effective
vibration protection for the operators exposed to the low-frequency vibrations generated
by hand-held tools, but could provide attenuation of medium frequency vibration
transmitted to the wrist.

53
Figure 2.9 : Comparisons of 𝑧ℎ-axis vibration transmissibility responses of the bare and gloved hand-arm models at the wrist with the mean measured responses of the bare hand
(grip force=30 N, push force=50 N)
Figure 2.10 : Comparisons of 𝑧ℎ-axis vibration transmissibility responses of the bare and gloved hand-arm models at the elbow with the mean measured responses of the bare hand
(grip force=30 N, push force=50 N)

54
Figure 2.11 : Comparisons of 𝑧ℎ-axis vibration transmissibility responses of the bare and gloved hand-arm models at the shoulder with the mean measured responses of the bare
hand (grip force=30 N, push force=50 N)
Figure 2.12 : Comparisons of 𝑧ℎ-axis vibration transmissibility responses of the bare and gloved hand-arm models at the wrist with the mean measured responses of the bare hand
(grip force=30 N, push force=75 N)

55
Figure 2.13 : Comparisons of 𝑧ℎ-axis vibration transmissibility responses of the bare and gloved hand-arm models at the elbow with the mean measured responses of the bare hand
(grip force=30 N, push force=75 N)
Figure 2.14 : Comparisons of 𝑧ℎ-axis vibration transmissibility responses of the bare and gloved hand-arm models at the shoulder with the mean measured responses of the bare
hand (grip force=30 N, push force=75 N)

56
2.8 Summary
A six-DOF biomechanical model of the human hand-arm system (HAS) in a bent-
arm posture is re-formulated and analyzed to assess its ability to predict the biodynamic
responses of the HAS. It is shown that the model can yield reasonably good predictions
of the responses in terms of driving point mechanical impedance and vibration
transmissibility. Furthermore, the model yields reasonable deformations under 50 N push
force, while the deformation under 75 N push force was considered to be high. A model
of the HAS with an anti-vibration glove is further developed and analyzed. The hand-arm
system model with and without the glove is judged suitable for implementation to the tool
model. Corresponding coupled system models are further formulated in the following
chapter.

57
CHAPTER 3
DEVELOPMENT OF ANALYTICAL MODELS OF PERCUSSIVE CHIPPING
HAMMER AND WORKPIECE
3.1 Introduction
Percussive chipping hammers, driven by pneumatic power, are broadly utilized in
the infrastructure or mining industry. These tools are designed to pneumatically initiate
impacts among tool components. Such impacts subsequently produce large-magnitude
cutting forces at the tool tip for crushing or drilling in hard materials. However,
substantial vibrations are also transmitted to the tool body and are subsequently absorbed
by the operator’s hand and arm through the tool handle. Percussive tools can emit
excessive vibrations ranging from 251 to 2014 𝑚/𝑠2, while the dominant frequency lies
in the 25-125 Hz range (Gurram, 1993). As a result, percussive tool operators are more
prone to suffer from a high prevalence of HAVS (Table 1.1).
Owing to high prevalence of HAVS among the percussive tools operators, the need
for developing low vibration percussive tools or effective vibration isolation mechanism
has been widely emphasized. The design of vibration isolators or assessment of vibration
performance of different tools necessitates developments in dynamic models of the tools.
Furthermore, a proven model of the hand-arm system (HAS) needs to be integrated to the
tool model to account for energy absorption property of the HAS. However, owing to the
extreme complexities associated with the compact tool designs, and wide variations in the
tasks and workpiece properties, the developments in tools and integrated hand-tool-
workpiece system models have been addressed in only a few studies (Rakheja et al.,
2002b; Golycheva et al. 2003; 2004). These models were proposed to derive design

58
guidance for low vibration power tools and for identifying desirable operating factors, as
described in section 1.2.5.
In this chapter, an analytical model of a percussive chipping hammer coupled with
an idealized workpiece contact model, is systematically developed to estimate the effects
due to the variations in operating factors, design parameters and hand-arm models on the
dynamic performances of the integrated hand-tool-workpiece system.
3.2 Description of the Percussive Tool
A hand-held percussive chipping/demolition hammer, manufactured by BOSCH
(11313 EVS), is considered in this study. A pictorial view of the tool is shown in Figure
3.1. The selected chipping hammer is driven by a 115 V AC electric motor and it can
deliver up to 2600 blows per minute (bpm). The tool speed could be varied in the 1300 to
2600 bpm range, using the user-controlled speed dial. Two tool handles integrated with
the tool housing, permit the operator to apply the desired feed force and guide the tool.
The feed force is applied to the primary handle attached to the drive unit, which also
houses the speed controller, as shown in Figure 3.1. The tool guidance is achieved by the
operator using the secondary handle located above the tool bit holder.
The tool operation constitutes a series of impacts among the various tool
components. Apart from the drive unit, the tool housing and the handles, the main
components of the selected tool include the piston, the striker, the control disks, the guide
tube, the control bushing, the impact bolt and the tool bit, as shown in Figure 3.2. The AC
motor serves as the continuous drive for the piston via the slider-crank mechanism, while
the piston motion is guided along the axial direction within the guide tube. A downward

59
piston motion compresses the air in the upper chamber bounded by the guide tube, the
piston and the striker. The significant variations in the air pressure in the upper chamber
subsequently cause a rapid axial motion of the striker, which further collides with the
impact bolt, as shown in Figure 3.2. The impact bolt further impacts on the tool bit to
transmit the energy to the tool bit and thereby the cutting force.
The air in the lower chamber, bounded by the guide tube, the striker and the lower
control disk, is compressed by the striker. The air within the lower chamber offers a
buffering effect between the striker and the impact bolt so as to eliminate direct impacts
between the striker and the lower control disk. Moreover, two sets of orifices are
provided within the upper and lower chambers for controlling the air pressure. The air
flows through the orifices would also contribute to some damping. The flows through the
upper chamber orifices are controlled by the relative positions of the control bushing and
the striker, while the lower chamber orifices normally remain open. Furthermore, the
annular clearance between the striker shaft and the control disks permits the flow of air
from the lower chamber to the atmosphere. The air pressure in the lower chamber may
thus be considered to be atmospheric. The light-weight control bushing could locate itself
on the lower control disk, due to the preload on the spring supporting the control bushing.
The upper chamber orifices may remain closed under static as well as during the
compression cycle, and they may open either fully or partially during the rebound motion
of the striker.
The collision between the striker and the impact bolt subsequently causes an impact
between the impact bolt and the tool bit, while the rebound motion of the impact bolt
causes the upper control disk to impact against the lower control disk, transmitting

60
vibrations to the tool body. Two elastomeric O-rings are mounted between the upper
control disk and the impact bolt, and the impact bolt and the tool body, to achieve some
degree of vibration isolation.
Figure 3.1 : Pictorial view of the BOSCH 11313EVS percussion chipping hammer
(BOSCH Co. Ltd.)

61
Figure 3.2 : Schematic of the chipping hammer illustrating the major components

62
3.3 Development of the Chipping Hammer Model
The operation of the chipping hammer involves a series of sequential impacts,
namely, striker-impact bolt, impact bolt-tool bit, impact bolt-control discs-tool body and
tool bit-tool body. Development of the tool model thus necessitates the modeling of these
impact pairs and the identification of the impact model parameters. The subsystem
models are systematically formulated in the following subsections, which are
subsequently integrated with the hand-arm vibration models described in Chapter 2, so as
to obtain the integrated hand-tool system model.
3.3.1 Displacement Coordinates
The coordinates of the different subsystems are initially defined for characterizing
the interactions among different impact pairs considering the geometric constraints of the
tool assembly. The crank center is designated as the origin of this coordinate system. The
displacement of the crank center, 𝑧𝐶, is also utilized to describe the motion of the tool
body as well as the handles. Figure 3.3 shows the relative positions of the piston, the
striker, the impact bolt and the tool bit with respect to the origin as 𝑧𝑃𝐶, 𝑧𝑆𝐶, 𝑧𝐵𝐶 and 𝑧𝑇𝐶,
respectively. In this notation, for instance, 𝑧𝑃𝐶 denotes the relative displacement of the
piston from the crank center. All the displacement coordinates are defined positive in the
vertically downward direction.

63
Figure 3.3 : Displacement coordinates used for modeling of different impact pairs
3.3.2 Piston Displacement
The displacement of the piston is obtained from the kinematics of the crank-slider
mechanism, assuming negligible inertial effect of the mechanism and constant rotational

64
speed 𝜔𝑐. Defining the crank rotation 𝜃 with respect to the top-dead center of the crank
(Figure 3.4), the relative displacement of the piston can be expressed as:
2 2 2( sin ) cosc cPC rodz l r rθ θ= − − (3.1)
where 𝑟𝑐 is the crank length, and 𝑙𝑟𝑜𝑑 denotes the length of the connecting rod.
The velocity of the piston relative to the crank center is subsequently formulated as:
2 2 2 1/2sin 1 cos ( sin )c c c cPC rodz r r l rω θ θ θ − = − −
(3.2)
Figure 3.4 : Schematic of the slider-crank mechanism
3.3.3 Air Pressure and Density Variations
The striker with an O-ring separates the guide tube into two chambers: (i) upper
chamber bounded by the piston and the striker; and (ii) lower chamber confined by the

65
striker and lower control disk, as shown in Figure 3.5. The motion of the piston causes
considerable variations in the pressure of the air within the upper chamber, which leads to
high velocity motion of the striker and subsequent impacts among the tool components.
Air flows from the upper and lower chambers occur through the orifices. The mass flow
rate of the air, however, depends on the effective orifice area, which is directly related to
the relative positions of the striker and the control bushing. Depending upon the position
of the striker, the air flow from the lower chamber may occur through both sets of
orifices apart from the annular clearance between the striker shaft and the control disks,
as shown in Figure 3.5. The flows from the upper chamber, however, are limited to the
upper orifices only, irrespective of the striker position. The upper orifice opening,
however, also depends upon the position of the control bushing.
Results obtained from a preliminary study (Rakheja et al., 2002b) suggested that
the air pressure in the lower chamber remains very close to the atmospheric pressure
during the tool operation. This is due to the upward motion of the control bushing under a
static feed force, and additional air flows through the annular gap between the striker
shaft and the control disks. The lower chamber air pressure is thus assumed to remain
constant and equal to the atmospheric pressure.
The relative positions of the striker and the control bushing determine the
boundaries of the upper and lower chambers as well as the occurrence of associated air
flows. As shown in Figure 3.6, 𝐿𝑆𝑈 and 𝐿𝑆𝐿 denote the thicknesses of the striker on the
upper and lower chamber sides. Subsequently, 𝑧𝑆𝐶−𝐿𝑆𝑈 and 𝑧𝑆𝐶+𝐿𝑆𝐿 define the relative
displacements of the upper and lower edges of the striker, respectively.

66
Figure 3.5 : Air flow through the orifices in the upper and lower chambers
Figure 3.6 : Schematic of the striker

67
During operation, the control bushing, governing the opening of the orifices, can
either sit on the lower control disk or oscillate along the guide tube, as shown in Figure
3.7. It should be noted that the upper control disk is supported on the impact bolt through
an O-ring, as seen in Figure 3.7. It is assumed that the loss of contact between the upper
control disk and the impact bolt does not occur during the tool operation. Referring to
Figure 3.7, the relative displacement of the lower end of the control bushing, 𝑧𝐶𝐵𝐶, can be
determined from:
max
max max
;;
( )( ) ( )BC UCD BC CBC UCD
CBCCBC BC CBC UCD
z L z L Lz
L z L L
− ≤ +=
> + (3.3)
where 𝐿𝑈𝐶𝐷 represents the design length of the upper control disk, and (𝐿𝐶𝐵𝐶)𝑚𝑎𝑥
describes the relative distance of the lower end of the control bushing when it sits on the
lower control disk. The position of the upper edge of the control bushing is subsequently
derived from 𝑧𝐶𝐵𝐶−𝐿𝐶𝐵, where 𝐿𝐶𝐵 is the design length of the control bushing.
Let 𝐴𝑈𝐻 denote the total cross section area of the upper set of orifices and 𝐶𝐴𝑈
express the fraction of the opening area of the upper orifices. The effective area of the
upper orifices is subsequently determined as 𝐶𝐴𝑈𝐴𝑈𝐻. The fraction 𝐶𝐴𝑈 approaches unity
when the upper orifices are fully open, satisfying both the following conditions for the
striker and control bushing positions:
i) When the upper edge of the striker is beneath the lower end of the upper orifices:
0.5UH UHSC SUz L L D− ≥ + (3.4)
where 𝐷𝑈𝐻 represents the diameter of the orifice and 𝐿𝑈𝐻 denotes the relative position of
the upper orifices (Figure 3.7).

68
ii) When the upper edge of the control bushing is beneath the lower end of the upper
orifices:
0.5UH UHCBC CBz L L D− ≥ + (3.5)
or when the lower edge of the control bushing is above the upper end of the upper
orifices:
0.5UH UHCBCz L D≤ − (3.6)
The air flow through the upper orifices will completely diminish (𝐶𝐴𝑈 = 0) when
the striker or the control bushing overlaps the orifices, as determined from one of the two
conditions listed below:
i) When the upper edge of the striker is above the upper end of the upper orifices:
0.5UH UHSC SUz L L D− ≤ − (3.7)
and the lower edge of the striker is beneath the lower end of the upper orifices:
0.5UH UHSC SLz L L D+ ≥ + (3.8)
ii) When the upper edge of the control bushing is above the upper end of the upper
orifices:
0.5UH UHCBC CBz L L D− ≤ − (3.9)
and the lower edge of the control bushing is beneath the lower end of the upper orifices:
0.5UH UHCBCz L D≥ + (3.10)

69
Figure 3.7 : Relative positions of the control bushing and orifices
The violations of the above conditions imply that the upper orifices may be either
partly open (0<𝐶𝐴𝑈<1), or lie within the lower chamber. When satisfying the partial
opening conditions, 𝐶𝐴𝑈 is determined from the lower of the two fractions, 𝐶𝐴𝑈1 and 𝐶𝐴𝑈2,

70
which are the fractions determined from the relative displacements of the striker and
control bushing, respectively, such that:
1 11 1
2 22 2
2( )2 sin(2 )1 arcsin2 2
2( )2 sin(2 )1 arcsin2 2
SC SU UHAU
UH
CBC CB UHAU
UH
z L LCD
z L LCD
ϕ ϕ πϕπ
ϕ ϕ πϕπ
− −− = − = − − −− = − = −
(3.11)
Furthermore, the following conditions must also be satisfied for a partial opening of the
upper orifices to occur:
( ) / 0.5SC SU UH UHz L L D− − ≤
(3.12)
( ) / 0.5CBC CB UH UHz L L D− − ≤
(3.13)
The variations in the air pressure and mass density could be derived considering the
air flows and motions of the piston and the striker. It has been suggested that the upper
chamber boundary can be considered adiabatic and the air flows through the orifices can
be determined as a reversible adiabatic flow through a nozzle (Rakheja et al., 2002b). The
variations in the pressure and density of the air in the upper chamber can be obtained
from:
[ ]
[ ]
1 1/
min
1/
min
( )
( )
UC aPC SC UI AU UC a
SC PC SP UCUC
UC aPC SC UE AU UC a
SC PC SP UC
P Pz z V C P Pz z L PdP
dt P Pz z V C P Pz z L P
γ
γ
γ
γ
− − + < − − = − − ≥ − −
(3.14)

71
[ ]
[ ]
1/
min
1/
min
( )
( )
UC a UCPC SC UI AU UC a
SC PC SP UC aUC
UC aPC SC UE AU UC a
SC PC SP UC
Px x V C P Px x L Pd
dt Px x V C P Px x L P
γ
γ
ρ ρρρ
ρ
− + < − − = − − ≥ − −
(3.15)
where 𝜌𝑎 is the mass density of air at the atmospheric pressure 𝑃𝑎, and 𝜌𝑈𝐶 is the density
of the air in the upper chamber corresponding to its instantaneous pressure 𝑃𝑈𝐶 . (𝐿𝑆𝑃)𝑚𝑖𝑛
denotes the minimum distance between the hinge point of the piston and the seal groove
of the striker, and 𝛾 is the adiabatic constant. 𝑉𝑈𝐼 and 𝑉𝑈𝐸 are the velocities of the air
flows entering and leaving the upper chamber, respectively, given by (Rakheja et al.,
2002b):
1 1/2 1
( 1)UH a UC
UIa aUC
PA PVA P
γγ
γ ρ
−
= −−
(3.16)
1 1/2 1
( 1)UH UC a
UEUC UC UC
PA PVA P
γγ
γ ρ
−
= −−
(3.17)
The highly nonlinear variations in the pressure and flow of the compressible fluid
may induce convergence errors, especially when the upper chamber pressure approaches
the atmospheric pressure or the control orifice area varies rapidly. The solutions of theses
equations are thus obtained using very small integration time step of 1 × 10⁻⁶s and
absolute tolerance of 1 × 10⁻¹⁴.
3.3.4 Modeling of Tool Components
Tool Body

72
During operation, the forces imposed on the tool body may comprise: tool weight;
hand forces imposed on the handles; spring force that determines control bushing’s
motion; friction forces between the components and the tool body; and the contact forces
between the tool body and the tool bit, the lower control disk and the upper control disk.
Since the lower control disk is firmly fixed to the tool body and the upper control disk is
supported by the impact bolt, the upper-lower control discs impact is converted to the
impact between the impact bolt and the tool body. Moreover the forces due to the air
pressure variations in the upper and lower chambers also affect the tool body dynamics.
Primarily analysis suggested the absence of impacts between the tool bit and the tool
body during the tool operation. The friction force arising within the piston in the guide
tube is also neglected. As a result, the equation describing the motion of the tool body can
be expressed as:
( )FTC C C CB S FSsh dh
aUC UC
M z M g F F F F F FP P A
= − + + − + +
− −
(3.18)
where 𝑀𝐶 denotes the lumped mass of the tool body including the drive unit, and �̈�𝐶 is its
absolute acceleration. Let g denote the acceleration due to gravity, and 𝐹𝐶𝐵 is the contact
force due to the impact bolt, as described in section 3.5. 𝐹𝑠ℎ and 𝐹𝑑ℎ are the static and
dynamic hand forces imparted on the tool handle, respectively. The biomechanical model
of the hand-arm system, presented in Chapter 2, is employed to derive the dynamic hand-
force. Considering the two driving points used in the biomechanical model, the static and
dynamic hand forces are expressed by combination of the palm and finger forces from
Eqs. (2.7-2.9), (2.16-2.18) and (2.19-2.20), as seen in Figure 3.8 (a):

73
spalm sfinger pushsh F F FF == −
(3.19)
dpalm dfingerdh F FF = +
(3.20)
The vast majority of the biodynamic hand-arm vibration (HAV) models, however,
consider a single driving point, as shown in Figures 3.8 (b). In such cases, 𝐹𝑠𝑝𝑎𝑙𝑚 refers
to the push force (𝐹𝑠𝑝𝑎𝑙𝑚 = 𝐹𝑝𝑢𝑠ℎ ), while the dynamic force developed at the hand-
handle interface is determined from the biodynamic HAV model.
Figure 3.8 : The static and dynamic hand forces imposed on the tool handle (a) by the
biomechanical model; and (b) by the biodynamic model
The notation 𝐹𝑆 in Equation 3.18 describes the restoring force due to the coil spring,
which controls the motion of the control bushing for air flow control. The spring force
may be expressed as:

74
( ) ( )( )
min max max
max
( )
0S S CBC CBC CBC CBC
SCBC CBC
F k L z L zF
L z
+ − > = =
(3.21)
where 𝑘𝑆 is the stiffness of the spring and (𝐹𝑆)𝑚𝑖𝑛 expresses the initial resorting force. It
should be noted that the inertial force due to the control bushing is neglected due to its
very low mass.
In Eq. (3.18), 𝐹𝐹𝑆 and 𝐹𝐹𝑇 are the friction forces due to striker seal and the tool bit
clamped in the tool bit holder, which are modeled as viscous forces, such that:
FS FS SCF c z=
(3.22)
FT FT TCF c z=
(3.23)
where 𝑐𝐹𝑆 and 𝑐𝐹𝑇 are the effective viscous damping coefficients.
The last term in Eq. (3.18) describes the force due to the upper chamber air
pressure acting on the piston.
Striker
In a similar manner, the forces acting on the striker include its weight, the force due
to the pressure variations in the upper chamber, the viscous friction between the striker
and the guide tube, and the contact force between the striker and the impact bolt. The
equation governing the striker motion is thus expressed as:
( )S S S UC a UC FS SBM z M g P P A F F= + − − −
(3.24)
where 𝑀𝑆 is the mass of the striker and �̈�𝑆 is its absolute acceleration. 𝐹𝑆𝐵 describes the
contact force between the striker and the impact bolt, which is derived in section 3.5.

75
Impact bolt
Assuming small masses due to the upper control disk and control bushing, the
motion of the impact bolt is governed by its weight, the restoring force transmitted by the
control bushing, and the contact forces between the striker and the impact bolt (𝐹𝑆𝐵), the
tool body and the impact bolt (𝐹𝐶𝐵 ), and the tool bit and the impact bolt 𝐹𝐵𝑇 . The
equation describing the motion of the impact bolt is subsequently formulated as:
B B B BTS SB CBM z M g F F F F= + + + −
(3.25)
where 𝑀𝐵 is the mass of the impact bolt and �̈�𝐵 denotes its absolute acceleration. The
contact force between the impact bolt and the tool bit (𝐹𝐵𝑇 ) is further formulated in
section 3.5.
Tool Bit
The forces acting on the tool bit include its weight, the contact force between the
bolt and tool bit, the viscous friction between the tool bit and the tool body, and the
contact force between the tool bit and the work-piece. The equation describing the motion
of the tool bit is thus expressed as:
T T T BT FT TGM z M g F F F= + − −
(3.26)
where 𝑀𝑇 is the mass of the tool bit and �̈�𝑇 denotes its acceleration. 𝐹𝑇𝐺 is the cutting
force developed at the tool bit-workpiece interface, which is described in section 3.4.
3.4 Development of the Tool Tip-Workpiece Contact Model
Apart from the diversity among the tool types, tool maintenance state and working
speed, the wide variations in the properties of the work-piece strongly affect the dynamic

76
performances of the coupled hand-tool system. For percussive chipping hammers, the
vast majority of the treated materials, such as rock, concrete and metal, could cause
highly nonlinear interactions between the tool bit and the workpiece. Substantial energy
due to the impacts among the tool components is transmitted to the tool bit, which
induces rapid stress variations in the workpiece leading to failure of the treated material.
Development of the coupled hand-chipping hammer system model necessitates
modeling of the tool bit-workpiece interactions. However, only a few studies have
attempted contact models to characterize the interactions between the tool bit and the
workpiece, particularly for a percussive tool. Rakheja et al. (2002b) proposed a two-DOF
contact model to characterize the tool bit contact with the steel balls in the standardized
energy dissipater (ISO 8662-2, 1992). The tool bit was assumed to create a rigid core in
the workpiece at the vicinity of the tool tip and transmit vibrations to a plastic substratum
supported by an elastic substratum. The plastic substratum was idealized by a Kelvin-
Voigt model, while the elastic substratum was represented by a high stiffness linear
spring. Moreover, the mass of the work-piece was ignored and separation was permitted
between the tool tip and the plastic zone. However, considerable deviations were
observed between the simulation results and the measured data in terms of acceleration
responses of the tool body. Golycheva et al. (2003; 2004) integrated a coupled hand-
chipping hammer system model with a single-DOF contact model of a treated concrete to
analyze the dynamic performances of the coupled system. This model idealized the
treated concrete by a parallel combination of a spring and a viscous damper, which
permitted separation between the tool tip and the work-piece. The validity of the model
through measurements of a tool, however, was not attempted.

77
The elastic-plastic model, proposed by Rakheja et al. (2002b), is similar to the
widely reported soil compaction models (Adam and Kopf, 2000; Anderegg and
Kaufmann, 2004; Mooney et al., 2005; Kordestani, 2010). The soil compaction model,
however, is realized by formulating the elastic and the plastic substrata in the reverse
order. In this study, a soil-compaction model structure is considered to characterize the
interactions between the tool tip and the steel balls within the energy dissipator, as shown
in Figure 3.9 (b). It should be noted that the contact model is formulated for the
standardized energy dissipater (ISO 8662-2, 1992), which was used in the experiments.
The steel balls in the dissipater are compressed by the anvil attached to the tool tip, which
can be considered as an elastic substratum, while the buffering effect due to the relatively
ample space among the steel balls is idealized by a plastic substratum comprising a
parallel combination of a relatively softer spring and a high viscous damping.
In the laboratory test, the selected percussive tool was operated under relatively
high magnitude feed forces (78 and 108 N) and the tool bit was guided by a fixed flange
(Adewusi, 2009). A flat anvil was attached to the tool bit, as shown in Figure 3.9 (a).
The guided flange and the anvil could help ensure steady contact with the steel balls. The
proposed tool tip-workpiece contact model was thus considered adequate for
characterizing the continuous contact, as idealized in Figure 3.9 (b). The contact force
transmitted to the tool tip-workpiece interface, 𝐹𝑇𝐺, can be obtained from:
[ ]min min( ) ( )TG E TC C BC TB EF K z z L L z= + − − −
(3.27)
where 𝐾𝐸 represents the stiffness of the elastic substratum. 𝑧𝑇 = 𝑧𝑇𝐶 + 𝑧𝐶 is the absolute
displacement of the tool bit, and 𝑧𝐸 expresses the displacement of the interface between

78
the plastic and elastic substrata. (𝐿𝐵𝐶)𝑚𝑖𝑛 and (𝐿𝑇𝐵)𝑚𝑖𝑛 denote the minimal distances
between the impact bolt and the tool body, and the tool bit and the impact bolt at their
contact, respectively.
Similarly, the force transmitted to the plastic substratum is formulated as:
P E P ETGF K z C z= +
(3.28)
where 𝐶𝑃 and 𝐾𝑃 are the viscous damping and stiffness of the plastic substratum,
respectively.
Equating Eqs. (3.27) and (3.28) yields a differential equation describing the
velocity of the interface between the plastic and elastic substrata, such that:
[ ]min min( ) ( ) ( )E E TC C BC TB P E P E Pz K z z L L C K K z C= + − − − +
(3.29)
Figure 3.9 : (a) A schematic of the tool mounted in an energy dissipator; and (b) idealized
tool tip-workpiece contact model

79
3.5 Component Contact Pair Models
The complete feature of the selected percussive tool relies on a series of impacts
among the tool components. The magnitudes of the contact forces acting on different
impact pairs could be extremely high, similar to that acting at the tool tip (Rakheja et al.,
2002b). Furthermore, the magnitude of the force arising at each impact pair is strongly
dependent upon the impact duration. Irrespective of the curvature of the contacting
surfaces, an elastic spring may be considered well-suited to yield a reasonable contact
force and deformation for a perfectly elastic collision. However, the vast majority of the
collisions involve appreciable energy loss, which is likely attributed to the internal
friction of the colliding materials. A visco-elastic material model may thus be considered
more desirable to characterize variations in the force, velocity and deformation during a
collision involving energy loss (Johnson, 1985; Karasudhi, 1990; French, 1997). The
impacts among the tool components could also yield energy loss, especially for the
impact bolt-tool body contact pair. Each impact pair is characterized by a single-DOF
contact model, where the model parameters are identified from the impact duration and
the coefficient of restitution using the method described by Rajalingham and Rakheja
(2000).
Consider a collision between the two rigid bodies with masses 𝑚𝐴 and 𝑚𝐵 ,
respectively, as shown in Figure 3.10. Let 𝑥𝐴 and 𝑥𝐵 define the displacement coordinates
of the two bodies, and L be the initial distance between the two masses at the beginning
of the contact. During a collision, the compression of the linear spring and the damper,
expressed as, 𝑥 = 𝐿 − (𝑥𝐵 − 𝑥𝐴), is related to the deformation of the contact pair. The
contact force, acting on mass B, can be subsequently obtained from:
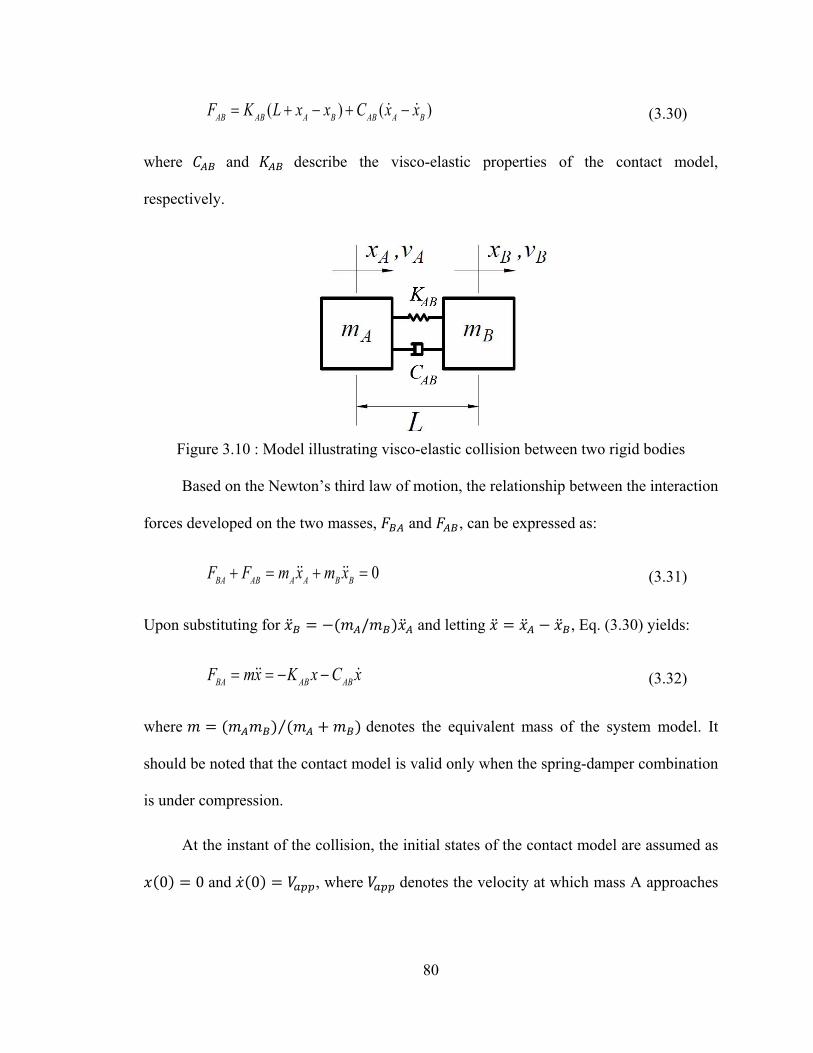
80
( ) ( )AB AB A B AB A BF K L x x C x x= + − + −
(3.30)
where 𝐶𝐴𝐵 and 𝐾𝐴𝐵 describe the visco-elastic properties of the contact model,
respectively.
Figure 3.10 : Model illustrating visco-elastic collision between two rigid bodies
Based on the Newton’s third law of motion, the relationship between the interaction
forces developed on the two masses, 𝐹𝐵𝐴 and 𝐹𝐴𝐵, can be expressed as:
0BA AB A A B BF F m x m x+ = + =
(3.31)
Upon substituting for �̈�𝐵 = −(𝑚𝐴/𝑚𝐵)�̈�𝐴 and letting �̈� = �̈�𝐴 − �̈�𝐵, Eq. (3.30) yields:
BA AB ABF mx K x C x= = − −
(3.32)
where 𝑚 = (𝑚𝐴𝑚𝐵) (𝑚𝐴 + 𝑚𝐵)⁄ denotes the equivalent mass of the system model. It
should be noted that the contact model is valid only when the spring-damper combination
is under compression.
At the instant of the collision, the initial states of the contact model are assumed as
𝑥(0) = 0 and �̇�(0) = 𝑉𝑎𝑝𝑝, where 𝑉𝑎𝑝𝑝 denotes the velocity at which mass A approaches

81
mass B. The solution of Eq. (3.32) depends on the damping ratio of the model, and can be
expressed as:
2
2
2
2
sin( (1 ) ) 1(1 )
1
sinh( ( 1) )1( 1)
( )
n
n
n
tapp n
nt
app
tapp n
n
V e t
V te
V e t
x t
ζω
ω
ζω
ζ ω ζζ ω
ζ
ζ ωζζ ω
−
−
−
− < −
=
−> −
=
(3.33)
where 𝜔𝑛 is the natural frequency and 𝜁 is the damping ratio of the system model. For the
sake of convenience, let 𝜁𝑢 = 𝑐𝑜𝑠𝛼1 in case of the under-damped system, and 𝜁𝑜 =
𝑐𝑜𝑠ℎ𝛼2 , for the over-damped system. The velocity and acceleration responses of the
system model can be subsequently derived from Eq. (3.33), such that:
1
2
cos
1 11
cosh
2 22
sin( ) cos 1sin
( ) (1 ) 1
sinh( ) cosh 1sinh
n
n
n
tapp
d
tapp n
tapp
d
V et
x t V e tV e
t
α ω
ω
α ω
ω α αα
ω ζ
ω α αα
−
−
−
− − <
= − =− − >
(3.34)
1
2
cos 2 2 21
1 1
2
cosh 2 2 22
2 2
( cos )sin( 2 ) cos 1
( ) ( 2 ) 1( cosh )
sinh( 2 ) cosh 1
n
n
n
tapp d n
dd
tapp n n
tapp d n
dd
V et
x t V e tV e
t
α ω
ω
α ω
ω α ωω α α
ωω ω ζ
ω α ωω α α
ω
−
−
−
+− <
= − = + − >
(3.35)
where 𝜔𝑑 is the frequency of the damped oscillations of the contact model.
The determination of the contact model parameters for each contact pair in terms of
stiffness and damping coefficient is extremely challenging. The collision, however, could
be characterized through measuring the impact duration and the restitution coefficient.

82
Considering that the acceleration ( �̈� ) of the equivalent mass (𝑚 ), in Eq. (3.35),
diminishes to zero at the end of the impact during compression, the duration of impact (𝜏)
could be solved as:
1 1 1
2 2 2
2 ( sin ) cos 12 / 1
2 ( sinh ) cosh 1
n
n
n
α ω α α
τ ω ζ
α ω α α
<
= =
>
(3.36)
The velocity of separation (𝑉𝑠𝑒𝑝 = �̇�(𝜏) = �̇�𝐴′ − �̇�𝐵′ ) of the contact model tends to
decrease after the impact. The coefficient of restitution (ε), describing the relationship
between the separation and approaching velocities, is defined as:
' 'sep
app
B A
BA
Vx xx x V
ε = −−=−
(3.37)
where �̇�𝐴′ and �̇�𝐵′ denote the absolute velocities of mass A and mass B, respectively,
following the separation. Upon substituting for 𝑡 = 𝜏 from Eq. (3.36) into Eq. (3.34), the
velocity of separation (𝑉𝑠𝑒𝑝 ) can be derived. The coefficient of restitution can be
subsequently obtained as:
1
2
1 1
2 2
2 /tan
2
2 /tan
cos 11
cosh 1
ee
e
α α
α α
αζα
ε
−
−
−
< = >
=
(3.38)
The contact forces, developed at each contact pair, can be obtained from Eq. (3.30).
The contact force between the striker and the impact bolt is obtained considering the
relative motions between the impact pair and the impact condition, such that:
83
min( ( ) ) ( )SB SB SC BC BS SB SC BCF K z z L C z z= − + + −
(3.39)
In a similar manner, the contact force between the impact bolt and the tool bit is obtained
as:
min( ( ) ) ( )BT BT BC TC TB BT BC TCF K z z L C z z= − + + −
(3.40)
The contact force between the tool body and the impact bolt is also derived from:
min(( ) )CB CB BC BC SB BCF K L z C z= − −
(3.41)
where 𝐾𝑆𝐵 and 𝐶𝑆𝐵, 𝐾𝐵𝑇 and 𝐶𝐵𝑇, and 𝐾𝐶𝐵 and 𝐶𝐶𝐵 denote the visco-elastic properties for
the striker-impact bolt, impact bolt-tool bit, and tool body and impact bolt contact pairs,
respectively. (𝐿𝐵𝑆)𝑚𝑖𝑛 , (𝐿𝑇𝐵)𝑚𝑖𝑛 and (𝐿𝐵𝐶)𝑚𝑖𝑛 are the lower limits of the distances
between the impact bolt and the striker, the tool bit and the impact bolt, and the impact
bolt and the tool body at the instant of the contact, respectively, as shown in Figure 3.11.

84
Figure 3.11 : Minimum distances between different contact pairs at the instant of the
contact
Owing to the nature of the collision, Eqs. (3.39) to (3.41) are considered valid when
the spring-damper combination of the contact model is under compression. Consequently,

85
the contact force for each contact pair occurs only when the following conditions are
satisfied, while the violation of these conditions suggests the occurrence of the contact
loss.
i) The contact force between the striker and the impact bolt:
min( )BC SC BSz z L− <
(3.42)
ii) The contact force between the impact bolt and the tool bit:
min( )TC BC TBz z L− <
(3.43)
iii) The contact force between the tool body and the impact bolt:
min( )BC BCz L<
(3.44)
3.6 Laboratory Measurements
A laboratory test was conducted at the institut de recherché Robert-Sauvé
ensanté et en sécurité du travail du Quebec laboratory to characterize the biodynamic
responses of the human hand-arm system, while operating a chipping hammer in an
energy dissipater (Adewusi, 2009). The selected percussive chipping hammer (BOSCH
11313 EVS) was guided in a steel ball energy dissipator as described in ISO 8662-2
(1992), as seen in Figure 3.12. In the setup, the tool bit is attached to an anvil, which is
assumed to remain in contact with the steel balls, as shown in Figure 3.9. Two uni-axial
accelerometers (B&K type 4393) were mounted on the tool bit and the primary tool
handle, respectively. These transducers were calibrated and aligned to record the
acceleration responses along the tool’s dominant vibration direction.

86
Figure 3.12 : (a) Experimental set-up illustrating the chipping hammer mounted in an
energy dissipator; and (b) the hand-arm posture of the subject (Adewusi, 2009)
The measurements of the tool body and tool bit accelerations were conducted with
an adult male subject operating the percussive chipping hammer, while grasping the
primary handle with one hand with bent-arm posture (elbow angle≈90 degrees and
shoulder abduction angle≈30 degrees), as shown in Figure 3.12 (b). Three measurement
trials were performed with the subject applying two different levels of push force (78 N
and 118 N), which was measured using a force platform. The tool was operated at two
different speeds (1830 and 2625 bpm). The push force, measured by the force platform,
was displayed to the operator so as to monitor and control the applied force. The grip
force imparted by the operator on the tool handle, however, was not measured, since it
would involve substantial modifications and instrumentation of the tool handle. In this
study, the laboratory measured data are utilized to characterize the impact durations so as

87
to obtain estimates of visco-elastic properties of each contact pair. The measured data are
also used to examine the validity of the coupled hand-tool-workpiece model.
3.7 Parameter Identification
For the tool tip-steel balls contact model, the elastic and plastic stratum parameters
were identified through trial and error so as to achieve the peak measured acceleration of
the tool bit. The measured data revealed substantial variations in the peak acceleration
responses measured during the three trials at the higher speed of 2625 bpm, while those
measured at the lower speed revealed more consistent peak accelerations. The parameter
identification was thus limited to the data obtained at the lower speed. Figures 3.13 and
3.14 illustrate the time-histories of acceleration measured at the tool tip and the tool body,
respectively. Table 3.1 lists the contact model parameters that resulted in reasonably good
agreement with the peak measured accelerations. Owing to the highly nonlinear contact
properties and the lack of reliable measured data, the validity of the contact model could
be examined only in a qualitative sense.
Table 3.1 : Parameters of the tool tip-workpiece contact model
Parameter Symbol Value Elastic zone stiffness (N/m) 𝐾𝐸 1.05E7 Plastic zone stiffness (N/m) 𝐾𝑃 6.5E5
Plastic zone damping (Ns/m) 𝐶𝑃 2500
It needs to be emphasized that the acceleration responses of the impact pairs could
not be measured directly. The impact durations of the impact pairs thus could not be
identified from direct measurements.

88
(a)
(b)
Figure 3.13 : (a) Time-history of tool bit acceleration measured during two subsequent blows; and (b) acceleration time-history zoomed around the impact
(1830 bpm and 78 N push force)

89
Figure 3.14 : Time-history of acceleration measured at the tool handle
(1830 bpm and 78 N push force)
The acceleration responses of the tool bit and the tool body, however, are the result
of impacts among the selected component contact pairs. The available data could thus be
used to estimate the impact duration. In this study, preliminary estimates of impact
durations for each impacting pair are obtained from the measured data corresponding to a
single blow. As shown in Figure 3.13, the tool bit acceleration response exhibits two
large peaks, preceded and followed by low-magnitude oscillations. The tool bit and
handle acceleration responses show the fundamental frequency near 30.5 Hz, which
corresponds to its operating speed of 1830 bpm. The large magnitude peaks, observed in
the acceleration responses of the tool bit, can be mostly attributed to the impacts between
the impact bolt and the tool bit, while the lower amplitude oscillations, preceded the
primary peaks are attributed to the pre-impacts between the striker and the impact bolt
(Figure 3.13). On the other hand, the bifurcations, observed in the large magnitude peaks

90
of the acceleration response of the tool body, are attributed to the contacts between the
impact bolt and the tool body (Figure 3.14). The mean measured impact durations are
summarized in Table 3.2.
Table 3.2 : Mean measured impact durations for different component contact pairs
Impact pair Impact duration, 𝜏 (s) Striker and impact bolt 2.81e-4 Impact bolt and tool bit 4.64e-4
Impact bolt and tool body 1.38e-3
Rakheja et al. (2002b) reported durations of 0.3, 0.45 and 1.5 ms for the impacts
between the striker and the impact bolt, the impact bolt and the tool bit, and the impact
bolt and the tool body, respectively. These are comparable with the mean values
extracted from the measured time histories.
Owing to wide variations in the properties of different materials, the coefficient of
restitution is also expected to vary considerably. In this study, the coefficients of
restitution for individual contact pairs are determined based on those reported by Rakheja
et al. (2002b), which are summarized in Table 3.3. It should be noted that the coefficient
of restitution of the impact bolt-tool body contact pair is considerably lower than those of
the rigid metal impacting pairs, which could be attributed to the presence of the O-ring
between the impact bolt and the lower control disk.
Table 3.3 : Determined coefficient of restitutions for different contact pairs
Impact pair Coefficient of restitution ε Striker and impact bolt 0.95 Impact bolt and tool bit 0.95
Impact bolt and tool body 0.55

91
3.7.1 Component Contact Pairs Model Parameter Identification
The measured data revealed high magnitude impact forces over very short impact
durations. The contact model corresponding to the underdamped condition is thus
considered appropriate. Equation (3.38) is subsequently manipulated to yield the damping
ratio, 𝜁𝑢 = 𝑐𝑜𝑠𝛼1, in the following form:
11
1
ln sincos2ε ααα
= −
(3.45)
Upon substituting for sin𝛼1 = 2𝛼1/(𝜏𝜔𝑛) from Eq. (3.36) and defining the
damping constant, 𝐶𝐴𝐵 = 2𝑚𝜔𝑛 cos𝛼1 , the damping constant of the impact pair is
subsequently obtained from Eq. (3.45), in terms of the contact duration 𝜏 and the
coefficient of restitution ε:
2 lnAB
mC ετ
= −
(3.46)
Upon substituting for sin𝑎1 = 2𝑎1/(𝜏𝜔𝑛) and considering the stiffness, 𝐾𝐴𝐵 =
𝑚𝜔𝑛2, the stiffness of a contact pair can be derived from Eq. (3.45), such that:
2
2 21
(ln )cosAB
mK ετ α
=
(3.47)
where 𝛼1 can be expressed as a function of 𝜏 and 𝜀:
1lncos( )
n
arc εαω τ
= −
(3.48)
As seen in Eq. (3.36), τ is a function of 𝛼1 for the under-damped system. Equations
(3.46) to (3.48), however, contain transcendental functions and cannot be solved in the

92
closed-form. Moreover, due to the presences of natural logarithm, the system stiffness
and damping coefficients may exhibit extreme sensitivity to variations in 𝜀. Alternatively,
the impact duration and coefficient of restitution may be expressed as functions of
stiffness and damping constants. It is thus possible to determine the stiffness and the
damping constant for each contact pair by minimizing the error between the target and
assumed impact duration and coefficient of restitution.
According to Eqs. (3.36) and (3.38), the assumed impact duration ( 𝜏𝑎 ) and
coefficient of restitution (𝜀𝑎 ) derived from the assumed stiffness (𝐾𝑎 ) and damping
constant (𝐶𝑎), can be formulated as:
1 1
1 1
1 12 /tan
2 2sin sinn a
a
a
mK
e α α
ωα ατα α
ε −
=
=
=
(3.49)
where 𝛼1 is derived from Eq. (3.48) considering 𝐶𝑎 2𝑚⁄ = −𝑙𝑛𝜀𝑎/𝜏𝑎 (Eq.3.46), such that:
1 cos( )2
a
a
CarcK m
α =
(3.50)
By minimizing the error between the target and assumed impact duration and
coefficient of restitution within a small tolerance level, the stiffness and the damping
constants can be subsequently obtained, such that:
min ( )afτ τ τ=∆ −
(3.51)
min ( )afε ε ε=∆ −
(3.52)
where 𝑓𝑚𝑖𝑛 denotes the error minimization function. The procedure to determine the
stiffness and damping coefficients for the contact pairs is illustrated in Figure 3.15. Using

93
the values of 𝜏 and 𝜀 estimated from the measured data, and absolute tolerance of 1e-15,
the error minimization process resulted in the stiffness and damping parameters for each
contact pair. The results are presented in Table 3.4.
Figure 3.15 : Procedure for determining stiffness and damping parameters for the contact
pair
Table 3.4 : Stiffness and damping parameters of different contact pairs
Contact pair Stiffness (kN/m) Damping (Ns/m) Striker and impact bolt 𝐾𝑆𝐵=10646.4 𝐶𝑆𝐵=33.9 Impact bolt and tool bit 𝐾𝐵𝑇=6832.7 𝐶𝐵𝑇=32.7
Impact bolt and tool body 𝐾𝐶𝐵=634.5 𝐶𝐶𝐵=148.1
3.7.2 Validation for the Contact Pairs
The component contact models are evaluated by assuming an approach velocity
(𝑉𝑎𝑝𝑝) of 5 m/s to determine the deformation and velocity responses due to contacts

94
between the striker and the impact bolt, the impact bolt and the tool bit, and the tool body
and the impact bolt. Figures 3.16 to 3.18 illustrate the responses of the impact pairs.
The results show that the peak relative deformations due to impacts between the
striker and the impact bolt (0.47 mm), and the impact bolt and tool bit (0.71 mm) are
reasonably small, which can be attributed to the high rigidity of the components and the
relatively low equivalent masses of these two impact pairs (Figures 3.16 and 3.17).
Moreover, the corresponding velocity responses are nearly symmetric, and the change in
the velocity during the impact is also reasonably small for these two impact pairs, which
conform to their relatively higher coefficients of restitution. However, the deformation
due to the contact between the impact bolt and tool body, is substantially higher in the
order of 2 mm (Figure 3.18). The velocity responses of the tool body and the impact bolt
pair are asymmetric due to the relatively lower coefficient of restitution. The separation
velocity (𝑉𝑠𝑒𝑝) of the impact bolt-tool body contact pair is also relatively small around
2.75 m/s, suggesting considerable energy loss attributed to the soft O-ring between the
impact bolt and the lower control disk. This is also partly attributable to the relatively
higher equivalent mass of the impact bolt-tool body contact pair.
Table 3.5 summarizes the impact durations observed from the simulation results for
the three contact pairs together with the target values. The results show slight deviations
between the simulation and target values. The duration of the impact between the impact
bolt and the tool body, obtained from the simulation, is particular higher (6.0%) than the
corresponding target value. Such deviations can be mostly attributed to the numerical
approximations, and the approximated impact durations and coefficients of restitution.

95
Figure 3.16 : (a) Relative deformation; and (b) velocity responses of the striker and the
impact bolt pair
Figure 3.17 : (a) Relative deformation; and (b) velocity responses of the impact bolt and
the tool bit pair
Figure 3.18 : (a) Relative deformation; and (b) velocity responses of the tool body and the
impact bolt pair

96
Table 3.5 : Comparisons of the target and the simulated impact durations for each impact pair
Contact pair Target (s) Simulation (s) Error Striker and impact bolt 3.0e-4 3.03e-4 1.0% Impact bolt and tool bit 4.5e-4 4.55e-4 1.3%
Impact bolt and tool body 1.5e-3 1.59e-3 6.0%
3.8 Summary
A dynamic model of a percussive chipping hammer is systematically developed
considering different component impact pairs. The high-magnitude impacts among the
three contact pairs are modeled considering the tool geometry and linear contact theory.
The model parameters of the contact pairs are derived from the available laboratory-
measured data through error minimization, which are subsequently validated via
simulations. A two-DOF contact model is also proposed in this chapter to characterize the
interactions between the tool tip and the workpiece. The biomechanical hand-arm and
gloved hand-arm models, developed in Chapter 2, are integrated to the tool model to
derive the coupled system models for parametric analyses in the following chapter.
97
CHAPTER 4
VALIDATION AND ANALYSIS OF INTEGRATED SYSTEM MODELS
4.1 Introduction
The nature of hand-transmitted vibration (HTV) from operation of power tools
mainly depends upon the type of power tool and the task (Nemani, 2005; Mallick, 2008;
2010). The variations in many design and operating factors, such as hand forces and
handle designs, may also affect the characteristics of HTV (Iwata et al., 1972; Pyykkö et
al., 1976; Hartung et al., 1993). A number of studies have reported that workers operating
percussion type tools are more prone to suffer from a high prevalence of vibration white
finger (VWF) than the other vibrating tool operators (Gurram, 1993; Nemani, 2005). This
is primarily due to high magnitude of vibration of the percussive type tools. The need for
control of percussive tool-generated vibrations has thus been widely emphasized. Apart
from applications of anti-vibration gloves or handle isolators, the designs of low-
vibration percussive tools would be more desirable for limiting the vibration exposure at
the source (Rakheja et al., 2002b), which necessitates developments in reliable dynamic
models of the coupled hand-tool-workpiece system.
The analysis of a coupled hand-tool-workpiece system model can yield a better
understanding of the factors affecting the nature of HTV and thus the guidance on the
desirable vibration attenuation mechanisms. In this study, the dynamic models of the
human hand-arm system (HAS) and the percussive chipping hammer operating within a
steel ball energy dissipator, developed in the previous chapters, are integrated for the
analysis of the coupled system model. The model validity is also examined through
comparisons of the model results with the laboratory measured data in terms of the

98
acceleration responses at the tool handle and the tool bit. Selected operating factors (tool
speed, hand-forces and the properties of the workpiece) are parametrically studied to
evaluate their influences upon the vibration characteristics of the tool and the HAS.
Furthermore, the influences of variations in the diameter of the upper chamber orifices
and the masses of the tool body, the striker, the impact bolt and the tool bit on the HTV
are explored through parametric sensitivity analyses in order to achieve tool design
guidance. The effectiveness of an anti-vibration glove is also investigated by assessing
the distributed vibration responses in the gloved-hand model developed in the previous
chapter.
4.2 Comparisons of Different Hand-Arm Vibration (HAV) Models Integrated to the
Tool Model
It has been shown that the selected biomechanical bent-arm model (Adewusi, 2009),
representing the anatomical structure of the human HAS with 90 degrees elbow angle and
0 degree shoulder abduction, and two driving-points (finger-handle and palm-handle
interfaces), yields reasonably good predictions of biodynamic responses in terms of
DPMI and vibration transmissibility. This model also resulted in relatively low
deformations under static push forces. Even though this model does not correspond to the
posture employed in the experimental study, the model is considered better suited for the
investigation of coupled hand-tool-workpiece system compared to the other models,
which generally yield unreasonably high deformations under static push forces (Rakheja
et al., 2002c).
In this study, the dynamic responses of the tool model are evaluated considering the
coupling with three different hand-arm system models. These include the bent-arm

99
biomechanical model, the single-DOF hand-arm model effective in the 20-100 Hz
frequency range (Reynolds and Soedel, 1972) and the four-DOF hand-arm model
described in ISO 10068 (1998). The responses of the three coupled hand-tool models are
evaluated and compared to gain some insights into the applicability of the hand arm
vibration (HAV) models. The coupled model simulations are performed using integration
time step of 8e-6 s and absolute tolerance of 1e-14, while the tool speed is considered to
be constant (1830 bpm). Furthermore, the net static hand force exerted by the hand on the
tool handle was considered as 75 N for all the models.
The simulation results in each case are compared with the available measured data
to examine the validity of the coupled hand-tool system in a qualitative manner. It should
be noted that the available measured data were limited to only tool bit and tool handle
accelerations, which are shown in Figures 4.1 and 4.2, respectively. The measurements at
the tool bit clearly show the fundamental frequency near 30.5 Hz, which corresponds to
the operating speed of 1830 bpm. The measurements at the tool handle also show the
presence of this fundamental frequency in addition to the other spectral components that
may be attributed to different impact pairs of the tool. It needs to be stated that the
reported measured data revealed substantial differences among the three trials even at the
lower speed of 1830 bpm, as it is evident in Tables 4.1 and 4.2. Such differences were
considerably large at a higher speed. These may be attributable to variations in the hand
posture, feed forces and impact forces within the energy dissipator, and possible loss of
contact between the tool tip and the steel balls. The last two trials, however, revealed
acceptable consistency, which were subsequently considered to obtain mean un-weighted

100
(𝑎𝑟𝑚𝑠) and weighted (𝑎𝑤𝑟𝑚𝑠) handle r.m.s. accelerations, and the mean peak tool bit
acceleration along the 𝑧ℎ-axis.
Figure 4.1 : Time-history of acceleration measured at the tool bit
(1830 bpm and 78 N push force)
Figure 4.2 : Time-history of acceleration measured at the tool handle
(1830 bpm and 78 N push force)

101
Table 4.1 : Peak tool bit acceleration magnitudes of the percussive tool measured in the lab (Adewusi, 2009)
Trial Downward (𝒎/𝒔𝟐) Upward (𝒎/𝒔𝟐) Trial 1 5927 4203 Trial 2 7445 5334 Trial 3 7960 5405
Table 4.2 : Peak un-weighted handle acceleration, and un-weighted and frequency-weighted r.m.s. handle accelerations of the percussive tool measured in the lab (Adewusi,
2009)
Trial Peak un-weighted handle acceleration
𝒂𝒓𝒎𝒔 (𝒎/𝒔𝟐) 𝒂𝒘𝒓𝒎𝒔 (𝒎/𝒔𝟐) Downward (𝑚/𝑠2) Upward (𝑚/𝑠2)
Trial 1 61.98 68.78 18.16 2.75 Trial 2 75.93 108.3 26.83 5.25 Trial 3 62.98 85.05 27.55 5.77
4.2.1 Single-DOF HAV Model
The single-DOF HAV model reported by Reynolds and Soedel (1972) was
integrated to the tool model described in Chapter 3. The simulation results of the coupled
hand-tool model were obtained in terms of accelerations of the tool body and the tool bit,
as shown in Figures 4.3 and 4.4, respectively. The results show somewhat comparable
peak acceleration of the tool bit with the measured data (Figure 4.1), while the peak
handle acceleration is substantially lower. The positive peak acceleration of the handle,
corresponding to the extension of the HAV model (tool’s downward motion), is
particularly lower (20.37 𝑚/𝑠2) compared to the measured peak acceleration, which is in
excess of 60 𝑚/𝑠2. Moreover, the accelerations of the tool body and the tool bit show
notable discontinuities, as seen in Figures 4.3 and 4.4. These are likely due to the low

102
resonance frequency (30.0 Hz) of the model, which is very close to the operating speed of
the tool (30.5 Hz).
(a)
(b)
Figure 4.3 : (a) Acceleration response of the tool body of the percussive tool coupled with the single-DOF HAV model; and (b) zoomed acceleration response
(1830 bpm and 75 N push force)

103
(a)
(b)
Figure 4.4 : (a) Acceleration response of the tool bit of the percussive tool coupled with the single-DOF HAV model; and (b) zoomed acceleration response
(1830 bpm and 75 N push force)

104
4.2.2 Four-DOF HAV Model
The tool-bit and tool-body acceleration responses were obtained through simulation
of the tool model coupled with the four-DOF HAV model reported in ISO-10068 (1998).
Figures 4.5 and 4.6 illustrate the time-histories of the resulting accelerations of the tool
body and the tool bit, respectively. The peak acceleration responses of the tool bit are
comparable to the measured data, while the fundamental frequency is identical to the
operating speed of 1830 bpm. The acceleration peaks of the tool body, however, are
substantially lower than those observed in the measured data. This is most likely
attributed to lack of consideration of the lower chamber pressure variations and the lower
resonance frequencies of the HAV model. Furthermore, it has been reported that this
model, owing to its very low stiffness values, would yield excessive static deflection
under a low to medium level hand push force (Rakheja et al., 2002c).
Figure 4.5 : Acceleration response of the tool body of the percussive tool coupled with
the four-DOF HAV model (1830 bpm and 75 N push force)

105
Figure 4.6 : Acceleration response of the tool bit of the percussive tool coupled with the
four-DOF HAV model (1830 bpm and 75 N push force)
4.2.3 Six-DOF Biomechanical HAV Model
Figures 4.7 and 4.8 illustrate the tool body and tool bit acceleration responses of the
tool model coupled with the six-DOF bent-arm HAV model. The tool bit acceleration
response exhibits peak magnitudes similar to those attained with the four-DOF HAV
model. Further, the peak magnitudes are comparable with the measured peaks (Figure
4.1). The magnitudes of tool body acceleration peaks, however, are significantly lower
than the measured peaks, as observed for the single- and four-DOF HAV models. The
fundamental frequency of the acceleration responses is identical to the operating speed.

106
Figure 4.7 : Acceleration response of the tool body of the percussive tool coupled with
the six-DOF HAV model (1830 bpm and 75 N push force)
Figure 4.8 : Acceleration response of the tool bit of the percussive tool coupled with the
six-DOF HAV model (1830 bpm and 75 N push force)

107
4.2.4 Discussions
As seen in Figures 4.3, 4.5 and 4.7, the tool model coupled the three different hand-
arm models yields lower peak handle (tool body) acceleration responses compared to
those observed from the measured data. The four-DOF HAV model yields the highest
positive acceleration peaks (31.03 𝑚/𝑠2) corresponding to downward motion of the tool.
The six-DOF biomechanical HAV model, on the other hand, yields the highest negative
acceleration peaks (51.16 𝑚/𝑠2), while its positive peak handle acceleration during the
downward acceleration motion of the tool, however, is substantially lower compared to
the measured peak acceleration. These differences can be attributed to the variations in
the structure and parameters of the selected hand-arm models as discussed in Chapter 2.
Table 4.3 summarizes the peak handle acceleration responses of the tool model
with three different HAV models. All the hand-arm models yield highly asymmetric
acceleration responses of the tool handle. This asymmetry is also evident in the measured
data (Figure 4.2 and Table 4.2), which is likely caused by the air pressure variations in
the controlled chambers and the loss of contact of the tool bit with the steel balls in the
energy dissipater. The human hand-arm system also exhibits asymmetric behavior in
compression and rebound, while the reported models are generally linear and thus do not
describe the asymmetric responses. The measured data show peak accelerations during
downward and upward tool motions of 69.46 𝑚/𝑠2 and 96.68 𝑚/𝑠2 (Table 4.3),
respectively. The differences between the peak tool body acceleration responses of the
coupled tool-hand models and the measured data are partly believed to be caused due to
lack of consideration of variations in the lower chamber pressure.

108
Table 4.3 : Comparisons of peak handle acceleration responses of the percussive tool coupled with different hand-arm vibration models with the mean measured values
Model type Downward (𝒎/𝒔𝟐) Error (%)
Upward (𝒎/𝒔𝟐)
Error (%)
Measured data 69.46 - 96.68 - Single-DOF hand-arm model 20.37 70.7 37.22 61.5 Four-DOF hand-arm model 31.03 55.3 45.46 53.0 Six-DOF hand-arm model 28.87 58.4 51.16 47.1
The coupled hand-tool models, however, yield somewhat comparable tool bit peak
acceleration responses, which are summarized in Table 4.4. These observations suggest
that the modeling of the contact between the tool bit and the workpiece may be
considered reasonable for the energy dissipator used in the study. However, it should be
noted that the single-DOF HAV model yields notable discontinuities in the acceleration
responses, although it reveals the least deviations from the measured peak accelerations,
as seen in Figures 4.3 and 4.4. It should be also noted that the low-magnitude oscillations,
preceding the primary peaks in the tool-bit acceleration response, are not evident in the
model results. These differences are likely due to limitations of the tool tip-workpiece
contact model, since it does not permit separation between the tool tip and the steel balls,
as described in Chapter 3.
The comparison of the peak tool bit acceleration responses of the coupled hand-tool
models suggests that the tool model can provide reasonably good prediction of the tool
bit responses. The lower handle acceleration responses suggest the need for developing
more effective and perhaps nonlinear models of the hand-arm system, as well as
consideration of the variations in the lower chamber pressure.

109
Table 4.4 : Comparisons of peak tool bit acceleration responses of the percussive tool model coupled with different HAV models with the mean measured values
Model type Downward (𝒎/𝒔𝟐)
Error (%)
Upward (𝒎/𝒔𝟐)
Error (%)
Measured data 7702.50 - 5369.50 - Single-DOF hand-arm model 7349.46 4.6 6586.28 22.7 Four-DOF hand-arm model 8101.12 5.2 7193.93 34.0 Six-DOF hand-arm model 8297.81 7.7 7398.40 37.8
Table 4.5 summarizes the un-weighted and frequency-weighted r.m.s. accelerations
due to handle vibration responses of the three coupled hand-tool models together with
those obtained from the measured data. The un-weighted r.m.s. handle accelerations of all
of the coupled hand-tool models, are substantially lower than that of the measured data,
as it is also evident from the peak acceleration responses. The single-DOF hand-arm
model resulted in largest deviations (42.4% and 58.6%) from the measured un-weighted
and frequency-weighted r.m.s. values, while the four-DOF and six-DOF hand-arm
models reveal lower deviations. It should be noted that the frequency-weighted r.m.s.
acceleration values of all the models are lower than the un-weighted values. This is due to
characteristics of the 𝑊ℎ-weighting filter (ISO 5349-1, 2011), which tends to attenuate
vibration at frequencies above 12.5 Hz.
Among the three HAV models considered in this study, the biomechanical HAV
model is considered better suited for the development of the coupled hand-tool-
workpiece model as it also permits the analysis of distributed vibration dosages in the
substructures of the human HAS under the bent-arm posture and the assessment of
gloved HAS using the two driving points (fingers and palm).

110
Table 4.5 : Comparisons of un-weighted and frequency-weighted r.m.s. handle acceleration responses of different hand-tool system models with the measured values
Model type 𝒂𝒓𝒎𝒔 (𝒎/𝒔𝟐) Error (%) 𝒂𝒘𝒓𝒎𝒔 (𝒎/𝒔𝟐) Error
(%) Measured data 27.19 - 5.51 -
Single-DOF hand-arm model 15.65 42.4 8.74 58.6 Four-DOF hand-arm model 17.49 35.7 7.06 28.1 Six-DOF hand-arm model 18.74 31.1 7.33 33.0
4.3 Analyses of Interactions among the Impact Pairs
The interactions among the different impact pairs of the coupled hand-tool model
are analyzed to gain additional insights into the dynamic performances of the tool. The
pressure variations in the upper chamber and the acceleration responses of the striker and
the impact bolt are obtained for 30 N grip force and 75 N push force applied to the
percussive tool model operating at the rate of 1830 bpm.
Figure 4.9 illustrates the variations in the absolute pressure of air in the upper
chamber over three consecutive blows. The chamber pressure varies in a steady-state
manner from 0.08 to 0.48 Mpa. The striker approaches near 1.4e3 𝑚/𝑠2 downward
acceleration, when the upper chamber pressure approaches its peak value, as seen in
Figure 4.10. The striker subsequently impacts the impact bolt leading to high-magnitudes
of upward accelerations of the striker (near 3.0e4 𝑚/𝑠2). The impact bolt, subsequently
collides with the tool bit after the first impact with the striker and experiences
acceleration peak as high as 2.6e4 𝑚/𝑠2 in the downward direction followed by high
rebound acceleration peak around 2.9e4 𝑚/𝑠2, as seen in Figure 4.11. Furthermore, the
lower-magnitude accelerations of the impact bolt, observed after the primary peaks in the

111
upward direction, can be attributed to the impacts following the primary contact between
the impact bolt and the tool bit.
The primary peaks in the acceleration response of the tool bit are the result of
contacts between the impact bolt and the tool bit, and the tool tip and the workpiece. The
upward tool body acceleration response, as seen in Figure 4.7, is mostly affected by the
variations in the air pressure, while the downward response can be partly attributed to the
static push force and the dynamic hand force exerted on the tool handle, and the weight
of the tool body. It should be noted that the impact between the impact bolt and the tool
body does not occur at the selected speed of 1830 bpm. This can be attributed to lack of
consideration of the pressure variations in the lower chamber, and the masses of the
upper control disk and the control bushing in the modeling process.
Figure 4.9 : Pressure variations in the upper chamber of the percussive tool coupled with
the six-DOF HAV model (1830 bpm, 30N grip and 75N push forces)

112
Figure 4.10 : Acceleration response of the striker of the percussive tool coupled with the
six-DOF HAV model (1830 bpm, 30N grip and 75N push forces)
Figure 4.11 : Acceleration response of the impact bolt of the percussive tool coupled with
the six-DOF HAV model (1830 bpm, 30N grip and 75N push forces)

113
4.4 Design Parameter Sensitivity Analyses
Apart from operating a vibrating tool at a suitable speed or maintaining the tool in a
good condition, suppression of tool-generated HTV may be achieved using three methods:
(i) isolating hands from the vibrating handles though anti-vibration materials or gloves;
(ii) isolating tool handles from the vibrating source via handle isolators; and (iii) designs
of low-vibration emission power tools or vibration control mechanisms.
Substantial efforts have been made towards the designs of anti-vibration materials
and handle isolators, since these can be implemented with greater ease (Gurram et al.,
1994; Dong et al., 2005; 2009; Suggs and Abrams, 1983; Oddo et al., 2004; Ko et al.,
2011). However, designs of low-vibration hand-held tool may be far more efficient in
controlling the vibration at the source. Optimal designs of the power tools, such as tool or
components weight, components materials and sizes, may contribute to reduction of
vibration at the source. In this study, the analytical model of the chipping hammer is
utilized to explore the effects of variations in selected tool design parameters on the tool
vibration. These include: (i) the diameter of the orifices in the upper chamber; (ii) the
weight of the tool body; (iii) the weight of the striker; (iv) the weight of the impact bolt;
and (v) the weight of the tool bit. The effects of the anti-vibration glove parameters on
the vibration transmitted to the hand-arm system is further investigated. The simulation
results are obtained for constant tool speed of 1830 bpm, while coupled with the
biomechanical HAV model with 30 N grip force and 75 N push force.
4.4.1 Diameter of the Upper Chamber Orifices
The variations in the diameter of the upper chamber orifices could affect the
pressure buildup in the upper chamber and thus the forces acting on the striker, the

114
impact bolt, the tool bit and the tool body. In this study, the simulations are performed by
varying the orifice diameter from -40% to +50% of the nominal diameter. The ‘orifice
factor’ in Table 4.6 refers to the orifice diameter normalized by the nominal diameter.
The table summarizes the effect of orifice diameter on the maximum and minimum upper
chamber (U.C.) pressures, and r.m.s. acceleration responses of the tool bit and the tool
body.
Table 4.6 : Influence of variations in the orifice diameter on the upper chamber pressure and acceleration responses of the tool bit and the tool body
Orifice factor
U.C. pressure (Pa) r.m.s. accelerations (𝑚/𝑠2)
Maximum Minimum Too bit Tool body (un-weighted)
Tool body (weighted)
0.60 493679 80659 982.54 19.23 7.51 0.90 485092 81769 976.89 18.84 7.37 1.00 483007 82049 975.55 18.74 7.33 1.25 479066 82603 972.02 18.56 7.26 1.50 476080 83021 968.12 18.43 7.20
Figure 4.12 further shows the effect of variations in the orifice diameters on the
variations in the upper chamber air pressure during two consecutive blows. The results
show that decreasing the orifice diameter causes more notable pressure variations in the
upper chamber. This is also evident from the differences between the maximum and
minimum pressures presented in Table 4.6. The variations in the upper chamber pressure
can be attributed to the variations in the position of the orifices relative to the striker and
thereby the effective orifice opening. A smaller orifice also causes the upper chamber
pressure to drop below the atmospheric pressure as the piston retracts from its bottom
most position, as seen in Figure 4.12. Increasing the orifice opening causes the upper
chamber pressure to drop to the atmospheric pressure more rapidly as the striker

115
approaches the impact bolt. Figure 4.13 illustrates the variations in the opening of the
orifices in terms of area fraction, 𝐶𝐴𝑈.
The higher pressure difference due to lower orifice opening would result in higher
striker impact force and thereby higher r.m.s. acceleration of the tool bit, as seen in Table
4.6. The un-weighted and frequency-weighted r.m.s. accelerations of the tool body also
increase with lower diameter orifices. The results suggest that increasing the diameter of
the upper chamber orifices may yield some degree of vibration control. A large increase
in the orifice diameter, however, would adversely affect the cutting force due to reduced
pressure buildup.
Figure 4.12 : Influence of orifice diameter on the pressure variations in the upper
chamber (1830 bpm, 30 N grip and 75 N push)

116
Figure 4.13 : Influence of orifice diameter on the effective opening of the upper chamber
orifices (1830 bpm, 30 N grip and 75 N push)
4.4.2 Tool Body Weight
The variations in the weight of the tool body affect the deflection of the spring and
thereby the position of the control bushing, which may affect the opening of the upper
and lower chamber orifices. Furthermore, the tool body weight directly affects the tool
body acceleration, as it is seen in Eq. (3.18). The simulation model developed in this
study does not permit the analysis of the effect of the control bushing position on the air
flows through the lower chamber orifices, since the lower chamber pressure is assumed to
remain constant. The model, however, could be applied to study the inertia effect on the
upper chamber orifices opening and the tool body acceleration. The simulations are
performed by varying the tool body weight from -25% to +25% of the nominal value,

117
while the tool speed is 1830 bpm. The ‘𝑀𝑐 factor’ in Table 4.7 refers to the tool body
weight normalized by the nominal value.
Table 4.7 : Influence of variations in the tool body weight on the upper chamber pressure and acceleration responses of the tool bit and the tool body
𝑀𝑐 factor
U.C. pressure (Pa) r.m.s. accelerations (𝑚/𝑠2)
Maximum Minimum Too bit Tool body (un-weighted)
Tool body (weighted)
0.75 458263 83160 925.11 23.44 9.32 1.00 483007 82049 975.55 18.74 7.33 1.25 630302 66336 1036.05 18.58 6.57
The results in Table 4.7 show substantially higher difference between the
maximum and minimum upper chamber pressures, when the tool body weight is
increased to 125% of its nominal value, leading to higher r.m.s. acceleration value of the
tool bit. This is mostly caused by reduced opening of the upper chamber orifices during
each cycle, as seen in Figure 4.14, due to overlapping of the control bushing over the
upper chamber orifices.
The un-weighted and weighted r.m.s. accelerations of the tool body, however,
decrease with higher tool weight, as seen in Table 4.7. The peak tool body acceleration
decreases during the downward stroke, considering for the higher tool weight, as seen in
Figure 4.15. The peak tool body acceleration during the downward stroke is
approximately 25 𝑚/𝑠2, which is substantially lower than that observed for the lower
tool weight (60 𝑚/𝑠2 for 𝑀𝑐 factor=0.75). The downward acceleration peaks,
corresponding to the lower tool body weight, however, exhibit considerable variations.
This was suspected to be caused by occasional loss of contact between the control
bushing and the upper control disk. The loss of contact would occur during downward

118
motion of the upper control disk, which results in total relaxation of the spring, as it is
evident from the time history of the spring force shown in Figure 4.16. The intermittent
loss of contact between the control bushing and the upper control disk during some of the
blow cycles causes rapid oscillations in the spring force, leading to relatively higher
acceleration peaks.
The results suggest that increasing the tool body weight would be beneficial in not
only reducing the tool body acceleration but also in enhancing the cutting force. A higher
tool weight, however, would cause greater stresses in the musculoskeletal structure of the
operator (Herberts et al., 1984).
Figure 4.14 : Influence of tool body weight on the effective opening of the upper chamber
orifices (1830 bpm, 30 N grip and 75 N push)

119
Figure 4.15 : Influence of tool body weight on the acceleration response of the tool body
(1830 bpm, 30 N grip and 75 N push)
Figure 4.16 : Influence of tool body weight on the response of the spring force
(1830 bpm, 30 N grip and 75 N push)

120
4.4.3 Weights of the Striker, the Impact bolt and the Tool Bit
The weight of the striker may affect the magnitude of the impact forces imparted to
the impact bolt and the tool bit. The effect of variations in the striker weight on the upper
chamber air pressure and tool responses are thus investigated by varying the striker
weight by -20% to +15% about the nominal value. The ‘𝑀𝑠 factor’, in Table 4.8, refers to
the striker weight normalized by the nominal value. An increase in the striker weight also
reduces the effective orifices opening and thereby causes higher difference between the
maximum and minimum upper chamber pressures, as it is seen in Table 4.8. This causes
the tool body and tool bit accelerations to increase.
Table 4.8 : Influence of variations in the striker weight on the upper chamber pressure and acceleration responses of the tool bit and the tool body
𝑀𝑠 factor
U.C. pressure (Pa) r.m.s. accelerations (𝑚/𝑠2)
Maximum Minimum Too bit Tool body (un-weighted)
Tool body (weighted)
0.80 478419 82697 955.98 17.84 6.82 1.00 483007 82049 975.55 18.74 7.33 1.15 501403 88517 1055.00 21.03 8.34
Tables 4.9 and 4.10 present the influences of variations in the weights of the impact
bolt and the tool bit, respectively, on the maximum and minimum upper chamber
pressure, and the r.m.s. acceleration responses. The results are presented for ±10%
variations in the weights of the impact bolt and the tool bit about the respective nominal
values.

121
Table 4.9 : Influence of variations in the impact bolt weight on the upper chamber pressure and acceleration responses of the tool bit and the tool body
𝑀𝑏 factor
U.C. pressure (Pa) r.m.s. accelerations (𝑚/𝑠2)
Maximum Minimum Too bit Tool body (un-weighted)
Tool body (weighted)
0.90 478782 83433 986.42 18.58 7.28 1.00 483007 82049 975.55 18.74 7.33 1.10 487069 80374 987.06 18.89 7.39
Table 4.10 : Influence of variations in the tool bit weight on the upper chamber pressure and acceleration responses of the tool bit and the tool body
𝑀𝑡 factor
U.C. pressure (Pa) r.m.s. accelerations (𝑚/𝑠2)
Maximum Minimum Too bit Tool body (un-weighted)
Tool body (weighted)
0.90 488023 80293 1075.97 18.93 7.41 1.00 483007 82049 975.55 18.74 7.33 1.10 478187 83553 891.04 18.56 7.27
The results suggest small effects of the weight variations on the tool body
acceleration responses. An increase in the tool bit weight results in relatively lower tool
bit peak acceleration and thereby lower peak upper chamber pressure. An increase in the
impact bolt mass, on the other hand, causes higher peak pressure and only slight
variations in the r.m.s. acceleration of the tool bit. The variations in both weights also
affect the magnitudes of impact forces and displacements of the tool components (striker,
impact bolt, upper control disk and control bushing) only slightly. These subsequently
affect the effective orifices opening and the air pressure in the upper chamber.
4.4.4 Discussions
Increasing the diameter of the upper chamber orifice, the weights of the tool body
and the tool bit, or decreasing the weights of the striker and the impact bolt could yield

122
reductions in the magnitude of HTV. Furthermore, the variations in the weights of the
tool body and the striker reveal more vibration reductions than those in the weights of the
impact bolt and the tool bit. The motions of the tool body and the striker affect the
pressure variations in the upper chamber, while the motions of the impact bolt and the
tool bit have relatively little influence on the pressure variations in the upper chamber.
It should be noted that increasing the diameter of the upper chamber orifices
resulted in relatively smaller vibration attenuation effect compared to those due to
variations in the weights of the tool body and the striker. The relatively lower influence
of orifice diameter variations is partly believed to be caused due to lack of consideration
of the lower chamber pressure variations in the model. Furthermore, it is noted that
dynamic motions of the striker, the impact bolt, the tool bit and the tool body affect the
air pressure variations in the upper chamber in a highly complex manner, which is mostly
due to highly nonlinear variations in the effective opening area of the upper chamber
orifices. In this regard, further simulations considering the variations in the lower
chamber pressure would be highly desirable.
4.4.5 Anti-Vibration Glove
The gloved hand-arm model, developed in Chapter 2, is used to study the vibration
attenuation effectiveness of an air bladder glove, when coupled with the tool model. The
tool speed is considered to be constant (1830 bpm), while the biomechanical hand-arm
vibration model, corresponding to 30 N grip force and 75 N push force, is applied in the
coupled glove-hand-tool-workpiece system model. Simulation results obtained for the
coupled model with and without the glove are analyzed in terms of the un-weighted r.m.s.
accelerations distributed in the fingers, palm, forearm and the upper arm of the

123
biomechanical HAV model. The results are also compared to assess the vibration
isolation effectiveness of the glove.
The effect of variations in the design parameters of the anti-vibration glove, the
visco-elastic properties of the materials attached to the fingers (𝑘𝑔1 and 𝑐𝑔1) and the palm
(𝑘𝑔2 and 𝑐𝑔2 ), are also investigated to attain a better understanding on the vibration
attenuation performances of the glove. For this purpose, the stiffness of the finger-side
isolation material is varied from 0.5 to 4.0 times the nominal stiffness reported by Dong
et al. (2009). The stiffness of palm-side isolation material is varied from 0.5 to 1.5 times
the nominal stiffness. The damping constants of the finger- and palm-side materials are
varied by ±50% about the respective nominal values.
Table 4.11 : Influence of variations in the glove material properties on the un-weighted r.m.s. accelerations distributed at different HAS segments
Fingers (𝑚/𝑠2)
Palm (𝑚/𝑠2)
Forearm (𝑚/𝑠2)
Upper Arm (𝑚/𝑠2)
Bare Hand 21.16 18.47 9.42 4.90 Gloved (nominal) 23.17 16.95 9.13 5.02
𝑘𝑔1*0.50 24.59 16.96 9.13 5.02 𝑘𝑔1*1.50 22.61 16.95 9.12 5.02 𝑘𝑔1*2.00 22.32 16.95 9.12 5.02 𝑘𝑔1*4.00 21.91 16.95 9.12 5.02 𝑘𝑔2*0.50 23.38 15.25 8.44 4.76 𝑘𝑔2*1.50 23.06 17.50 9.27 5.01 𝑐𝑔1*0.50 23.28 16.95 9.13 5.02 𝑐𝑔1*1.50 23.06 16.95 9.13 5.02 𝑐𝑔2*0.50 23.22 17.21 9.25 5.08 𝑐𝑔2*1.50 23.13 16.74 9.01 4.96
Table 4.11 summarizes the effect of variations in the glove material properties on
the r.m.s. accelerations due to tool vibration transmitted to the fingers, palm, forearm and

124
the upper arm. The vibration responses of the hand-arm system coupled with the tool
without the glove shows lower vibration of the forearm and the upper arm, compared to
that of the palm. This is attributed to absorption of vibration into the hand-arm system
(Dong et al., 2005c; Adewusi, 2009). The vibration transmitted to the fingers mass tends
to be the highest, which is attributed to higher resonance frequency of the fingers
compared to the hand-arm system. The addition of the glove results in reduction of
vibration transmitted to the palm and the forearm with amplification of vibration at the
fingers and the upper arm.
It should be noted the fundamental frequency of the tool-handle vibration is 30.5
Hz. It has been shown that the hand-arm system tends to transmit only low frequency
vibration to the upper arm and the whole-body. Gloves are generally designed to achieve
relatively lower stiffness of the palm-side vibration isolation material, since the
standardized assessment method (ISO 10819, 2013) is based only on the palm-side
vibration transmissibility. The finger-side material, on the other hand, exhibits
considerably higher stiffness. The high material stiffness coupled with higher natural
frequency of the fingers, is the likely cause of amplification of the tool handle vibration
to the finger-side of the hand (Dong et al., 2009). The relatively soft palm side material,
on the other hand, transmits higher levels of low frequency vibration to the upper arm.
The results suggest only limited vibration attenuation effect by the glove in view of
the un-weighted r.m.s accelerations of the palm and forearm, while the anti-vibration
glove tends to amplify the vibrations transmitted to the fingers and the upper arm. The
results further show that increasing finger-side material stiffness (𝑘𝑔1) yields notable
vibration reductions for the fingers, while an increase in material damping (𝑐𝑔1) provides

125
small vibration reduction for the fingers. The un-weighted r.m.s. acceleration of the
fingers’ mass, however, is still higher than that obtained for the bare hand. It can be
concluded that the glove materials do not help attenuation of the handle vibration
transmitted to the fingers’ mass.
The vibration transmission to the palm, however, can be considerably reduced by
decreasing the palm-side glove material stiffness (𝑘𝑔2 ) and increasing the material
damping (𝑐𝑔2). The low stiffness and high damping of the palm-side material also yields
notable reductions in the vibrations transmitted to the forearm and the upper arm.
Reducing the palm-side stiffness, however, may increase the glove material thickness and
thereby affect the hand dexterity in an adverse manner.
4.5 Influences of Tool Operating Factors
The dynamic performances of percussive tools and the HTV exposure may be
strongly affected by variations in the operating conditions, such as the properties of
workpiece, tool maintenance, operating speed, hand-arm posture and hand forces. It is,
however, recognized that control of many of these operating factors would be very
difficult due to various constraints posed by the work environment and the productivity
demands. This study is thus limited to the effects of variations in the push force,
operating speed and the parameters of the tool tip-workpiece contact model on the
dynamic performances of the integrated hand-tool-workpiece system model.
4.5.1 Static Push Force
Hand forces, applied to the tool handles for the guidance and control of power tools,
play an important role in the dynamic performances of the coupled hand-tool system. The

126
influences of hand-grip and push forces on the biodynamic responses of the human HAS
have been extensively studied through laboratory experiments (Iwata et al., 1972; Pyykkö
et al., 1976; Hartung et al., 1993; Kihlberg, 1995). These have shown increases in the
resonant frequencies and driving-point impedance of the HAS under increasing grip and
push forces.
The effects of hand forces on the tool vibration transmission, however, have not
been reported. In this study, the model simulations are performed considering two levels
of the hand push force (50 N and 75 N), while the hand grip force is held as 30 N. The
HAV model parameters corresponding to the two push-grip force combinations are taken
as those reported by Adewusi (2009). Table 4.12 summarizes the effect of hand push
force on the model responses in terms of r.m.s. accelerations of the tool tip and the tool
body, and peak tool-tip cutting force.
Table 4.12 : Influence of variations in the push force on the peak tool-tip cutting force and acceleration responses of the tool bit and the tool body
Push force (N)
Peak tool-tip cutting force (N)
r.m.s. accelerations (𝑚/𝑠2)
Too bit Tool body (un-weighted)
Tool body (weighted)
50 3658.76 893.95 17.62 7.21 75 3755.85 975.55 18.74 7.33
Figures 4.17 and 4.18 illustrate the effect of hand push force on the upper chamber
orifices opening and the air pressure. The results suggest that decreasing the push force
increases the duration of the full opening of the upper chamber orifices and reduces the
peak pressure in the upper chamber. The lower air pressure subsequently results in lower
magnitude of impacts between the striker and the impact bolt, and the impact bolt and the

127
tool tip, as seen in Figures 4.19 and 4.20, respectively, leading to lower r.m.s.
accelerations of the tool bit and tool body, as seen in Table 4.12. This further results in
lower peak cutting force of the tool tip and leads to lower impact force of the tool bit
against the impact bolt, which may cause intermittent loss of contact of the impact bolt
with the upper control disk. In this case, the control bushing tends to seat on the lower
control disk and diminishes the spring force exerted on the tool body, as seen in Figure
4.21.
Through laboratory measurements, it has been reported that the handle vibrations
of the tool, expressed in terms of un-weighted and frequency-weighted r.m.s
accelerations, increase as the push force decreased from 118 N to 78 N under the tool
speed of 1830 bpm (Adewusi, 2009). The simulation results, however, show an opposite
tendency, while only very little data exists to understand the sources of this discrepancy.
Figure 4.17 : Influence of push force on the effective opening of the upper chamber
orifices (1830 bpm and 30 N grip force)
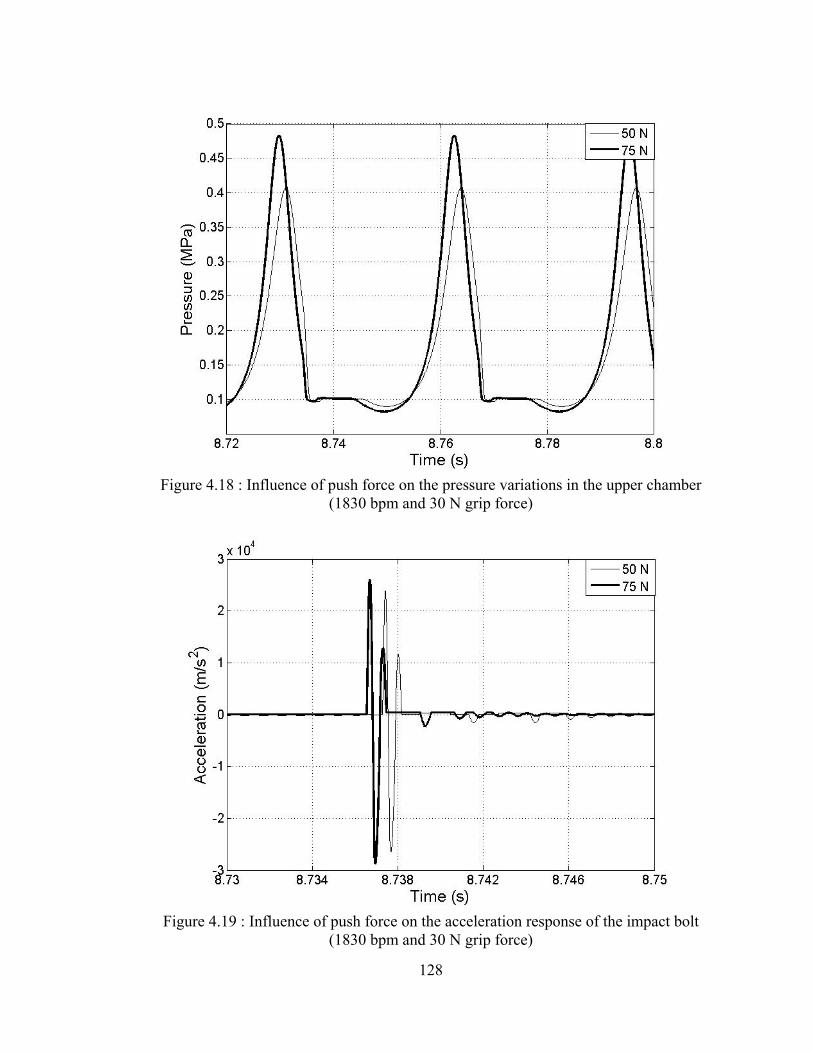
128
Figure 4.18 : Influence of push force on the pressure variations in the upper chamber
(1830 bpm and 30 N grip force)
Figure 4.19 : Influence of push force on the acceleration response of the impact bolt
(1830 bpm and 30 N grip force)

129
Figure 4.20 : Influence of push force on the acceleration response of the tool bit
(1830 bpm and 30 N grip force)
Figure 4.21 : Influence of push force on the response of the spring force
(1830 bpm and 30 N grip force)

130
4.5.2 Tool Speed
The selected percussion tool (BOSH, 11313 EVS) allows operator to customize the
speed from 1300 to 2600 bpm. Increasing the motor speed will likely results in
considerably higher pressure variations in the upper chamber and thereby higher impact
forces and vibrations of the coupled hand-tool system. In this study, the simulations are
performed for three different operating speeds (1300, 1830 and 2600 bpm) denoted as
‘low’, ‘medium’ and ‘high’ speeds, while the HAV model is integrated considering 30 N
grip and 75 N push forces. The results, summarized in Table 4.13, clearly show that
increasing the tool speed causes substantially higher tool vibration and the peak cutting
force. This is due to higher upper chamber pressure at higher speeds, as seen in Figure
4.22. Under the high speed (2600 bpm), the peak air pressure in the upper chamber
increases substantially and approaches 1.0 Mpa, which would lead to far more significant
impacts among tool components. The peak accelerations of the tool bit and the peak tool-
tip cutting force thus increase significantly, as seen in Figure 4.23 and Table 4.13.
Table 4.13 : Influence of variations in the tool speed on the peak tool-tip cutting force and acceleration responses of the tool bit and the tool body
Speed (bpm)
Peak cutting force (N)
Peak tool bit acceleration (𝑚/𝑠2)
r.m.s. accelerations of tool body (𝑚/𝑠2)
Downward Upward Un-weighted Weighted 1300 1522.65 2999.54 2781.96 10.13 7.15 1830 3755.85 8297.81 7398.40 18.74 7.33 2600 6040.62 13712.84 11065.86 43.58 11.77
The un-weighted and frequency-weighted accelerations of the tool body are
observed to increase by 330.2% and 64.6%, respectively, when the tool speed is
increased from 1300 to 2600 bpm, which is directly attributed to higher impact forces and

131
considerably higher pressure variations in the upper chamber. This is also clearly evident
from the time-histories of the tool body acceleration responses, as shown in Figure 4.24.
Furthermore, the upper control disk tends to lose contact with the control bushing under
the high tool speed (2600 bpm). This causes intermittent rapid variations in the spring
force exerted on the tool body, as seen in Figure 4.25. The rapid variations in the spring
force also result in sharp discontinuities in the tool body acceleration responses, as shown
in Figure 4.24.
Figure 4.22 : Influence of tool speed on the pressure variations in the upper chamber
(30N grip and 75N push forces)

132
Figure 4.23 : Influence of tool speed on the acceleration response of the tool bit
(30N grip and 75N push forces)
Figure 4.24 : Influence of tool speed on the acceleration response of the tool body
(30N grip and 75N push forces)

133
Figure 4.25 : Influence of tool speed on the response of the spring force
(30N grip and 75N push forces)
4.5.3 Tool Tip-Workpiece Contact Model
The diversity among different types of workpiece may significantly affect the work
quality, tool durability and the dynamic performances of the coupled hand-tool system.
However, very few studies have been attempted to evaluate the influences of different
types of workpiece on the dynamics of coupled hand-tool system, which is likely due to
limited knowledge of the properties of work materials and the contact model.
In this study, simulations of the coupled hand-tool-workpiece system model are
performed to study the influences of different contact model parameters that may be
related to different workpiece properties. These include the elastic zone stiffness (𝐾𝐸),
and stiffness and damping properties (𝐾𝑃 and 𝐶𝑃 ) of the plastic substratum of the
workpiece (steel balls). Table 4.14 illustrates the effect of the variations in 𝐾𝐸, 𝐾𝑃 and 𝐶𝑃

134
on the acceleration responses of the coupled hand-tool model, by varying 𝐾𝐸, 𝐾𝑃 and 𝐶𝑃
from -25% to +25% of the respective nominal values.
Table 4.14 : Influence of variations in the parameters of the tool tip-workpiece contact model on the acceleration responses of the tool bit and the tool body
Parameter
Factor
Peak tool bit acceleration (𝑚/𝑠2)
r.m.s. accelerations (𝑚/𝑠2)
Tool bit Tool body (un-weighted)
Tool body (weighted) Downward Upward
𝐾𝐸 0.75 8635.39 7002.84 1025.97 18.83 7.37 1.00 8297.81 7398.40 975.55 18.74 7.33 1.25 8013.78 7640.55 931.63 18.66 7.30
𝐾𝑃 0.75 8300.15 7359.74 971.39 18.74 7.33 1.00 8297.81 7398.40 975.55 18.74 7.33 1.25 8296.49 7437.26 980.06 18.74 7.33
𝐶𝑃 0.75 8424.27 6508.90 931.42 18.78 7.35 1.00 8297.81 7398.40 975.55 18.74 7.33 1.25 8213.94 8075.22 1028.46 18.71 7.32
Table 4.14 shows that increasing the elastic zone stiffness (𝐾𝐸 ) would lead to
higher upward and lower downward peak accelerations of the tool bit. The higher elastic
zone stiffness further lower the oscillations following the primary peaks, leading to lower
r.m.s. acceleration of the tool bit. An increase in the plastic zone stiffness (𝐾𝑃) also leads
to higher upward and lower downward peak accelerations of the tool bit, while it slightly
increases the magnitudes of oscillations following the primary peaks and the r.m.s.
acceleration of the tool bit. These can be attributed to the relatively lower stiffness of
plastic zone and the structure of the tool tip-workpiece contact model. Similar trends are
also observed from the acceleration responses of the tool bit by increasing the damping
(𝐶𝑃) of the plastic zone, as seen in Table 4.14.

135
On the other hand, the variations in the parameters of the contact model yields
relatively lower influences on the r.m.s. accelerations of the tool body. These can be
attributed to the slight variations in the impact forces and displacements of the tool
components. The simulation results suggest that the acceleration responses of the tool bit
are more sensitive to the parameter variations in the contact model than those of the tool
body.
4.6 Summary
The dynamic responses of the percussive tool model are evaluated considering the
coupling with three different hand-arm system models. It is showed that the percussive
tool model, coupled with the biomechanical hand-arm vibration model, can yield
somewhat reasonable dynamic performances compared with the available measured data.
Parametric sensitivity analyses are performed by varying the diameter of the upper
chamber orifices and the weights of tool components to explore a design guidance for
low vibration emission tool. The effectiveness of an anti-vibration glove is also
investigated by assessing the distributed vibration responses in the gloved-hand model.
Moreover, the effects of variations in the push force, operating speed and the parameters
of the tool tip-workpiece contact model on the dynamics of the integrated hand-tool-
workpiece system model are also investigated. Conclusions and suggestions are further
stated in the following chapter for future work.

136
CHAPTER 5
CONCLUSIONS AND RECOMMENDATIONS FOR FUTURE WORK
5.1 Major Contributions of the Study
The main focus of this research dissertation is to investigate the dynamic responses
of a hand-held percussive tool integrated with the human hand-arm system (HAS) model,
while operating within a steel ball energy dissipator. The major contributions include the
developments of the integrated hand-tool-workpiece and glove-hand-tool-workpiece
system models, together with identifications of the contact pair models. Parametric
sensitivity analyses were performed by varying selected design parameters and operating
factors, in order to gain insight into design guidance towards a low vibration tool and for
identification of favorable operating conditions. Moreover, this study also focused on the
vibration attenuation effectiveness of an anti-vibration glove so as to seek design
guidance on vibration isolation materials employed in the glove. The major highlights
and contributions of this study are summarized below:
• A push force-dependent biomechanical model of the hand-arm system in the bent-arm
posture was evaluated in terms of natural frequencies, deflections under different
static feed forces, driving point mechanical impedance (DPMI) and vibration
transmissibility, for integration to the tool model;
• A nonlinear dynamic model of a percussion demolition hammer was developed to
characterize its vibration performances along the 𝑧ℎ -axis. The validity of the tool
model was examined using available laboratory-measured data, which was further
used to identify the parameters of the major contact pair models;
137
• A two degrees-of-freedom contact model was developed to describe the dynamic
interactions between the tool tip and the steel-ball energy dissipator;
• An eight-DOF integrated gloved-hand model was developed to study the vibration
performances of an anti-vibration glove along the 𝑧ℎ-axis.
5.2 Conclusions
• The biomechanical model of the hand-arm system provided a low static deflection of
the hand-arm (40.75 mm) under a 50 N push force, while the total deflection under 75
N push force was considerably higher (187.06 mm). The model provided reasonably
good predictions of the biodynamic responses of the human hand-arm system in terms
of DPMI and vibration transmissibility;
• The hand-arm vibration model, reported in ISO 10068 (1998), yielded excessive
deflections of the hand-arm and is not adequate for integration to the tool model;
• Three linear contact models, describing the contacts between the striker and impact
bolt, the impact bolt and the tool bit, and the impact bolt and the tool body, yielded
relatively good dynamic performances in view of components deformations and
rebound velocity responses;
• The contact pair models revealed reasonably good predictions of the impact durations.
The highest deviation was in the order of 6% for the impact between the impact bolt
and tool body;
• The percussive tool model coupled with the four- and six-DOF hand arm vibration
models revealed reasonably good agreements between the predicted tool bit
acceleration and the laboratory measured data;

138
• Varying the diameter of the upper chamber orifices, the weights of the impact bolt
and the tool bit could lead to some degree of vibration attenuation, while the
variations in the weights of the tool body and the striker revealed relatively greater
vibration reductions for the coupled hand-tool model;
• The anti-vibration glove could reduce the tool vibration transmitted to the palm and
the forearm only slightly, while it transmitted higher vibration to the fingers, when
compared to the bare hand;
• The effectiveness of an anti-vibration glove could be enhanced by increasing the
stiffness of the glove material at the finger side, and decreasing the stiffness and
increasing the damping of the glove material at the palm side;
• The dynamic performances of the proposed hand-tool system were strongly affected
by the variations in tool speed and push force, while the variations in the tool tip-
workpiece contact model primarily affected the dynamics of the tool bit only.
5.3 Recommendations for Future Studies
• It is desirable to develop a more appropriate biomechanical hand-arm vibration model
to reflect the dynamic performances of the human hand-arm system corresponding to
typical work postures and ranges of hand-grip and push forces;
• Laboratory and field measurements are vital to accurately describe the dynamic
responses of the coupled hand-tool system under practical ranges of hand forces in
order to identify the contact model parameters;
• The proposed tool model should be refined to incorporate the effect of the air pressure
and density variations in the lower chamber;

139
• Consideration of the inertia effects due to the masses of different components of the
percussive chipping hammer, such as the slider-crank mechanism, the upper control
disk and the control bushing, could help realized a more effective model;
• Further refinements are desirable in the component contact pair models through
accurate measurements of the impact duration and coefficient of restitution. This is
particularly important for the interactions among the impact bolt, the control disks
and the tool body; and
• A refined tool tip-workpiece contact model is also essential for simulating the
separation of tool tip from the workpiece.

140
REFERENCE
Abrams C.F. and Suggs C.W. Chain Saw Vibration: Isolation and Transmission through the Human Arm. Transactions of the ASAE (1969): 423-425
Abrams C.F. and Suggs C.W. Development of a Simulator for Use in the Measurement of Chain Saw Vibration. Applied Ergonomics 8.3 (1977): 130-134.
Abrams C.F. Modeling the Vibrational Characteristics of the Human Hand by the Driving Point Mechanical Impedance Method. Ph.D. Thesis. North Carolina State University, 1971.
Adam D. and Kopf F. Sophisticated Compaction Technologies and Continuous Compaction Control. European Workshop Compaction of Soils and Granular Materials. (2000): 207-220.
Adam D. and Kopf F. Theoretical Analysis of Dynamically Loaded Soils. European Workshop Compaction of Soils and Granular Materials (2000): 3-16.
Adewusi S.A. Distributed Biodynamic Characteristics of the Human Hand-arm System Coupled with Vibrating Handles and Power Tools. PhD thesis, Montreal: Concordia University, 2009.
Adewusi S.A., Rakheja S., Marcotte P. and Boutin J. Vibration Transmissibility Characteristics of the Human Hand-arm System under Different Postures, Hand Forces and Excitation Levels. Journal of Sound and Vibration 329 (2010): 2953-2971.
Agate J.N., Druett H.A. and Tombleson J.B.L. Raynaud’s Phenomenon in Grinders of Small Metal Castings. British Journal of Industrial Medicine 3.3 (1946):167-174.
Anderegg R. and Kaufmann K. Intelligent Compaction with Vibratory Rollers: Feedback Control Systems in Automatic Compaction and Compaction Control. Transportation Research Record (2004): 124-134.
ANSI S2.70. Guide for the Measurement and Evaluation of Human Exposure to Vibration Transmitted to the Hand. American National Standard, Acoustical Society of America, Melville, New York, USA. 2006.
Babitsky V.I. Hand-held Percussion Machine as Discrete Non-Linear Converter. Journal of Sound and Vibration 214.1 (1998): 165-182.
Banister P.A. and Smith F.V. Vibration Induced White Fingers and Manipulative Dexterity. Br J Ind. Med 29 (1972): 264-267.
Bannister R., Sever P. and Gross M. Cardiovascular Reflexes and Biochemical Responses in Progressive Autonomic Failure. Brain 100 (1977): 327-344.
Behrens V., Taylor W., Wilcox T., Miday R., Spaeth S. and Burg J. Vibration Syndrome in Chipping and Grinding Workers. Journal of Occupational Medicine 26.10 (1984): 769-773.

141
Bovenzi M. A Longitudinal Study of Vibration White Finger, Cold Response of Digital Arteries, and Measures of Daily Vibration Exposure. International Archives of Occupational and Environmental Health 83.3 (2010): 259-273.
Bovenzi M. Exposure-Response Relationship in the Hand-Arm Vibration Syndrome: An Overview of Current Epidemiology Research. Int. Arch Occup. Environ Health 71 (1998): 509-519.
Bovenzi M., Fiorito A., and Volpe C. Bone and Joint Disorders in the Upper Extremities of Chipping and Grinding Operators. Int. Arch Occup. Environ. Health 59 (1987): 189-198
Bovenzi M., Franzinelli A. and Strambi F. Prevalence of Vibration-Induced White Finger and Assessment of Vibration Exposure among Travertine Workers in Italy. Int. Arch. Occup. Environ. Health 61.1-2 (1988): 25-34.
Bovenzi M., Lindsell C.G. and Griffin M.J. Acute Vascular Responses to the Frequency of Vibration Transmitted to the Hand. Occup. Environ Med 57.6 (2000): 422-430.
Bovenzi M., Petronio L. and Marino F.D. Epidemiological Survey of Shipyard Workers Exposed to Hand Arm Vibration. International Archives Of Occupational and Environmental Health 46 (1980): 251-256.
Bovenzi, M. Medical Aspects of the Hand-Arm Vibration Syndrome. International Journal of Industrial Ergonomics 6 (1990): 61-73.
Brammer A.J. Exposure of the Hand to Vibration in Industry, National Research Council Canada, Publication (1984) No. NRCC 22845.
Brammer A.J. Influence of Hand-Grip on the Vibration Amplitude of Chain-Saw Handles. Proc. International Occupational Hand-Arm Vibration Conference. Cincinnati, Ohio, USA, (1975): 179-186.
Brammer A.J. and Taylor W. Vibration Effects on the Hand and Arm in Industry. New York: John Wiley & Sons, 1982.
Brown A.P. The Effects of Anti-vibration Gloves on Vibration-induced Disorders: A Case Study. Journal of Hand Therapy 3.2(1990):94-100.
Brubaker R.L., Mackenzie C.J.G. and Hutton S.G. Vibration Induced White Finger among Selected Underground Rock Drillers in British Columbia. Scandinavian Journal of Work Environment & Health 12.4 (1986): 296-300.
Bureau of Labor Statistics. Department of Labor. Nonfatal Cases Involving Days Away From Work: Selected Characteristics. Injuries, Illnesses and Fatalities. USA, 05.27, 2004.
Chatterjee D.S., Petrie A. and Taylor W. Prevalence of Vibration Induced White Finger in Fluorspar mines in Weardale. British Journal of Industrial Medicine 35 (1978): 208-218.
Cherian T., Rakheja S. and Bhat R.B. An Analytical Investigation of an Energy Flow Divider to Attenuate Hand-transmitted Vibration. International Journal of Industrial Ergonomics 17

142
(1996): 455-467.
Daikoku M. and Ishikawa F. Mechanical Impedance and Vibration Model of Hand-Arm System. Proceedings of 5th International Conference on Hand-Arm Vibration. Kanzawa, Japan, 1990.
Dandanell R. and Engstrom K. Vibration from Riveting Tools in the Frequency Range 6 Hz-10 MHz and Raynaud’s phenomenon. Scand. J. Work, Environ & Health 12 (1986): 338-342.
Dong J.H. Distributed Biodynamic Response Analysis of the Hand-Arm System Exposed to Vibration along the Forearm Direction. M.A.Sc. Thesis. Concordia University, Montreal, 2007.
Dong J.H., Dong R.G., Rakheja S., Welcome D.E. McdowEll T.W. and Wu J.Z. A Method for Analyzing Absorbed Power Distribution in the Hand and Arm Substructures When Operating Vibrating Tools. Journal of Sound and Vibration 311.3-5 (2008): 1286-1304.
Dong R. G., Welcome D.E., McDowll T.W., Wu J.Z. and Schopper A.W. Frequency Weighting Derived from Power Absorption of Fingers-Hand-Arm System under Zh-Axis. Journal of Biomechanics 39.12 (2006): 2311-2324.
Dong R.G., Dong J.H., Wu J.Z. and Rakheja S. Modeling of Biodynamic Responses Distributed at the Finger and the Palm of the Human Hand-Arm System. Journal of Biomechanics 40.10 (2007): 2335-2340.
Dong R.G., McDowell T.W., Welcome D.E., Warren C., Wu J.Z. and Rakheja S. Analysis of Anti-vibration Gloves Mechanism and Evaluation Methods. Journal of Sound and Vibration 321 (2009): 435-453.
Dong R.G., Rakheja S., Smutz W.P., Schopper A.W., Welcome D., and Wu J.Z. Evaluating Anti-vibration Performance of a Glove Using Total Effective Transmissibility. International Journal of Industrial Ergonomics 30 (2002): 33-48.
Dong R.G., Rakheja S., Smutz W.P., Schopper A.W. and Caporali S. Dynamic Characterization of the Simulated Tool Handle and Palm-Adapter Used for Assessment of Vibration Performance of Gloves. Journal of Testing and Evaluation 31.3 (2003): 234-4246.
Dong R.G., Rakheja S., Mcdowel T. W., Welcome D. E., Wu J. Z., Warren C., Barklay J., Washington B. and Schopper A.W. A Method for Assessing the Effectiveness of Anti-Vibration Gloves Using Biodynamic Responses of the Hand-Arm System. Journal of Sound and Vibration 282.3-5 (2005a):1101-1118.
Dong R.G., Rakheja S., Schopper A. W., Han B. and Smutz W.P. Hand-Transmitted Vibration and Biodynamic Response of the Human Hand-Arm; a Critical Review. Critical Reviews in Biomedical Engineering 29.4 (2001): 391-441.
Dong R.G., McDowell T. W., Daniel E.W., Christopher W., Wu J.Z. and Rakheja S. Analysis of Anti-vibration Gloves Mechanism and Evaluation Methods. Journal of Sound and Vibration 321 (2009): 435-453.
Dong R.G., McDowell T. W., Welcome D.E., Smutz W.P., Schopper A.W., Warren C., Wu

143
J.Z. and Rakheja S. On-the-hand Measurement Methods for Assessing Effectiveness of Anti-vibration Gloves. Journal of Industrial Ergonomics 3.4 (2003): 283-298.
Dong R.G., Welcome D.E. and Wu J.Z. Frequency Weightings Based on Biodynamics of Fingers-Hand-Arm System. Industrial Health 43 (2005b): 485-494.
Dong R.G., Wu J.Z. and Welcome D.E. Recent Advances in Biodynamics of Hand-Arm System. Industrial Health 43 (2005c): 449-471.
Emil H., Heinrich D. and Marina S. Effects of Grip and Push Forces on the Acute Response of the Hand-Arm System under Vibrating Conditions. Occupational and Environmental Health 64 (1993): 463-467.
Engstrom K. and Dandanell R. Exposure Conditions and Raynaud’s Phenomenon among Riveter in the Aircraft Industry. Scandinavian Journal of Work, Environment & Health 12.4 (1986): 293-295.
European Parliament and the Council of the European Union. Directive 2002/44/EC (EU Directive) on the Minimum Health and Safety Requirements regarding the Exposure of Workers to the Risks Arising from Physical Agents (Vibration). Official Journal of the European Communities OJ L177, 2002.
Farkkila M.A., Pyykkö I., Starck J.P. and Korhonen O.S. Hand Grip Force and Muscle Fatigue in the Etiology of the Vibration Syndrome. New York, NY: 1982.
Fraenkel L., Zhang Y., Chaisson C.E., et al. Different Factors Influencing the Expression of Raynaud’s Phenomenon in Men and Women. Arthritis Rheum 42 (1999): 306–310.
Fritz M. An Improved Biomechanical Model for Simulating the Strain of the Hand-Arm System under Vibration Stress. Journal of Biomechanics 24.12 (1991): 1165-1171.
Fuatsuka M and Ueno T. Vibration Exposure and Vibration Induced White Finger due to Chain Saw Operation. J. Occup. Med. 24.4 (1985): 257-264.
Gemne G. and Saraste H. Bone and Joint Pathology in Workers using Hand-Held Vibrating Tools: An Overview. Scand. J. Work Environ. Health 13 (1987): 290-300.
Gemne G. and Taylor W. Hand-Arm Vibration and the Central Autonomic Nervous System. Journal of Low Frequency Noise and Vibration Special Volume (1983):1-12.
Gemne G., LundstroÈm R. and Hansson J.E. Disorders Induced by Work with Hand-Held Vibrating Tools. Arb Halsa 6 (1993): 1-83.
Goel V. K. and Kwan R. Role of Gloves in Reducing Vibration: Analysis for Pneumatic Chipping Hammer. American Industrial Hygiene Association Journal 48.1 (1987):249-254.
Golycheva E.V., Babitsky V.I. and Veprik A.M. Dynamic Correction of Excitation in Hand-held Electro-Pneumatic Percussion Machines. Journal of Sound and Vibration, 259.4 (2003): 829-843.
Golycheva E.V., Babitsky V.I. and Veprik A.M. Vibration Protection for an Operator of a

144
Hand-held Percussion Machine. Journal of Sound and Vibration 274 (2004): 351-367.
Griffin M.J. Evaluating the Effectiveness of Gloves in Reducing Hazards of Hand-Transmitted Vibration. Occupational and Environmental Medicine 55 (1998): 340–348.
Griffin M.J. Handbook of Human Vibration. London: Academic Press, 1990.
Griffin M.J. Minimum Health and Safety Requirements for Workers Exposed to Hand-Transmitted Vibration and Whole-Body Vibration in the European Union: a Review. Occup. Environ. Med. 61 (2004): 387-397.
Griffin M.J., Bovenzi M. and Nelson C.M. Dose-Response Patterns for Vibration-Induced White Finger. J. Occup. Environ. Med. 60 (2003): 16-26.
Griffin M.J., Macfarlane C.R. and Norman C.D. The Transmission of Vibration to the Hand and the Influence of Gloves. In: Brammer A.J. and Taylor W. (Eds.) Vibration Effects on the Hand and Arm in Industry. New York: John Wiley and Sons, (1982): 103-116.
Gurram R. A Study of Vibration Response Characteristics of the Human Hand-Arm System. Ph.D. Thesis. Concordia University, Montreal, 1993.
Gurram R., Rakheja S. and Gouw G.J. Biodynamic Response of the Human Hand-Arm System Subject to Sinusoidal and Stochastic Excitations. International Journal of Industrial Ergonomics 16 (1995): 135-145.
Gurram R., Rakheja S. and Gouw G.J. Vibration Transmission Characteristics of the Human Hand-Arm and Gloves. International Journal of Industrial Ergonomics 13.3 (1994): 217-234.
Gurram R., Rakheja S., Boileau P.E. and Gouw G.J. Development of a Grip Force Dependent Hand-Arm Vibration Model. Central European Journal of Public Health 40 (1996): 65-68.
Härkönen H. et al. Symptoms of Vibration Syndrome and Radiographic Findings in the Wrists of Lumberjacks. Br. J. Ind. Med. 41 (1984): 133-136
Hartung E., Dupuis H. and Scheffer M. Effects of Grip and Push Forces on the Acute Response of the Hand-Arm System under Vibrating Conditions. International Archives of Occupational Environment Health 64 (1993): 463-467.
Hayward R.A. Measures Of Vibrotactile Sensitivity in Persons Exposed to Hand-Arm Vibration. Scand J Work Environ Health 12 (1986): 423-427.
Herberts P. et al. Shoulder Pain and Heavy Manual Labor. Clinical Orthopaedics and Related Research 191 (1984).
Hewitt S. Assessing the Performance of Anti-vibration Gloves-A Possible Alternative to ISO 10819, 1996. Annals of Occupational Hygiene 42.4 (1998): 245-252.
Hempstock T.I. and O’connor D.E. The Measurement of Hand Vibration, in Taylor and Pelmear (eds): Vibration White Finger in Industry. London: Academic Press (1975): 111-122.

145
Hjortsberg U., RoseÂn I., Lundborg G. and Balogh I. Finger Receptor Dysfunction in Dental Technicians Exposed to High-Frequency Vibration. Scand. J. Work Environ. Health 15 (1989): 339-344.
Hyvärinen J., Pyykkö I. and Sundberg S. Vibration in Frequencies and Amplitudes in the Aetiology of Traumatic Vasospastic Disease. Lancet 1 (1973): 791-794.
ISO 10068. Mechanical Vibration and Shock -- Mechanical Impedance of the Human Hand-Arm System at the Driving Point. International Organization for Standardization, Geneva, Switzerland, 1998.
ISO 10068. Mechanical Vibration and Shock -- Mechanical Impedance of the Human Hand-Arm System at the Driving Point. International Organization for Standardization, Geneva, Switzerland, 2012.
ISO 10819. Mechanical Vibration and Shock -- Hand-Arm Vibration -- Measurement and Evaluation of the Vibration Transmissibility of Gloves at the Palm of the Hand. International Standards Organization, Geneva, Switzerland, 2013.
ISO 15230. Mechanical Vibration and Shock – Coupling Forces at the Man – Machine Interface for Hand-transmitted Vibration. International Standards Organization, Geneva, Switzerland, 2007.
ISO 5348. Mechanical Vibration and Shock -- Mechanical Mounting of Accelerometers. International Standards Organization, Geneva, Switzerland, 1998.
ISO 5349. Mechanical Vibration-Guidelines for the Measurement and the Assessment of Human Exposure to Hand-Transmitted Vibration. International Standards Organization, Geneva, Switzerland, 1986.
ISO 5349-1. Mechanical Vibration -- Measurement and Evaluation of Human Exposure to Hand-transmitted Vibration -- Part 1: General Requirements. International Organization for Standardization, Geneva, Switzerland, 2001.
ISO 5349-2. Mechanical Vibration – Measurement and Evaluation of Human Exposure to Hand-transmitted Vibration -- Part 2: Practical Guidance for Measurement in the Workplace. International Organization for Standardization, Geneva, Switzerland, 2001.
ISO 8662-1. Hand-held Portable Power Tools -- Measurement of Vibrations at the Handle -- Part 1: General. International Organization for Standardization, Geneva, Switzerland, 1988.
ISO 8662-2. Hand-held Portable Power Tools -- Measurement of Vibrations at the Handle -- Part 2: Chipping Hammer and Riveting Hammers. International Organization for Standardization, Geneva, Switzerland, 1992.
ISO 8662-11. Hand-held Portable Power Tools -- Measurement of Vibrations at the Handle -- Part 11: Fastener Driving Tools. International Organization for Standardization, Geneva, Switzerland, 1999.
Iwata H. Effects of Rock Drills on Operators. Part I: Vibration of Rock Drills and Air

146
Temperature at Pits. Japan Journal of Ind. Health 6 (1968): 28-36.
Iwata H. Effects of Rock Drills on Operators. Part II: Survey and Examination on Raynaud’s Phenomenon. Industrial Health 6 (1968): 28-46.
Iwata H., Dupuis H. and Hartung E. Übertragung von Horizontalen Sinusschwingungen auf die Oberen Extremitäten bei Halbpronationsstellung und Reaktion des M. Biceps. Int. Arch. für Arbeitsmed 30 (1972): 313-328.
Jahn R. and Hesse M. Applications of Hand-Arm Models in the Investigation of the Interaction between Man and Machine. Scand. J. Work, Environment & Health 12 (1986): 343-346.
Kihlberg S. Biodynamic Response of the Hand-Arm System to Vibration from an Impact Hammer and a Grinder. International Journal of Industrial Ergonomics 16 (1995):1-8.
Lindell H. Redesign of Hand-Held Impact Machines to Reduce Hand-Arm Vibration. Canadian Acoustics 39.2 (2011):80-81.
Mallick Z. Optimization of Operating Parameters for a Back-pack Type Grass Trimmer. International Journal of Industrial Ergonomics 38.1 (2008): 101-110.
Mallick Z. Optimization of the Operating Parameters of a Grass Trimming Machine. Applied Ergonomics 41.2 (2010): 260-265.
Marcotte P., Aldien Y., Boileau P.-E., Rakheja S. and Boutin J. Effect of Handle Size and Hand–Handle Contact Force on the Biodynamic Response of the Hand–arm System under Zh -axis Vibration. Journal of Sound and Vibration 283.3-5 (2005): 1071-1091.
Maricq H.R., Carpentier P.H., Weinrich M.C., et al. Geographic Variation in the Prevalence of Raynaud’s Phenomenon: a 5 Region Comparison. J. Rheumatol. 24 (1997): 879–89.
Maricq H.R., Carpentier P.H., Weinrich M.C., et al. Geographic Variation in the Prevalence of Raynaud’s Phenomenon: Charleston, SC, USA, vs Tarentaise, Savoie, France. J. Rheumatol. 20: (1993): 70–76.
Martin F. An Improved Biomechanical Model for Simulating the Strain of the Hand-arm System under Vibration Stress. Journal of Biomechanics 24.12 (1991): 1165-1171.
Matsumoto K., Itoh N., Kasamatsu T. and Iwata H. A Study on Subjective Symptoms Based on Total Operating Time of Chain Saw. Japan Journal of Industrial Health 19.1 (1977): 22-28.
Matsumoto T., Harada N., Yamada S. and Kobayashi S. On Vibration Hazards of Chipping Hammer Operations in an Iron Foundry. Japan Journal of Industrial Health 23 (1982): 51-60.
Matsumoto T., Yamada S. and Harada N. Comparative Study of Vibration Hazards among Operators of Vibrating Tools in Certain Industries. Arhiv za Higijenu rada Toksikologiju 30 (1979): 701-707.
Meltzer G, Melzig-Thiel R. and Schatte M. Ein Mathematisches Schwingungsmodell für das Menschliche Hand-Arm-System. Maschinenbautechnik 29.2 (1980): 54-58.
147
Meltzer G. A Vibration Model for the Human Hand-Arm System. Studies in Environmental Science 13 (1981): 210-221.
Monney M.A., Gorman P.B. and Gonzalez J.N. Vibration-Based Health Monitoring of Earth Structures. Structural Health Monitoring 4.2 (2005): 137-152.
Mishoe J.W. and Suggs C.W. Hand-arm Vibration. Part II. Vibrational Responses of the Human Hand. Journal of Sound and Vibration 53 (1977): 545-558.
Mishoe J.W. Dynamic Modeling of the Human Hand Using Driving Point Mechanical Impedance Techniques. Ph.D. Thesis. Raleigh, N.C.: N.C. State Univ., 1974.
Miwa T. Studies on Hand Protectors for Portable Vibration Tools. Industrial Health 2 (1968): 95-105.
Miwa T., Yonekawa Y., Nara A., Kanada K. and Baba K. Vibration Isolators for Portable Vibrating Tool. Part 1. A Grinder. Industrial Health 17 (1979): 85-122.
Miyashita K., Shiomi S., Itoh N. et al. Epidemiological Study of Vibration Syndrome in Response to Total Hand-Tool Operating Time. British Journal of Industrial Medicine 40 (1983): 92-98.
Nemani L.N.N. Vibration Analysis of a Hand-Grinder System under Wheel Unbalance Excitation. M.A.Sc Thesis, Montreal: Concordia University, 2005.
NIOSH. Dept. of Health and Human Services, National Institute for Occupational Safety and Health. Criteria for a Recommended Standard: Occupational Exposure to Hand-Arm Vibration. Cincinnati, OH, USA, (1989): 89-106.
NIOSH. Dept. of Health and Human Services, National Institute for Occupational Safety and Health. Musculoskeletal Disorder and Workplace Factors: A Critical Review of Epidemiological Evidence for Work-Related Musculoskeletal Disorders of the Neck, Upper Extremity, and Low Back. Cincinnati, OH, USA, (1997): 97-141.
Oddo R., Loyau T., Boileau P.E. and Champous Y. Design of a Suspended Handle to Attenuate Rock Drill Hand-Arm Vibration; Model Development and Validation. Journal of Sound and Vibration 275 (2004):623-640.
Oliver T.P., Pethybridge R.J. and Lumley K.P.S. Vibration White Finger in Dockyard Workers. Arhiv Za Higijenu Rada Toksikologiju 30 (1979): 683-693.
Palesch Y.Y., Valter I., Carpentier P.H. and Maricq H.R. Association between Cigarette and Alcohol Consumption and Raynaud’s Phenomenon. Journal of Clin. Epidemiol. 52 (1999): 321–28.
Pelmear P.L. and Wasserman D.E. Hand-Arm Vibration: A Comprehensive Guide for Occupational Health Professionals. Beverly Farms, MA, USA: OEM Press, 1998.
Pelmear P.L., Leong D., Taylor W., M. Nagalingam, and Fung D. Measurement of Vibration of Hand-held Tools: Weighted or Un-weighted? J. Occup. Med. 31.11 (1989): 902-908.

148
Pelmear P.L., Taylor W. and Pearson J.C.G. Raynaud’s Phenomenon in Grinders, in Taylor W. and Pelmear P.L. (Eds), The Vibration White Finger in Industry. London: Academic press, (1974): 21-30.
Piligian G., Herbert R., Hearns M., Dropkin J, Landsbergis P. and Cherniack M. Evaluation and Management of Chronic Work-Related Musculoskeletal Disorders of the Distal Upper Extremity. American Journal of Industrial Medicine 37 (2000): 75-93.
Pinto I., Stacchini N., Bovenzi M., Paddan G.S. and Griffin M.J. Protection Effectiveness of Anti-vibration Gloves: Field Evaluation and Laboratory Performance Assessment. 9th International Conference on Hand-Arm Vibration, Nancy, France, 2001.
Pitts P. et al., Hand-arm Vibration Emission of Chainsaws-Comparison with Vibration Exposure. Derbyshire: HSL, 2004.
Politschuk A.P. and Oblivin V.N., Methods of Reducing the Effects of Noise and Vibration on Power Saw Operators. Proc. International Occupational Hand-Arm Vibration Conference. Cincinnati, Ohio, USA, (1971): 230-232.
Pyykkö I., Färkkilä M., Toivanen J., Korhonen O. and Hyvarinen J. Transmission of Vibration in the Hand-Arm System with Special Reference to Changes in Compression Force and Acceleration. Scandinavian Journal of Work, Environment & Health 2 (1976): 87-95.
Pyykkö I., Sairanen E., Korhonen O., Farkkila M. et al. A Decrease in the Prevalence and Severity of Vibration-Induced White Fingers among Lumberjacks in Finland. Scand. J. Work Environ. Health 4 (1978): 246- 254.
Radwin, R.G. Neuromuscular Effects of Vibrating Hand Tools on Grip Exertions, Tactility, Discomfort, and Fatigue, Ph.D. Thesis, The Univ. of Michigan, Michigan, USA, 1986.
Radwin R.G., Armstrong T.J. and Bergeijk E.V. Hand-Arm Vibration and Work-Related Disorders of the Upper Limb. In: P.L. Pelmear, D.E. Wasserman, Editors. Hand-arm Vibration. Beverly Farms, MA: OEM Press, (1998): 122-152.
Rajalingham C. and Rakheja S. Analysis of Impact Force Variation during Collision of Two Bodies using a Single-degree-of-freedom System Model. Journal of Sound and Vibration, 229.4 (2000): 823-835.
Rakheja S., Dong R.G., Welcome D. and Schopper A.W. Estimation of Tool-specific Isolation Performance of Anti-vibration Gloves. International Journal of Industrial Ergonomics 30.2 (2002a):71-87.
Rakheja S., Gurram R. and Gouw G.J. Development of Linear and Nonlinear HAV Models using Optimization and Linearization Techniques. Journal of Biomechanics 26 (1993): 1253-1260.
Rakheja S., Rajalingham C. and Boileau P.E. Analysis of Hand-transmitted Vibration of a Hand-held Percussive Tool. European Journal Mech. & Env. Eng. 47.3 (2002b): 141-156.
Rakheja S., Wu J.Z., Dong R.G. and Schopper A.W. A Comparison of Biodynamic Models of the Human Hand-Arm System for Applications to Hand-held Power Tools. Journal of Sound

149
and Vibration 249.1 (2002c): 55-82.
Reynolds D.D. and Falkenberg R.J. Three- and Four-degrees of Freedom Models of the Vibration Response of the Human Hand. Vibration Effects on the Hand and Arm in Industry (1982): 117-132.
Reynolds D.D., Wasserman D.E., Basel R., Taylor W, Doyle T.E. and Asburry W. Vibration Acceleration Measured on Pneumatic Tools used in Chipping Hammer and Grinding Operations. In Brammer and Taylor (eds), Vibration effects on the hand and arm in industry. New York, John Wiley & Sons, (1982): 211-224.
Reynolds D.D. and Falkenberg R.J. A Study of Hand Vibration on Chipping and Grinding Operators. Part II: Four-Degree-of-Freedom Lumped Parameter Model of the Vibration Response of the Human Hand. Journal of Sound and Vibration 95 (1984): 499-514.
Reynolds D.D. and Soedel W. Dynamic Response of the Hand-Arm System to a Sinusoidal Input. Journal of Sound and Vibration 21 (1972): 339-353.
Riera G., Vilardell M., Vaque J., Fonollosa V. and Bermejo B. Prevalence of Raynaud’s Phenomenon in a Healthy Spanish Population. J. Rheumatol. 20.1 (1993): 66–69.
Robert J., Mereau P., Cavelier C. and Chameaud J. Occupational Angioneurotic Problems Caused by Hand-Tool Vibrations. Archives Des Maladies Professionnelles de Medicine du Travail et de Securite Sociale 38 (1977): 437-455.
Seppalainen A.M., Starck J. and Harkonen H. High-Frequency Vibration and Sensory Nerves. Scandinavian. J. of Work, Environment & Health 12 (1986): 420-422.
Starck J.P. and Pyykkö I. Impulsiveness of Vibration as an Additional Factor in the Hazards Associated with Hand-Arm Vibration. Scand. J. of Work, Environ. & Health (1986): 323-326.
Starck J.P., Farkilla M.A., Aatola S., Pyykkö I. and Markonen O. Vibration Syndrome and Vibration in Pedestal Grinders. British Journal of Industrial Medicine 40 (1983): 426-433.
Strydom J.P.D., Heyns P.S. and Niekerk J.L.V. Development of a Vibration Absorbing Handle for Rock Drills. The Journal of the South African Institute of Mining and Metallurgy (2002):167-172.
Suggs C.W. and Abrams C.F. Jr. Vibration Isolation of Power Tool Operators. Proceedings of the Human Factors and Ergonomics Society Annual Meeting 27.7 (1983): 606-610.
Suggs C.W., Abrams C.F. and Cundiff J.S. Attenuation of High-frequency Vibration in Cain Saws. International Journal of Sound and Vibration 2.6 (1968)
Tasker E.G. Assessment of Vibration Levels Associated with Hand-Held Road-Breakers. Scand. J. of Work, Environ. & Health (1986): 407-412.
Taylor W. Biological Effects of the Hand-Arm Vibration Syndrome; Historical Perspectives and Current Research. Journal of Acoustics Society of America 83 (1988): 415-422.

150
Taylor W., Wasserman D., Behrens V., Reynold D.D. and Samueloff S. Effect of Air Hammer on the Hands of Stone Cutters. The Limestone Quarries of Bedford Indiana, Revisited. British Journal of Industrial Medicine, 41 (1984): 289-295.
Taylor W., Wilcox T. and Wasserman D. NIOSH Health Hazard Evaluation Report. Wisconsic: Neenah Foundry Company HHE 80 (1981): 187-870.
Tominaga Y. The Relationship between Vibration Exposure and Symptoms of Vibration Syndrome. Journal of Science of Labor (1993): 1-14.
Walker D.D., Jones B. and Ogston S. Occurrence of White Finger in the Gas Industry. Scand. J. of Work, Environ. & Health 12.4 (1986): 301-303.
Walker D.D., Jones B., Ogston S., Tasker E.G. and Robinson A.J. A Study of White Finger in the Gas Industry. British Journal of Industrial Medicine 42 (1985): 672-677.
Watanabe M. White Hand Disease (Local Vibration Disturbances). Hoppo Ringyo 209 (1966): 213-219.
Welcome D.E., Dong R.G., Xu X.S., Warren C and McDowell T.W. An Evaluation of the Proposed Revision of the Anti-vibration Glove Test Method Defined in ISO 10819 (1996). International Journal of Industrial Ergonomics 42(2012):143-155.
Welsh C.L. The Effect of Vibration on Digital Blood Flow. British Journal of Surgery 67.10 (1980): 708-710.
Wood L.A., Suggs C.W. and Abrams C.F. Hand-Arm Vibration. Part III: A Distributed Parameter Dynamic Model of the Human Hand-Arm System. Journal of Sound and Vibration 57 (1978):157-169.
Ying Hao K., Xin Mei L. and Ripin Z. M., Tuned Vibration Absorber for Suppression of Hand-Arm Vibration in Electric Grass Trimmer. International Journal of Industrial Ergonomics 41 (2011): 494-508
Ying Hao K., Xin Mei L. and Ripin Z. M. The Design and Development of Suspended Handles for Reducing Hand-Arm Vibration in Petrol Driven Grass Trimmer. International Journal of Industrial Ergonomics 41 (2011): 459-470.

151
APPENDIX
𝐴𝐿𝐶 6.0067e-4 𝑚2
𝐴𝐿ℎ 4.9265e-5 𝑚2
𝐴𝑈𝐶 8.0174e-4 𝑚2
𝐴𝑈𝐻 4.9265e-5 𝑚2
𝑐𝐹𝑇 0.5 Ns/m
𝑐𝐹𝑆 6.5 Ns/m
𝐷𝐿𝐻 3.96 mm
𝐷𝑈𝐻 3.96 mm
(𝐹𝑆)𝑚𝑖𝑛 70 N
g 9.8 𝑚/𝑠2
(𝐿𝐵𝐶)𝑚𝑖𝑛 0.16257 m
(𝐿𝐵𝑆)𝑚𝑖𝑛 0.04539 m
(𝐿𝐶𝐵𝐶)𝑚𝑎𝑥 0.14642 m
𝑙𝑟𝑜𝑑 0.06198 m
𝐿𝑆𝐿 0.00889 m
𝐿𝑆𝑈 0.00501 m
(𝐿𝑆𝑃)𝑚𝑖𝑛 0.0188 m
(𝐿𝑇𝐵)𝑚𝑖𝑛 0.05885 m
𝐿𝑈𝐻 0.10913 m
𝐿𝐿𝐻 0.13717 m
𝑀𝑏 0.19408 kg
𝑀𝑐 4.35 kg
𝑀𝑠 0.20262 kg
𝑀𝑡 0.5455 kg
𝑃𝑎 1.01e5 Pa
r 0.01608 m
𝜌𝑎 1.293 kg/𝑚3
𝛾 1.4


![Chipping Potato Handbook[1]](https://static.fdocuments.us/doc/165x107/5571f7e849795991698c3fa1/chipping-potato-handbook1.jpg)