VIA HAND DELIVERY & ELECTRONIC MAIL€¦ · JANUARY 2009 ELECTRIC RETAIL RATE FILING WITNESS:...
255
November 14, 2008 VIA HAND DELIVERY & ELECTRONIC MAIL Luly E. Massaro, Commission Clerk Rhode Island Public Utilities Commission 89 Jefferson Boulevard Warwick, RI 02888 RE: January 2009 Retail Rate Filing, Docket No. 4011 Dear Ms. Massaro: Enclosed please find ten (10) copies of The Narragansett Electric Company, d/b/a National Grid (“National Grid” or “Company”) January 2009 Retail Rate Filing. This filing consists of a proposed decrease to the Standard Offer rate, along with other rate adjustments arising out of the reconciliation of the Company’s transmission expenses pursuant to its Transmission Service Cost Adjustment Provision, and the calculation of its transition charge pursuant to its Non-Bypassable Transition Charge Adjustment Provision. National Grid’s filing, if approved, will be a net decrease in rates for customers effective for use on and after January 1, 2009. The Company’s filing contains the direct testimony and schedules of Jeanne A. Lloyd, John D. Warshaw, and Pamela A. Viapiano in support of the proposed rate changes. In summary, the filing proposes: (1) a Standard Offer Service rate reduction from 12.4¢ per kWh to 9.5¢ per kWh; (2) The Company is proposing a transition charge during 2009 of 0.235¢ per kWh. The charge represents (i) the weighted average base transition charge of 0.242¢ per kWh, and (ii) a transition charge adjustment credit factor of 0.007¢ per kWh, calculated on Schedule JAL-9, page 11, designed to recover the transition charge over recovery for the period October 2007 through September 2008. (3) The Company is proposing a transmission service adjustment factor during 2009 of 1.064¢ per kWh. The charge will collect (i) the 2009 forecasted transmission expense not collected through base transmission charges of 0.900¢ per kWh, and (ii) a transmission charge adjustment factor of 0.164¢ per kWh, calculated on Schedule JAL-12, page 8, designed to recover the transmission service under recovery for the period October 2007 through September 2008 and the projected under recovery through December 2008. Thomas R. Teehan Senior Counsel Rhode Island
Transcript of VIA HAND DELIVERY & ELECTRONIC MAIL€¦ · JANUARY 2009 ELECTRIC RETAIL RATE FILING WITNESS:...

November 14, 2008
VIA HAND DELIVERY & ELECTRONIC MAIL Luly E. Massaro, Commission Clerk Rhode Island Public Utilities Commission 89 Jefferson Boulevard Warwick, RI 02888
RE: January 2009 Retail Rate Filing, Docket No. 4011 Dear Ms. Massaro: Enclosed please find ten (10) copies of The Narragansett Electric Company, d/b/a National Grid (“National Grid” or “Company”) January 2009 Retail Rate Filing. This filing consists of a proposed decrease to the Standard Offer rate, along with other rate adjustments arising out of the reconciliation of the Company’s transmission expenses pursuant to its Transmission Service Cost Adjustment Provision, and the calculation of its transition charge pursuant to its Non-Bypassable Transition Charge Adjustment Provision. National Grid’s filing, if approved, will be a net decrease in rates for customers effective for use on and after January 1, 2009. The Company’s filing contains the direct testimony and schedules of Jeanne A. Lloyd, John D. Warshaw, and Pamela A. Viapiano in support of the proposed rate changes.
In summary, the filing proposes: (1) a Standard Offer Service rate reduction from 12.4¢ per kWh to 9.5¢ per kWh; (2) The Company is proposing a transition charge during 2009 of 0.235¢ per kWh. The
charge represents (i) the weighted average base transition charge of 0.242¢ per kWh, and (ii) a transition charge adjustment credit factor of 0.007¢ per kWh, calculated on Schedule JAL-9, page 11, designed to recover the transition charge over recovery for the period October 2007 through September 2008.
(3) The Company is proposing a transmission service adjustment factor during 2009 of
1.064¢ per kWh. The charge will collect (i) the 2009 forecasted transmission expense not collected through base transmission charges of 0.900¢ per kWh, and (ii) a transmission charge adjustment factor of 0.164¢ per kWh, calculated on Schedule JAL-12, page 8, designed to recover the transmission service under recovery for the period October 2007 through September 2008 and the projected under recovery through December 2008.
Thomas R. Teehan Senior Counsel Rhode Island

Luly Massaro, Commission Clerk January 2009 Retail Rate Filing November 14, 2008 Page 2 of 2
(4) The Company is proposing to defer recovery of lost distribution revenue associated with net metered facilities, which amounts to about $30,000, and to include it in next year’s annual reconciliation filing.
(5) The Company is proposing to retain the current low income credit of 1.306¢ per kWh
applicable to the first 450 kWhs consumed per month, effective January 1, 2009 through December 31, 2009. The Company proposes that any amount remaining in the account after the billing of the credit ends on December 31, 2009 be credited to the transition reconciliation for the benefit of all customers.
The net effect of the rate changes presented by this filing would decrease the total bill of typical residential customer using 500 kWh per month is a decrease of $12.84, from $93.44 to $80.60 or approximately 13.7%.
Thank you for your attention to this matter. If you have any questions, please feel free to
contact me at (401) 784-7667.
Very truly yours,
Thomas R. Teehan Enclosures
cc: Steve Scialabba, Division Paul Roberti, Esq.

National Grid
JANUARY 2009 ELECTRIC RETAIL RATE FILING
Consisting of the
Direct Testimony and Exhibits of Jeanne A. Lloyd, John D. Warshaw, and Pamela A. Viapiano
November 14, 2008
Submitted to: Rhode Island Public Utilities Commission R.I.P.U.C. Docket No. ____
Submitted by:

Testim
ony of
Jeanne A. Lloyd

NATIONAL GRID R.I.P.U.C. DOCKET NO. ____
JANUARY 2009 ELECTRIC RETAIL RATE FILING WITNESS: JEANNE A. LLOYD
S:\RADATA1\2008 neco\Annual Filing\JALtestimony-2009.final.doc
DIRECT TESTIMONY
OF
JEANNE A. LLOYD

NATIONAL GRID R.I.P.U.C. DOCKET NO. ____
JANUARY 2009 ELECTRIC RETAIL RATE FILING WITNESS: JEANNE A. LLOYD
S:\RADATA1\2008 neco\Annual Filing\JALtestimony-2009.final.doc
Table of Contents
I. Introduction and Qualifications ...........................................................................................1 II. Purpose of Testimony ..........................................................................................................2 III. Proposed Standard Offer Service Rate and Standard Offer Service Reconciliation Proposed Standard Offer Service Rate ..........................................................................4 Standard Offer Service Reconciliation ..........................................................................8
IV. Last Resort Service Reconciliation......................................................................................9 V. Renewable Energy Standard Reconciliation......................................................................13 VI. Transition Charge Base Transition Charge.................................................................................................15 Transition Charge Reconciliation ................................................................................16 VII. Transmission Adjustment Factor and Reconciliation Transmission Service Adjustment Factor ....................................................................19 Transmission Service Reconciliation ...........................................................................20 VIII. Reconciliation of Low Income Credit and Proposed Credit for 2009 ...............................25 IX. Recovery of Lost Distribution Revenue Associated with Net-Metered Facilities.............26 X. Revised Standard Offer Service Tariff and Tariff Cover Sheets ......................................27 XI. Typical Bills.......................................................................................................................28 XII. Conclusion .........................................................................................................................29

NATIONAL GRID R.I.P.U.C. DOCKET NO. ____
JANUARY 2009 ELECTRIC RETAIL RATE FILING WITNESS: JEANNE A. LLOYD
Page 1 of 29
S:\RADATA1\2008 neco\Annual Filing\JALtestimony-2009.final.doc
I. Introduction and Qualifications 1
Q. Please state your full name and business address. 2
A. My name is Jeanne A. Lloyd, and my business address is 201 Jones Road, Waltham, 3
Massachusetts 02451. 4
5
Q. Please state your position. 6
A. I am the Manager of Rates, New England in the Regulation and Pricing – Electricity 7
Distribution and Generation department of National Grid USA Service Company, Inc. 8
This department provides rate related support to The Narragansett Electric Company 9
d/b/a National Grid (“National Grid” or “Company”). 10
11
Q. Please describe your educational background and training. 12
A. In 1980, I graduated from Bradley University in Peoria, Illinois with a Bachelor’s Degree 13
in English. In December 1982, I received a Master of Arts Degree in Economics from 14
Northern Illinois University in De Kalb, Illinois. 15
16
Q. Please describe your professional experience? 17
A. I was employed by EUA Service Corporation in December 1990 as an Analyst in the 18
Rate Department. I was promoted to Senior Rate Analyst on January 1, 1993. My 19
responsibilities included the study, analysis and design of the retail electric service rates, 20
rate riders and special contracts for the EUA retail companies. After the merger of New 21
England Electric System and Eastern Utilities Associates in April 2000, I joined the 22

NATIONAL GRID R.I.P.U.C. DOCKET NO. ____
JANUARY 2009 ELECTRIC RETAIL RATE FILING WITNESS: JEANNE A. LLOYD
Page 2 of 29
S:\RADATA1\2008 neco\Annual Filing\JALtestimony-2009.final.doc
Distribution Regulatory Services Department as a Principal Financial Analyst. I 1
assumed my present position October 1, 2006. Prior to my employment at EUA, I was 2
on the staff of the Missouri Public Service Commission in Jefferson City, Missouri in the 3
position of research economist. My responsibilities included presenting both written and 4
oral testimony before the Missouri Commission in the areas of cost of service and rate 5
design for electric and natural gas rate proceedings. 6
7
Q. Have you previously testified before Rhode Island Public Utilities Commission 8
(“Commission”)? 9
A. Yes. 10
11
II. Purpose of Testimony 12
Q. What is the purpose of the Company’s filing? 13
A. The Company is requesting Commission approval of the Standard Offer Service rate, the 14
base non-bypassable transition charge (“transition charge”), transition charge adjustment 15
factor, and transmission service adjustment factor effective for usage on and after January 16
1, 2009. The Company is also presenting the results of the annual reconciliations of the 17
Standard Offer Service, Last Resort Service, non-bypassable transition charge, 18
transmission service and Renewable Energy Standard (“RES”) charge. 19
20
Also included in this filing is a reconciliation of the low income credit implemented 21
January 1, 2008 per the Commission’s decision in Docket No. 3902. The Company is 22

NATIONAL GRID R.I.P.U.C. DOCKET NO. ____
JANUARY 2009 ELECTRIC RETAIL RATE FILING WITNESS: JEANNE A. LLOYD
Page 3 of 29
S:\RADATA1\2008 neco\Annual Filing\JALtestimony-2009.final.doc
proposing to extend an additional approximately $2 million credit to customers receiving 1
service on Low Income Residential Rate A-60 for the period January 1, 2009 through 2
December 31, 2009. 3
4
Finally, the Company is providing its annual reconciliation of distribution charges 5
displaced by renewable energy systems pursuant to R.I.P.U.C. No. 2006 and proposal for 6
recovery. 7
8
Q. Please describe the changes being proposed to each component of the Company’s 9
charges. 10
A. The Company is proposing a Standard Offer Service rate of 9.5¢ per kWh, a decrease of 11
2.9¢ per kWh from the current rate of 12.4¢ per kWh. The decrease is due to a decrease 12
in the level of natural gas and oil prices. 13
14
The Company is proposing to decrease its transition charge from its current level of 15
0.322¢ per kWh to 0.235¢ per kWh for calendar year 2009. The proposed charge is 16
based upon two components. The first component is New England Power Company’s 17
(“NEP”) annual Contract Termination Charge (“CTC”) for 2009 for Narragansett Electric 18
Company, the former Blackstone Valley Electric Company (“BVE”) and the former 19
Newport Electric Corporation (“Newport”). At the time of this filing, NEP has not 20
finalized its 2009 CTCs, but expects to do so by way of a reconciliation report that will 21
be issued to the Commission and other parties to the wholesale restructuring settlements 22

NATIONAL GRID R.I.P.U.C. DOCKET NO. ____
JANUARY 2009 ELECTRIC RETAIL RATE FILING WITNESS: JEANNE A. LLOYD
Page 4 of 29
S:\RADATA1\2008 neco\Annual Filing\JALtestimony-2009.final.doc
by December 1, 2008. The Company intends to update its proposed transition charge 1
prior to the evidentiary hearing in this proceeding if the final CTCs result in a transition 2
charge that is different from those included in this filing. 3
4
The second component of the proposed transition charge is the proposed transition charge 5
adjustment factor credit resulting from the annual reconciliation of the transition charge, 6
which is a credit of 0.007¢ per kWh. 7
8
The Company is proposing a transmission service adjustment factor of 1.064¢ per kWh. 9
The proposed factor is an increase of 0.523¢ per kWh over the transmission adjustment 10
factor currently in effect. The increase is due primarily to an increase in the forecast of 11
transmission expenses for 2009 and an under collection of transmission expenses 12
incurred for the period October 2007 through September 2008 and projected for the 13
remainder of 2008. 14
15
The net effect of all of the rate changes proposed in this filing on the monthly bill of a 16
typical residential customer using 500 kWh per month is a decrease of $12.84, from 17
$93.44 to $80.60 or approximately 13.7%. Schedule JAL-1 presents a summary of the 18
proposed rate changes. 19
20
III. Standard Offer Service Rate Proposal and Standard Offer Service Reconciliation 21
Proposed Standard Offer Service Rate 22

NATIONAL GRID R.I.P.U.C. DOCKET NO. ____
JANUARY 2009 ELECTRIC RETAIL RATE FILING WITNESS: JEANNE A. LLOYD
Page 5 of 29
S:\RADATA1\2008 neco\Annual Filing\JALtestimony-2009.final.doc
Q. What is the Company’s Standard Offer Service rate proposal? 1
A. The Company is proposing a Standard Offer Service rate of 9.5¢ per kWh effective for 2
consumption on and after January 1, 2009. The proposed rate is based on the Standard 3
Offer Service base charges and fuel index payments that the Company expects to incur 4
during 2009. Fuel index payments for the period are estimated using average natural gas 5
and crude oil prices as reported in the Wall Street Journal on November 7, 10 and 11, 6
2008. 7
Q. Has the Company prepared a projection of the Standard Offer reconciliation balance 8
through December 2009 based on current fuel price estimates? 9
A. Yes. The projected reconciliation for the period October 2008 through December 2009 is 10
in Schedule JAL-2, page 1 of 1. The reconciliation shows an estimated over recovery of 11
approximately $187.2 million as of December 31, 2009 based on the Standard Offer rate 12
currently in effect and on the current fuel price estimates. 13
14
Q. How are estimated revenues calculated? 15
A. Estimated revenues are calculated by applying the current retail rate of 12.4¢ per kWh to 16
the Company’s projected Standard Offer kWh deliveries for the period October 2008 17
through December 2009. The calculation of estimated revenues is shown on page 2 of 18
Schedule JAL-2. 19
20
Q. How are projected expenses determined? 21
A. The calculation of estimated expenses is shown on page 3 of Schedule JAL-2. Standard 22

NATIONAL GRID R.I.P.U.C. DOCKET NO. ____
JANUARY 2009 ELECTRIC RETAIL RATE FILING WITNESS: JEANNE A. LLOYD
Page 6 of 29
S:\RADATA1\2008 neco\Annual Filing\JALtestimony-2009.final.doc
Offer expenses are comprised of base wholesale Standard Offer charges and fuel index 1
payments incurred pursuant to the Fuel Index Adjustment Provisions contained in some 2
of the Company’s Wholesale Standard Offer Service Agreements. 3
4
Base Standard Offer expenses, shown in Column (e), are determined by applying the base 5
Standard Offer charge in effect in each year to the Company’s projected Standard Offer 6
kWh deliveries. For 2008, the base Standard Offer charge is 6.7¢ per kWh and for 2009, 7
the base charge is 7.1¢ per kWh. 8
9
A description of the Fuel Index Adjustment Provision is provided in the testimony of Mr. 10
Warshaw. Estimated fuel expenses for the period October 2008 through December 2009 11
are calculated by applying the projected Standard Offer kWh deliveries to the estimated 12
fuel index cost per kWh as shown in Column (f). The estimated fuel index cost per kWh 13
is developed in Schedule JDW-4. Also included in the projected expense are payments 14
that the Company expects to make through December 2009 to two Standard Offer 15
Service suppliers pursuant to the terms of settlement agreements approved by the 16
Commission in Dockets 3959 and 3969. These payments are shown on page 3, in 17
columns (h) and (i), respectively. 18
19
Q. Please describe the calculation of the Company’s proposed Standard Offer Service rate 20
for January 1, 2009? 21
A. The proposed Standard Offer Service rate is based on the estimated Standard Offer 22

NATIONAL GRID R.I.P.U.C. DOCKET NO. ____
JANUARY 2009 ELECTRIC RETAIL RATE FILING WITNESS: JEANNE A. LLOYD
Page 7 of 29
S:\RADATA1\2008 neco\Annual Filing\JALtestimony-2009.final.doc
Service expense that the Company expects to incur during 2009. This calculation is 1
shown on Schedule JAL-3. Column (a) shows the estimated monthly fuel index 2
adjustment payments for each month. The base Standard Offer charges for each month 3
are shown in Column (b). Column (c) sums the fuel index payments and the base charges 4
resulting in the total expected Standard Offer expense in each month. The average 5
Standard Offer Service cost per kWh is calculated by summing the estimated expense for 6
the period, less the estimated over recovery of Standard Offer expense as of December 7
31, 2008, and dividing that net expense by the estimated Standard Offer kWh deliveries 8
for the same period. The estimated average Standard Offer cost for the period January 1, 9
2009 through December 31, 2009 is 9.5¢ per kWh. 10
11
Q. By way of illustration, how does the Company’s proposed Standard Offer Service rate of 12
9.5¢ per kWh compare to the commodity rates of other utilities in the region? 13
A. Commodity rates are relatively dynamic in New England under each state’s rules for the 14
procurement and rate setting of utility-supplied commodity service. However, to 15
illustrate the relative level of the Company’s proposed Standard Offer Service rate to the 16
currently effective Basic Service fixed residential rates in Massachusetts, please refer to 17
the table below. 18
19
20
21
22

NATIONAL GRID R.I.P.U.C. DOCKET NO. ____
JANUARY 2009 ELECTRIC RETAIL RATE FILING WITNESS: JEANNE A. LLOYD
Page 8 of 29
S:\RADATA1\2008 neco\Annual Filing\JALtestimony-2009.final.doc
Utility
Residential Basic Service Rate1
NStar 12.547¢ Fitchburg Gas & Electric 11.493¢ National Grid-Mass. Electric 12.660¢ Western Mass. Electric 12.114¢
1
Standard Offer Reconciliation 2
Q. Please describe the Company’s Standard Offer reconciliation for the period October 2007 3
through September 2008? 4
A. This reconciliation is included as Schedule JAL-4. Page 1 of Schedule JAL-4 reflects an 5
over recovery of approximately $22.5 million for the period October 2007 through 6
September 2008. 7
8
Q. Please describe the Standard Offer reconciliation process in more detail. 9
A. The Company is required to reconcile Standard Offer revenues and expenses in 10
accordance with the Standard Offer Adjustment Provision, R.I.P.U.C. No. 1153. This 11
provision requires that, on an annual basis, the Company reconcile its total cost of 12
purchased power for Standard Offer supply against its total Standard Offer revenue, and 13
the excess or deficiency be refunded to or collected from customers through a rate 14
recovery/refund methodology approved by the Commission at the time the Company files 15
its annual reconciliation. Total revenues are all charges billed to Standard Offer 16
customers through the Standard Offer rates for the applicable 12-month reconciliation 17
1 All of these rates are publicly available and were obtained from the Massachusetts Department of Public Utilities website. Basic Service rates are market-based rates and those for residential customers are established every six months as new supplies are contracted through a request for proposal process.

NATIONAL GRID R.I.P.U.C. DOCKET NO. ____
JANUARY 2009 ELECTRIC RETAIL RATE FILING WITNESS: JEANNE A. LLOYD
Page 9 of 29
S:\RADATA1\2008 neco\Annual Filing\JALtestimony-2009.final.doc
period. If there is a positive or negative balance in the current Standard Offer 1
reconciliation outstanding from the prior period, the balance shall be credited against or 2
added to the new reconciliation amount, as appropriate, in estimating the Standard Offer 3
balance for the new reconciliation period. 4
5
Q. Please describe the adjustments shown in Column (g) of the Standard Offer 6
reconciliation. 7
A. The adjustments shown in Column (g) of Page 1 of the reconciliation reflect NEPOOL 8
Generation Information System (“NE-GIS”) expenses of $72,035. Recovery of NE-GIS 9
expense is allowed pursuant to the Commission’s Rules Governing Energy Source 10
Disclosure. 11
12
Q How is the beginning balance of $46,089,854 determined? 13
A. The beginning balance of $46,089,854 is the sum of the ending over recovery balance of 14
the October 2006 through September 2007 reconciliation of $42,042,142 as reported on 15
Schedule JAL-4, page 1, in Docket No. 3902, plus an adjustment of $4,047,712. This 16
adjustment reflects a correction to Standard Offer expenses included in a prior 17
reconciliation period. The $4,047,712 includes the reduction to expense of $3,625,777 18
plus interest in the amount of $421,935. 19
20
IV. Last Resort Service Reconciliation 21
Q. Has the Company prepared a Last Resort Service (“LRS”) reconciliation for the year 22

NATIONAL GRID R.I.P.U.C. DOCKET NO. ____
JANUARY 2009 ELECTRIC RETAIL RATE FILING WITNESS: JEANNE A. LLOYD
Page 10 of 29
S:\RADATA1\2008 neco\Annual Filing\JALtestimony-2009.final.doc
ending September 2008? 1
A. Yes. The Company’s LRS reconciliation for the period October 2007 through September 2
2008 is shown in Schedule JAL-5. This Schedule shows that the balance is an under 3
recovery of $1.0 million. 4
5
Q. Please describe the LRS reconciliation in more detail. 6
A. The LRS reconciliation compares the total cost of purchased power for LRS to revenue 7
billed to LRS customers. Any excess or deficiency is to be refunded to or collected from 8
customers, with interest, under a methodology approved by the Commission at the time 9
of the Company’s annual reconciliation filing. 10
11
Separate reconciliations are included for residential LRS, shown on Schedule JAL-5, 12
page 2 and for commercial and industrial (“C&I”) LRS, shown on page 3. 13
14
Q. Why has the Company prepared separate reconciliations for residential and C&I LRS? 15
A. The Company tracks the recovery of LRS expenses separately for the residential and C&I 16
classes because the retail rates charged to each class and the monthly wholesale prices 17
incurred by each class are different. Beginning in September 2003, the Company began 18
procuring LRS for residential and C&I customers under separate contracts. Each contract 19
specifies monthly prices for LRS, but the prices for residential service are different from 20
those contained in the C&I contract. Pursuant to the LRS tariff, R.I.P.U.C. No. 1165, 21
residential customers are charged the Standard Offer Service rate for LRS while C&I 22

NATIONAL GRID R.I.P.U.C. DOCKET NO. ____
JANUARY 2009 ELECTRIC RETAIL RATE FILING WITNESS: JEANNE A. LLOYD
Page 11 of 29
S:\RADATA1\2008 neco\Annual Filing\JALtestimony-2009.final.doc
customers are charged the monthly prices specified in the C&I LRS contract, adjusted for 1
losses. 2
3
Q. What are the results of the reconciliations? 4
A. The residential reconciliation on page 2 of Schedule JAL-5 shows an under recovery of 5
$186,951 for the period October 2007 through September 2008. The C&I reconciliation 6
on page 3 of Schedule JAL-5 shows for the same period an under recovery of $840,537. 7
The total under recovery for LRS is approximately $1.0 million. 8
9
Q. How is the Company proposing to treat the LRS under recovery? 10
A. The Company proposes to use $186,951 of the Standard Offer over recovery to offset the 11
residential LRS under recovery. Further, the Company proposes to roll forward the under 12
recovery balance of $840,537 in the C&I customer reconciliation into next year’s C&I 13
reconciliation. This is consistent with the recommendations made to the Commission by 14
the Company, the Division and The Energy Council of Rhode Island (“TECRI”) in a 15
letter dated March 12, 2008. A copy of the letter is attached as Schedule JAL-6. 16
17
Q. Please describe the contents of the letter included in Schedule JAL-6. 18
A. In Docket No. 3902, TECRI requested that National Grid investigate the source of the 19
over recoveries that had occurred in the Commercial and Industrial (“C&I”) LRS 20
(“LRS”) reconciliation for the period starting October 2003 through the then most recent 21
reconciliation for the period October 2006 through September 2007. The Company 22

NATIONAL GRID R.I.P.U.C. DOCKET NO. ____
JANUARY 2009 ELECTRIC RETAIL RATE FILING WITNESS: JEANNE A. LLOYD
Page 12 of 29
S:\RADATA1\2008 neco\Annual Filing\JALtestimony-2009.final.doc
agreed to conduct this investigation. In Order No. 19202 (Feb. 7, 2008), the Commission 1
stated that it expected to be kept apprised of the status of the Company’s 2
investigation and requested a report at the conclusion. 3
4
The Company subsequently performed an analysis of the LRS annual reconciliations for 5
the nine year period from January 1999 through the most recent reconciliation for the 6
period October 2006 through September 2007. The Company met with the Division and 7
TECRI to discuss its findings and formulate a recommendation for the Commission. 8
The letter included in Schedule JAL-6 summarizes the results of the Company’s 9
investigation and the recommendations of the parties. 10
11
Q. Please describe Schedule JAL-7. 12
A. Schedule JAL-7 is a reconciliation of the non-residential LRS revenue and expense for 13
the period October 2006 through September 2007 with adjustments for out-of-period 14
reconciliations. Out-of-period adjustments are true-ups to supplier bills that result from 15
the ISO-NE load reconciliation process. These adjustments generally occur 16
approximately four months after the supplier’s initial monthly service bill is received by 17
the Company. As part of the LRS investigation described above, the Company agreed to 18
provide, in addition to the current period reconciliation, a reconciliation for the C&I 19
customer classes for a recent twelve month period for which the out-of-period 20
adjustments had been applied. 21
22

NATIONAL GRID R.I.P.U.C. DOCKET NO. ____
JANUARY 2009 ELECTRIC RETAIL RATE FILING WITNESS: JEANNE A. LLOYD
Page 13 of 29
S:\RADATA1\2008 neco\Annual Filing\JALtestimony-2009.final.doc
This reconciliation shows that, when the out-of-period adjustments are applied to the 1
appropriate months, the balance of the reconciliation for the period October 2006 through 2
September 2007 for the C&I class is $304,762 as compared to the unadjusted balance of 3
$667,028 as reported in the LRS C&I reconciliation in Schedule JAL-5, page 3 in Docket 4
No. 3902.. 5
6
V. Renewable Energy Standard Charge Reconciliation 7
Q. What is the Company’s current RES Charge? 8
A. The current RES charge of 0.084¢ per kWh was approved by the Commission in Docket 9
No. 3901 for usage on and after January 1, 2008. This charge was implemented pursuant 10
to the Renewable Energy Standard (R.I. Gen. Laws § 39-26-1 et seq.) which requires 11
National Grid and all other obligated entities (as specified in Definition 3.24 of the RES 12
Regulations) to obtain a percentage of their energy supply from a mix of new and 13
existing renewable energy resources. Beginning January 1, 2007, the RES Rules 14
required that the amount of retail electricity sales associated with Standard Offer Service, 15
as well as Last Resort Service, meet a minimum requirement for renewable resources. 16
For compliance year 2009, 4% of the retail sales of these two supply types must come 17
from renewable resources. 18
19
Q. Is the Company proposing any revisions to its current RES at this time? 20
A. Not in this docket. The Company will propose an updated RES charge as part of its 2009 21
RES Procurement Plan filing which will be submitted to the Commission no later than 22

NATIONAL GRID R.I.P.U.C. DOCKET NO. ____
JANUARY 2009 ELECTRIC RETAIL RATE FILING WITNESS: JEANNE A. LLOYD
Page 14 of 29
S:\RADATA1\2008 neco\Annual Filing\JALtestimony-2009.final.doc
November 14, 2008. 1
2
Q. Why is the Company separately reconciling the RES revenue and expense from the 3
Standard Offer and Last Resort Service revenue and expense? 4
A. In the order in Docket No. 3672, the Commission approved the Division’s 5
recommendation that the Company separately reconcile RES revenue and expense from 6
Standard Offer and Last Resort Service revenue and expenses so that it will be easier to 7
track RES transactions and easier to determine the appropriateness of any Commission 8
approved RES charge. 9
10
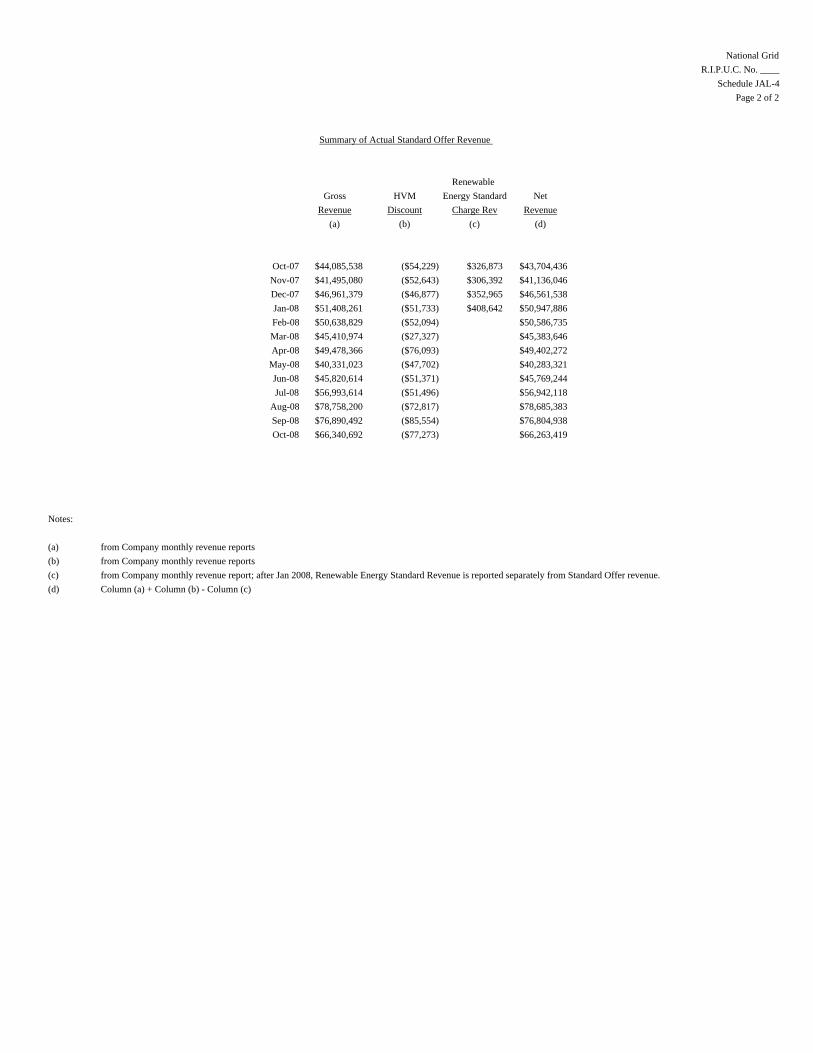
Q. Please describe the RES reconciliation. 11
A. The RES reconciliation is included in Schedule JAL-8. Page 1, shows that as of 12
September 30, 2008, the balance in the reconciliation is an over recovery of 13
approximately $3.0 million. RES revenue collected from Standard Offer and Last 14
Resort Service customers for the period October 2007 through September 2008 is 15
reflected in Schedule JAL-8, page 2. 16
17
Q. How is the Company proposing to treat the over recovery of RES expense? 18
A. The Company is proposing to retain the over recovery to be used to offset expense that 19
will be incurred in the next reconciliation period. 20
21
VI. Transition Charge 22

NATIONAL GRID R.I.P.U.C. DOCKET NO. ____
JANUARY 2009 ELECTRIC RETAIL RATE FILING WITNESS: JEANNE A. LLOYD
Page 15 of 29
S:\RADATA1\2008 neco\Annual Filing\JALtestimony-2009.final.doc
Base Transition Charge 1
Q. Please describe the Company’s transition charge. 2
A. The transition charge is intended to recover from all retail delivery service customers the 3
CTC billed to the Company by NEP, including charges in effect under the former 4
Montaup Electric Company (“Montaup”) CTC. The transition charge was originally 5
designed to change annually as NEP and Montaup established their CTCs for the 6
upcoming calendar year. In addition, the Company reconciles the revenue it bills under 7
its transition charge against the CTC billed to it by NEP and can propose to implement a 8
transition charge adjustment factor to refund an over recovery of CTC costs or collect an 9
under recovery of CTC costs. 10
11
Q. What is the Company’s proposal in this proceeding? 12
A. The Company is proposing a transition charge during 2009 of 0.235¢ per kWh. The 13
charge represents (i) the weighted average base transition charge of 0.242¢ per kWh, and 14
(ii) a transition charge adjustment credit factor of 0.007¢ per kWh, calculated on 15
Schedule JAL-9, page 2, designed to credit the transition charge over recovery for the 16
period October 2007 through September 2008. 17
18
Q. How is the weighted average base transition charge calculated? 19
A. Schedule JAL-9, page 1, shows the calculation of the weighted average base transition 20
charge for 2009. The preliminary individual CTCs and estimated GWhs for 21
Narragansett, BVE and Newport, shown in Section 1 of page 1, are based upon the most 22

NATIONAL GRID R.I.P.U.C. DOCKET NO. ____
JANUARY 2009 ELECTRIC RETAIL RATE FILING WITNESS: JEANNE A. LLOYD
Page 16 of 29
S:\RADATA1\2008 neco\Annual Filing\JALtestimony-2009.final.doc
recent estimate of NEP’s 2009 CTCs. The individual company CTCs determined in 1
Section 1 are aggregated in Section 2 and divided by the total GWh deliveries to arrive at 2
a weighted average base transition charge of 0.242¢ per kWh. 3
4
Transition Charge Reconciliation 5
Q. Please describe how the Company reconciles its transition charge. 6
A. The Company reconciles transition charge revenue and CTC expense in accordance with 7
its Non-Bypassable Transition Charge Adjustment Provision, which provides for an 8
annual reconciliation of the Company’s total CTC expense against the Company’s total 9
revenue from its transition charge. The excess or deficiency is to be refunded to or 10
collected from customers with interest accruing at the rate in effect for customer deposits. 11
The reconciliation is prepared on a monthly basis and for this filing covers the 12
reconciliation period October 2007 through September 2008, as reflected in Schedule 13
JAL-10. Page 1 shows a summary of the reconciliation for the combined company. 14
Pages 2 through 4 show individual reconciliations for Narragansett, BVE, and Newport. 15
16
Q. What is the total Company transition charge reconciliation balance for the year ending 17
September 30, 2008? 18
A. The balance for the period October 2007 through September 2008, shown in Schedule 19
JAL-10, page 1, reflects an over recovery of approximately $584,000. 20
21
Q. How is the Company proposing to treat the under recovery for the period October 2007 22

NATIONAL GRID R.I.P.U.C. DOCKET NO. ____
JANUARY 2009 ELECTRIC RETAIL RATE FILING WITNESS: JEANNE A. LLOYD
Page 17 of 29
S:\RADATA1\2008 neco\Annual Filing\JALtestimony-2009.final.doc
through September 2008? 1
A. As discussed earlier, the Company is proposing to decrease the weighted average 2
transition charge of 0.242¢ per kWh, calculated on Schedule JAL-9, page 1, by a 3
transition charge adjustment credit factor of 0.007¢ per kWh, as calculated in Schedule 4
JAL-9, page 2. The transition charge over recovery, including interest during the 5
recovery period, of $604,680 on Line (2) on page 2 of Schedule JAL-9, is divided by the 6
2009 forecasted kWh deliveries, resulting in a credit of 0.007¢ per kWh. This charge, 7
when subtracted from the weighted average transition charge of 0.242¢ per kWh, 8
produces a net transition charge of 0.235¢ per kWh, as shown on Line (5). 9
10
Q. What does page 5 of Schedule JAL-10 reflect? 11
A. Page 5 of Schedule JAL-10 presents the status of the $1,445,649 refund of a transition 12
charge over recovery incurred during the period October 2006 through September 2007. 13
The Company is refunding this over recovery during 2008 through the 2008 transition 14
charge. Page 5 of Schedule JAL-10 shows that as of October 31, 2008, the balance 15
remaining to be refunded is approximately $381,533. The Company will continue to 16
credit customers through December 2008 and any residual balance, positive or negative, 17
will be credited or charged to the base transition reconciliation in the month of January 18
2009. 19
20
Q. What does page 6 of Schedule JAL-10 reflect? 21
A. Page 5 of Schedule JAL-10 presents the status of the $798,533 transition charge over 22

NATIONAL GRID R.I.P.U.C. DOCKET NO. ____
JANUARY 2009 ELECTRIC RETAIL RATE FILING WITNESS: JEANNE A. LLOYD
Page 18 of 29
S:\RADATA1\2008 neco\Annual Filing\JALtestimony-2009.final.doc
recovery incurred during the period October 2005 through September 2006 and collected 1
from customers during 2007. Page 6 of Schedule JAL-10 shows that as of December 31, 2
2007, the remaining balance to be refunded was $39,869. The Company credited this 3
amount to the base transition reconciliation in the month of January 2008. 4
5
VII. Transmission Adjustment Factor and Reconciliation 6
Q. Has the Company prepared a forecast of transmission costs for 2009? 7
A. Yes, it has. It is included in the testimony and schedules of Ms. Pamela A. Viapiano, 8
who will explain the forecast and how it was derived. The transmission forecast for 2009 9
is approximately $103.9 million, an increase of approximately $31.9 million from the 10
2008 forecast. 11
12
Q. How does the Company propose to collect the $103.9 million of forecasted transmission 13
expense for 2009? 14
A. The Company is proposing to collect the $103.9 million of the 2009 estimated expense, 15
along with the under collection incurred during the period October 2007 through 16
September 2008 and projected through the end of 2008, in the base transmission charges 17
and the transmission adjustment factor. 18
19
Q. Please describe the Company’s current transmission charges. 20
A. The Company recovers its transmission related expenses pursuant to the Transmission 21
Service Cost Adjustment Provision, R.I.P.U.C. No. 1189, which allows the Company to 22

NATIONAL GRID R.I.P.U.C. DOCKET NO. ____
JANUARY 2009 ELECTRIC RETAIL RATE FILING WITNESS: JEANNE A. LLOYD
Page 19 of 29
S:\RADATA1\2008 neco\Annual Filing\JALtestimony-2009.final.doc
recover costs billed to it by ISO-NE, as well as New England Power Company. 1
2
Transmission charges are billed to customers through base charges which differ by rate 3
class and a transmission adjustment factor which is design to collect or refund to 4
customers over or under recoveries of expense from the prior year. The transmission 5
adjustment factor is a uniform per kWh charge applicable to all rate classes. 6
7
Transmission Service Adjustment Factor 8
Q. What is the Company’s proposed Transmission Adjustment Factor? 9
A. The Company’s proposed Transmission Adjustment Factor is 1.064¢ per kWh as shown 10
on Schedule JAL-11, page 1, Line (7). This factor consists of the following individual 11
components: 12
13
1) A factor of 0.164¢ per kWh designed to collect an under recovery of 14
approximately $12.7 million expected to be incurred for the period 15
October 2007 through December 2008; and 16
2) A factor of 0.900¢ per kWh designed to collect the 2009 forecasted 17
transmission expense not collected in the base transmission charges. 18
19
Each of these adjustments is discussed in more detail below. 20
21
22

NATIONAL GRID R.I.P.U.C. DOCKET NO. ____
JANUARY 2009 ELECTRIC RETAIL RATE FILING WITNESS: JEANNE A. LLOYD
Page 20 of 29
S:\RADATA1\2008 neco\Annual Filing\JALtestimony-2009.final.doc
Transmission Service Reconciliation 1
Q. Please discuss the Company’s current transmission service reconciliation. 2
A. The Company’s transmission service reconciliation is shown in Schedule JAL-12. The 3
reconciliation for the period October 2007 through September 2008 shown in Section 1 4
reflects actual transmission revenue for the period October 2007 through September 2008 5
and actual transmission expenses for the period October 2007 through August 2008 and 6
estimated expense September 2008. This reconciliation is provided in accordance with 7
the Company’s Transmission Service Cost Adjustment Provision, which allows for the 8
reconciliation, along with interest on any balance, and the recovery or refund of any 9
under collection or over collection, respectively. 10
11
Q. What is the balance of the transmission reconciliation as of September 2008? 12
A. Schedule JAL-12, page 1, Section 1 shows that the balance of the transmission 13
reconciliation as of September 2008 is an under recovery of approximately $9.6 million. 14
15
Q. Why is there a beginning credit balance of $2,419,726 shown in the month of October 16
2007 in the current reconciliation? 17
A. The beginning balance of $2,419,726 reflects a credit received by Narragansett from New 18
England Power Company during 2007. This credit was inadvertently excluded from the 19
October 2006 through September 2007 reconciliation filed in Docket No. 3902. This 20
credit is the local network service refund owed to the Company from NEP as a result of 21
the October 31, 2006 final FERC order, Opinion No. 489, on the New England 22

NATIONAL GRID R.I.P.U.C. DOCKET NO. ____
JANUARY 2009 ELECTRIC RETAIL RATE FILING WITNESS: JEANNE A. LLOYD
Page 21 of 29
S:\RADATA1\2008 neco\Annual Filing\JALtestimony-2009.final.doc
transmission owners (“NE TOs”) return on equity (“ROE”) filing. The final order 1
identified what ROE the NE TOs should be billing at beginning on the New England 2
Regional transmission organization operation date of February 1, 2005. The $2,419,726 3
includes the amount of the credit of $2,369,144 plus interest of $50,582. 4
5
Q. Please describe Section 2 of Schedule JAL-12. 6
A. Section 2 of Schedule JAL-12 is the projected reconciliation of transmission service 7
revenue and expense through December 2008. Section 2 shows that the projected 8
balance of the transmission reconciliation as of December 2008 is an under recovery of 9
approximately $12.7 million 10
11
Q. What has contributed to the under recovery of expense for the period October 2007 12
through September 2008 and projected through December 2008? 13
A. The under recovery of expense for this period is primarily due to the fact that the actual 14
Regional Network Service (“RNS”) rates effective June 1, 2008 were higher than what 15
was anticipated in the 2008 forecast. The RNS rates recover the costs associated with 16
Pool Transmission Facilities and are billed to the Company pursuant to FERC approved 17
tariffs. The testimony of Ms. Viapiano will discuss the under recovery of transmission 18
service expense in greater detail. 19
20
Q. Since the reconciliation period ends September 2008, why has the Company included a 21
projection of the reconciliation through December 2008? 22

NATIONAL GRID R.I.P.U.C. DOCKET NO. ____
JANUARY 2009 ELECTRIC RETAIL RATE FILING WITNESS: JEANNE A. LLOYD
Page 22 of 29
S:\RADATA1\2008 neco\Annual Filing\JALtestimony-2009.final.doc
A. Since the current transmission service rates will remain in effect until January 1, 2009, 1
the Company has included the projected reconciliation balance through December 2008 2
as an indication of the expected under recovery that is likely to occur during the months 3
of October, November and December based on the projected transmission expenses for 4
those months. 5
6
Q. Is the Company proposing to include the projected balance through December 2008 in its 7
transmission service adjustment factor? 8
A. Yes. The Company expects to under recover an additional $3.1 million of expense for 9
the months of October, November and December 2008. Normally, this amount would 10
accumulate, with interest, in the reconciliation for the period October 2008 through 11
September 2009 and would be recovered from ratepayers during calendar year 2010. 12
Rather than to allow the accumulation of this additional under recovery, the Company is 13
proposing to include this amount in the design of the transmission service adjustment 14
factor effective January 1, 2009. 15
16
Q. Please describe the calculation of the recovery factor designed to collect the under 17
recovery incurred for the period October 2007 through December 2008. 18
A. The under recovery of $12.7 million, plus interest accrued through December 2009 of 19
approximately $412,160, translates to a recovery factor of 0.164¢ per kWh, which is 20
calculated by dividing the amount to be collected by estimated kWh deliveries for the 21
period January 2009 through December 2009. This calculation is shown on page 8 of 22

NATIONAL GRID R.I.P.U.C. DOCKET NO. ____
JANUARY 2009 ELECTRIC RETAIL RATE FILING WITNESS: JEANNE A. LLOYD
Page 23 of 29
S:\RADATA1\2008 neco\Annual Filing\JALtestimony-2009.final.doc
Schedule JAL-12. 1
2
Q. How does the Company plan to reconcile estimated expenses for September 2008 to 3
actual expenses? 4
A. Actual expenses for September 2008 will be compared to the estimated expenses 5
included in this period’s reconciliation. The difference, positive or negative, will be 6
included as an adjustment in October 2008 to the transmission reconciliation for the 7
period October 2008 through September 2009 to be filed with the Commission at this 8
time next year. 9
10
Q. What is the status of the 2008 transmission under recovery as shown on Schedule JAL-11
12, page 4? 12
A. The 2008 transmission under recovery factor of 0.033¢ per kWh was implemented on 13
January 1, 2008 and designed to collect an under recovery of approximately $2.6 million 14
incurred during the period October 2006 through September 2007. The 2008 factor was 15
approved in Docket No. 3902 and was intended to be a 12-month factor. Page 4 of 16
Schedule JAL-12 shows that as of October 31, 2008, the balance remaining to be 17
recovered is $601,918. The Company will continue to charge customers through 18
December 2008 and any residual balance, positive or negative, will be credited or 19
charged to the base transmission reconciliation in the month of January 2009. 20
21
Q. What does page 7 of Schedule JAL-12 reflect? 22

NATIONAL GRID R.I.P.U.C. DOCKET NO. ____
JANUARY 2009 ELECTRIC RETAIL RATE FILING WITNESS: JEANNE A. LLOYD
Page 24 of 29
S:\RADATA1\2008 neco\Annual Filing\JALtestimony-2009.final.doc
A. Page 7 of Schedule JAL-12 presents the final balance of the approximately $6.8 million 1
under recovery of transmission expense incurred during the period October 2005 through 2
September 2006. This under recovery was collected from customers during 2007 through 3
the 2007 transmission adjustment factor. Page 7 shows that of the $6.8 million to be 4
collected from customers, all but approximately $323,000 was collected. The Company 5
has reflected this final amount as a charge to customers on page 1 of Schedule JAL-12 in 6
column (c) in the month of January 2008. 7
8
Q. What does page 5 of Schedule JAL-12 reflect? 9
A. Page 5 of Schedule JAL-12 shows the final balance of the recovery of the Company’s 10
share of uplift costs that had been incurred for the period January 1999 through May 11
2004. This recovery mechanism was approved by the Commission in the Docket 3617 12
Settlement. The approximately $5.6 million allowed to be recovered was to be recovered 13
over three years, from January 2005 through December 2007. Page 11 shows that of the 14
$5.6 million to be collected from customers, all but approximately $400,000 was 15
collected. The Company has reflected this final amount as a charge to customers on page 16
1 of Schedule JAL-12 in column (c) in the month of January 2008. 17
18
Q. Please describe the calculation of the proposed transmission service adjustment factor? 19
A. The calculation of this factor is shown on Schedule JAL-11, page 1, lines 1 through 7. 20
Line 3 shows the total amount of forecasted transmission expense to be collected on a per 21
kWh basis. Of this amount, an average of 0.402¢ per kWh is expected to be collected in 22

NATIONAL GRID R.I.P.U.C. DOCKET NO. ____
JANUARY 2009 ELECTRIC RETAIL RATE FILING WITNESS: JEANNE A. LLOYD
Page 25 of 29
S:\RADATA1\2008 neco\Annual Filing\JALtestimony-2009.final.doc
the base transmission charges. Subtracting the estimated average base charge of 0.402¢ 1
per kWh from the total estimated expense of 1.302¢ per kWh leaves 0.900¢ per kWh to 2
be collected in the transmission adjustment factor. The under recovery factor of 0.164¢, 3
shown on line 6 is then added to the 0.900¢ per kWh, resulting in a proposed adjustment 4
factor of 1.064¢ per kWh. 5
6
VIII. Reconciliation of Low Income Credit and Proposed Credit for 2009 7
Q. Please describe the low income credit. 8
A. In Docket No. 3710, filed in November 2005, the Company proposed to use $8 million of 9
the proceeds from a settlement agreement filed in that docket to fund a four-year 10
enhanced low income credit program. In the order in that docket, the Commission 11
directed the Company to implement a credit of 1.24¢ per kWh applicable to the first 450 12
kWhs consumed per month effective January 1, 2006 which was designed to credit 13
customers approximately $2 million over a twelve month period. In Dockets 3788 and 14
3902, the Commission again approved the Company’s proposal to credit the low income 15
class an additional approximately $2 million in each year. In this filing, the Company is 16
proposing the fourth and final annual credit. 17
18
Q. How much of the credit approved in Docket No. 3902 has been credited to customers 19
during 2008? 20
A. Schedule JAL-13, page 1 shows the reconciliation of the low income credit. Column (b) 21
shows that approximately $1.4 million has been credited to customers from January 1, 22

NATIONAL GRID R.I.P.U.C. DOCKET NO. ____
JANUARY 2009 ELECTRIC RETAIL RATE FILING WITNESS: JEANNE A. LLOYD
Page 26 of 29
S:\RADATA1\2008 neco\Annual Filing\JALtestimony-2009.final.doc
2008 through October 31, 2008. 1
2
Q. Is the Company proposing to extend the low income credit during 2009? 3
A. Yes, the Company is proposing to retain the current credit of 1.306¢ per kWh applicable 4
to the first 450 kWhs consumed per month, effective January 1, 2009 through December 5
31, 2009. Application of the credit to the estimated initial block kWhs for 2009 will 6
result in a total credit applied to the low income customer class of approximately $2.0 7
million. This calculation is shown on Schedule JAL-13, page 3. 8
9
Q. What is the Company’s proposal for refunding the amount remaining in the account after 10
the expiration of the 2009 credit in December 2009? 11
A. The Company proposes that any amount remaining in the account after the billing of the 12
credit ends on December 31, 2009 be credited to the transition reconciliation in January 13
2010 for the benefit of all customers. 14
15
IX. Recovery of Lost Distribution Revenue Associated with Net-Metered Facilities 16
Q. Why is the Company requesting recovery of the lost distribution revenue associated with 17
net metered facilities? 18
A. Rhode Island General Laws §39-26-6(h) and R.I.P.U.C. No. 2006, Section III.B (5) allow 19
the Company to reconcile on an annual basis the distribution portion of any renewable 20
credits and the distribution portion of any distribution company delivery charges 21
displaced by renewable energy systems subject to R.I.P.U.C. No. 2006, Section III.B and 22

NATIONAL GRID R.I.P.U.C. DOCKET NO. ____
JANUARY 2009 ELECTRIC RETAIL RATE FILING WITNESS: JEANNE A. LLOYD
Page 27 of 29
S:\RADATA1\2008 neco\Annual Filing\JALtestimony-2009.final.doc
to recover those amounts from all customers through a uniform per kWh-hour surcharge. 1
RI.P.U.C. No. 2006 was approved by the Commission in Docket No. 3904 and became 2
effective January 1, 2008. 3
4
Q. What is the amount of the distribution portion of the renewable credits and delivery 5
service charges displaced by renewable energy systems during calendar year 2008? 6
A. The distribution portion of the charges attributable to kWhs generated by renewable 7
energy systems in 2008 is $30,897. The amount is calculated by multiplying the 8
distribution kWh charge applicable to each customers account by the estimated kWhs 9
generated by the customer’s generation unit during 2008. Schedule JAL-14 provides a 10
list of each unit, the type of generation, the estimated kWhs generated, the customer’s 11
retail delivery service rate and the estimated lost distribution charges. 12
13
Q. How is the Company proposing to recover the lost distribution revenue? 14
A. Since the $30,897 is too small to produce a billable factor, the Company is proposing to 15
defer recovery of this lost distribution revenue and include the $30,897 incurred during 16
2008 in the 2009 reconciliation which will be included in next year’s annual 17
reconciliation filing. 18
19
X. Revised Standard Offer Tariff and Tariff Cover Sheets 20
Q. Has the Company prepared revised tariff cover sheets? 21
A. Yes. The revised tariff cover sheets reflecting rate changes effective January 1, 2009 are 22

NATIONAL GRID R.I.P.U.C. DOCKET NO. ____
JANUARY 2009 ELECTRIC RETAIL RATE FILING WITNESS: JEANNE A. LLOYD
Page 28 of 29
S:\RADATA1\2008 neco\Annual Filing\JALtestimony-2009.final.doc
included in Schedule JAL-15. Schedule JAL-15 also includes a marked to show changes 1
version of the revised tariff cover sheets. It should also be noted that for some rate 2
classes, approved scheduled changes in distribution charges also occur effective January 3
1, 2009. These rate changes were approved by the Commission in Docket No. 3617, and 4
are the result of the “phased-in” consolidation of several of the Company’s existing rate 5
classes. 6
7
Q. Has the Company included a revised Standard Offer Service tariff in this filing? 8
A. Yes. Schedule JAL-16 includes a revised Standard Offer Tariff, R.I.P.U.C. No. 2011. 9
This tariff reflects the Company’s proposed Standard Offer Service Rate of 9.5¢ per 10
kWh. The tariff does not reflect any changes to the RES that have been proposed in 11
conjunction with the Company’s 2009 RES Procurement Plan filing. Any rate change 12
approved by the Commission in that proceeding or in Docket No. 4000 (Energy 13
Efficiency Program Plan for 2009) will be reflected in a compliance filing submitted 14
prior to the effective date of the rate change. 15
16
XI. Typical Bills 17
Q. Has the Company provided a typical bill analysis to illustrate the impact of the proposed 18
rate changes? 19
A. Yes. The typical bill is contained in Schedule JAL-17. The impact on a typical 20
residential customer using 500 kWh per month is a decrease of $12.84, from $93.44 to 21
$80.60 or approximately 13.7%. 22

NATIONAL GRID R.I.P.U.C. DOCKET NO. ____
JANUARY 2009 ELECTRIC RETAIL RATE FILING WITNESS: JEANNE A. LLOYD
Page 29 of 29
S:\RADATA1\2008 neco\Annual Filing\JALtestimony-2009.final.doc
1
XII. Conclusion 2
Q. Does this conclude your testimony? 3
A. Yes it does.4

Schedules of
Jeanne A
. Lloyd

NATIONAL GRID R.I.P.U.C. DOCKET NO. ____
JANUARY 2009 ELECTRIC RETAIL RATE FILING WITNESS: JEANNE A. LLOYD
S:\RADATA1\2008 neco\Annual Filing\JALtestimony-2009.doc
Schedules
Schedule JAL-1 Summary of Proposed Rate Changes Schedule JAL-2 Projected Standard Offer Service Reconciliation for the period
October 2008 through December 2009 Schedule JAL-3 Estimated Standard Offer Expense for 2009 Schedule JAL-4 Standard Offer Service Reconciliation for the period October 2007
through September 2008 Schedule JAL-5 Last Resort Service Reconciliation for the period October 2007
through September 2008 Schedule JAL-6 Letter to Commission Regarding Last Resort Service Investigation Schedule JAL-7 Last Resort Service Reconciliation for the period October 2006
through September 2007 – Adjusted for Out-of-Period Expenses Schedule JAL-8 Renewable Energy Standard Reconciliation for the period October
2007 through September 2008 Schedule JAL-9 Calculation of Proposed Non-Bypassable Transition Charge for
January 2009 Schedule JAL-10 Non-Bypassable Transition Charge Reconciliation for the period
October 2007 through September 2008 Schedule JAL-11 Calculation of Proposed Transmission Adjustment Factor for
January 2009 Schedule JAL-12 Transmission Service Reconciliation for the period October 2007
through September 2008 Schedule JAL-13 Reconciliation of Low Income Credit and Proposed Credit for
2009 Schedule JAL-14 Net Metering Report Schedule JAL-15 Tariff Cover Sheets – Clean and Marked to Show Changes Version Schedule JAL-16 Proposed Standard Offer Service Tariff – Clean and Marked to
Show Changes Version Schedule JAL-17 Typical Bill Analysis

Schedule JA
L- 1

NATIONAL GRID R.I.P.U.C. DOCKET NO. ____
JANUARY 2009 ELECTRIC RETAIL RATE FILING WITNESS: JEANNE A. LLOYD
S:\RADATA1\2008 neco\Annual Filing\JALtestimony-2009.doc
Schedule JAL-1
Summary of Proposed Rate Changes

S:\RADATA1\2008 neco\Annual Filing\Schedule JAL-1.Summary.xls
National GridR.I.P.U.C. Docket No. ____
Schedule JAL-1Page 1 of 1
ProposedCurrent Change in Proposed
Rate Rate Rate(a) (b) (c)
(1) Standard Offer $0.12400 ($0.02900) $0.09500
(2) Transition Charge $0.00322 ($0.00087) $0.00235
(3) Transmission Charge $0.00541 $0.00523 $0.01064
Net change ($0.02464)
Column (a):Lines (1) - (3) per current tariff
Column (b):Lines (1) - (3) Column (c) - Column (a)
Column (c):(1) Schedule JAL-3(2) Schedule JAL-9(3) Schedule JAL-11
Summary of Proposed Rate Changes for January 1, 2009Effective for All Rate Classes

Schedule JAL-2

NATIONAL GRID R.I.P.U.C. DOCKET NO. ____
JANUARY 2009 ELECTRIC RETAIL RATE FILING WITNESS: JEANNE A. LLOYD
S:\RADATA1\2008 neco\Annual Filing\JALtestimony-2009.doc
Schedule JAL-2
Projected Standard Offer Service Reconciliation
For the period October 2008 through December 2009

S:\RADATA1\2008 neco\Reconciliations\[Recs_2008.neco.xls]SchJAL-2_B National GridR.I.P.U.C. Docket No ____
Schedule JAL-2Page 1 of 3
Section 1. Projected Balance @ December 31, 2009Over(Under) Monthly
Over(Under) Standard Standard Ending BalanceBeginning Offer Offer Base Fuel Index Total Standard Monthly Monthly Including
Month Balance Revenue Expense Payments Offer Expenses Over(Under) Adjustments Balance (1) Unbilled(a) (b) (c) (d) (e) (f) (g) (h) (i)
Oct-07 $46,089,854 $14,282,610 $32,272,127 $11,448,740 $43,720,867 ($29,438,258) $10,737 $16,640,859 $39,265,684Nov-07 $16,640,859 $41,136,046 $32,117,436 $12,227,114 $44,344,550 ($3,208,504) $14,044 $13,418,311 $39,027,157Dec-07 $13,418,311 $46,561,538 $35,332,585 $14,647,437 $49,980,022 ($3,418,484) $5,827 $9,994,000 $38,015,338Jan-08 $9,994,000 $50,947,886 $37,333,300 $14,013,524 $51,346,824 ($398,938) $5,218 $9,589,844 $37,412,548Feb-08 $9,589,844 $50,586,735 $34,848,369 $14,283,900 $49,132,270 $1,454,465 $5,036 $11,039,273 $36,000,278Mar-08 $11,039,273 $45,383,646 $34,878,114 $15,744,263 $50,622,377 ($5,238,731) $4,912 $5,795,630 $32,966,880Apr-08 $5,795,630 $49,402,272 $32,097,082 $15,322,094 $47,419,176 $1,983,096 $4,292 $7,774,435 $29,930,261
May-08 $7,774,435 $40,283,321 $32,014,204 $17,143,543 $49,157,747 ($8,874,426) $4,361 ($1,104,352) $24,068,732Jun-08 ($1,104,352) $45,769,244 $38,240,520 $23,631,618 $61,872,138 ($16,102,894) $5,627 ($17,212,873) $14,105,292Jul-08 ($17,212,873) $56,942,118 $46,291,350 $32,475,340 $78,766,690 ($21,824,571) $6,437 ($39,043,881) $4,233,079
Aug-08 ($39,043,881) $78,685,383 $39,738,134 $29,962,692 $69,700,826 $8,984,557 $5,545 ($30,064,869) $12,177,848Sep-08 ($30,064,869) $76,804,938 $35,147,431 $27,754,730 $62,902,161 $13,902,777 ($16,162,091) $20,912,292Oct-08 ($16,162,091) $67,482,615 $36,462,381 $28,668,879 $65,131,260 $2,351,356 ($13,810,736) $20,926,173
Nov-08 ($13,810,736) $63,158,016 $34,125,702 $45,732,247 $79,857,949 ($16,699,933) ($30,510,668) $7,617,025Dec-08 ($30,510,668) $69,323,078 $37,456,824 $26,770,084 $64,226,908 $5,096,170 ($25,414,499) $14,802,354Jan-09 ($25,414,499) $73,121,550 $41,867,984 $27,138,150 $69,006,134 $4,115,416 ($21,299,083) $16,043,707Feb-09 ($21,299,083) $67,895,981 $38,875,925 $23,884,381 $62,760,305 $5,135,676 ($16,163,407) $21,266,199Mar-09 ($16,163,407) $68,053,829 $38,966,305 $22,273,995 $61,240,300 $6,813,529 ($9,349,878) $25,916,257Apr-09 ($9,349,878) $64,120,246 $36,714,012 $19,313,203 $56,027,215 $8,093,031 ($1,256,847) $32,256,241
May-09 ($1,256,847) $60,932,888 $34,888,992 $16,317,436 $51,206,428 $9,726,460 $8,469,613 $44,247,884Jun-09 $8,469,613 $65,051,403 $37,247,174 $14,474,784 $51,721,958 $13,329,445 $21,799,058 $62,334,705Jul-09 $21,799,058 $73,701,177 $42,199,867 $12,514,699 $54,714,566 $18,986,611 $40,785,668 $82,155,072
Aug-09 $40,785,668 $75,217,097 $43,067,854 $10,448,251 $53,516,105 $21,700,992 $62,486,661 $102,829,020Sep-09 $62,486,661 $73,349,745 $41,998,644 $8,710,169 $50,708,813 $22,640,932 $85,127,592 $121,740,468Oct-09 $85,127,592 $66,568,864 $38,116,043 $7,620,345 $45,736,388 $20,832,476 $105,960,069 $140,130,282
Nov-09 $105,960,069 $62,127,661 $35,573,096 $7,570,640 $43,143,736 $18,983,925 $124,943,993 $163,907,807Dec-09 $124,943,993 $70,843,298 $40,563,501 $8,775,933 $49,339,434 $21,503,864 $146,447,858 $187,174,835Jan-10 $146,447,858 $40,726,978 $0 $0 $0 $40,726,978 $187,174,835
(1) Balance does not reflect interest charges.
Column Notes:Column (a) Column (h) from previous row; beginning balance from Schedule JAL-4, page 1Column (b) from page 2 and Schedule JAL-4, page 1Column (c) from page 3 and Schedule JAL-4, page 1Column (d) from page 3 and Schedule JAL-4, page 1Column (e) Column (c) + Column (d)Column (f) Column (b) - Column (e)Column (g) from Schedule JAL-4Column (h) Column (a) + Column (f) + Column (g)Column (i) Column (h) + 55% of next month's Column (b)
NOTE: Estimated revenues are calculated assuming that the current rate of 12.4¢ per kWh remains in effect through December 2009
Standard Offer ReconciliationProjected Balance at Year Ending December 31, 2009 Based on Current Standard Offer Service Rate

National GridR.I.P.U.C. Docket No ____
Schedule JAL-2Page 2 of 3
Estimated TotalStandard Offer Standard Offer Estimated
Month Deliveries Rate Revenues(a) (b) (c)
Oct-08 544,214,637 $0.12400 $67,482,615Nov-08 509,338,843 $0.12400 $63,158,016Dec-08 559,057,080 $0.12400 $69,323,078Jan-09 589,689,919 $0.12400 $73,121,550Feb-09 547,548,234 $0.12400 $67,895,981Mar-09 548,821,198 $0.12400 $68,053,829Apr-09 517,098,761 $0.12400 $64,120,246
May-09 491,394,255 $0.12400 $60,932,888Jun-09 524,608,087 $0.12400 $65,051,403Jul-09 594,364,327 $0.12400 $73,701,177
Aug-09 606,589,494 $0.12400 $75,217,097Sep-09 591,530,200 $0.12400 $73,349,745Oct-09 536,845,678 $0.12400 $66,568,864
Nov-09 501,029,521 $0.12400 $62,127,661Dec-09 571,316,922 $0.12400 $70,843,298Jan-10 full mo kWh 597,169,760 $0.12400 $74,049,050
Column Notes:
(a) from Page 3, Column (c)(b) Per currently effective tariff(c) Column (a) x Column (b)
Standard Offer ReconciliationEstimated Revenue

National GridR.I.P.U.C. Docket No ____
Schedule JAL-2Page 3 of 3
Estimated% of Standard Base Estimated Total Total
Estimated Total Offer kWhs to Estimated Base Standard Fuel Index Estimated Docket No. 3959 Docket No. 3969 Estimated EstimatedCompany Total Standard Offer Standard Offer Value per Fuel Index Settlement Settlement Fuel Index Standard Offer
kWh Deliveries kWhs kWh Deliveries Offer Charge Expenses kWh Payments Payments Payments Payments Expenses(a) (b) (c) (d) (e) (f) (g) (h) (i) (j) (k)
2008
Oct-08 655,680,286 83.0% 544,214,637 $0.06700 $36,462,381 $0.04988 $27,145,426 $1,523,453 $0 28,668,879 $65,131,260Nov-08 613,661,256 83.0% 509,338,843 $0.06700 $34,125,702 $0.04789 $24,392,237 $1,340,009 $20,000,000 45,732,247 $79,857,949Dec-08 673,562,746 83.0% 559,057,080 $0.06700 $37,456,824 $0.04564 $25,515,365 $1,254,719 $0 26,770,084 $64,226,908
2009
Jan-09 710,469,781 83.0% 589,689,919 $0.07100 $41,867,984 $0.04015 $23,676,050 $945,936 $2,516,164 27,138,150 $69,006,134Feb-09 659,696,667 83.0% 547,548,234 $0.07100 $38,875,925 $0.03797 $20,790,406 $577,810 $2,516,164 23,884,381 $62,760,305Mar-09 661,230,359 83.0% 548,821,198 $0.07100 $38,966,305 $0.03530 $19,373,388 $384,443 $2,516,164 22,273,995 $61,240,300Apr-09 623,010,555 83.0% 517,098,761 $0.07100 $36,714,012 $0.03204 $16,567,844 $229,195 $2,516,164 19,313,203 $56,027,215May-09 592,041,271 83.0% 491,394,255 $0.07100 $34,888,992 $0.02776 $13,641,105 $160,167 $2,516,164 16,317,436 $51,206,428Jun-09 632,057,937 83.0% 524,608,087 $0.07100 $37,247,174 $0.02246 $11,782,698 $175,922 $2,516,164 14,474,784 $51,721,958Jul-09 716,101,598 83.0% 594,364,327 $0.07100 $42,199,867 $0.01646 $9,783,237 $215,298 $2,516,164 12,514,699 $54,714,566Aug-09 730,830,716 83.0% 606,589,494 $0.07100 $43,067,854 $0.01269 $7,697,621 $234,466 $2,516,164 10,448,251 $53,516,105Sep-09 712,686,988 83.0% 591,530,200 $0.07100 $41,998,644 $0.01006 $5,950,794 $243,211 $2,516,164 8,710,169 $50,708,813Oct-09 646,802,021 83.0% 536,845,678 $0.07100 $38,116,043 $0.00907 $4,869,190 $234,990 $2,516,164 7,620,345 $45,736,388Nov-09 603,650,026 83.0% 501,029,521 $0.07100 $35,573,096 $0.00962 $4,819,904 $234,572 $2,516,164 7,570,640 $43,143,736Dec-09 688,333,641 83.0% 571,316,922 $0.07100 $40,563,501 $0.01045 $5,970,262 $289,507 $2,516,164 8,775,933 $49,339,434
Column Notes:
(a) Per Company forecast(b) Reflects 12-month average Standard Offer kWh deliveries as a percentage of total kWh deliveries(c) Column (a) x Column (b)(d) Estimated per prices contained in wholesale standard offer contracts(e) Column (c) x Column (d)(f) from Schedule JDW-4, Page 3, Column (n)(g) Column (c) x Column (f)(h) Estimated payments to supplier per Settlement in Docket No. 3959 (i) Payments to supplier per Settlement in Docket No. 3969(j) Column (g) + Column (h) + Column (i)
Standard Offer Reconciliation Estimated Standard Offer Expenses

Schedule JA
L-3

NATIONAL GRID R.I.P.U.C. DOCKET NO. ____
JANUARY 2009 ELECTRIC RETAIL RATE FILING WITNESS: JEANNE A. LLOYD
S:\RADATA1\2008 neco\Annual Filing\JALtestimony-2009.doc
Schedule JAL-3
Estimated Standard Offer Expense for 2009

R:\2008 neco\Reconciliations\Recs_2008.neco.xls National GridR.I.P.U.C. Docket No ____
Schedule JAL-3Page 1 of 1
Estimated Estimated EstimatedFuel Index Base Standard Total Standard Payments Offer Expense Offer Expense
(a) (b) (c)
Jan-2009 $27,138,150 $41,867,984 $69,006,134Feb-2009 $23,884,381 $38,875,925 $62,760,305Mar-2009 $22,273,995 $38,966,305 $61,240,300Apr-2009 $19,313,203 $36,714,012 $56,027,215
May-2009 $16,317,436 $34,888,992 $51,206,428Jun-2009 $14,474,784 $37,247,174 $51,721,958Jul-2009 $12,514,699 $42,199,867 $54,714,566
Aug-2009 $10,448,251 $43,067,854 $53,516,105Sep-2009 $8,710,169 $41,998,644 $50,708,813Oct-2009 $7,620,345 $38,116,043 $45,736,388
Nov-2009 $7,570,640 $35,573,096 $43,143,736Dec-2009 $8,775,933 $40,563,501 $49,339,434
$179,041,984 $470,079,398 $649,121,382
(1) Estimated Reconciliation Balance as of December 2008 16,377,184
(2) Total Expenses to be Recovered 632,744,198
(3) Projected kWh Deliveries for the period January 2009 through December 2009 6,620,836,596
(4) Average Standard Offer for the period January 2009 through December 2009 $0.09500
Columns:(a) Schedule JAL-2 , page 3(b) Schedule JAL-2 , page 3(c) Column (a) + Column (b)
Rows:
(1) Schedule JAL-2, Page 1, Column (i) for December 2008 plus interest for the period October 2007 through September 2008(2) Column (c) Total - Line (1)(3) Schedule JAL-2, Page 2, Column (a) sum for applicable months(4) Line (2) ÷ Line (3) truncated after 3 decimal places
Estimated Standard Offer Average Cost for the period January 2009 through December 2009Based on Fuel Price Estimates as Reported in the Wall Street Journal on 11-07-08, 11-10-08, and 11-11-08

Schedule JA
L-4

NATIONAL GRID R.I.P.U.C. DOCKET NO. ____
JANUARY 2009 ELECTRIC RETAIL RATE FILING WITNESS: JEANNE A. LLOYD
S:\RADATA1\2008 neco\Annual Filing\JALtestimony-2009.doc
Schedule JAL-4
Standard Offer Service Reconciliation
For the period October 2007 through September 2008

National GridR.I.P.U.C. Docket No ____
Schedule JAL-4Page 1 of 2
Balance @ September 30, 2008Over(Under) Monthly
Over(Under) Standard Standard Ending BalanceBeginning Offer Offer Base Fuel Index Total Standard Monthly Monthly Including
Month Balance Revenue Expense Payments Offer Expenses Over(Under) Adjustments Balance Unbilled(a) (b) (c) (d) (e) (f) (g) (h) (i)
(1) Oct-07 $46,089,854 $14,282,610 $32,272,127 $11,448,740 $43,720,867 ($29,438,258) $10,737 $16,640,859 $39,265,684(1) Nov-07 $16,640,859 $41,136,046 $32,117,436 $12,227,114 $44,344,550 ($3,208,504) $14,044 $13,418,311 $39,027,157(1) Dec-07 $13,418,311 $46,561,538 $35,332,585 $14,647,437 $49,980,022 ($3,418,484) $5,827 $9,994,000 $38,015,338(1) Jan-08 $9,994,000 $50,947,886 $37,333,300 $14,013,524 $51,346,824 ($398,938) $5,218 $9,589,844 $37,412,548(1) Feb-08 $9,589,844 $50,586,735 $34,848,369 $14,283,900 $49,132,270 $1,454,465 $5,036 $11,039,273 $36,000,278(1) Mar-08 $11,039,273 $45,383,646 $34,878,114 $15,744,263 $50,622,377 ($5,238,731) $4,912 $5,795,630 $32,966,880(1) Apr-08 $5,795,630 $49,402,272 $32,097,082 $15,322,094 $47,419,176 $1,983,096 $4,292 $7,774,435 $29,930,261(1) May-08 $7,774,435 $40,283,321 $32,014,204 $17,143,543 $49,157,747 ($8,874,426) $4,361 ($1,104,352) $24,068,732(1) Jun-08 ($1,104,352) $45,769,244 $38,240,520 $23,631,618 $61,872,138 ($16,102,894) $5,627 ($17,212,873) $14,105,292(1) Jul-08 ($17,212,873) $56,942,118 $46,291,350 $32,475,340 $78,766,690 ($21,824,571) $6,437 ($39,043,881) $4,233,079(1) Aug-08 ($39,043,881) $78,685,383 $39,738,134 $29,962,692 $69,700,826 $8,984,557 $5,545 ($30,064,869) $12,177,848(1) Sep-08 ($30,064,869) $76,804,938 $35,147,431 $27,754,730 $62,902,161 $13,902,777 $0 ($16,162,091) $20,912,292(2) Oct-08 ($16,162,091) $37,074,383 $37,074,383 $20,912,292
Totals $46,089,854 $633,860,119 $430,310,651 $228,654,996 $658,965,647 ($25,105,528) $72,035 $20,912,292
Interest (3) $1,574,830
Ending Balance with Interest $22,487,122
(1) Actual revenues and expenses(2) Estimated revenues and expenses(3) Interest expense calculation : (46089854+20912291.6480952)/2*((4.80%*5/12)+(4.63%*7/12))
NOTE: October 2008 reflects September usage billed in October
Column Notes:Column (a)
Column (b) from Page 2Column (c) from invoicesColumn (d) from invoicesColumn (e) Column (c) + Column (d)Column (f) Column (b) - Column (e)Column (g) NE-GIS expenseColumn (h) Column (a) + Column (f) + Column (g)Column (i) Column (h) + 55% of next month's Column (b)
Column (h) from previous row; beginning balance - Sep '07 ending balance from RIPUC Docket No. 3902 of $42,042,142 plus $4,047,712 expense adjustment, including $421,935 interest.
Standard Offer Reconciliationfor the period October 2007 through September 2008
National GridR.I.P.U.C. No. ____
Schedule JAL-4Page 2 of 2
Renewable Gross HVM Energy Standard Net
Revenue Discount Charge Rev Revenue(a) (b) (c) (d)
Oct-07 $44,085,538 ($54,229) $326,873 $43,704,436Nov-07 $41,495,080 ($52,643) $306,392 $41,136,046Dec-07 $46,961,379 ($46,877) $352,965 $46,561,538Jan-08 $51,408,261 ($51,733) $408,642 $50,947,886Feb-08 $50,638,829 ($52,094) $50,586,735Mar-08 $45,410,974 ($27,327) $45,383,646Apr-08 $49,478,366 ($76,093) $49,402,272
May-08 $40,331,023 ($47,702) $40,283,321Jun-08 $45,820,614 ($51,371) $45,769,244Jul-08 $56,993,614 ($51,496) $56,942,118
Aug-08 $78,758,200 ($72,817) $78,685,383Sep-08 $76,890,492 ($85,554) $76,804,938Oct-08 $66,340,692 ($77,273) $66,263,419
Notes:
(a) from Company monthly revenue reports(b) from Company monthly revenue reports(c) from Company monthly revenue report; after Jan 2008, Renewable Energy Standard Revenue is reported separately from Standard Offer revenue.(d) Column (a) + Column (b) - Column (c)
Summary of Actual Standard Offer Revenue

Schedule JAL-5

NATIONAL GRID R.I.P.U.C. DOCKET NO. ____
JANUARY 2009 ELECTRIC RETAIL RATE FILING WITNESS: JEANNE A. LLOYD
S:\RADATA1\2008 neco\Annual Filing\JALtestimony-2009.doc
Schedule JAL-5
Last Resort Service Reconciliation
for the period October 2007 through September 2008

S:\RADATA1\2008 neco\Reconciliations\[Recs_2008.neco.xls]Last_Resort National GridR.I.P.U.C. No. ____
Schedule JAL-5Page 1 of 4
(Under)/Over Last Last (Under)/OverBeginning Resort Resort Monthly Ending
Month Balance Revenue Expense (Under)/Over Adjustments Balance(a) (b) (c) (d) (e) (f)
Oct-07 $577,904 $701,239 $1,900,916 ($1,199,677) ($621,773)Nov-07 ($621,773) $1,622,025 $1,361,097 $260,929 ($360,844)Dec-07 ($360,844) $1,309,569 $1,690,443 ($380,874) ($741,718)Jan-08 ($741,718) $1,242,809 $1,598,732 ($355,924) ($1,097,641)Feb-08 ($1,097,641) $1,322,333 $1,407,779 ($85,446) ($1,183,088)Mar-08 ($1,183,088) $1,463,107 $1,338,134 $124,973 ($1,058,114)Apr-08 ($1,058,114) $1,269,109 $1,227,155 $41,954 ($1,016,160)
May-08 ($1,016,160) $1,246,839 $1,709,690 ($462,851) ($1,479,011)Jun-08 ($1,479,011) $1,430,612 $2,513,844 ($1,083,231) ($2,562,243)Jul-08 ($2,562,243) $2,680,810 $3,533,303 ($852,494) ($3,414,737)
Aug-08 ($3,414,737) $3,045,876 $4,508,171 ($1,462,295) ($4,877,031)Sep-08 ($4,877,031) $5,346,999 $3,797,914 $1,549,085 ($3,327,946)Oct-08 ($3,327,946) $2,310,782 $2,310,782 ($1,017,164)
Totals $577,904 $24,992,110 $26,587,178 ($1,595,068) $0 ($1,017,164)
Interest ($10,324)
Ending Balance with Interest ($1,027,488)
NOTE: October 2008 reflects September usage billed in October
Column (a) Column (f) from previous row; beginning balance per RIPUC Docket No. 3902.Column (b) Page 2 Column (b) + Page 3 Column (b)Column (c) Last Resort Service invoicesColumn (d) Column (b) - Column (c)Column (e)Column (f) Column (a) + Column (d) + Column (e)
Last Resort Service Reconciliation

S:\RADATA1\2008 neco\Reconciliations\[Recs_2008.neco.xls]Last_Resort National GridR.I.P.U.C. No. ____
Schedule JAL-5Page 2 of 4
(Under)/Over Last Last (Under)/OverBeginning Resort Resort Monthly Ending
Month Balance Revenue Expense (Under)/Over Adjustments Balance(a) (b) (c) (d) (e) (f)
Oct-07 ($89,124) $11,387 $43,536 ($32,149) ($121,273)Nov-07 ($121,273) $32,785 $40,377 ($7,592) ($128,865)Dec-07 ($128,865) $42,291 $47,576 ($5,285) ($134,149)Jan-08 ($134,149) $42,714 $52,444 ($9,730) ($143,879)Feb-08 ($143,879) $44,310 $54,977 ($10,667) ($154,546)Mar-08 ($154,546) $46,391 $55,552 ($9,161) ($163,707)Apr-08 ($163,707) $42,157 $45,860 ($3,703) ($167,410)
May-08 ($167,410) $34,144 $52,787 ($18,643) ($186,053)Jun-08 ($186,053) $39,775 $65,395 ($25,620) ($211,673)Jul-08 ($211,673) $57,510 $83,527 ($26,017) ($237,690)
Aug-08 ($237,690) $80,299 $66,940 $13,359 ($224,331)Sep-08 ($224,331) $65,955 $55,641 $10,315 ($214,016)Oct-08 ($214,016) $33,405 $33,405 ($180,611)
Totals ($89,124) $573,122 $664,609 ($91,487) $0 ($180,611)
Interest ($6,340)
Ending Balance with Interest ($186,951)
NOTE: October 2008 reflects September usage billed in October
Column (a) Column (f) from previous row; beginning balance per RIPUC Docket No. 3902.Column (b) Page 4 Column (c)Column (c) Last Resort Service invoicesColumn (d) Column (b) - Column (c)Column (e)Column (f) Column (a) + Column (d) + Column (e)
Last Resort Service Reconciliation - Residential

S:\RADATA1\2008 neco\Reconciliations\[Recs_2008.neco.xls]Last_Resort National GridR.I.P.U.C. No. ____
Schedule JAL-5Page 3 of 4
(Under)/Over Last Last (Under)/OverBeginning Resort Resort Monthly Ending
Month Balance Revenue Expense (Under)/Over Adjustments Balance(a) (b) (c) (d) (e) (f)
Oct-07 $667,028 $689,852 $1,857,381 ($1,167,528) ($500,500)Nov-07 ($500,500) $1,589,241 $1,320,720 $268,521 ($231,979)Dec-07 ($231,979) $1,267,278 $1,642,867 ($375,589) ($607,568)Jan-08 ($607,568) $1,200,095 $1,546,288 ($346,194) ($953,762)Feb-08 ($953,762) $1,278,023 $1,352,803 ($74,780) ($1,028,542)Mar-08 ($1,028,542) $1,416,717 $1,282,582 $134,135 ($894,407)Apr-08 ($894,407) $1,226,952 $1,181,295 $45,657 ($848,750)
May-08 ($848,750) $1,212,695 $1,656,903 ($444,208) ($1,292,958)Jun-08 ($1,292,958) $1,390,837 $2,448,449 ($1,057,612) ($2,350,570)Jul-08 ($2,350,570) $2,623,300 $3,449,777 ($826,477) ($3,177,047)
Aug-08 ($3,177,047) $2,965,577 $4,441,231 ($1,475,653) ($4,652,700)Sep-08 ($4,652,700) $5,281,044 $3,742,273 $1,538,770 ($3,113,929)Oct-08 ($3,113,929) $2,277,377 $2,277,377 ($836,552)
Totals $667,028 $24,418,988 $25,922,568 ($1,503,580) $0 ($836,552)
Interest ($3,985)
Ending Balance with Interest ($840,537)
NOTE: October 2008 reflects September usage billed in October
Column (a) Column (f) from previous row; beginning balance per RIPUC Docket No. 3902.Column (b) Page 4 Column (g)Column (c) Last Resort Service invoicesColumn (d) Column (b) - Column (c)Column (e)Column (f) Column (a) + Column (d) + Column (e)
Last Resort Service Reconciliation - Commercial & Industrial

S:\RADATA1\2008 neco\Reconciliations\[Recs_2008.neco.xls]Last_Resort National GridR.I.P.U.C. No. ____
Schedule JAL-5Page 4 of 4
Residential Renewable Net C&I Renewable C&I C&I TotalLast Resort Energy Standard Residential Last Resort Energy Standard HVM Net Last ResortRevenues Revenue Revenue Revenues Revenue Discount Revenues Revenues
(a) (b) (c) (d) (e) (f) (g) (h)
Oct-07 $11,472 $85 $11,387 $697,059 $4,950 (2,256) 689,852 $701,239Nov-07 $33,030 $245 $32,785 $1,605,345 $11,199 (4,905) 1,589,241 $1,622,025Dec-07 $42,607 $316 $42,291 $1,279,643 $9,526 (2,839) 1,267,278 $1,309,569Jan-08 $43,060 $345 $42,714 $1,210,240 $9,760 (385) 1,200,095 $1,242,809Feb-08 $44,310 $0 $44,310 $1,279,373 $0 (1,349) 1,278,023 $1,322,333Mar-08 $46,391 $0 $46,391 $1,417,590 $0 (873) 1,416,717 $1,463,107Apr-08 $42,157 $0 $42,157 $1,228,889 $0 (1,937) 1,226,952 $1,269,109
May-08 $34,144 $0 $34,144 $1,214,158 $0 (1,463) 1,212,695 $1,246,839Jun-08 $39,775 $0 $39,775 $1,392,428 $0 (1,591) 1,390,837 $1,430,612Jul-08 $57,510 $0 $57,510 $2,625,703 $0 (2,403) 2,623,300 $2,680,810
Aug-08 $80,299 $0 $80,299 $2,968,376 $0 (2,799) 2,965,577 $3,045,876Sep-08 $65,955 $0 $65,955 $5,286,960 $0 (5,916) 5,281,044 $5,346,999Oct-08 $33,405 $0 $33,405 $2,280,054 $0 (2,677) 2,277,377 $2,310,782
$574,113 $991 $573,122 $24,485,818 $35,436 ($31,394) $24,418,988 $24,992,110
(b) Oct 2007 through Jan 2008 - SMZ991 Monthly Revenue Report(c) Column (a) - Column (b)
(e) SMZ991 Monthly Revenue Report(f) monthly revenue report(g) Column (d) - Column (e) + Column (f)(h) Column (c) + Column (g)
(d) Oct 2007 through Jan 2008 - SMB 702 monthly revenue report combined Last Resort Service and Renewable Energy Standard revenue; Feb through Oct 2008 - CR97987A monthly revenue report for Last Resort Service revenue only
(a) Oct 2007 through Jan 2008 - SMB 702 monthly revenue report combined Last Resort Service and Renewable Energy Standard revenue; Feb through Oct 2008 - CR97987A monthly revenue report for Last Resort Service revenue only
Summary of Last Resort Service Revenues

Schedule JA
L-6

NATIONAL GRID R.I.P.U.C. DOCKET NO. ____
JANUARY 2009 ELECTRIC RETAIL RATE FILING WITNESS: JEANNE A. LLOYD
S:\RADATA1\2008 neco\Annual Filing\JALtestimony-2009.doc
Schedule JAL-6
Letter to the Commission Regarding Last Resort Service Investigation

March 12, 2008
VIA HAND DELIVERY & ELECTRONIC MAIL Luly E. Massaro, Commission Clerk Rhode Island Public Utilities Commission 89 Jefferson Boulevard Warwick, RI 02888
RE: Docket 3902 – Last Resort Service Reconciliation Dear Ms. Massaro:
In Docket No. 3902, The Energy Council of Rhode Island (“TEC-RI”) requested that National Grid1 investigate the source of the over recoveries that have occurred in the Commercial and Industrial (“C&I”) Last Resort Service (“LRS”) reconciliation for the period starting October 2003 through the most recent reconciliation for the period October 2006 through September 2007. The Company agreed to conduct this investigation and has performed an analysis of the LRS annual reconciliations for the last nine years, from January 1999 through the most recent reconciliation for the period October 2006 through September 2007. In Order No. 19202 (Feb. 7, 2008), the Commission stated that it expects to be kept apprised of the status of the Company’s investigation and requested a report at the conclusion. The Company has discussed its findings with TEC-RI and the Division of Public Utilities and Carriers (“Division”), the parties to this proceeding. This filing constitutes the Company’s report at the conclusion of the investigation.
There are a number of reasons that a variance in the reconciliation of LRS revenue and
expenses will occur, including billing adjustments that span several months and load losses that vary from the estimates used to calculate retail rates. The primary cause of the over and under recoveries of expense that have occurred since 2001, however, is related to the monthly reconciliation that is part of the ISO-NE process for determination of suppler loads.2 The process for determining hourly supplier loads is described in the Company’s Terms and Conditions for Nonregulated Power Producers, R.I.P.U.C. No. 1191. This process applies to suppliers providing service directly to customers and to suppliers providing Standard Offer and Last Resort Service as well. Monthly Supplier Billing Reconciliation Process To determine the kilowatt-hours that are the basis for wholesale supplier billing, the Company accumulates readings daily from meters located at various delivery points throughout the system. These daily reads are aggregated into calendar month totals at the end of each month. The aggregate load, including an estimate for losses, is allocated to suppliers3 based on an estimate of 1 Submitted on behalf of The Narragansett Electric Company, d/b/a National Grid (the “Company”). 2 The variance prior to 2001 is discussed below. 3 This includes suppliers of Standard Offer Service, Last Resort Service and competitive suppliers.
Laura S. Olton General Counsel Rhode Island
National Grid R.I.P.U.C. Docket No. ____ Schedule JAL-6 Page 1 of 11

Luly E. Massaro, Commission Clerk Docket 3902 – Last Resort Service Reconciliation Report March 12, 2008 Page 2 of 4 each supplier’s share of the retail load. Approximately four months after each month’s initial billing, a reconciliation of the calendar month kWhs occurs, comparing the actual kWhs billed (i.e. kWh readings obtained from customer meter readings) in the month to the original calendar month estimate. The difference, either positive or negative, results in an adjustment to the supplier’s original monthly bill and is paid to the supplier or credited to the Company at the rate in effect in the month in which the service was rendered. Therefore, the total LRS expense booked in any month also includes a reconciliation for service rendered several months prior. These “out-of-period” reconciliations, if not allocated back to the months in which the service was rendered, can cause a significant variance in any particular month and in any year’s LRS reconciliation final balance. Adjustments to Annual Retail LRS Reconciliations
Out-of-Period Reconciliation Adjustment. The out-of-period adjustments described above are easily identified from the monthly LRS invoices. Therefore, to more accurately reflect each year’s actual final LRS reconciliation balance, the monthly expenses for each year have been adjusted by subtracting the out-of-period reconciliation amounts booked in each month and adding back the reconciliation amounts that were booked in subsequent months but were associated with service rendered in the current month. The Company’s analysis of the nine annual reconciliations is included in Attachment 1.4
Correction to revenues in certain months. In addition to adjusting for the out-of-period reconciliations, revenues for two years have been revised for the purposes of this analysis. During the process of auditing revenues and expenses, three separate errors were discovered.5 The three errors, in total, result in an increase in cumulative revenue of $65,197. The revenue adjustments are reflected in column (n) of Attachment 1.
4 For reference, the actual reconciliations that were filed each year from 1999 through 2007 are reproduced in columns (a) through (f) of Attachment 1, pages 2 through 5. The cumulative total line at the bottom of page 5, column (f), indicates that the nine-year cumulative under recovery, not including interest, is approximately $1.7 million. Column (j) of Attachment 1 reflects the out-of-period reconciliation adjustment booked in each month and included in the total LRS expense recorded for the month. The adjustments appearing in Column (j) are then moved into Column (k) to the service month related to the adjustment. For example, in March 2002 an adjustment of ($89,080) appears in Column (j) as the reconciliation adjustment booked in March 2002. That same amount appears in October 2001 in column (k) because this adjustment is related to service rendered in October 2001. Column (l) is the adjusted LRS expense for each month and is calculated by subtracting Column (j) from the total LRS expense booked for the month, shown in Column (i), and adding Column (k). Column (o) of Attachment 1 is the adjusted ending balance, as compared to the original ending balance filed each year as shown in column (g). 5 In October 2004, revenue for the month was entered incorrectly, resulting in revenues for the months being understated by $53,384. In the months of October 2006 and October 2007, an incorrect cell reference resulted in inadvertently including Renewable Energy Standard revenue and high voltage metering discounts in the reported revenues for each month. As a result of these errors, revenues were overstated by $608 for October 2006 and $11,205 for October 2007.
National Grid R.I.P.U.C. Docket No. ____ Schedule JAL-6 Page 2 of 11

Luly E. Massaro, Commission Clerk Docket 3902 – Last Resort Service Reconciliation Report March 12, 2008 Page 3 of 4 Summary of Analysis Attachment 1, page 1, summarizes the results of the analysis.6 As adjusted for the out-of-period reconciliations, the cumulative balance for the period is an under recovery of $2.2 million.
Most of the cumulative under recovery of $2.2 million was incurred during 1999 through 2000. During these years, the LRS retail rates did not reflect the LRS monthly wholesale contract prices. Rather, from January 1999 through May 2000, the LRS rate was priced the same as the Standard Offer rate and from May 2000 through December 2000, the LRS rates were “phased-in” to rates that were based more closely on market prices. Therefore, the under recovery incurred during this period of time primarily reflects the difference between the retail prices and the rates paid to the supplier of LRS.
Line 12 of Attachment 1, page 1, shows the cumulative LRS balance for the period October
2001 through September 2007. During this period of time, the retail rates were derived directly from the monthly contract prices, as adjusted for losses, and therefore, the variance between revenue and expense is significantly reduced from the variance experienced in the first three years. For this period, the cumulative balance is an over recovery of approximately $2.8 million, and as adjusted, is a cumulative over recovery of $835,157.
The Company also conducted an analysis for just the C&I customers, similar to the one described above for combined residential and C&I LRS reconciliation. This analysis is shown on Attachment 2 for the period October 2003 through the most recent annual reconciliation.7 After adjusting the filed year-end balances for the out-of-period reconciliations, the cumulative over recovery as of September 2007 is $629,346, compared to the unadjusted cumulative balance of approximately $1.4 million.
The cumulative variance in both the total reconciliation (for the period October 2001 to the
present) and the C&I reconciliation, after accounting for out-of-period adjustments, is approximately 1.0% of cumulative revenues. Even though this variance remains “unexplained”, the Company’s examination of the various factors that determine LRS revenue and expense, such as retail and wholesale billing units, the rate estimation procedure, the calculation of load losses and billing adjustments do not indicate that there are errors in any of the processes that would result in a continual over recovery of expense.
6 Column (a) shows each year’s filed ending balance from column (g) of Attachment 1, pages 2 through 6. Column (b) is the interest calculated on each year’s ending balance from each of the annual reconciliation filings. Column (c) is the sum of the ending balance, plus interest, and corresponds to the actual ending balance in each year’s reconciliation filing. Column (d) is the adjusted ending balance for each year shown in column (o) of Attachment 1, pages 2 through 6. Line 10 shows that the cumulative LRS balance for the entire period from January 1999 through September 2007, as originally filed, is an under recovery of approximately $1.7 million. 7 Prior to October 2003, revenues and expenses were not tracked separately for residential and C&I customers.
National Grid R.I.P.U.C. Docket No. ____ Schedule JAL-6 Page 3 of 11

Luly E. Massaro, Commission Clerk Docket 3902 – Last Resort Service Reconciliation Report March 12, 2008 Page 4 of 4 Discussion with Other Parties and Recommendation for 2007 LRS Reconciliation Balance
The Company met with representatives of the Division and TEC-RI on February 14, 2008 to review the Company’s analysis and discuss recommendations for the disposition of the LRS over recovery for the year ending September 2007. The parties agreed that the over recovery of $577,904 incurred during the period October 2006 through September 2007 and filed in Docket No. 3902 should be used to offset expenses in the reconciliation for the period October 2007 through September 2008. If any balance remains at the end of that period, the Company will propose that the balance in the C&I account will be carried forward to the next year’s reconciliation. Any over or under recoveries in the residential reconciliation account will be credited or charged to the Standard Offer reconciliation. In addition, beginning with the next annual filing in November 2008, the Company will include an additional schedule in the LRS reconciliation, showing the LRS reconciliation as adjusted for out-of-period reconciliations, for the most recent 12 month period for which the information is available.
Thank you for your attention to this filing. If you have any questions regarding this Report,
please do not hesitate to contact me at (401) 784-7667.
Very truly yours,
Laura S. Olton Enclosures cc: Docket 3902 Service List Steve Scialabba, RI Division
National Grid R.I.P.U.C. Docket No. ____ Schedule JAL-6 Page 4 of 11

Certificate of Service I hereby certify that a copy of the cover letter and/or any materials accompanying this certificate were electronically submitted, hand delivered, and mailed via US Mail on March 12, 2008.
___________________________________ March 12, 2008 Joanne M. Scanlon Date National Grid Narragansett Electric d/b/a National Grid Docket No. 3902 Service list as 12/04/07
Name/Address E-mail Distribution Phone/FAX [email protected]
Laura S. Olton, Esq. National Grid. 280 Melrose St. Providence, RI 02907
401-784-7667 401-784-4321
Paul Roberti, Esq. Dept. of Attorney General 150 South Main St. Providence, RI 02903
401-222-2424 401-222-3016
John Stutz Tellus Institute 11 Arlington St. Boston MA 02116-3411
Jean Rosiello, Esq. 340 Olney St. Providence, RI 02906
[email protected] 401-751-5090 401-751-5096
John Farley, Executive Director The Energy Council of RI One Richmond Square Suite 340D Providence RI 02906
[email protected] 401-621-2240 401-621-2260
Michael McElroy, Esq. Schacht & McElroy PO Box 6721 Providence RI 02940-6721
[email protected] 401-351-4100 401-421-5696
Henry Shelton George Wiley Center. 32 East Ave. Pawtucket RI 02860
[email protected] 401-728-5555 401-725-1020
Original & nine (9) copies file w/: Luly E. Massaro, Commission Clerk Public Utilities Commission 89 Jefferson Blvd. Warwick RI 02889 [email protected]
401-941-4500 401-941-1691
National Grid R.I.P.U.C. Docket No. ____ Schedule JAL-6 Page 5 of 11

National Grid R.I.P.U.C. Docket No. 3902
ATTACHMENT 1
National Grid R.I.P.U.C. Docket No. ____ Schedule JAL-6 Page 6 of 11

National GridR.I.P.U.C. Docket No. 3902
Attachment 1Page 2 of 6
S:\RADATA1\2007 neco\Reconciliations\[LR_allyears.xls]FINAL_ALL
Adjusted Adjusted(Under)/Over Last Last (Under)/Over (Under)/Over Last Last Reconciliation Actual Last Adjusted (Under)/Over
Beginning Resort Resort Monthly Ending Beginning Resort Resort Booked in Reconciliation Resort Monthly Adjustments/ EndingMonth Balance Revenue Expense (Under)/Over Adjustments Balance Balance Revenue Expense Month for Month Expense (Under)/Over Corrections Balance
(a) (b) (c) (d) (e) (f) (g) (h) (i) (j) (k) (l)=(i)-(j)+(k) (m) (n) (o)=(g)+(m)+(n)
Jan-99 $0 $0 $219 ($219) $2 ($217) $0 $0 $219 $219 ($219) $2 ($217)Feb-99 ($217) $5 $317 ($312) ($529) ($217) $5 $317 $317 ($312) $0 ($529)Mar-99 ($529) $302 $880 ($578) ($39) ($1,146) ($529) $302 $880 $880 ($578) ($39) ($1,146)Apr-99 ($1,146) $662 $1,056 ($394) ($440) ($1,980) ($1,146) $662 $1,056 $1,056 ($394) ($440) ($1,980)May-99 ($1,980) $1,175 $1,463 ($288) ($81) ($2,349) ($1,980) $1,175 $1,463 $36 $1,499 ($324) ($81) ($2,385)Jun-99 ($2,349) $1,858 $8,017 ($6,159) ($8,508) ($2,385) $1,858 $8,017 $739 $8,756 ($6,898) $0 ($9,283)Jul-99 ($8,508) $6,949 $13,611 ($6,662) ($15,170) ($9,283) $6,949 $13,611 ($818) $12,793 ($5,844) $0 ($15,127)
Aug-99 ($15,170) $8,886 $10,003 ($1,117) ($16,287) ($15,127) $8,886 $10,003 ($222) $9,781 ($895) $0 ($16,022)Sep-99 ($16,287) $10,141 $9,037 $1,104 ($15,183) ($16,022) $10,141 $9,037 $102 $9,139 $1,002 $0 ($15,020)Oct-99 ($15,183) $9,303 $7,265 $2,038 ($13,145) ($15,020) $9,303 $7,265 ($3) $7,262 $2,041 $0 ($12,979)
Nov-99 ($13,145) $8,437 $7,628 $809 ($12,336) ($12,979) $8,437 $7,628 $312 $7,940 $497 $0 ($12,482)Dec-99 ($12,336) $12,964 $140,952 ($127,988) ($140,324) ($12,482) $12,964 $140,952 ($398) $140,554 ($127,590) $0 ($140,071)Jan-00 ($140,324) $39,816 $0 $39,816 ($100,508) ($140,071) $39,816 $0 $39,816 ($100,255)
Subtotal - 1999 $100,498 $200,448 ($99,950) ($558) $100,498 $200,448 $0 ($253) $200,195 ($99,697) ($558)
Jan-00 $0 $63,449 $845,786 ($782,337) ($782,337) $0 $63,449 $845,786 - $7,245 $853,031 ($789,582) $0 ($789,582)Feb-00 ($782,337) $1,216,653 $918,740 $297,913 ($484,424) ($789,582) $1,216,653 $918,740 - $78,297 $997,037 $219,616 $0 ($569,967)Mar-00 ($484,424) $1,026,075 $1,432,673 ($406,598) ($891,022) ($569,967) $1,026,075 $1,432,673 - $128,984 $1,561,657 ($535,581) $0 ($1,105,548)Apr-00 ($891,022) $1,476,648 $1,612,832 ($136,184) ($1,027,206) ($1,105,548) $1,476,648 $1,612,832 299.71 $18,507 $1,631,039 ($154,391) $0 ($1,259,939)May-00 ($1,027,206) $1,716,096 $1,878,391 ($162,295) ($420,045) ($1,609,546) ($1,259,939) $1,716,096 $1,878,391 - ($218,850) $1,659,541 $56,555 ($420,045) ($1,623,429)Jun-00 ($1,609,546) $2,156,203 $3,370,918 ($1,214,715) ($2,824,261) ($1,623,429) $2,156,203 $3,370,918 - ($487,427) $2,883,491 ($727,288) $0 ($2,350,717)Jul-00 ($2,824,261) $2,500,018 $3,482,260 ($982,242) ($3,806,503) ($2,350,717) $2,500,018 $3,482,260 (793.47) $181,949 $3,665,003 ($1,164,985) $0 ($3,515,701)
Aug-00 ($3,806,503) $2,687,687 $3,475,473 ($787,786) ($4,594,289) ($3,515,701) $2,687,687 $3,475,473 - $123,215 $3,598,688 ($911,001) $0 ($4,426,702)Sep-00 ($4,594,289) $2,687,502 $2,153,587 $533,915 ($4,060,374) ($4,426,702) $2,687,502 $2,153,587 351,433.43 $174,488 $1,976,641 $710,861 $0 ($3,715,841)Oct-00 ($4,060,374) $1,137,043 $1,137,043 ($2,923,331) ($3,715,841) $1,137,043 $1,137,043 $0 ($2,578,798)
Subtotal - 2000 $16,667,374 $19,170,660 ($2,503,286) ($420,045) $16,667,374 $19,170,660 $350,940 $6,407 $18,826,127 ($2,158,753) ($420,045)
(a) column (f) for prior month(b) from Company revenue reports(c) from Last Resort Service invoices(d) column (b) - column (c)(e) 1999: misc billing adjustments
May 2000: Remaining balance from Eastern Utilities Last Resort Service reconciliation(f) column (a) + column (d) + column (e)(g) column (o) for prior month(h) column (b)(i) column (c)(j) from Last Resort Service bills - adjustment booked in current month relating to service rendered in prior month(k) from Last Resort Service bills - for service rendered in current month and booked in subsequent month(l) column (i) - column (j) + column (k)(m) column (h) - column (l)(n) column (e) for 1999 through 2001
October 2004, October 2006, October 2007: corrections to revenues.(o) (o)=(g)+(m)+(n)
The Narragansett Electric CompanyLast Resort Reconciliation
National Grid R.I.P.U.C. Docket No. ____ Schedule JAL-6 Page 7 of 11

National GridR.I.P.U.C. Docket No. 3902
Attachment 1Page 4 of 6
S:\RADATA1\2007 neco\Reconciliations\[LR_allyears.xls]FINAL_ALL
Adjusted Adjusted(Under)/Over Last Last (Under)/Over (Under)/Over Last Last Reconciliation Actual Last Adjusted (Under)/Over
Beginning Resort Resort Monthly Ending Beginning Resort Resort Booked in Reconciliation Resort Monthly Adjustments/ EndingMonth Balance Revenue Expense (Under)/Over Adjustments Balance Balance Revenue Expense Month for Month Expense (Under)/Over Corrections Balance
(a) (b) (c) (d) (e) (f) (g) (h) (i) (j) (k) (l)=(i)-(j)+(k) (m) (n) (o)=(g)+(m)+(n)
The Narragansett Electric CompanyLast Resort Reconciliation
Oct-02 $0 $21,551 $168,977 ($147,426) ($147,426) $0 $21,551 $168,977 ($36,804) ($75,770) $130,011 ($108,460) ($108,460)Nov-02 ($147,426) $188,649 ($289,841) $478,489 $331,064 ($108,460) $188,649 ($289,841) ($481,811) $223 $192,193 ($3,544) ($112,004)Dec-02 $331,064 $190,347 $427,937 ($237,590) $93,474 ($112,004) $190,347 $427,937 ($75,251) ($50,108) $453,079 ($262,732) ($374,736)Jan-03 $93,474 $841,176 $973,058 ($131,882) ($38,408) ($374,736) $841,176 $973,058 ($77,051) $89,407 $1,139,516 ($298,340) ($673,076)Feb-03 ($38,408) $952,209 $898,672 $53,537 $15,129 ($673,076) $952,209 $898,672 ($22,751) ($54,822) $866,601 $85,608 ($587,468)Mar-03 $15,129 $968,274 $1,220,880 ($252,606) ($237,477) ($587,468) $968,274 $1,220,880 $0 ($30,001) $1,190,878 ($222,604) ($810,072)Apr-03 ($237,477) $1,298,975 $1,465,439 ($166,465) ($403,941) ($810,072) $1,298,975 $1,465,439 ($75,770) ($72,236) $1,468,973 ($169,998) ($980,071)May-03 ($403,941) $1,553,706 $1,331,291 $222,415 ($181,527) ($980,071) $1,553,706 $1,331,291 ($50,108) ($8,126) $1,373,273 $180,433 ($799,638)Jun-03 ($181,527) $1,658,485 $1,919,430 ($260,945) ($442,472) ($799,638) $1,658,485 $1,919,430 $89,407 ($47,236) $1,782,786 ($124,301) ($923,940)Jul-03 ($442,472) $1,844,300 $2,164,502 ($320,202) ($762,673) ($923,940) $1,844,300 $2,164,502 ($84,600) ($199,175) $2,049,927 ($205,627) ($1,129,567)
Aug-03 ($762,673) $2,093,799 $1,769,350 $324,449 ($438,225) ($1,129,567) $2,093,799 $1,769,350 ($72,236) ($33,672) $1,807,915 $285,884 ($843,683)Sep-03 ($438,225) $1,290,939 $904,621 $386,318 ($51,907) ($843,683) $1,290,939 $904,621 ($8,126) $48,030 $960,777 $330,161 ($513,521)Oct-03 ($51,907) $612,074 $612,074 $560,167 ($513,521) $612,074 $0 $612,074 $98,553
Subtotal - 2003 $13,514,483 $12,954,316 $560,167 $0 $13,514,483 $12,954,316 ($895,101) ($433,487) $13,415,931 $98,553
Oct-03 $0 $247,222 $667,643 ($420,421) ($420,421) $0 $247,222 $667,643 ($47,236) $15,425 $730,304 ($483,082) ($483,082)Nov-03 ($420,421) $705,566 $474,470 $231,096 ($189,325) ($483,082) $705,566 $474,470 ($199,175) $70,646 $744,290 ($38,724) ($521,806)Dec-03 ($189,325) $743,377 $802,561 ($59,183) ($248,508) ($521,806) $743,377 $802,561 ($33,672) $50,533 $886,765 ($143,388) ($665,194)Jan-04 ($248,508) $1,113,875 $1,240,995 ($127,120) ($375,629) ($665,194) $1,113,875 $1,240,995 $48,030 ($26,874) $1,166,091 ($52,216) ($717,410)Feb-04 ($375,629) $1,083,364 $1,049,134 $34,230 ($341,399) ($717,410) $1,083,364 $1,049,134 $15,425 $34,018 $1,067,727 $15,637 ($701,774)Mar-04 ($341,399) $1,227,421 $1,118,045 $109,376 ($232,023) ($701,774) $1,227,421 $1,118,045 $70,646 $28,690 $1,076,090 $151,332 ($550,442)Apr-04 ($232,023) $891,087 $889,066 $2,021 ($230,002) ($550,442) $891,087 $889,066 $50,533 ($7,513) $831,020 $60,067 ($490,375)May-04 ($230,002) $769,192 $1,108,274 ($339,082) ($569,084) ($490,375) $769,192 $1,108,274 ($26,874) $16,368 $1,151,517 ($382,324) ($872,699)Jun-04 ($569,084) $1,459,979 $1,651,906 ($191,927) ($761,011) ($872,699) $1,459,979 $1,651,906 $34,018 ($83,076) $1,534,812 ($74,833) ($947,533)Jul-04 ($761,011) $1,638,274 $1,663,369 ($25,095) ($786,106) ($947,533) $1,638,274 $1,663,369 $28,690 ($69,868) $1,564,811 $73,463 ($874,070)
Aug-04 ($786,106) $1,432,671 $1,397,861 $34,810 ($751,296) ($874,070) $1,432,671 $1,397,861 ($7,513) ($37,308) $1,368,065 $64,606 ($809,464)Sep-04 ($751,296) $1,233,357 $1,023,604 $209,753 ($541,543) ($809,464) $1,233,357 $1,023,604 $16,368 $26,096 $1,033,333 $200,024 ($609,440)Oct-04 ($541,543) $612,959 $612,959 $71,416 ($609,440) $612,959 $0 $612,959 $3,519
Subtotal - 2004 $13,158,343 $13,086,928 $71,416 $0 $13,158,343 $13,086,928 ($50,762) $17,135 $13,154,824 $3,519
(a) column (f) for prior month(b) from Company revenue reports(c) from Last Resort Service invoices(d) column (b) - column (c)(e) n/a(f) column (a) + column (d) + column (e)(g) column (o) for prior month(h) column (b)(i) column (c)(j) from Last Resort Service bills - adjustment booked in current month relating to service rendered in prior month(k) from Last Resort Service bills - for service rendered in current month and booked in subsequent month(l) column (i) - column (j) + column (k)(m) column (h) - column (l)(n) column (e) for 1999 through 2001
October 2004, October 2006, October 2007: corrections to revenues.(o) (o)=(g)+(m)+(n)
National Grid R.I.P.U.C. Docket No. ____ Schedule JAL-6 Page 8 of 11

National GridR.I.P.U.C. Docket No. 3902
Attachment 1Page 6 of 6
S:\RADATA1\2007 neco\Reconciliations\[LR_allyears.xls]FINAL_ALL
Adjusted Adjusted(Under)/Over Last Last (Under)/Over (Under)/Over Last Last Reconciliation Actual Last Adjusted (Under)/Over
Beginning Resort Resort Monthly Ending Beginning Resort Resort Booked in Reconciliation Resort Monthly Adjustments/ EndingMonth Balance Revenue Expense (Under)/Over Adjustments Balance Balance Revenue Expense Month for Month Expense (Under)/Over Corrections Balance
(a) (b) (c) (d) (e) (f) (g) (h) (i) (j) (k) (l)=(i)-(j)+(k) (m) (n) (o)=(g)+(m)+(n)
The Narragansett Electric CompanyLast Resort Reconciliation
Oct-06 $0 $493,406 $1,376,415 ($883,009) ($883,009) $0 $493,406 $1,376,415 $8,829 $176,016 $1,543,602 ($1,050,196) ($608) ($1,050,804)Nov-06 ($883,009) $1,222,267 $805,211 $417,056 ($465,953) ($1,050,804) $1,222,267 $805,211 ($59,137) $121,015 $985,363 $236,904 ($813,900)Dec-06 ($465,953) $1,105,764 $1,178,880 ($73,116) ($539,069) ($813,900) $1,105,764 $1,178,880 $4,134 $118,683 $1,293,429 ($187,665) ($1,001,565)Jan-07 ($539,069) $1,564,865 $1,900,211 ($335,346) ($874,415) ($1,001,565) $1,564,865 $1,900,211 $159,729 ($48,744) $1,691,738 ($126,873) ($1,128,438)Feb-07 ($874,415) $1,770,833 $1,780,041 ($9,209) ($883,624) ($1,128,438) $1,770,833 $1,780,041 $176,016 ($3,301) $1,600,725 $170,108 ($958,330)Mar-07 ($883,624) $1,657,855 $1,580,786 $77,070 ($806,554) ($958,330) $1,657,855 $1,580,786 $121,015 ($47,170) $1,412,601 $245,254 ($713,076)Apr-07 ($806,554) $1,412,530 $1,155,927 $256,603 ($549,951) ($713,076) $1,412,530 $1,155,927 $118,683 ($6,534) $1,030,710 $381,820 ($331,256)May-07 ($549,951) $1,072,630 $1,105,926 ($33,296) ($583,247) ($331,256) $1,072,630 $1,105,926 ($48,744) $4,896 $1,159,566 ($86,936) ($418,192)Jun-07 ($583,247) $1,168,673 $1,278,547 ($109,874) ($693,121) ($418,192) $1,168,673 $1,278,547 ($3,301) $19,715 $1,301,562 ($132,890) ($551,082)Jul-07 ($693,121) $1,396,838 $1,525,021 ($128,183) ($821,304) ($551,082) $1,396,838 $1,525,021 ($47,170) $76,468 $1,648,659 ($251,821) ($802,903)
Aug-07 ($821,304) $1,574,783 $1,853,667 ($278,884) ($1,100,188) ($802,903) $1,574,783 $1,853,667 ($6,534) $270,911 $2,131,112 ($556,329) ($1,359,232)Sep-07 ($1,100,188) $2,128,067 $1,960,977 $167,090 ($933,098) ($1,359,232) $2,128,067 $1,960,977 $4,896 $111,260 $2,067,340 $60,727 ($1,298,505)Oct-07 ($933,098) $1,498,043 $0 $1,498,043 $564,945 ($1,298,505) $1,498,043 $0 $1,498,043 ($11,205) $188,333
Subtotal - 2007 $18,066,553 $17,501,608 $564,945 $0 $18,066,553 $17,501,608 $428,415 $793,215 $17,866,407 $200,146 ($11,813)
Cumulative Total $125,291,944 $126,610,906 ($1,318,962) ($366,281) ($1,685,243) $125,291,944 $126,610,906 ($2,427,038) ($1,950,685) $127,087,259 ($1,795,315) ($431,478) ($2,226,793)
(a) column (f) for prior month(b) from Company revenue reports(c) from Last Resort Service invoices(d) column (b) - column (c)(e) n/a(f) column (a) + column (d) + column (e)(g) column (o) for prior month(h) column (b)(i) column (c)(j) from Last Resort Service bills - adjustment booked in current month relating to service rendered in prior month(k) from Last Resort Service bills - for service rendered in current month and booked in subsequent month(l) column (i) - column (j) + column (k)(m) column (h) - column (l)(n) column (e) for 1999 through 2001
October 2004, October 2006, October 2007: corrections to revenues.(o) (o)=(g)+(m)+(n)
National Grid R.I.P.U.C. Docket No. ____ Schedule JAL-6 Page 9 of 11

National GridR.I.P.U.C. Docket No. 3902
Attachment 2Page 1 of 2
S:\RADATA1\2007 neco\Reconciliations\[LR_allyears.xls]FINAL_c&i
Adjusted Adjusted Adjusted(Under)/Over Last Last (Under)/Over (Under)/Over Last Last Reconciliation Actual Last Adjusted (Under)/Over
Beginning Resort Resort Monthly Ending Beginning Resort Resort Booked in Reconciliation Resort Monthly Adjustments/ EndingMonth Balance Revenue Expense (Under)/Over Adjustments Balance Balance Revenue Expense Month for Month Expense (Under)/Over Corrections Balance
(a) (b) (c) (d) (e) (f) (g) (h) (i) (j) (k) (l)=(i)-(j)+(k) (m) (n) (o)=(g)+(m)+(n)
Oct-03 $0 $239,623 $642,572 ($402,949) ($402,949) $0 $239,623 $642,572 ($47,236) $14,830 $704,638 ($465,015) ($465,015)Nov-03 ($402,949) $681,132 $446,432 $234,701 ($168,248) ($465,015) $681,132 $446,432 ($199,175) $73,697 $719,304 ($38,171) ($503,187)Dec-03 ($168,248) $714,428 $768,570 ($54,142) ($222,391) ($503,187) $714,428 $768,570 ($33,672) $48,972 $851,214 ($136,786) ($639,972)Jan-04 ($222,391) $1,080,277 $1,199,874 ($119,598) ($341,988) ($639,972) $1,080,277 $1,199,874 $46,562 ($26,843) $1,126,469 ($46,192) ($686,164)Feb-04 ($341,988) $1,051,364 $1,016,546 $34,817 ($307,171) ($686,164) $1,051,364 $1,016,546 $14,830 $33,845 $1,035,561 $15,802 ($670,362)Mar-04 ($307,171) $1,198,172 $1,096,359 $101,812 ($205,359) ($670,362) $1,198,172 $1,096,359 $73,697 $28,776 $1,051,438 $146,734 ($523,628)Apr-04 ($205,359) $865,125 $867,044 ($1,919) ($207,278) ($523,628) $865,125 $867,044 $48,972 ($7,405) $810,667 $54,458 ($469,171)May-04 ($207,278) $744,318 $1,087,544 ($343,226) ($550,504) ($469,171) $744,318 $1,087,544 ($26,843) $15,667 $1,130,054 ($385,737) ($854,907)Jun-04 ($550,504) $1,432,460 $1,621,906 ($189,446) ($739,949) ($854,907) $1,432,460 $1,621,906 $33,845 ($82,520) $1,505,541 ($73,080) ($927,988)Jul-04 ($739,949) $1,606,269 $1,622,582 ($16,313) ($756,263) ($927,988) $1,606,269 $1,622,582 $28,776 ($69,830) $1,523,976 $82,293 ($845,695)
Aug-04 ($756,263) $1,395,391 $1,358,712 $36,679 ($719,584) ($845,695) $1,395,391 $1,358,712 ($7,405) ($37,772) $1,328,345 $67,046 ($778,649)Sep-04 ($719,584) $1,194,503 $990,776 $203,728 ($515,856) ($778,649) $1,194,503 $990,776 $15,667 $27,398 $1,002,506 $191,997 ($586,652)Oct-04 ($515,856) $589,002 $0 $589,002 $73,146 ($586,652) $589,002 $0 $589,002 $2,350
Subtotal 2004 $12,792,064 $12,718,917 $73,146 $0 $12,792,064 $12,718,917 ($51,982) $18,815 $12,789,713 $2,350 $0
Oct-04 $74,404 $217,882 $707,922 ($490,040) ($415,636) $74,404 $217,882 $707,922 ($82,520) $17,036 $807,478 ($589,596) ($49,559) ($564,751)Nov-04 ($415,636) $974,613 $564,856 $409,757 ($5,879) ($564,751) $974,613 $564,856 ($69,830) $14,859 $649,545 $325,068 ($239,683)Dec-04 ($5,879) $772,498 $941,688 ($169,189) ($175,069) ($239,683) $772,498 $941,688 ($37,772) ($25,880) $953,579 ($181,081) ($420,764)Jan-05 ($175,069) $1,236,991 $1,375,133 ($138,142) ($313,211) ($420,764) $1,236,991 $1,375,133 $27,398 $1,270 $1,349,004 ($112,014) ($532,778)Feb-05 ($313,211) $1,281,955 $1,020,192 $261,763 ($51,448) ($532,778) $1,281,955 $1,020,192 $17,036 ($32,163) $970,993 $310,962 ($221,816)Mar-05 ($51,448) $919,112 $737,097 $182,015 $130,567 ($221,816) $919,112 $737,097 $14,859 ($23,505) $698,734 $220,378 ($1,437)Apr-05 $130,567 $587,979 $574,412 $13,567 $144,134 ($1,437) $587,979 $574,412 ($25,880) $1,692 $601,984 ($14,005) ($15,443)May-05 $144,134 $588,352 $654,245 ($65,893) $78,241 ($15,443) $588,352 $654,245 $1,270 $0 $652,976 ($64,624) ($80,066)Jun-05 $78,241 $726,258 $815,649 ($89,391) ($11,150) ($80,066) $726,258 $815,649 ($32,163) $260 $848,072 ($121,814) ($201,881)Jul-05 ($11,150) $909,510 $927,295 ($17,785) ($28,935) ($201,881) $909,510 $927,295 ($23,505) $5,919 $956,719 ($47,208) ($249,089)
Aug-05 ($28,935) $922,858 $997,771 ($74,913) ($103,849) ($249,089) $922,858 $997,771 $1,692 $650 $996,729 ($73,872) ($322,961)Sep-05 ($103,849) $1,003,303 $979,739 $23,564 ($80,284) ($322,961) $1,003,303 $979,739 $0 ($4,202) $975,537 $27,766 ($295,194)Oct-05 ($80,284) $652,864 $0 $652,864 $572,580 ($295,194) $652,864 $0 $652,864 $357,670
$10,794,175 $10,295,999 $498,176 $0 $10,794,175 $10,295,999 ($209,416) ($44,065) $10,461,350 $332,825 ($49,559)
Remove beginning Balance $74,404 Remove beginning Balance $74,404
Subtotal 2005 Actual Annual Over Recovery $498,176 Actual Annual Over Recovery $283,266
(a) column (f) for prior month(b) from Company revenue reports(c) from Last Resort Service invoices(d) column (b) - column (c)(e) n/a(f) column (a) + column (d) + column (e)(g) column (o) for prior month(h) column (b)(i) column (c)(j) from Last Resort Service bills - adjustment booked in current month relating to service rendered in prior month(k) from Last Resort Service bills - for service rendered in current month and booked in subsequent month(l) column (i) - column (j) + column (k)(m) column (h) - column (l)(n) October 2004, October 2006, October 2007: corrections to revenues.(o) (o)=(g)+(m)+(n)
The Narragansett Electric CompanyLast Resort Reconciliation
National Grid R.I.P.U.C. Docket No. ____ Schedule JAL-6 Page 10 of 11

National GridR.I.P.U.C. Docket No. 3902
Attachment 2Page 2 of 2
S:\RADATA1\2007 neco\Reconciliations\[LR_allyears.xls]FINAL_c&i
Adjusted Adjusted Adjusted(Under)/Over Last Last (Under)/Over (Under)/Over Last Last Reconciliation Actual Last Adjusted (Under)/Over
Beginning Resort Resort Monthly Ending Beginning Resort Resort Booked in Reconciliation Resort Monthly Adjustments/ EndingMonth Balance Revenue Expense (Under)/Over Adjustments Balance Balance Revenue Expense Month for Month Expense (Under)/Over Corrections Balance
(a) (b) (c) (d) (e) (f) (g) (h) (i) (j) (k) (l)=(i)-(j)+(k) (m) (n) (o)=(g)+(m)+(n)
The Narragansett Electric CompanyLast Resort Reconciliation
Oct-05 $0 $344,941 $1,173,084 ($828,143) ($828,143) $0 $344,941 $1,173,084 $260 $138,453 $1,311,277 ($966,335) ($966,335)Nov-05 ($828,143) $1,241,826 $2,320,199 ($1,078,373) ($1,906,516) ($966,335) $1,241,826 $2,320,199 $5,919 ($60,677) $2,253,604 ($1,011,778) ($1,978,113)Dec-05 ($1,906,516) $3,085,079 $3,310,880 ($225,801) ($2,132,317) ($1,978,113) $3,085,079 $3,310,880 $650 $113,857 $3,424,087 ($339,008) ($2,317,121)Jan-06 ($2,132,317) $3,788,271 $4,169,003 ($380,732) ($2,513,049) ($2,317,121) $3,788,271 $4,169,003 ($4,202) ($355,953) $3,817,252 ($28,981) ($2,346,102)Feb-06 ($2,513,049) $4,072,193 $3,210,569 $861,624 ($1,651,424) ($2,346,102) $4,072,193 $3,210,569 $113,893 ($85,155) $3,011,521 $1,060,672 ($1,285,429)Mar-06 ($1,651,424) $3,095,253 $2,420,648 $674,605 ($976,819) ($1,285,429) $3,095,253 $2,420,648 $138,453 ($120,073) $2,162,122 $933,131 ($352,298)Apr-06 ($976,819) $1,628,945 $1,315,646 $313,299 ($663,520) ($352,298) $1,628,945 $1,315,646 ($60,677) ($111,827) $1,264,496 $364,449 $12,151 May-06 ($663,520) $1,206,364 $1,441,205 ($234,841) ($898,361) $12,151 $1,206,364 $1,441,205 $113,857 $7,143 $1,334,492 ($128,128) ($115,977)Jun-06 ($898,361) $1,201,409 $1,032,997 $168,412 ($729,949) ($115,977) $1,201,409 $1,032,997 ($355,953) ($59,066) $1,329,883 ($128,475) ($244,452)Jul-06 ($729,949) $1,355,797 $1,556,525 ($200,728) ($930,677) ($244,452) $1,355,797 $1,556,525 ($85,155) ($3,456) $1,638,224 ($282,427) ($526,879)
Aug-06 ($930,677) $1,595,365 $1,524,415 $70,950 ($859,727) ($526,879) $1,595,365 $1,524,415 ($120,073) $146,472 $1,790,960 ($195,595) ($722,474)Sep-06 ($859,727) $1,421,386 $1,106,095 $315,291 ($544,436) ($722,474) $1,421,386 $1,106,095 ($111,827) $164,857 $1,382,779 $38,607 ($683,867)Oct-06 ($544,436) $745,845 $0 $745,845 $201,408 ($683,867) $745,845 $0 $745,845 $61,978
Subtotal 2006 $24,782,674 $24,581,266 $201,408 $0 $24,782,674 $24,581,266 ($364,855) ($225,424) $24,720,696 $61,978 $0
Oct-06 $0 $477,260 $1,334,687 ($857,427) ($857,427) $0 $477,260 $1,334,687 $7,143 $164,857 $1,492,401 ($1,015,141) ($608) ($1,015,749)Nov-06 ($857,427) $1,184,140 $777,547 $406,594 ($450,834) ($1,015,749) $1,184,140 $777,547 ($59,066) $111,914 $948,527 $235,614 ($780,135)Dec-06 ($450,834) $1,061,727 $1,131,079 ($69,351) ($520,185) ($780,135) $1,061,727 $1,131,079 ($3,456) $108,373 $1,242,908 ($181,180) ($961,316)Jan-07 ($520,185) $1,517,954 $1,836,143 ($318,189) ($838,374) ($961,316) $1,517,954 $1,836,143 $146,472 ($57,216) $1,632,455 ($114,500) ($1,075,816)Feb-07 ($838,374) $1,729,576 $1,720,539 $9,037 ($829,337) ($1,075,816) $1,729,576 $1,720,539 $164,857 ($12,209) $1,543,473 $186,103 ($889,713)Mar-07 ($829,337) $1,616,232 $1,530,635 $85,597 ($743,740) ($889,713) $1,616,232 $1,530,635 $111,914 ($54,158) $1,364,563 $251,669 ($638,044)Apr-07 ($743,740) $1,376,765 $1,117,578 $259,187 ($484,553) ($638,044) $1,376,765 $1,117,578 $108,373 ($11,248) $997,957 $378,808 ($259,236)May-07 ($484,553) $1,040,685 $1,064,726 ($24,041) ($508,595) ($259,236) $1,040,685 $1,064,726 ($57,216) $845 $1,122,787 ($82,103) ($341,339)Jun-07 ($508,595) $1,136,835 $1,230,607 ($93,772) ($602,367) ($341,339) $1,136,835 $1,230,607 ($12,209) $12,693 $1,255,510 ($118,675) ($460,014)Jul-07 ($602,367) $1,354,256 $1,466,848 ($112,592) ($714,959) ($460,014) $1,354,256 $1,466,848 ($54,158) $68,888 $1,589,894 ($235,638) ($695,652)
Aug-07 ($714,959) $1,526,098 $1,796,984 ($270,886) ($985,845) ($695,652) $1,526,098 $1,796,984 ($11,248) $263,300 $2,071,532 ($545,434) ($1,241,086)Sep-07 ($985,845) $2,084,985 $1,920,857 $164,128 ($821,717) ($1,241,086) $2,084,985 $1,920,857 $845 $104,718 $2,024,729 $60,256 ($1,180,830)Oct-07 ($821,717) $1,473,788 $0 $1,473,788 $652,071 ($1,180,830) $1,473,788 $0 $1,473,788 ($11,205) $281,753
Subtotal 2007 $17,580,302 $16,928,231 $652,071 $0 $17,580,302 $16,928,231 $342,252 $700,757 $17,286,736 $293,566 ($11,813)
Cumulative Total $65,949,214 $64,524,412 $1,424,802 $0 $1,424,802 $65,949,214 $64,524,412 ($284,001) $450,082 $65,258,496 $690,718 ($61,372) $629,346
(a) column (f) for prior month(b) from Company revenue reports(c) from Last Resort Service invoices(d) column (b) - column (c)(e) n/a(f) column (a) + column (d) + column (e)(g) column (o) for prior month(h) column (b)(i) column (c)(j) from Last Resort Service bills - adjustment booked in current month relating to service rendered in prior month(k) from Last Resort Service bills - for service rendered in current month and booked in subsequent month(l) column (i) - column (j) + column (k)(m) column (h) - column (l)(n) October 2004, October 2006, October 2007: corrections to revenues.(o) (o)=(g)+(m)+(n)
National Grid R.I.P.U.C. Docket No. ____ Schedule JAL-6 Page 11 of 11

Schedule JAL-7

NATIONAL GRID R.I.P.U.C. DOCKET NO. ____
JANUARY 2009 ELECTRIC RETAIL RATE FILING WITNESS: JEANNE A. LLOYD
S:\RADATA1\2008 neco\Annual Filing\JALtestimony-2009.doc
Schedule JAL-7
Last Resort Service Reconciliation for the period October 2006 through September 2007
Adjusted for Out-of-Period Expenses

S:\RADATA1\2008 neco\Reconciliations\[Recs_2008.neco-Nancy's.xls]Last Resort (rev & exp matc (2) National GridR.I.P.U.C. No. ____
Schedule JAL-7Page 1 of 1
(Under)/Over Last Last Reconciliations Reconciliations (Under)/OverBeginning Resort Resort Adjustment as Adjustment Monthly Ending
Month Balance Revenue Expense Booked (4-mo lag) Service Mo. (Under)/Over Balance(a) (b) (c) (d) (e) (f) (g)
Oct-06 $0 $477,260 $1,334,687 $6,890 $164,731 ($1,015,268) ($1,015,268)Nov-06 ($1,015,268) $1,184,140 $777,547 ($59,189) $111,783 $235,622 ($779,646)Dec-06 ($779,646) $1,061,727 $1,131,079 ($3,783) $8,123 ($81,257) ($860,903)Jan-07 ($860,903) $1,517,954 $1,836,143 $146,342 ($53,949) ($117,898) ($978,802)Feb-07 ($978,802) $1,729,576 $1,720,539 $164,731 ($10,445) $184,213 ($794,589)Mar-07 ($794,589) $1,616,232 $1,530,635 $111,783 ($51,676) $249,055 ($545,534)Apr-07 ($545,534) $1,376,765 $1,117,578 $8,123 ($10,539) $277,849 ($267,685)
May-07 ($267,685) $1,040,685 $1,064,726 ($53,949) $845 ($78,835) ($346,520)Jun-07 ($346,520) $1,136,835 $1,230,607 ($10,445) $12,693 ($116,910) ($463,430)Jul-07 ($463,430) $1,354,256 $1,466,848 ($51,676) $68,888 ($233,156) ($696,586)
Aug-07 ($696,586) $1,526,098 $1,796,984 ($10,539) $263,300 ($544,725) ($1,241,311)Sep-07 ($1,241,311) $2,084,985 $1,920,857 $845 $99,522 $65,452 ($1,175,860)Oct-07 ($1,175,860) $1,473,788 $0 $1,473,788 $297,928
Totals $0 $17,580,302 $16,928,231 $249,136 $603,278 $297,928 $297,928
Interest $6,834
Ending Balance with Interest $304,762
Column (a) Column (g) from previous rowColumn (b) from Docket No. 3902, Schedule JAL-5, page3 of 5.Column (c) from Docket No. 3902, Schedule JAL-5, page3 of 5.Column (d) Last Resort Service invoicesColumn (e) Last Resort Service invoicesColumn (f) Column (b) - (Columm (c) + Column (d) - Column (e))Column (g) Column (a) + Column (f)
Last Resort Service Reconciliation - Adjustments Matched with Month of Service

Schedule JA
L-8

NATIONAL GRID R.I.P.U.C. DOCKET NO. ____
JANUARY 2009 ELECTRIC RETAIL RATE FILING WITNESS: JEANNE A. LLOYD
S:\RADATA1\2008 neco\Annual Filing\JALtestimony-2009.doc
Schedule JAL-8
Renewable Energy Standard Reconciliation
for the period October 2007 through September 2008

S:\RADATA1\2008 neco\Reconciliations\[Recs_2008.neco-Nancy's.xls]RES National GridR.I.P.U.C. Docket No ____
Schedule JAL- 8Page 1 of 2
Over(Under)Over(Under) EndingBeginning RES RES Monthly Monthly
Month Balance Revenue Expense Over(Under) Balance(a) (b) (c) (d) (e)
(1) Oct-07 $3,219,301 $111,772 $0 $111,772 $3,331,073 Nov-07 $3,331,073 $317,836 $0 $317,836 $3,648,910 Dec-07 $3,648,910 $362,807 $632,394 ($269,587) $3,379,322 Jan-08 $3,379,322 $418,748 $609,606 ($190,858) $3,188,464 Feb-08 $3,188,464 $471,914 $64,917 $406,997 $3,595,461 Mar-08 $3,595,461 $426,241 $492,689 ($66,448) $3,529,013 Apr-08 $3,529,013 $461,233 $1,527,640 ($1,066,407) $2,462,607
May-08 $2,462,607 $379,231 $1,041,408 ($662,176) $1,800,431 Jun-08 $1,800,431 $429,834 $803,736 ($373,902) $1,426,529 Jul-08 $1,426,529 $518,499 $44,450 $474,049 $1,900,578
Aug-08 $1,900,578 $589,305 $0 $589,305 $2,489,883 Sep-08 $2,489,883 $559,896 $450,679 $109,217 $2,599,100
(2) Oct-08 $2,599,100 $269,186 $269,186 $2,868,286
Totals $3,219,301 $5,316,504 $5,667,519 ($351,015) $2,868,286
Interest (3) $143,084
Ending Balance with Interest $3,011,370
(1) Reflects kWhs consumption after October 1st.(2) Reflects kWhs consumption prior to October 1st.(3) Interest expense calculation : (3219300.96741+2868286)/2*((4.80%*5/12)+(4.63%*7/12))
Column Notes:Column (a) Column (e) from previous row; beginning balance from RIPUC Docket No. 3902Column (b) from Page 2Column (c) from InvoicesColumn (d) Column (b) - Column (c)Column (e) Column (a) + Column (d)
Renewable Energy Standard Charge Revenue and ExpenseOctober 2007 through September 2008

National GridR.I.P.U.C. Docket No ____
Schedule JAL- 8Page 2 of 2
StandardOffer Last Resort TotalRES RES RES
Revenue Revenue Revenue(a) (b) (c)
(1) Oct-07 $106,822 $4,950 $111,772 Nov-07 $306,392 $11,444 $317,836 Dec-07 $352,965 $9,842 $362,807 Jan-08 $408,642 $10,106 $418,748 Feb-08 $461,443 $10,471 $471,914 Mar-08 $414,341 $11,900 $426,241 Apr-08 $449,937 $11,296 $461,233
May-08 $368,151 $11,081 $379,231 Jun-08 $418,353 $11,481 $429,834 Jul-08 $506,527 $11,972 $518,499
Aug-08 $567,856 $21,449 $589,305 Sep-08 $521,495 $38,401 $559,896
(2) Oct-08 $251,446 $17,741 $269,186
$5,134,370 $182,134 $5,316,504
SO LRS(1) Reflects kWhs consumption after October 1, 2007 32.68% 32.11%(2) Reflects kWhs consumption prior to October 1, 2008 55.95% 62.09%
Column Notes:Column (a) from monthly revenue reportColumn (b) from monthly revenue reportColumn (c) Column (a) + Column (b)
Renewable Energy Standard Charge Revenue October 2007 through September 2008

Schedule JA
L-9
NATIONAL GRID R.I.P.U.C. DOCKET NO. ____
JANUARY 2009 ELECTRIC RETAIL RATE FILING WITNESS: JEANNE A. LLOYD
S:\RADATA1\2008 neco\Annual Filing\JALtestimony-2009.doc
Schedule JAL-9
Calculation of Proposed Non-Bypassable Transition Charge for January 2009

S:\RADATA1\2008 neco\Annual Filing\[ctc-2009.XLS]Page1 National Grid11-Nov-08 R.I.P.U.C. Docket No. ____
Schedule JAL-9Page 1 of 2
Calculation of Proposed Non-bypassable Transition Charge for January 2009
Section 1: Individual CTC Amounts
ExpectedCTC GWhs CTC Costs(1) (2) (3)
Narragansett2009 $0.00050 5,695 $2,847,500
BVE2009 $0.00810 1,513 $12,255,300
Newport2009 $0.00630 609 $3,836,700
Total CTC Costs $18,939,500
Section 2: Total Estimated CTC Costs and Transition Charge Calculation
Total TotalCompany Company
Total GWhs CTC Costs(4) (5)
2009 7,817.000 $18,939,500
(6) 2009 Transition Charge 0.242
(1) Per 2008 NEP and Montaup CTC Reconciliation Reports, Schedule 1 for 2009(2) Per 2008 NEP and Montaup CTC Reconciliation Reports, Schedule 1 for 2009(3) (1) x (2)(4) Sum of Narragansett, BVE and Newport GWhs for appropriate year(5) Sum of Narragansett, BVE and Newport CTC Costs for appropriate year(6) (5) ÷ (4)

S:\RADATA1\2008 neco\Annual Filing\[ctc-2009.XLS]Page2 National Grid12-Nov-08 R.I.P.U.C. Docket No. ____
Schedule JAL-9Page 2 of 2
Calculation of Proposed Non-bypassable Transition Charge for January 2009
Section 1. Calculation of 2009 Non-Bypassable Transition Charge
(1) 2009 Transition Charge $0.00242
(2) Transition Charge Over Recovery at September 30, 2008 $604,680
(3) divided by: forecasted kWh deliveries for 2009 7,976,911,561
(4) Transition charge kWh Recovery Factor $0.00007
(5) Proposed Transition Charge for January 1, 2009 $0.00235
(1) Page 1 of 2, (6)(2) Schedule JAL-10, pages 1 and 7; 2008 over recovery of $584,017 plus interest during refund period of $20,663.(3) from Company forecast(4) Line (2) ÷ Line (3), truncated after 5 decimal places(5) Line (1) - Line (4)

Schedule JAL-10

NATIONAL GRID R.I.P.U.C. DOCKET NO. ____
JANUARY 2009 ELECTRIC RETAIL RATE FILING WITNESS: JEANNE A. LLOYD
S:\RADATA1\2008 neco\Annual Filing\JALtestimony-2009.doc
Schedule JAL-10
Non-Bypassable Transition Charge Reconciliation
for the period October 2007 through September 2008

National GridR.I.P.U.C. Docket No. ____
Schedule JAL-10Page 1 of 7
(Under)/Over Transition Contract (Under)/Over (Under)/OverBeginning Charge Termination Ending Ending
Company Balance Revenue Expense (Under)/Over Balance Adjustments Interest Balance(a) (b) (c) (d) (e) (f) (g) (h)
Narragansett $0 $24,163,241 $14,566,111 $9,597,130 $9,597,130 $39,869 $244,957 $9,881,956
Blackstone $0 $5,550,091 $12,255,488 ($6,705,397) ($6,705,397) $0 ($215,291) ($6,920,688)
Newport $0 $2,588,852 $4,897,877 ($2,309,025) ($2,309,025) $0 ($68,226) ($2,377,251)
Total Company $0 $32,302,183 $31,719,476 $582,707 $582,707 $39,869 ($38,560) $584,017
Column (a) From Pages 2, 3 and 4, column (a): October 2007Column (b) From Pages 2, 3 and 4, column (b): TotalColumn (c) From Pages 2, 3 and 4, column (c): TotalColumn (d) column (b) - column (c)Column (e) column (a) + column (d)Column (f) Jan 2008: Remaining balance from under recovery incurred for the period October 2005 through September 2006 from page 6.
Column (g) From Pages 2, 3 and 4, column (h): TotalColumn (h) column (e) + column (f) + column (g)
Non-Bypassable Transition Charge Reconciliation - Total Company

National GridR.I.P.U.C. Docket No. ____
Schedule JAL-10Page 2 of 7
(Under)/Over Transition Contract (Under)/Over MonthlyBeginning Charge Termination Monthly Ending Interest Interest Monthly Ending
Month Balance Revenue Expense (Under)/Over Balance Balance Rate Interest Adjustments Balance(a) (b) (c) (d) (e) (f) (g) (h) (i) (j)
Oct-07 $0 2,738,318 $1,728,091 $1,010,227 $1,010,227 $505,114 4.800% $2,020 $1,012,248Nov-07 $1,012,248 2,586,816 $1,632,485 $954,330 $1,966,578 $1,489,413 4.800% $5,958 $1,972,535Dec-07 $1,972,535 2,870,941 $1,844,193 $1,026,748 $2,999,284 $2,485,910 4.800% $9,944 $3,009,227Jan-08 $3,009,227 2,615,269 $1,559,209 $1,056,060 $4,065,287 $3,537,257 4.800% $14,149 $39,869 $4,119,306Feb-08 $4,119,306 1,640,751 $956,992 $683,759 $4,803,065 $4,461,185 4.800% $17,845 $4,820,909Mar-08 $4,820,909 1,548,207 $893,452 $654,755 $5,475,664 $5,148,287 4.630% $19,864 $5,495,528Apr-08 $5,495,528 1,652,083 $966,470 $685,613 $6,181,141 $5,838,335 4.630% $22,526 $6,203,667
May-08 $6,203,667 1,352,524 $791,418 $561,106 $6,764,773 $6,484,220 4.630% $25,018 $6,789,792Jun-08 $6,789,792 1,540,876 $902,049 $638,827 $7,428,619 $7,109,205 4.630% $27,430 $7,456,049Jul-08 $7,456,049 1,822,411 $1,067,936 $754,475 $8,210,524 $7,833,286 4.630% $30,223 $8,240,747
Aug-08 $8,240,747 2,021,556 $1,184,692 $836,864 $9,077,612 $8,659,179 4.630% $33,410 $9,111,022Sep-08 $9,111,022 1,773,490 $1,039,125 $734,364 $9,845,386 $9,478,204 4.630% $36,570 $9,881,956
Total $0 $24,163,241 $14,566,111 $9,597,130 $9,597,130 $244,957 $39,869 $9,881,956
Column (a) prior month column (j) Column (b) From Transition Revenues to Narragansett Electric CompanyColumn (c) From CTC Bills to Narragansett Electric CompanyColumn (d) Column (b) - Column (c)Column (e) Column (a) + Column (d)Column (f) (Column (a) + Column (e))÷ 2Column (g) Customer Deposit RateColumn (h) Column (f) * (Column (g)/12)Column (i) Jan 2008: Remaining balance from under recovery incurred for the period October 2005 through September 2006 from page 6.Column (j) Column (e) + Column (h) + Column (i)
Non-Bypassable Transition Charge Reconciliation - Narragansett Electric Company

National GridR.I.P.U.C. Docket No. ____
Schedule JAL-10Page 3 of 7
(Under)/Over Transition Contract (Under)/Over MonthlyBeginning Charge Termination Monthly Ending Interest Interest Monthly Ending
Month Balance Revenue Expense (Under)/Over Balance Balance Rate Interest Adjustments Balance(a) (b) (c) (d) (e) (f) (g) (h) (i) (j)
(1) Oct-07 $0 204,335 $1,318,736 ($1,114,401) ($1,114,401) ($557,201) 4.800% ($2,229) ($1,116,630)Nov-07 ($1,116,630) 604,297 $1,274,328 ($670,031) ($1,786,661) ($1,451,645) 4.800% ($5,807) ($1,792,467)Dec-07 ($1,792,467) 653,075 $1,410,151 ($757,076) ($2,549,543) ($2,171,005) 4.800% ($8,684) ($2,558,227)Jan-08 ($2,558,227) 587,382 $1,241,805 ($654,423) ($3,212,650) ($2,885,439) 4.800% ($11,542) ($3,224,192)Feb-08 ($3,224,192) 393,699 $879,335 ($485,636) ($3,709,828) ($3,467,010) 4.800% ($13,868) ($3,723,696)Mar-08 ($3,723,696) 338,395 $768,654 ($430,259) ($4,153,955) ($3,938,825) 4.630% ($15,197) ($4,169,152)Apr-08 ($4,169,152) 384,122 $867,862 ($483,740) ($4,652,892) ($4,411,022) 4.630% ($17,019) ($4,669,911)
May-08 ($4,669,911) 328,057 $740,803 ($412,746) ($5,082,657) ($4,876,284) 4.630% ($18,814) ($5,101,471)Jun-08 ($5,101,471) 360,119 $815,604 ($455,486) ($5,556,957) ($5,329,214) 4.630% ($20,562) ($5,577,519)Jul-08 ($5,577,519) 412,299 $933,948 ($521,649) ($6,099,168) ($5,838,344) 4.630% ($22,526) ($6,121,694)
Aug-08 ($6,121,694) 447,250 $1,012,731 ($565,481) ($6,687,176) ($6,404,435) 4.630% ($24,710) ($6,711,886)Sep-08 ($6,711,886) 437,689 $991,531 ($553,842) ($7,265,728) ($6,988,807) 4.630% ($26,965) ($7,292,693)
(2) Oct-08 ($7,292,693) 399,373 $0 $399,373 ($6,893,321) ($7,093,007) 4.630% ($27,367) ($6,920,688)
Total $0 $5,550,091 $12,255,488 ($6,705,397) ($215,291)
(1) Reflects revenues based on kWhs consumed after October 1st(2) Reflects revenues based on kWhs consumed prior to October 1st
Column (a) prior month column (j) Column (b) From Transition Revenues to Narragansett Electric Company for the former Blackstone Valley ElectricColumn (c) From CTC Bills to Narragansett Electric Company for the former Blackstone Valley ElectricColumn (d) Column (b) - Column (c)Column (e) Column (a) + Column (d)Column (f) (Column (a) + Column (e))÷ 2Column (g) Customer Deposit RateColumn (h) Column (f) * (Column (g)/12)Column (i)Column (j) Column (e) + Column (h) + Column (i)
Non-Bypassable Transition Charge Reconciliation - former Blackstone Valley Electric

National GridR.I.P.U.C. Docket No. ____
Schedule JAL-10Page 4 of 7
(Under)/Over Transition Contract (Under)/Over MonthlyBeginning Charge Termination Monthly Ending Interest Interest Monthly Ending
Month Balance Revenue Expense (Under)/Over Balance Balance Rate Interest Adjustments Balance(a) (b) (c) (d) (e) (f) (g) (h) (i) (j)
(1) Oct-07 $0 96,657 $499,039.0 ($402,382) ($402,382) ($201,191) 4.800% ($805) ($403,187)Nov-07 ($403,187) 284,413 $469,163.0 ($184,750) ($587,937) ($495,562) 4.800% ($1,982) ($589,919)Dec-07 ($589,919) 304,336 $521,126.8 ($216,791) ($806,710) ($698,314) 4.800% ($2,793) ($809,503)Jan-08 ($809,503) 295,801 $475,333.5 ($179,533) ($989,036) ($899,269) 4.800% ($3,597) ($992,633)Feb-08 ($992,633) 184,535 $340,247.0 ($155,712) ($1,148,345) ($1,070,489) 4.800% ($4,282) ($1,152,626)Mar-08 ($1,152,626) 160,060 $298,532.6 ($138,473) ($1,291,099) ($1,221,863) 4.630% ($4,714) ($1,295,814)Apr-08 ($1,295,814) 184,474 $339,137.4 ($154,663) ($1,450,477) ($1,373,145) 4.630% ($5,298) ($1,455,775)
May-08 ($1,455,775) 152,254 $279,803.6 ($127,550) ($1,583,325) ($1,519,550) 4.630% ($5,863) ($1,589,188)Jun-08 ($1,589,188) 160,761 $297,861.1 ($137,100) ($1,726,288) ($1,657,738) 4.630% ($6,396) ($1,732,684)Jul-08 ($1,732,684) 184,181 $341,290.9 ($157,110) ($1,889,794) ($1,811,239) 4.630% ($6,988) ($1,896,782)
Aug-08 ($1,896,782) 225,100 $417,101.5 ($192,001) ($2,088,783) ($1,992,783) 4.630% ($7,689) ($2,096,472)Sep-08 ($2,096,472) 334,193 $619,240.1 ($285,047) ($2,381,519) ($2,238,996) 4.630% ($8,639) ($2,390,158)
(2) Oct-08 ($2,390,158) 22,086 $0.0 $22,086 ($2,368,072) ($2,379,115) 4.630% ($9,179) ($2,377,251)
Total $0 $2,588,852 $4,897,877 ($2,309,025) ($68,226)
(1) Reflects revenues based on kWhs consumed after October 1st(2) Reflects revenues based on kWhs consumed prior to October 1st
Column (a) prior month column (j) Column (b) From Transition Revenues to Narragansett Electric Company for the former Newport ElectricColumn (c) From CTC Bills to Narragansett Electric Company for the former Newport ElectricColumn (d) Column (b) - Column (c)Column (e) Column (a) + Column (d)Column (f) (Column (a) + Column (e))÷ 2Column (g) Customer Deposit RateColumn (h) Column (f) * (Column (g)/12)Column (i)Column (j) Column (e) + Column (h) + Column (i)
Non-Bypassable Transition Charge Reconciliation - former Newport Electric Corporation

S:\RADATA1\2008 neco\Reconciliations\[Recs_2008.neco-Nancy's.xls]Transition National GridR.I.P.U.C. Docket No. ____
Schedule JAL-10Page 5 of 7
Section 1. Recovery:Beginning Transition Charge Ending
Over/(Under) Over/(Under) Over/(Under) Monthly EndingRecovery Recovery Recovery Interest Interest Monthly Balance
Month Balance Refund Balance Balance Rate Interest w/ Interest(a) (b) (c) (d) (e) (f) (g)
Oct-07 $1,445,649 $0 $1,445,649 $1,445,649 4.800% $5,783 $1,451,432Nov-07 $1,451,432 $0 $1,451,432 $1,451,432 4.800% $5,806 $1,457,237Dec-07 $1,457,237 $0 $1,457,237 $1,457,237 4.800% $5,829 $1,463,066
(1) Jan-08 $1,463,066 (51,507) $1,411,560 $1,437,313 4.800% $5,749 $1,417,309Feb-08 $1,417,309 (116,407) $1,300,902 $1,359,106 4.800% $5,436 $1,306,339Mar-08 $1,306,339 (106,909) $1,199,430 $1,252,884 4.630% $4,834 $1,204,264Apr-08 $1,204,264 (116,960) $1,087,305 $1,145,784 4.630% $4,421 $1,091,725
May-08 $1,091,725 (96,539) $995,186 $1,043,456 4.630% $4,026 $999,212Jun-08 $999,212 (108,761) $890,451 $944,832 4.630% $3,645 $894,097Jul-08 $894,097 (127,698) $766,399 $830,248 4.630% $3,203 $769,602
Aug-08 $769,602 (142,214) $627,388 $698,495 4.630% $2,695 $630,083Sep-08 $630,083 (134,392) $495,691 $562,887 4.630% $2,172 $497,863Oct-08 $497,863 (118,022) $379,840 $438,851 4.630% $1,693 $381,533
Nov-08 $381,533 - $381,533 $381,533 4.630% $1,472 $383,006Dec-08 $383,006 - $383,006 $383,006 4.630% $1,478 $384,483
(2) Jan-09 $384,483 - $384,483 $384,483 4.630% $1,483 $385,967
(1) Reflects kWhs consumed after January 1st. 40.490%(2) Reflects kWhs consumed prior to January 1st. 0.000%
(a) Beginning balance from Docket No. 3902, Schedule JAL-8, page 1.(b) from Section 2.(c) Column (a) + Column (b)(d) (Column (a) + Column (c)) ÷ 2(e) Customer Deposits Rate(f) Column (d) x (Column (e) ÷ 12)(g) Column (c) + Column (f)
Section 2. Factor Revenue:
Factor: ($0.00018)
Blackstone Blackstone Newport Newport Narragansett Narragansett TotalkWh (Over)/Under kWh (Over)/Under kWh (Over)/Under (Over)/Under
Month Deliveries Revenues Deliveries Revenues Deliveries Revenues Revenues(a) (b) (c) (d) (e) (f) (g)
Jan-08 121,046,245 ($21,788) 57,692,826 ($10,385) 527,975,719 ($95,036) (127,209) Feb-08 114,199,356 ($20,556) 54,007,465 ($9,721) 478,495,988 ($86,129) (116,407) Mar-08 99,825,197 ($17,969) 47,386,132 ($8,530) 446,726,025 ($80,411) (106,909) Apr-08 112,709,299 ($20,288) 53,831,328 ($9,690) 483,234,772 ($86,982) (116,960) May-08 96,208,137 ($17,317) 44,413,262 ($7,994) 395,708,961 ($71,228) (96,539) Jun-08 105,922,631 ($19,066) 47,279,544 ($8,510) 451,024,383 ($81,184) (108,761) Jul-08 121,291,999 ($21,833) 54,173,159 ($9,751) 533,968,036 ($96,114) (127,698)
Aug-08 131,523,466 ($23,674) 66,206,592 ($11,917) 592,345,927 ($106,622) (142,214) Sep-08 128,770,274 ($23,179) 98,292,073 ($17,693) 519,562,632 ($93,521) (134,392) Oct-08 197,945,650 ($35,630) 10,760,078 ($1,937) 446,974,558 ($80,455) (118,022)
Nov-08 - $0 - $0 - $0 - Dec-08 - $0 - $0 - $0 - Jan-09 - $0 - $0 - $0 -
(a) from monthly revenue reports(b) Column (a) x Factor(c) from monthly revenue reports(d) Column (c) x Factor(e) from monthly revenue reports(f) Column (e) x Factor(g) Column (b) + Column (d) +Column (f)
October 2006 through September 2007Transition Charge Under/Over Recovery

S:\RADATA1\2008 neco\Reconciliations\[Recs_2008.neco-Nancy's.xls]Transition National GridR.I.P.U.C. Docket No. ____
Schedule JAL-10Page 6 of 7
Section 1. Recovery:Beginning Transition Charge Ending
Over/(Under) Over/(Under) Over/(Under) Monthly EndingRecovery Recovery Recovery Interest Interest Monthly Balance
Month Balance Refund Balance Balance Rate Interest w/ Interest(a) (b) (c) (d) (e) (f) (g)
Oct-06 $798,533 $0 $798,533 $798,533 4.290% $2,855 $801,388Nov-06 $801,388 $0 $801,388 $801,388 4.290% $2,865 $804,253Dec-06 $804,253 $0 $804,253 $804,253 4.290% $2,875 $807,128
(1) Jan-07 $807,128 (29,184) $777,944 $792,536 4.290% $2,833 $780,777Feb-07 $780,777 (63,568) $717,209 $748,993 4.290% $2,678 $719,887Mar-07 $719,887 (65,088) $654,799 $687,343 4.800% $2,749 $657,548Apr-07 $657,548 (59,118) $598,430 $627,989 4.800% $2,512 $600,942
May-07 $600,942 (57,512) $543,429 $572,186 4.800% $2,289 $545,718Jun-07 $545,718 (62,830) $482,888 $514,303 4.800% $2,057 $484,945Jul-07 $484,945 (68,022) $416,923 $450,934 4.800% $1,804 $418,727
Aug-07 $418,727 (76,017) $342,710 $380,718 4.800% $1,523 $344,233Sep-07 $344,233 (72,473) $271,760 $307,996 4.800% $1,232 $272,992Oct-07 $272,992 (64,190) $208,801 $240,897 4.800% $964 $209,765
Nov-07 $209,765 (60,853) $148,912 $179,338 4.800% $717 $149,629Dec-07 $149,629 (68,407) $81,222 $115,425 4.800% $462 $81,683
(2) Jan-08 $81,683 (42,057) $39,627 $60,655 4.800% $243 $39,869
(1) Reflects kWhs consumed after January 1st. 41.760%(2) Reflects kWhs consumed prior to January 1st. 59.510%
(a) Beginning balance from Docket No.3788, Schedule JAL-6, page 1(b) from Section 2, column (g)(c) Column (a) + Column (b)(d) (Column (a) + Column (c)) ÷ 2(e) Customer Deposits Rate(f) Column (d) x (Column (e) ÷ 12)(g) Column (c) + Column (f)
Section 2. Factor Revenue:
Factor: ($0.00010)
Blackstone Blackstone Newport Newport Narragansett Narragansett TotalkWh (Over)/Under kWh (Over)/Under kWh (Over)/Under (Over)/Under
Month Deliveries Revenues Deliveries Revenues Deliveries Revenues Revenues(a) (b) (c) (d) (e) (f) (g)
Jan-07 118,262,357 ($11,826) 54,783,138 ($5,478) 525,812,554 ($52,581) (69,886) Feb-07 114,414,254 ($11,441) 50,866,376 ($5,087) 470,400,143 ($47,040) (63,568) Mar-07 111,790,630 ($11,179) 51,167,550 ($5,117) 487,919,608 ($48,792) (65,088) Apr-07 105,557,206 ($10,556) 45,888,501 ($4,589) 439,738,838 ($43,974) (59,118) May-07 102,187,544 ($10,219) 47,992,906 ($4,799) 424,940,737 ($42,494) (57,512) Jun-07 111,000,166 ($11,100) 44,433,470 ($4,443) 472,867,245 ($47,287) (62,830) Jul-07 115,927,499 ($11,593) 50,952,853 ($5,095) 513,343,634 ($51,334) (68,022)
Aug-07 132,513,854 ($13,251) 59,739,142 ($5,974) 567,915,587 ($56,792) (76,017) Sep-07 130,125,945 ($13,013) 54,698,681 ($5,470) 539,905,419 ($53,991) (72,473) Oct-07 109,894,693 ($10,989) 51,983,234 ($5,198) 480,025,266 ($48,003) (64,190)
Nov-07 106,194,027 ($10,619) 48,871,143 ($4,887) 453,468,155 ($45,347) (60,853) Dec-07 117,512,576 ($11,751) 54,284,044 ($5,428) 512,275,725 ($51,228) (68,407) Jan-08 121,046,245 ($12,105) 57,692,826 ($5,769) 527,975,719 ($52,798) (70,671)
(a) from monthly revenue reports(b) Column (a) x Factor(c) from monthly revenue reports(d) Column (c) x Factor(e) from monthly revenue reports(f) Column (e) x Factor(f) Column (b) + Column (d) +Column (f)
Transition Charge Under/Over RecoveryOctober 2005 through December 2006

S:\RADATA1\2008 neco\Reconciliations\[Recs_2008.neco-Nancy's.xls]Transition National GridR.I.P.U.C. Docket No. ____
Schedule JAL-10Page 7 of 7
Calculation of Interest and Over Recovery Factor
Beginning Surcharge/ Ending Interest InterestMonth Balance (Refund) Balance Rate
(1) (2) (3) (4) (5)
Oct-2007 $584,017 $0 $584,017 4.6300% $2,253Nov-2007 $586,270 $0 $586,270 4.6300% $2,262Dec-2007 $588,532 $0 $588,532 4.6300% $2,271Jan-2008 $590,803 $49,234 $541,569 4.6300% $2,185Feb-2008 $543,754 $49,432 $494,322 4.6300% $2,003Mar-2008 $496,324 $49,632 $446,692 4.6300% $1,819Apr-2008 $448,511 $49,835 $398,677 4.6300% $1,634May-2008 $400,311 $50,039 $350,272 4.6300% $1,448Jun-2008 $351,720 $50,246 $301,474 4.6300% $1,260Jul-2008 $302,734 $50,456 $252,279 4.6300% $1,071Aug-2008 $253,349 $50,670 $202,680 4.6300% $880Sep-2008 $203,559 $50,890 $152,669 4.6300% $687Oct-2008 $153,357 $51,119 $102,238 4.6300% $493Nov-2008 $102,731 $51,365 $51,365 4.6300% $297Dec-2008 $51,663 $51,663 $0 4.6300% $100
$20,663
Total Surcharge/(Refund) to Customers with Interest $604,679
2009 Forecasted kWh Sales 7,976,911,561
Reconciliation Transmission Adjustment Factor per kWh $0.00007
Notes:1 Column (3) + Column (5) of previous month2 For Jan, (Column (1)) ÷ 12. For Feb, (Column (1)) ÷ 11, etc.3 Column (1) - Column (2)4 Current Rate for Customer Deposits 5 ((( Column (1) + Column (3))÷2)* Column (4)) ÷ 12

Schedule JA
L-11

NATIONAL GRID R.I.P.U.C. DOCKET NO. ____
JANUARY 2009 ELECTRIC RETAIL RATE FILING WITNESS: JEANNE A. LLOYD
S:\RADATA1\2008 neco\Annual Filing\JALtestimony-2009.doc
Schedule JAL-11
Calculation of Proposed Transmission Adjustment Factor for January 2009

National GridR.I.P.U.C. Docket No. ____
Schedule JAL-11Page 1 of 2
Calculation of Proposed Transmission Adjustment Factor for January 2009Effective January 1, 2009 - December 31, 2009
(1) Forecasted 2009 Transmission Expense $103,918,322
(2) 2009 Forecasted kWh Sales 7,976,911,561
(3) Average 2009 Transmission Expense per kWh $0.01302
(4) Forecasted 2009 Average Base Transmission Charge Revenue $0.00402
(5) Forecasted 2009 Transmission Expense Collected in Adjustment Factor $0.00900
(6) Implementation of 2009 Under recovery factor $0.00164
(7) Proposed 2009 Transmission Adjustment Factor $0.01064
(1) from Schedule PAV-1, Summary, Page 1 of 1(2) from Company forecast(3) Line (1) ÷ Line (2)(4) from Schedule JAL-11, Page 2(5) Line (3) - Line (4)(6) from Schedule JAL-12, Page 8(7) Line (6) + Line (7)

S:\RADATA1\2007 neco\Reconciliations\[TRANSMISSION_07.XLS]recon National GridR.I.P.U.C. Docket No. ____
Schedule JAL-11Page 2 of 2
Projected 2009 Base Transmission Revenue
A16 A60 E30 E40 C06 T G02 G32 G62 R02 X01 Strlts Total
Projected Billing Determinants
(1) kW Demand 3,971,837.5 6,217,647.6 1,329,012.1 220,804.2 11,739,301.3 (2) kWh Deliveries 2,879,576,811 230,642,055 1,751,441 3,549,930 553,669,742 13,670,599 1,433,557,115 2,171,412,953 589,716,165 4,321,938 25,013,109 70,029,701 7,976,911,559
Base Transmission Charges
(3) Demand charges $1.40 $1.27 $1.39 $1.34(4) kWh charge $0.00436 $0.00338 $0.00261 $0.00141 $0.00536 $0.00361 $0.00259 $0.00259
Base Transmission Revenue
(5) Demand Revenue $5,560,573 $7,896,412 $1,847,327 $0 $295,878 $15,600,189(6) kWh Revenue $12,554,955 $779,570 $4,571 $5,005 $2,967,670 $49,351 $0 $0 $0 $11,194 $0 $181,377 $16,553,693
(7) Projected Base Transmission Revenue Before Discounts $12,554,955 $779,570 $4,571 $5,005 $2,967,670 $49,351 $5,560,573 $7,896,412 $1,847,327 $11,194 $295,878 $181,377 $32,153,882
Discounts
(8) kW Demand - Customers with HVM 52,547.4 1,584,256.6 1,270,535.5 (9) Demand Charge $1.40 $1.27 $1.39
(10) Discount ($736) ($20,120) ($17,660) ($38,516)
(11) kWh Deliveries - Customer with HVM $17,776,108 $565,435,933 $566,245,462(12) Transmission Adj Factor $0.00239 $0.00239 $0.00239
(13) Discount ($425) ($13,514) ($13,533) ($27,472)
(14) Total HVM Discount ($1,161) ($33,634) ($31,194) ($65,988)
(15) Total Projected Base Transmission Revenue $12,554,955 $779,570 $4,571 $5,005 $2,967,670 $49,351 $5,559,412 $7,862,778 $1,816,133 $11,194 $295,878 $181,377 $32,087,894
Total Projected kWhs 7,976,911,559
Average Base Transmission Revenue $0.00402
(1) Projected kWhs times estimated class average load factor based on historical usage for twelve months ending December 2007(2) per Company forecast(3) per current tariff(4) per current tariff(5) Line (1) x Line (3)(6) Line (2) x Line (4)(7) Line (5) + Line (6)(8) Estimated based on histroical usage for twelve months ending Decebmer 2007(9) per current tariff(10) Line (8) x Line (9) x -0.01%(11) Estimated based on histroical usage for twelve months ending Decebmer 2007(12) per current tariff(13) Line (11) x Line (12) x -0.01%(14) Line (10) + Line (13)(15) Line (7) + Line (14)

Schedule JAL-12

NATIONAL GRID R.I.P.U.C. DOCKET NO. ____
JANUARY 2009 ELECTRIC RETAIL RATE FILING WITNESS: JEANNE A. LLOYD
S:\RADATA1\2008 neco\Annual Filing\JALtestimony-2009.doc
Schedule JAL-12
Transmission Service Reconciliation
for the period October 2007 through September 2008

S:\RADATA1\2008 neco\Reconciliations\[Recs_2008.neco-Nancy's.xls]Transmission National GridR.I.P.U.C. Docket No. ____
Schedule JAL-12Page 1 of 8
Section 1. Balance @ September 30, 2008Over/(Under)
Over/(Under) Over/(Under) EndingBeginning Transmission Transmission Monthly Ending Balance
Month Balance Revenue Adjustments Expense Over/(Under) Balance Incl Unbilled(a) (b) (c) (d) (e) (f) (g)
Oct-07 $2,419,726 $1,830,870 $238,002 $5,610,327 ($3,541,455) ($1,121,728) $1,440,279Nov-07 ($1,121,728) $4,658,196 $4,685,440 ($27,245) ($1,148,973) $1,642,967Dec-07 ($1,148,973) $5,076,255 $5,847,354 ($771,099) ($1,920,072) $1,264,148Jan-08 ($1,920,072) $5,789,492 ($723,092) $6,163,455 ($1,097,054) ($3,017,127) $191,267Feb-08 ($3,017,127) $5,833,444 $5,907,547 ($74,103) ($3,091,230) ($110,698)Mar-08 ($3,091,230) $5,419,149 $7,802,971 ($2,383,822) ($5,475,052) ($2,276,872)Apr-08 ($5,475,052) $5,814,874 $5,553,939 $260,935 ($5,214,118) ($2,472,853)
May-08 ($5,214,118) $4,984,118 $5,756,530 ($772,412) ($5,986,530) ($2,940,668)Jun-08 ($5,986,530) $5,537,930 $10,474,848 ($4,936,917) ($10,923,447) ($7,357,957)Jul-08 ($10,923,447) $6,482,710 $7,737,620 ($1,254,910) ($12,178,357) ($8,290,122)
Aug-08 ($12,178,357) $7,069,518 $7,223,385 ($153,867) ($12,332,224) ($8,749,098)Sep-08 ($12,332,224) $6,514,775 $7,095,471 ($580,696) ($12,912,920) ($11,005,745)Oct-08 ($12,912,920) $3,467,592 $3,467,592 ($9,445,328) ($9,445,328)
Total $2,419,726 $68,478,923 ($485,090) $79,858,888 ($11,865,055) ($9,445,328)
Interest ($165,131)
Base Transmission Reconciliation Balance with Interest ($9,610,459)
Section 2. Projected Balance @ December 31, 2008
Over/(Under) Over/(Under) EndingBeginning Transmission Transmission Monthly Ending BalanceBalance Revenue Adjustments Expense Over/(Under) Balance Incl Unbilled
(a) (b) (c) (d) (e) (f) (g)
Oct-08 ($9,610,459) $2,268,466 $6,421,663 ($4,153,197) ($13,763,656) ($10,806,852)Nov-08 ($13,763,656) $5,376,008 $6,577,757 ($1,201,749) ($14,965,406) ($11,719,996)Dec-08 ($14,965,406) $5,900,745 $7,040,379 ($1,139,634) ($16,105,040) ($14,222,265)Jan-09 ($16,105,040) $3,423,228 $0 $3,423,228 ($12,681,812) ($12,681,812)
Total ($9,610,459) $16,968,446 $0 $20,039,799 ($3,071,353) ($12,681,812)
Column Descriptions:
(a) Column (f) from previous row; adjustment to beginning balance for ROE rebilling credits plus interest for the period January through March 2007(b) from Page 2(c) October 2007: true-up of estimated August 2007 and September 2007 expense to actual.
January 2008: remaining balance of recovery of uplift charges from page 5 plus remaining balance of Oct 2005 through Sep 2006 under recovery from page 7. (d) from Page 3(e) Column (b) + Column (c) - Column (d)(f) Column (a) + Column (e)(g) Column (f) + 55% of Column (b) from following row
Base Transmission Service Reconciliation Projected through December 2009
Base Transmission Service ReconciliationOctober 2007 through September 2008

National GridR.I.P.U.C. Docket No. ____
Schedule JAL-12Page 2 of 8
Less Less Less2008 2007 Uplift Base
Transmission Transmission Transmission Recovery Less TransmissionService Adjustment Adjustment Adjustment HVM Service
Revenue Revenue Revenue Revenue Credit Revenue(a) (b) (c) (d) (e) (f)
(1) Oct-07 $1,833,856 $0 $0 $0 $2,986 $1,830,870Nov-07 $5,329,136 $0 $516,376 $145,800 $8,764 $4,658,196Dec-07 $5,828,828 $0 $580,626 $163,941 $8,005 $5,076,255Jan-08 $6,349,268 $94,296 $356,979 $100,794 $7,706 $5,789,492Feb-08 $6,052,711 $213,096 $0 $0 $6,170 $5,833,444Mar-08 $5,618,301 $195,802 $0 $0 $3,350 $5,419,149Apr-08 $6,038,161 $214,085 $0 $0 $9,202 $5,814,874
May-08 $5,166,866 $176,693 $0 $0 $6,056 $4,984,118Jun-08 $5,743,381 $199,070 $0 $0 $6,381 $5,537,930Jul-08 $6,722,536 $233,805 $0 $0 $6,021 $6,482,710
Aug-08 $7,336,622 $260,369 $0 $0 $6,735 $7,069,518Sep-08 $6,768,267 $246,011 $0 $0 $7,480 $6,514,775
(2) Oct-08 $3,605,190 $130,704 $0 $0 $6,894 $3,467,592
Total $72,393,123 $1,963,931 $1,453,982 $410,536 $85,752 $68,478,923
(1) Reflects kWhs consumed after October 1, 2007 32.68%(2) Reflects kWhs consumed prior to October 1, 2008 60.50%
Note: 100% of 2006 Adjustment revenue and Uplift Adjustment for October 2007 was included in prior period reconciliation
(a) Monthly Transmission Service Revenue Report(b) from Page 4(c) from Page 6, Column (e)(d) from Page 12, Column (e)(e) Column (a) - Column (b) - Column (c) - Column (d)(f) Column (a) - Column (b) - Column (c) - Column (d) - Column (e)
Transmission Service Revenue

National GridR.I.P.U.C. Docket No. ____
Schedule JAL-12Page 3 of 8
NEPOOL NEP Other ISO TotalPTF Non-PTF NEPOOL Tariff Transmission
Expenses Expenses Charges Expenses ExpenseOct-07 $3,143,246 $1,656,024 $528,805 $282,252 $5,610,327
Nov-07 $2,896,263 $1,095,715 $460,966 $232,496 $4,685,440Dec-07 $3,179,418 $2,005,225 $282,604 $380,107 $5,847,354Jan-08 $3,313,684 $2,147,597 $498,615 $203,559 $6,163,455Feb-08 $3,131,602 $2,085,322 $434,331 $256,292 $5,907,547Mar-08 $2,848,269 $4,107,202 $644,629 $202,871 $7,802,971Apr-08 $2,722,040 $2,386,041 $219,763 $226,095 $5,553,939
May-08 $2,762,985 $2,570,833 $213,303 $209,409 $5,756,530Jun-08 $6,810,516 $3,139,729 $210,940 $313,663 $10,474,848Jul-08 $6,251,124 $1,026,407 $200,866 $259,223 $7,737,620
Aug-08 $6,022,323 $758,453 $199,023 $243,586 $7,223,385Sep-08 $7,040,379 $0 $0 $55,092 $7,095,471 estimated
Total $50,121,849 $22,978,548 $3,893,845 $2,864,646 $79,858,888
Source: Monthly NEP, NEPOOL and ISO Bills
Transmission Service Expense

National GridR.I.P.U.C. Docket No. ____
Schedule JAL-12Page 4 of 8
Reconciliation:Beginning Transmision Charge Ending Ending
Over/(Under) Over/(Under) Over/(Under) Monthly Over/(Under)Recovery Recovery Recovery Interest Interest Monthly Recovery
Month Balance Refund Balance Balance Rate Interest w/ Interest(a) (b) (c) (d) (e) (f) (g)
Oct-07 ($2,554,741) $0 ($2,554,741) ($2,554,741) 4.800% ($10,219) ($2,564,960)Nov-07 ($2,564,960) $0 ($2,564,960) ($2,564,960) 4.800% ($10,260) ($2,575,220)Dec-07 ($2,575,220) $0 ($2,575,220) ($2,575,220) 4.800% ($10,301) ($2,585,521)Jan-08 ($2,585,521) $94,296 ($2,491,224) ($2,538,373) 4.800% ($10,153) ($2,501,378)Feb-08 ($2,501,378) $213,096 ($2,288,282) ($2,394,830) 4.800% ($9,579) ($2,297,861)Mar-08 ($2,297,861) $195,802 ($2,102,059) ($2,199,960) 4.630% ($8,488) ($2,110,547)Apr-08 ($2,110,547) $214,085 ($1,896,462) ($2,003,505) 4.630% ($7,730) ($1,904,192)
May-08 ($1,904,192) $176,693 ($1,727,500) ($1,815,846) 4.630% ($7,006) ($1,734,506)Jun-08 ($1,734,506) $199,070 ($1,535,436) ($1,634,971) 4.630% ($6,308) ($1,541,745)Jul-08 ($1,541,745) $233,805 ($1,307,940) ($1,424,842) 4.630% ($5,498) ($1,313,437)
Aug-08 ($1,313,437) $260,369 ($1,053,068) ($1,183,253) 4.630% ($4,565) ($1,057,633)Sep-08 ($1,057,633) $246,011 ($811,622) ($934,628) 4.630% ($3,606) ($815,228)Oct-08 ($815,228) $216,039 ($599,189) ($707,209) 4.630% ($2,729) ($601,918)
Nov-08 ($601,918) $0 ($601,918) ($601,918) 4.630% ($2,322) ($604,240)Dec-08 ($604,240) $0 ($604,240) ($604,240) 4.630% ($2,331) ($606,571)Jan-09 ($606,571) $0 ($606,571) ($606,571) 4.630% ($2,340) ($608,912)
(1) Reflects kWhs consumed after January 1st. 40.49%(2) Reflects kWhs consumed prior to January 1st. 0.00%
(a) Under recovery of expense for the period October 2006 through September 2007 approved in RIPUC Docket No. 3902(b) from column (m)(c) Column (a) + Column (b)(d) (Column (a) + Column (c)) ÷ 2(e) Customer Deposit Rate(f) Column (d) * Column (e)/12(g) Column (c) + Column (f)
Transmission Transmission Less NetkWh Adjustment Adjustment HVM HMV AdjustmentSales Factor Revenue kWhs Discount Revenue(h) (i) (j) (k) (l) (m)
Jan-08 706,714,790 $0.00033 $233,216 99,281,668 ($328) $232,888Feb-08 646,702,809 $0.00033 $213,412 95,718,308 ($316) $213,096Mar-08 593,937,354 $0.00033 $195,999 59,553,789 ($197) $195,802Apr-08 649,775,399 $0.00033 $214,426 103,431,812 ($341) $214,085
May-08 536,320,186 $0.00033 $176,986 88,796,945 ($293) $176,693Jun-08 604,210,788 $0.00033 $199,390 96,982,976 ($320) $199,070Jul-08 709,433,194 $0.00033 $234,113 93,289,800 ($308) $233,805
Aug-08 790,075,985 $0.00033 $260,725 107,755,785 ($356) $260,369Sep-08 746,624,979 $0.00033 $246,386 113,732,312 ($375) $246,011Oct-08 655,680,286 $0.00033 $216,374 101,431,587 ($335) $216,039
Nov-08 0 $0.00033 $0 - $0 $0Dec-08 0 $0.00033 $0 - $0 $0Jan-09 0 $0.00033 $0 - $0 $0
(h) from Monthly Transmission Service Revenue Report(i) Transmission Service adjustment factor approved for January 1, 2009 in Docket No. 3902.(j) Column (h) x Column (i)(k) from Monthly Revenue Report(l) column (i) x column (k) x 1%
(m) Column (j) + Column (l)
Transmission Cost Adjustment Over/(Under) Recovery October 2006 through September 2007
Adjustment Factor Revenue

National GridR.I.P.U.C. Docket No. ____
Schedule JAL-12Page 5 of 8
Beginning Transmission Ending EndingUnder Recovery Adjustment Under Recovery Interest Interest Monthly Balance
Month Balance Revenue Balance Balance Rate Interest w/ Interest(a) (b) (c) (d) (e) (f) (g)
(1) Jan-05 $5,657,163 $74,720 $5,582,444 $5,619,804 4.010% $18,780 $5,601,223Feb-05 $5,601,223 $154,821 $5,446,403 $5,523,813 4.010% $18,459 $5,464,861Mar-05 $5,464,861 $157,964 $5,306,897 $5,385,879 4.270% $19,165 $5,326,062Apr-05 $5,326,062 $143,721 $5,182,341 $5,254,201 4.270% $18,696 $5,201,037
May-05 $5,201,037 $134,464 $5,066,573 $5,133,805 4.270% $18,268 $5,084,840Jun-05 $5,084,840 $146,966 $4,937,874 $5,011,357 4.270% $17,832 $4,955,706Jul-05 $4,955,706 $172,732 $4,782,973 $4,869,340 4.270% $17,327 $4,800,300
Aug-05 $4,800,300 $187,940 $4,612,360 $4,706,330 4.270% $16,747 $4,629,107Sep-05 $4,629,107 $185,774 $4,443,333 $4,536,220 4.270% $16,141 $4,459,474Oct-05 $4,459,474 $155,891 $4,303,583 $4,381,529 4.270% $15,591 $4,319,174
Nov-05 $4,319,174 $143,157 $4,176,017 $4,247,596 4.270% $15,114 $4,191,131Dec-05 $4,191,131 $168,684 $4,022,447 $4,106,789 4.270% $14,613 $4,037,060Jan-06 $4,037,060 $164,687 $3,872,373 $3,954,717 4.270% $14,072 $3,886,445Feb-06 $3,886,445 $143,761 $3,742,684 $3,814,565 4.270% $13,573 $3,756,258Mar-06 $3,756,258 $160,629 $3,595,629 $3,675,944 4.290% $13,141 $3,608,771Apr-06 $3,608,771 $139,857 $3,468,914 $3,538,842 4.290% $12,651 $3,481,565
May-06 $3,481,565 $130,863 $3,350,702 $3,416,133 4.290% $12,213 $3,362,915Jun-06 $3,362,915 $145,910 $3,217,004 $3,289,959 4.290% $11,762 $3,228,766Jul-06 $3,228,766 $172,903 $3,055,863 $3,142,314 4.290% $11,234 $3,067,097
Aug-06 $3,067,097 $190,519 $2,876,577 $2,971,837 4.290% $10,624 $2,887,202Sep-06 $2,887,202 $164,603 $2,722,599 $2,804,900 4.290% $10,028 $2,732,626Oct-06 $2,732,626 $142,895 $2,589,732 $2,661,179 4.290% $9,514 $2,599,245
Nov-06 $2,599,245 $137,735 $2,461,510 $2,530,378 4.290% $9,046 $2,470,556Dec-06 $2,470,556 $158,575 $2,311,982 $2,391,269 4.290% $8,549 $2,320,530Jan-07 $2,320,530 $167,471 $2,153,059 $2,236,795 4.290% $7,997 $2,161,056Feb-07 $2,161,056 $152,334 $2,008,722 $2,084,889 4.290% $7,453 $2,016,175Mar-07 $2,016,175 $155,977 $1,860,198 $1,938,187 4.800% $7,753 $1,867,951Apr-07 $1,867,951 $141,673 $1,726,278 $1,797,115 4.800% $7,188 $1,733,466
May-07 $1,733,466 $137,785 $1,595,681 $1,664,574 4.800% $6,658 $1,602,340Jun-07 $1,602,340 $150,543 $1,451,796 $1,527,068 4.800% $6,108 $1,457,905Jul-07 $1,457,905 $163,026 $1,294,879 $1,376,392 4.800% $5,506 $1,300,384
Aug-07 $1,300,384 $182,186 $1,118,198 $1,209,291 4.800% $4,837 $1,123,035Sep-07 $1,123,035 $173,673 $949,362 $1,036,199 4.800% $4,145 $953,507Oct-07 $953,507 $153,800 $799,707 $876,607 4.800% $3,506 $803,213
Nov-07 $803,213 $145,800 $657,413 $730,313 4.800% $2,921 $660,335Dec-07 $660,335 $163,941 $496,393 $578,364 4.800% $2,313 $498,707
(2) Jan-08 $498,707 $100,794 $397,913 $448,310 4.800% $1,793 $399,706
(1) Percentage of kWhs consumed on and after Jan 1, 2005 = 46.29%(2) Percentage of kWhs consumed prior to Jan 1, 2008 = 59.51%
(a) Prior Month Column (c); beginning balance per R.I.P.U.C. Docket No. 3648, Schedule JAL-5, page 11 (b) from Page 6(c) Column (a) - Column (b)(d) (Column (a) + Column (c)) ÷ 2(e) Customer deposits rate (f) Column (d) * Column (e) ÷ 12(g) Column (c) + Column (f)
Recovery of Deferred Uplift ChargesIncurred January 1999 through May 2004

National GridR.I.P.U.C. Docket No. ____
Schedule JAL-12Page 6 of 8
Total NetUplift Uplift Uplift
Transmission Transmission Less TransmissionkWh Adjustment Adjustment HVM HMV AdjustmentSales Factor Revenue kWhs Discount Revenue(a) (b) (c) (d) (e) (f)
Jan-05 673,697,851 $0.00024 $161,687 112,855,310 ($271) $161,416Feb-05 646,032,306 $0.00024 $155,048 94,474,830 ($227) $154,821Mar-05 659,213,682 $0.00024 $158,211 102,794,160 ($247) $157,964Apr-05 599,792,608 $0.00024 $143,950 95,523,390 ($229) $143,721
May-05 561,184,203 $0.00024 $134,684 91,853,710 ($220) $134,464Jun-05 613,326,982 $0.00024 $147,198 96,689,690 ($232) $146,966Jul-05 720,810,371 $0.00024 $172,994 109,024,610 ($262) $172,732
Aug-05 784,167,871 $0.00024 $188,200 108,439,455 ($260) $187,940Sep-05 775,157,934 $0.00024 $186,038 110,017,525 ($264) $185,774Oct-05 650,577,703 $0.00024 $156,139 103,277,535 ($248) $155,891
Nov-05 597,425,895 $0.00024 $143,382 93,698,403 ($225) $143,157Dec-05 703,947,800 $0.00024 $168,947 109,773,263 ($263) $168,684Jan-06 687,130,142 $0.00024 $164,911 93,263,024 ($224) $164,687Feb-06 599,865,946 $0.00024 $143,968 86,342,628 ($207) $143,761Mar-06 670,348,234 $0.00024 $160,884 106,277,894 ($255) $160,629Apr-06 583,667,646 $0.00024 $140,080 92,968,001 ($223) $139,857
May-06 546,121,316 $0.00024 $131,069 85,870,738 ($206) $130,863Jun-06 608,934,614 $0.00024 $146,144 97,476,179 ($234) $145,910Jul-06 721,453,886 $0.00024 $173,149 102,386,912 ($246) $172,903
Aug-06 794,822,239 $0.00024 $190,757 99,170,919 ($238) $190,519Sep-06 686,978,841 $0.00024 $164,875 113,171,622 ($272) $164,603Oct-06 596,398,898 $0.00024 $143,136 100,324,290 ($241) $142,895
Nov-06 574,791,077 $0.00024 $137,950 89,447,506 ($215) $137,735Dec-06 661,816,165 $0.00024 $158,836 108,717,226 ($261) $158,575Jan-07 698,858,049 $0.00024 $167,726 106,379,600 ($255) $167,471Feb-07 635,680,773 $0.00024 $152,563 95,318,285 ($229) $152,334Mar-07 650,877,788 $0.00024 $156,211 97,614,186 ($234) $155,977Apr-07 591,184,545 $0.00024 $141,884 87,835,631 ($211) $141,673
May-07 575,121,187 $0.00024 $138,029 101,488,446 ($244) $137,785Jun-07 628,300,881 $0.00024 $150,792 103,839,747 ($249) $150,543Jul-07 680,223,986 $0.00024 $163,254 94,803,202 ($228) $163,026
Aug-07 760,168,583 $0.00024 $182,440 105,903,366 ($254) $182,186Sep-07 724,730,045 $0.00024 $173,935 108,968,111 ($262) $173,673Oct-07 641,903,193 $0.00024 $154,057 107,070,910 ($257) $153,800
Nov-07 608,533,325 $0.00024 $146,048 103,173,724 ($248) $145,800Dec-07 684,072,345 $0.00024 $164,177 98,177,486 ($236) $163,941Jan-08 706,714,790 $0.00024 $169,612 99,281,668 ($238) $169,374
(a) kWhs per Monthly SMB702 Report, Monthly Standard Offer, Open Access, Last Resort Service Revenue Reports(b) Approved Uplift Factor for January 2005(c) Column (a) x Column (b)(d) from Company monthly revenue reports(e) Column (c) - Column (d)(f) Column (c) - Column (e)
Recovery of Deferred Uplift ChargesIncurred January 1999 through May 2004

National GridR.I.P.U.C. Docket No. ____
Schedule JAL-12Page 7 of 8
Reconciliation:Beginning Transmision Charge Ending Ending
Over/(Under) Over/(Under) Over/(Under) Monthly Over/(Under)Recovery Recovery Recovery Interest Interest Monthly Recovery
Month Balance Refund Balance Balance Rate Interest w/ Interest(a) (b) (c) (d) (e) (f) (g)
Oct-06 ($6,763,055) $0 ($6,763,055) ($6,763,055) 4.290% ($24,178) ($6,787,233)Nov-06 ($6,787,233) $0 ($6,787,233) ($6,787,233) 4.290% ($24,264) ($6,811,497)Dec-06 ($6,811,497) $0 ($6,811,497) ($6,811,497) 4.290% ($24,351) ($6,835,848)Jan-07 ($6,835,848) $247,689 ($6,588,159) ($6,712,004) 4.290% ($23,995) ($6,612,155)Feb-07 ($6,612,155) $539,519 ($6,072,636) ($6,342,395) 4.290% ($22,674) ($6,095,310)Mar-07 ($6,095,310) $552,416 ($5,542,894) ($5,819,102) 4.800% ($23,276) ($5,566,170)Apr-07 ($5,566,170) $501,760 ($5,064,410) ($5,315,290) 4.800% ($21,261) ($5,085,672)
May-07 ($5,085,672) $487,990 ($4,597,682) ($4,841,677) 4.800% ($19,367) ($4,617,048)Jun-07 ($4,617,048) $533,173 ($4,083,876) ($4,350,462) 4.800% ($17,402) ($4,101,277)Jul-07 ($4,101,277) $577,384 ($3,523,893) ($3,812,585) 4.800% ($15,250) ($3,539,143)
Aug-07 ($3,539,143) $645,243 ($2,893,900) ($3,216,522) 4.800% ($12,866) ($2,906,766)Sep-07 ($2,906,766) $615,095 ($2,291,672) ($2,599,219) 4.800% ($10,397) ($2,302,069)Oct-07 ($2,302,069) $544,708 ($1,757,361) ($2,029,715) 4.800% ($8,119) ($1,765,480)
Nov-07 ($1,765,480) $516,376 ($1,249,103) ($1,507,292) 4.800% ($6,029) ($1,255,133)Dec-07 ($1,255,133) $580,626 ($674,506) ($964,819) 4.800% ($3,859) ($678,365)Jan-08 ($678,365) $356,979 ($321,386) ($499,876) 4.800% ($2,000) ($323,386)
(1) Reflects kWhs consumed after January 1st. 41.76%(2) Reflects kWhs consumed prior to January 1st. 59.51%
(a) Under recovery of expense for the period October 2005 through September 2006 approved in RIPUC Docket No. 3788(b) from column (m)(c) Column (a) + Column (b)(d) (Column (a) + Column (c)) ÷ 2(e) Customer Deposit Rate(f) Column (d) * (Column (e) ÷ 12)(g) Column (c) + Column (f)
Transmission Transmission Less NetkWh Adjustment Adjustment HVM HMV AdjustmentSales Factor Revenue kWhs Discount Revenue(h) (i) (j) (k) (l) (m)
Jan-07 698,858,049 $0.00085 $594,029 106,379,600 ($904) $593,125Feb-07 635,680,773 $0.00085 $540,329 95,318,285 ($810) $539,519Mar-07 650,877,788 $0.00085 $553,246 97,614,186 ($830) $552,416Apr-07 591,184,545 $0.00085 $502,507 87,835,631 ($747) $501,760
May-07 575,121,187 $0.00085 $488,853 101,488,446 ($863) $487,990Jun-07 628,300,881 $0.00085 $534,056 103,839,747 ($883) $533,173Jul-07 680,223,986 $0.00085 $578,190 94,803,202 ($806) $577,384
Aug-07 760,168,583 $0.00085 $646,143 105,903,366 ($900) $645,243Sep-07 724,730,045 $0.00085 $616,021 108,968,111 ($926) $615,095Oct-07 641,903,193 $0.00085 $545,618 107,070,910 ($910) $544,708
Nov-07 608,533,325 $0.00085 $517,253 103,173,724 ($877) $516,376Dec-07 684,072,345 $0.00085 $581,461 98,177,486 ($835) $580,626Jan-08 706,714,790 $0.00085 $600,708 99,281,668 ($844) $599,864
(h) from Monthly Transmission Service Revenue Report(i) Under recovery of expense for the period October 2005 through September 2006 approved in RIPUC Docket No. 3788(j) Column (h) x Column (i)(k) from Monthly Revenue Report(l) column (i) x column (k) x 1%
(m) Column (j) + Column (l)
Adjustment Factor Revenue
Transmission Cost Adjustment Over/(Under) RecoveryOctober 2005 through December 2006

National GridR.I.P.U.C. Docket No. ____
Schedule JAL-12Page 8 of 8
Transmission Service ReconciliationCalculation of Interest and Recovery Factor for the period October 2007 through September 2008
Month Beginning Surcharge/ Ending Interest InterestBalance (Refund) Balance Rate
(1) (2) (3) (4) (5)
Oct-2008 ($9,610,459) $0 ($9,610,459) 4.63% ($37,080)Nov-2008 ($9,647,540) $0 ($9,647,540) 4.63% ($37,223)Dec-2008 ($9,684,763) $0 ($9,684,763) 4.63% ($37,367)Jan-2009 (a) ($12,793,483) ($1,066,124) ($11,727,360) 4.63% ($47,305)Feb-2009 ($11,774,664) ($1,070,424) ($10,704,240) 4.63% ($43,366)Mar-2009 ($10,747,606) ($1,074,761) ($9,672,845) 4.63% ($39,394)Apr-2009 ($9,712,240) ($1,079,138) ($8,633,102) 4.63% ($35,391)
May-2009 ($8,668,493) ($1,083,562) ($7,584,932) 4.63% ($31,356)Jun-2009 ($7,616,287) ($1,088,041) ($6,528,246) 4.63% ($27,287)Jul-2009 ($6,555,533) ($1,092,589) ($5,462,944) 4.63% ($23,186)
Aug-2009 ($5,486,130) ($1,097,226) ($4,388,904) 4.63% ($19,051)Sep-2009 ($4,407,955) ($1,101,989) ($3,305,966) 4.63% ($14,881)Oct-2009 ($3,320,847) ($1,106,949) ($2,213,898) 4.63% ($10,677)
Nov-2009 ($2,224,576) ($1,112,288) ($1,112,288) 4.63% ($6,437)Dec-2009 ($1,118,725) ($1,118,725) $0 4.63% ($2,158)
($13,091,814) ($412,160)
(a) Estimated under recovery of $3,071,353 for the months of Oct, Nov and Dec added to Jan 2009 beginning balance
Total Surcharge/(Refund) to Customers with Interest ($13,091,814)
Total Forecasted kWh Sales for the 12 months ending Dec 2009 7,976,911,561
Reconciliation Transmission Adjustment Factor per kWh ($0.00164)
Notes:1 Column (3) + Column (5) of previous month2 For Jan, (Column (1)) ÷ 12. For Feb, (Column (1))÷11, etc.3 Column (1) - Column (2)4 Current Rate for Customer Deposits5 (( Column (1) + Column (3))÷2)* Column (4)

Schedule JA
L-13

NATIONAL GRID R.I.P.U.C. DOCKET NO. ____
JANUARY 2009 ELECTRIC RETAIL RATE FILING WITNESS: JEANNE A. LLOYD
S:\RADATA1\2008 neco\Annual Filing\JALtestimony-2009.doc
Schedule JAL-13
Reconciliation of Low Income Credit and Proposed Credit for 2009

S:\RADATA1\2008 neco\Reconciliations\[Low Income_08.xls]credit National GridR.I.P.U.C. Docket No. ____
Schedule JAL-13Page 1 of 3
MonthlyBeginning Ending Interest Interest Monthly Ending
Month Balance Credit Balance Balance Rate Interest Balance(a) (b) (c) (d) (e) (f) (g)
Jan-08 $4,615,206 ($142,708) $4,472,498 $4,543,852 4.800% $18,175 $4,490,673Feb-08 $4,490,673 ($141,093) $4,349,580 $4,420,126 4.800% $17,681 $4,367,260Mar-08 $4,367,260 ($137,277) $4,229,983 $4,298,622 4.630% $16,586 $4,246,568Apr-08 $4,246,568 ($135,409) $4,111,159 $4,178,864 4.630% $16,123 $4,127,283May-08 $4,127,283 ($124,736) $4,002,547 $4,064,915 4.630% $15,684 $4,018,231Jun-08 $4,018,231 ($137,401) $3,880,830 $3,949,530 4.630% $15,239 $3,896,069Jul-08 $3,896,069 ($167,014) $3,729,054 $3,812,562 4.630% $14,710 $3,743,764
Aug-08 $3,743,764 ($165,555) $3,578,209 $3,660,987 4.630% $14,125 $3,592,335Sep-08 $3,592,335 ($137,692) $3,454,643 $3,523,489 4.630% $13,595 $3,468,237Oct-08 $3,468,237 ($107,934) $3,360,303 $3,414,270 4.630% $13,173 $3,373,477
Nov-08 $3,373,477 $0 $3,373,477 $3,373,477 4.630% $13,016 $3,386,493Dec-08 $3,386,493 $0 $3,386,493 $3,386,493 4.630% $13,066 $3,399,559
Total ($1,396,820)
Column Notes:
(a) Column ( g) of previous month; beginning balance from Page 2(b) from page 2(c) Column (a) + Column (b)(d) (Column (a) + Column (c)) ÷ 2(e) rate of interest on customer deposits (f) Column (d) * Column (e)/12(g) Column (c) + Column (f)
National GridLow Income Customer Credit per Commission Decision in RIPUC Docket No. 3902

S:\RADATA1\2008 neco\Annual Filing\[Low Income_07.xls]credit National GridR.I.P.U.C. Docket No. ____
Schedule JAL-13Page 2 of 3
MonthlyBeginning Ending Interest Interest Monthly Ending
Month Balance Credit Balance Balance Rate Interest Balance(a) (b) (c) (d) (e) (f) (g)
Jan-07 $6,350,901 ($179,991) $6,170,910 $6,260,906 4.290% $22,383 $6,193,293Feb-07 $6,193,293 ($173,084) $6,020,209 $6,106,751 4.290% $21,832 $6,042,041Mar-07 $6,042,041 ($169,896) $5,872,145 $5,957,093 4.800% $23,828 $5,895,973Apr-07 $5,895,973 ($161,179) $5,734,794 $5,815,384 4.800% $23,262 $5,758,056May-07 $5,758,056 ($157,096) $5,600,960 $5,679,508 4.800% $22,718 $5,623,678Jun-07 $5,623,678 ($164,493) $5,459,186 $5,541,432 4.800% $22,166 $5,481,351Jul-07 $5,481,351 ($174,181) $5,307,171 $5,394,261 4.800% $21,577 $5,328,748
Aug-07 $5,328,748 ($186,627) $5,142,120 $5,235,434 4.800% $20,942 $5,163,062Sep-07 $5,163,062 ($181,071) $4,981,991 $5,072,527 4.800% $20,290 $5,002,281Oct-07 $5,002,281 ($166,874) $4,835,408 $4,918,844 4.800% $19,675 $4,855,083
Nov-07 $4,855,083 ($136,478) $4,718,605 $4,786,844 4.800% $19,147 $4,737,752Dec-07 $4,737,752 ($141,215) $4,596,537 $4,667,145 4.800% $18,669 $4,615,206
Total ($1,992,184)
Column Notes:
(a) Column ( g) of previous month; beginning balance from Schedule JAL-11 Page 4 of RIPUC Docket No. 3902(b) from Company monthly revenue reports(c) Column (a) + Column (b)(d) (Column (a) + Column (c)) ÷ 2(e) rate of interest on customer deposits (f) Column (d) * Column (e)/12(g) Column (c) + Column (f)
National GridLow Income Customer Credit per Commission Decision in RIPUC Docket No. 3788

S:\RADATA1\2008 neco\Reconciliations\[Low Income_08.xls]Page3 National GridR.I.P.U.C. Docket No. ____
Schedule JAL-13Page 3 of 3
(1) Proposed per kWh credit $0.01306
(2) Forecasted Rate A-60 initial block kWh deliveries for 2008 154,011,683
(3) Proposed Annual Credit $2,011,393
(1) Per testimony(2) Company forecast(3) Line (1) x Line (2)
National GridLow Income Customer Credit for 2008

Schedule JAL-14

NATIONAL GRID R.I.P.U.C. DOCKET NO. ____
JANUARY 2009 ELECTRIC RETAIL RATE FILING WITNESS: JEANNE A. LLOYD
S:\RADATA1\2008 neco\Annual Filing\JALtestimony-2009.doc
Schedule JAL-14
Net Metering Report

Net Metering Report for 2008 National GridR.I.P.U.C. Docket No. ____
Schedule JAL-14Page 1 of 4
NG number TOWN ZIP
Code
Capa-city (kW)
Fuel or energy source
Prime mover
Date Authority to inter-connect sent to customer
Rate Class
Lost annual kWH
Lost kWH in 2008
Distribution Charge Lost Revenue in 2008
NECO-1 Little Compton 02837 10.53 PV PV 10/27/04 A-16 11,583 11,583 0.033770$ $ 391.16
NECO-2 Wakefield 02879 10 Wind Wind 8/4/03 A-16 3,500 3,500 0.033770$ $ 118.20
NECO-3 Charlestown 02813 3.6 PV PV 8/1/03 A-16 3,960 3,960 0.033770$ $ 133.73
NECO-4 Cranston 02920 3 PV PV 10/6/03 A-16 3,300 3,300 0.033770$ $ 111.44 NECO-6 Westerly 02891 3 PV PV 1/15/04 A-16 3,300 3,300 0.033770$ $ 111.44 NECO-7 Bristol 02809 8 PV PV 5/14/04 G-02 8,800 8,800 0.007770$ $ 68.38
NECO-8 Westerly 02891 5 PV PV 10/28/04 A-16 5,500 5,500 0.033770$ $ 185.74
NECO-9 West Greenwich 02817 1.8 PV PV 3/9/05 G-02 1,980 1,980 0.007770$ $ 15.38
NECO-10 Providence 02907 20.04 PV PV 5/10/05 G-02 22,044 22,044 0.007770$ $ 171.28
NECO-11 Warwick 02886 8.95 PV PV 6/21/05 A-16 9,845 9,845 0.033770$ $ 332.47
NECO-13 Wakefield 02879 5.32 PV PV 3/17/06 A-16 5,852 5,852 0.033770$ $ 197.62
NECO-14 Cumberland 02864 8.4 PV PV 9/10/04 A-16 9,240 9,240 0.033770$ $ 312.03
NECO-15 Barrington 02806 4.488 PV PV 8/10/05 A-16 4,937 4,937 0.033770$ $ 166.72
NECO-16 Tiverton 02878 5.1 PV PV 8/24/05 A-16 5,610 5,610 0.033770$ $ 189.45
NECO-17 Lincoln 02865 5.1 PV PV 8/24/05 A-16 5,610 5,610 0.033770$ $ 189.45
NECO-18 Scituate 02857 1.8 PV PV 5/5/05 G-32 1,980 1,980 0.008890$ $ 17.60
NECO-19 Portsmouth 660 Wind Wind 4/1/06 G-32 1,250,000 1,250,000 0.008890$ $ 11,112.50
NECO-20 Warwick 02888 7.3 PV PV 8/12/05 A-16 8,030 8,030 0.033770$ $ 271.17
NECO-21 Barrington 02806 2.9 PV PV 8/12/05 A-16 3,190 3,190 0.033770$ $ 107.73
NECO-22 Wood River Jct 02894 15 PV PV 6/2/05 C-06 16,500 16,500 0.036340$ $ 599.61
NECO-23 Narragansett 02882 5.3 PV PV 11/9/04 A-16 5,830 5,830 0.033770$ $ 196.88
NECO-24 Bristol 02809 3.6 PV PV 9/17/04 G-32 3,960 3,960 0.008890$ $ 35.20
NECO-25 Bristol 02809 9 PV PV 9/17/04 G-32 9,900 9,900 0.008890$ $ 88.01
NECO-26 Charlestown 02836 2.1 PV PV 7/22/99 A-16 2,310 2,310 0.033770$ $ 78.01
NECO-27 Providence 02906 3.96 PV PV 5/27/05 A-16 4,356 4,356 0.033770$ $ 147.10
NECO-28 Providence 02904 24.9 PV PV 12/29/05 G-32 27,390 27,390 0.008890$ $ 243.50
NECO-29 Cranston 02920 50 PV PV 5/1/06 C-06 55,000 55,000 0.036340$ $ 1,998.70
NECO-30 West Kingston 02892 2.5 PV PV 2/3/03 A-16 2,750 2,750 0.033770$ $ 92.87
NECO-31 Cranston 02910 2 PV PV 8/15/02 G-32 2,200 2,200 0.008890$ $ 19.56
NECO-32 North Kingstown 02852 2 PV PV 8/15/02 G-02 2,200 2,200 0.007770$ $ 17.09
NECO-33 Providence 2 PV PV 5/1/02 G-32 2,200 2,200 0.008890$ $ 19.56
NECO-34 West Kingston 02892 5.76 PV PV 3/12/02 G-02 6,336 6,336 0.007770$ $ 49.23
NECO-35 Providence 02905 1.14 PV PV 6/21/01 A-16 1,254 1,254 0.033770$ $ 42.35
NECO-36 Middletown 02842 1.8 PV PV 11/1/01 A-16 1,980 1,980 0.033770$ $ 66.86
NECO-37 Burrillville 02826 2 PV PV 1/1/02 G-32 2,200 2,200 0.008890$ $ 19.56

Net Metering Report for 2008 National GridR.I.P.U.C. Docket No. ____
Schedule JAL-14Page 2 of 4
NG number TOWN ZIP
Code
Capa-city (kW)
Fuel or energy source
Prime mover
Date Authority to inter-connect sent to customer
Rate Class
Lost annual kWH
Lost kWH in 2008
Distribution Charge Lost Revenue in 2008
RI-1 Little Compton 02837 10.03 PV PV 5/25/05 A-16 11,033 11,033 0.033770$ $ 372.58
RI-2 Charlestown 02813 5.25 PV PV 10/30/06 A-16 5,775 5,775 0.033770$ $ 195.02
RI-3 Peacedale 5.1 PV PV 6/2/06 A-16 5,610 5,610 0.033770$ $ 189.45
RI-4 Charlestown 02813 2.7 PV PV 1/7/05 A-16 2,970 2,970 0.033770$ $ 100.30
RI-5 Narragansett 4 PV PV 3/2/06 A-16 4,400 4,400 0.033770$ $ 148.59
RI-6 Cumberland 02864 3.05 PV PV 12/12/05 A-16 3,355 3,355 0.033770$ $ 113.30
RI-7 Providence 1 PV PV 10/25/05 G-62 1,100 1,100 -$ $ -
RI-8 Smithfield 02917 10.54 PV PV 4/14/06 A-16 11,594 11,594 0.033770$ $ 391.53
RI-9 Bristol 02809 4 PV PV 12/19/06 A-16 4,400 4,400 0.033770$ $ 148.59
RI-10 Tiverton 02878 5 PV PV 10/27/05 G-02 5,500 5,500 0.007770$ $ 42.74
RI-11 Charlestown 02813 4 PV PV 4/7/06 A-16 4,400 4,400 0.033770$ $ 148.59
RI-12 Kingstown 02881 5.86 PV PV 3/31/06 C-06 6,446 6,446 0.036340$ $ 234.25
RI-13 Hope Valley 02832 6.88 PV PV 10/30/06 A-16 7,568 7,568 0.033770$ $ 255.57
RI-14 Tiverton 02878 4.008 PV PV 4/17/06 A-16 4,409 4,409 0.033770$ $ 148.89
RI-16 Wakefield 02879 5.7 PV PV 5/9/06 A-16 6,270 6,270 0.033770$ $ 211.74
RI-17 Wakefield 02879 5.94 PV PV 7/26/06 A-16 6,534 6,534 0.033770$ $ 220.65
RI-18 Barrington 02806 3.25 PV PV 12/19/06 A-16 3,575 3,575 0.033770$ $ 120.73
RI-19 Narragansett 02882 3.3 PV PV 7/26/06 A-16 3,630 3,630 0.033770$ $ 122.59
RI-20 Charlestown 02813 5.32 PV PV 7/26/06 A-16 5,852 5,852 0.033770$ $ 197.62
RI-21 South Kingstown 02892 3.8 PV PV 7/26/06 A-16 4,180 4,180 0.033770$ $ 141.16
RI-22 Westerly 02891 3.99 PV PV 5/18/06 A-16 4,389 4,389 0.033770$ $ 148.22
RI-23 Providence 02906 1.7 PV PV 1/12/07 A-16 1,870 1,870 0.033770$ $ 63.15
RI-24 West Kingston 02892 3.8 PV PV 8/17/06 A-16 4,180 4,180 0.033770$ $ 141.16
RI-25 Portsmouth 3.4 PV PV 7/5/06 A-16 3,740 3,740 0.033770$ $ 126.30
RI-26 West Kingston 02892 4 PV PV 4/27/06 A-16 4,400 4,400 0.033770$ $ 148.59
RI-27 Providence 02908 6 PV PV 1/27/06 A-16 6,600 6,600 0.033770$ $ 222.88
RI-28 Providence 02906 3.06 PV PV 10/10/06 A-16 3,366 3,366 0.033770$ $ 113.67 RI-30 Charlestown 02813 4.18 PV PV 4/27/06 A-16 4,598 4,598 0.033770$ $ 155.27
RI-31 Providence 02906 5.13 PV PV 2/20/06 A-16 5,643 5,643 0.033770$ $ 190.56
RI-32 Gloucester 02814 4.56 PV PV 4/14/06 A-16 5,016 5,016 0.033770$ $ 169.39
RI-33 Ashaway 02804 6.84 PV PV 1/27/06 A-16 7,524 7,524 0.033770$ $ 254.09
RI-35 South Kingstown 02879 6.27 PV PV 12/11/06 A-16 6,897 6,897 0.033770$ $ 232.91
RI-36 Jamestown 02835 1.4 PV PV 11/2/06 A-16 1,540 1,540 0.033770$ $ 52.01
RI-37 Cranston 02910 5.7 PV PV 2/16/07 A-16 6,270 6,270 0.033770$ $ 211.74
RI-38 Providence 02907 3.42 PV PV 2/7/06 A-16 3,762 3,762 0.033770$ $ 127.04

Net Metering Report for 2008 National GridR.I.P.U.C. Docket No. ____
Schedule JAL-14Page 3 of 4
NG number TOWN ZIP
Code
Capa-city (kW)
Fuel or energy source
Prime mover
Date Authority to inter-connect sent to customer
Rate Class
Lost annual kWH
Lost kWH in 2008
Distribution Charge Lost Revenue in 2008
RI-39 Warren 02885 4.56 PV PV 5/9/06 A-16 5,016 5,016 0.033770$ $ 169.39
RI-40 Narragansett 02882 5.7 PV PV 9/16/06 A-16 6,270 6,270 0.033770$ $ 211.74
RI-41 Providence 02907 1.1 PV PV 1/26/06 C-06 1,210 1,210 0.036340$ $ 43.97
RI-42 Westerly 02891 11.8 PV PV 1/11/07 A-16 12,980 12,980 0.033770$ $ 438.33
RI-43 Pawtucket 02860 3.4 PV PV 2/2/07 A-16 3,740 3,740 0.033770$ $ 126.30
RI-44 Middletown 02842 3 PV PV 1/1/06 C-06 3,300 3,300 0.036340$ $ 119.92
RI-45 Narragansett 02882 4 PV PV 10/27/05 A-16 4,400 4,400 0.033770$ $ 148.59
RI-46 Westerly 02891 6.4 PV PV 1/11/07 A-16 7,040 7,040 0.033770$ $ 237.74
RI-49 Bristol 02809 2 PV PV 1/31/07 G-02 2,200 2,200 0.007770$ $ 17.09
RI-50 Middletown 02842 2 PV PV 2/1/07 G-02 2,200 2,200 0.007770$ $ 17.09
RI-51 Bristol 02809 4.2 PV PV 12/1/06 A-16 4,620 4,620 0.033770$ $ 156.02
RI-52 Wakefield 02879 5.9 PV PV 2/6/07 A-16 6,490 6,490 0.033770$ $ 219.17
RI-53 Scituate 02857 15.45 PV PV 6/11/07 A-16 16,995 16,995 0.033770$ $ 573.92
RI-54 1.8 PV PV 8/31/06 G-02 1,980 1,980 0.007770$ $ 15.38
RI-55 Wakefield 02879 7 PV PV 12/31/07 A-16 7,700 7,700 0.033770$ $ 260.03
RI-56 Greenville 02828 19.4 PV PV 9/26/07 G-02 21,340 21,340 0.007770$ $ 165.81
RI-57 Jamestown 02835 3.15 PV PV 12/31/07 A-16 3,465 3,465 0.033770$ $ 117.01
RI-58 West Greenwich 02817 1.575 PV PV 12/13/07 A-16 1,733 1,733 0.033770$ $ 58.51
RI-59 2 PV PV 7/6/07 G-32 2,200 2,200 0.008890$ $ 19.56
RI-60 2 PV PV 7/6/07 G-32 2,200 2,200 0.008890$ $ 19.56
RI-61 2 PV PV 9/27/07 G-32 2,200 2,200 0.008890$ $ 19.56
RI-62 Hope Valley 02813 3.12 PV PV 7/19/07 A-16 3,432 3,432 0.033770$ $ 115.90
RI-69 West Kingston 02892 5.55 PV PV 12/31/05 A-16 6,105 6,105 0.033770$ $ 206.17
RI-71 Portsmouth 02871 3.15 PV PV 9/25/07 A-16 3,465 3,465 0.033770$ $ 117.01
RI-72 Middletown 02842 2.45 PV PV 10/12/07 A-16 2,695 2,695 0.033770$ $ 91.01
RI-73 Little Compton 02837 3.04 PV PV 8/28/07 A-16 3,344 3,344 0.033770$ $ 112.93
RI-74 Warwick 02886 1.75 PV PV 10/1/07 A-16 1,925 1,925 0.033770$ $ 65.01
RI-75 Little Compton 02837 5.4 PV PV 6/18/08 A-16 5,940 2,767 0.033770$ $ 93.43
RI-77 Jamestown 02835 3.675 PV PV 10/22/07 A-16 4,043 4,043 0.033770$ $ 136.52
RI-78 Scituate 02857 7.56 PV PV 10/29/07 A-16 8,316 8,316 0.033770$ $ 280.83
RI-79 Newport 02886 24.5 PV PV 11/16/07 G-02 26,950 26,950 0.007770$ $ 209.40
RI-80 Wakefield 02879 2.4 Wind Wind 10/23/07 A-16 840 840 0.033770$ $ 28.37
RI-81 South Kingstown 02892 4.2 PV PV 12/7/07 A-16 4,620 4,620 0.033770$ $ 156.02
RI-82 Little Compton 02837 2.8 PV PV 11/7/07 A-16 3,080 3,080 0.033770$ $ 104.01
RI-83 East Greenwich 02818 1 PV PV 9/3/98 A-16 1,100 1,100 0.033770$ $ 37.15

Net Metering Report for 2008 National GridR.I.P.U.C. Docket No. ____
Schedule JAL-14Page 4 of 4
NG number TOWN ZIP
Code
Capa-city (kW)
Fuel or energy source
Prime mover
Date Authority to inter-connect sent to customer
Rate Class
Lost annual kWH
Lost kWH in 2008
Distribution Charge Lost Revenue in 2008
RI-84 Foster 02825 1 PV PV 12/31/99 A-16 1,100 1,100 0.033770$ $ 37.15
RI-85 Warwick 02888 1.4 PV PV 6/15/00 A-16 1,540 1,540 0.033770$ $ 52.01
RI-86 Cranston 02920 0.3 PV PV 7/1/00 A-16 330 330 0.033770$ $ 11.14
RI-87 North Kingstown 02852 3 PV PV 6/1/05 A-16 3,300 3,300 0.033770$ $ 111.44
RI-88 Portsmouth 02871 5 PV PV 10/1/00 A-16 5,500 5,500 0.033770$ $ 185.74
RI-89 Charlestown 02813 5.2 PV PV 1/1/06 A-16 5,720 5,720 0.033770$ $ 193.16
RI-90 Pawtucket 02861 0.5 PV PV 7/31/98 A-16 550 550 0.033770$ $ 18.57
RI-96 Narragansett 02882 5.32 PV PV 6/9/08 A-16 5,852 2,581 0.033770$ $ 87.17
RI-97 Jamestown 02835 5.05 PV PV 6/25/08 A-16 5,555 2,694 0.033770$ $ 90.97
RI-98 Portsmouth 02871 5.6 PV PV 6/26/08 A-16 6,160 3,004 0.033770$ $ 101.45
RI-100 Middletown 02842 4.8 WInd WInd 7/3/08 A-16 1,680 852 0.033770$ $ 28.76
RI-102 West Warwick 02893 2 PV PV 6/13/08 G-02 2,200 995 0.007770$ $ 7.73
RI-103 Saunderstown 02874 1.505 PV PV 9/17/08 A-16 1,656 1,184 0.033770$ $ 39.98
RI-104 Westerly 02891 7.2 PV PV 8/26/08 A-16 7,920 5,186 0.033770$ $ 175.13
RI-107 Wakefield 02879 3.24 pv pv 09/30/08 A-16 3,564 2,675 0.033770$ $ 90.35
RI-110 Little Compton 02837 5 pv pv 09/29/08 A-16 5,500 4,114 0.033770$ $ 138.92
RI-111 Providence 02908 3.28 pv pv 10/08/08 C-06 3,608 2,788 0.036340$ $ 101.30
RI-112 Portsmouth 02871 3 pv pv 09/26/08 A-16 3,300 2,441 0.033770$ $ 82.44
RI-113 Newport 02840 3.07 PV PV 10/14/08 A-16 3,377 2,665 0.033770$ $ 89.98
RI-116 Middletown 01760 58 PV PV 09/09/99 G-32 63,800 63,800 0.008890$ $ 567.18
Total kWhs 2,020,367 1,997,999 Total Lost Revenue $30,897

Schedule JAL-15

NATIONAL GRID R.I.P.U.C. DOCKET NO. ____
JANUARY 2009 ELECTRIC RETAIL RATE FILING WITNESS: JEANNE A. LLOYD
S:\RADATA1\2008 neco\Annual Filing\JALtestimony-2009.doc
Schedule JAL-15
Tariff Cover Sheets
Clean and Marked to Show Changes Version

S:\RADATA1\2008 neco\Annual Filing\narrjan09.coversheets.clean.doc
THE NARRAGANSETT ELECTRIC COMPANY Effective Basic Residential Rate (A-16) January 1, 2009 Retail Delivery Service R.I.P.U.C. No. 1170 Monthly Charge As Adjusted Rates for Retail Delivery Service Customer Charge per month $2.75 Non-Bypassable Transition Charge per kWh 0.235¢ Transmission Charge per kWh 0.436¢ Transmission Adjustment Factor per kWh 1.064¢ Distribution Charge per kWh 3.376¢ Minimum Charge per month $2.75 Conservation and Load Management Adjustment per kWh 0.230¢
Rates for Standard Offer Service or Last Resort Service (Optional) Standard Offer per kWh per Standard Offer Service tariff Last Resort per kWh per Last Resort Service tariff Tax Note: The rates listed above do not reflect gross earnings tax or sales taxes. However, such taxes,
when applicable, will appear on bills sent to customers. Other Rate Clauses apply as usual.

S:\RADATA1\2008 neco\Annual Filing\narrjan09.coversheets.clean.doc
THE NARRAGANSETT ELECTRIC COMPANY Effective Low Income Rate (A-60) January 1, 2009 Retail Delivery Service R.I.P.U.C. No. 1171 Monthly Charge As Adjusted Rates for Retail Delivery Service Non-Bypassable Transition Charge per kWh 0.235¢ Transmission Charge per kWh 0.338¢ Transmission Adjustment Factor per kWh 1.064¢ Distribution Charges per kWh December through March First 450 kWhs * 0.382¢ Next 750 kWhs 3.055¢ kWhs in excess of 1200 kWhs 2.548¢ April through November First 450 kWhs * 0.382¢ kWhs in excess of 450 kWhs 3.055¢ Conservation and Load Management Adjustment per kWh 0.230¢ Rates for Standard Offer Service or Last Resort Service (Optional)
Standard Offer per kWh per Standard Offer Service tariff
Last Resort per kWh per Last Resort Service tariff * Includes credit of 1.306¢ per kWh. Tax Note: The rates listed above do not reflect gross earnings tax or sales taxes. However, such
taxes, when applicable, will appear on bills sent to customers. Other Rate Clauses apply as usual.

S:\RADATA1\2008 neco\Annual Filing\narrjan09.coversheets.clean.doc
THE NARRAGANSETT ELECTRIC COMPANY Effective C&I Back-Up Service Rate (B-32) January 1, 2009 Retail Delivery Service R.I.P.U.C. No. 1172 Monthly Charge As Adjusted
Rates for Rates for Back-Up Service Supplemental Service
Rates for Retail Delivery Service
Customer Charge per month $236.43 n/a
Transmission Demand Charge per kW n/a $1.27
Distribution Demand Charge per kW $5.11 $1.99 Distribution Demand Charge per kW (Applicable to former Auxiliary Service Customers) $5.11 $1.99 Transmission Adjustment Factor per kWh n/a 1.064¢
Distribution Energy Charge per kWh n/a 0.889¢
Non-bypassable Transition Charge per kWh n/a 0.235¢
C&LM Adjustment per kWh n/a 0.230¢
Rates for Standard Offer Service or Last Resort Service (Optional)
Standard Offer per kWh n/a per Standard Offer Service tariff
Last Resort per kWh n/a per Last Resort Service tariff Tax Note: The rates listed above do not reflect gross earnings tax or sales taxes. However, such taxes,
when applicable, will appear on bills sent to customers. Other Rate Clauses apply as usual.

S:\RADATA1\2008 neco\Annual Filing\narrjan09.coversheets.clean.doc
THE NARRAGANSETT ELECTRIC COMPANY Effective 3,000 kW Back-Up Service Rate (B-62) January 1, 2009 Retail Delivery Service R.I.P.U.C. No. 1173 Monthly Charge As Adjusted
Rates for Rates for Back-Up Service Supplemental Service
Rates for Retail Delivery Service
Customer Charge per month $17,118.72 n/a
Distribution Demand Charge per kW $2.22 $2.22 Distribution Demand Charge per kW (Applicable to former Auxiliary Service Customers) $2.22 $2.22 Transmission Demand Charge per kW n/a $1.39
Transmission Adjustment Factor per kWh n/a 1.064¢
Non-bypassable Transition Charge per kWh n/a 0.235¢ C&LM Adjustment per kWh n/a 0.230¢
Rates for Standard Offer Service or Last Resort Service (Optional)
Standard Offer per kWh n/a per Standard Offer Service tariff
Last Resort per kWh n/a per Last Resort Service tariff Tax Note: The rates listed above do not reflect gross earnings tax or sales taxes. However, such taxes,
when applicable, will appear on bills sent to customers. Other Rate Clauses apply as usual.

S:\RADATA1\2008 neco\Annual Filing\narrjan09.coversheets.clean.doc
THE NARRAGANSETT ELECTRIC COMPANY Effective Small C&I Rate (C-06) January 1, 2009 Retail Delivery Service
R.I.P.U.C. No. 1174 Monthly Charge As Adjusted Rates for Retail Delivery Service
Customer Charge per month $6.00
Unmetered Charge per month $1.83 Non-Bypassable Transition Charge per kWh 0.235¢
Transmission Charge per kWh 0.536¢
Transmission Adjustment Factor per kWh 1.064¢
Distribution Charge per kWh 3.624¢
Conservation and Load Management Adjustment per kWh 0.230¢
Rates for Standard Offer Service or Last Resort Service (Optional)
Standard Offer per kWh per Standard Offer Service tariff
Last Resort per kWh per Last Resort Service tariff Tax Note: The rates listed above do not reflect gross earnings tax or sales taxes. However, such
taxes, when applicable, will appear on bills sent to customers. Other Rate Clauses apply as usual.

S:\RADATA1\2008 neco\Annual Filing\narrjan09.coversheets.clean.doc
THE NARRAGANSETT ELECTRIC COMPANY Effective Residential Storage Heating Rate (E-30) January 1, 2009 Retail Delivery Service
R.I.P.U.C. No. 1175 Monthly Charge As Adjusted Rates for Retail Delivery Service
Customer Charge per month $2.75
Non-Bypassable Transition Charge per kWh 0.235¢
Transmission Charge per kWh 0.261¢
Transmission Adjustment Factor per kWh 1.064¢
Distribution Charge per kWh 3.376¢
Conservation and Load Management Adjustment per kWh 0.230¢
Rates for Standard Offer Service or Last Resort Service (Optional) Standard Offer per kWh per Standard Offer Service tariff
Last Resort per kWh per Last Resort Service tariff
Tax Note: The rates listed above do not reflect gross earnings tax or sales taxes. However, such
taxes, when applicable, will appear on bills sent to customers. Other Rate Clauses apply as usual.

S:\RADATA1\2008 neco\Annual Filing\narrjan09.coversheets.clean.doc
THE NARRAGANSETT ELECTRIC COMPANY Effective Storage Cooling Rate (E-40) January 1, 2009 Retail Delivery Service
R.I.P.U.C. No 1190 Monthly Charge As Adjusted Rates for Retail Delivery Service
Customer Charge per month $75.15
Non-Bypassable Transition Charge per kWh 0.235¢
Transmission Charge per kWh 0.141¢
Transmission Adjustment Factor per kWh 1.064¢
Distribution Charge per kWh Peak/Shoulder 2.536¢ Off Peak 0.949¢ Conservation and Load Management Adjustment per kWh 0.230¢
Rates for Standard Offer Service or Last Resort Service (Optional) Standard Offer per kWh per Standard Offer Service tariff
Last Resort per kWh per Last Resort Service tariff
Tax Note: The rates listed above do not reflect gross earnings tax or sales taxes. However, such
taxes, when applicable, will appear on bills sent to customers. Other Rate Clauses apply as usual.

S:\RADATA1\2008 neco\Annual Filing\narrjan09.coversheets.clean.doc
THE NARRAGANSETT ELECTRIC COMPANY Effective General C&I Rate (G-02) January 1, 2009 Retail Delivery Service R.I.P.U.C. No. 1176 Monthly Charge As Adjusted Rates for Retail Delivery Service
Customer Charge per month $103.41 Transmission Charge per kW in excess of 10 kW $1.40
Distribution Charge per kW in excess of 10 kW $3.22
Non-Bypassable Transition Charge per kWh 0.235¢
Transmission Adjustment Factor per kWh 1.064¢
Distribution Charge per kWh 0.777¢
Conservation and Load Management Adjustment per kWh 0.230¢
Rates for Standard Offer Service or Last Resort Service (Optional)
Standard Offer per kWh per Standard Offer Service tariff
Last Resort per kWh per Last Resort Service tariff Tax Note: The rates listed above do not reflect gross earnings tax or sales taxes. However, such
taxes, when applicable, will appear on bills sent to customers. Other Rate Clauses apply as usual.

S:\RADATA1\2008 neco\Annual Filing\narrjan09.coversheets.clean.doc
THE NARRAGANSETT ELECTRIC COMPANY Effective 200 kW Demand Rate (G-32) January 1, 2009 Retail Delivery Service R.I.P.U.C. No. 1177 Monthly Charge As Adjusted Rates for Retail Delivery Service
Customer Charge per month $236.43
Transmission Charge per kW $1.27 Distribution Charge per kW $1.99
Non-Bypassable Transition Charge per kWh 0.235¢ Transmission Adjustment Factor per kWh 1.064¢
Distribution Charge per kWh 0.889¢
Conservation and Load Management Adjustment per kWh 0.230¢
Rates for Standard Offer Service or Last Resort Service (Optional)
Standard Offer per kWh per Standard Offer Service tariff Last Resort per kWh per Last Resort Service tariff
Tax Note: The rates listed above do not reflect gross earnings tax or sales taxes (when applicable).
However, such taxes, when applicable, will appear on bills sent to customers. Other Rate Clauses apply as usual.

S:\RADATA1\2008 neco\Annual Filing\narrjan09.coversheets.clean.doc
THE NARRAGANSETT ELECTRIC COMPANY Effective 3000 kW Demand Rate (G-62) January 1, 2009 Retail Delivery Service R.I.P.U.C. No. 1178 Monthly Charge As Adjusted Rates for Retail Delivery Services
Customer Charge per month $17,118.72 Transmission Charge per kW $1.39 Distribution Charge per kW $2.22 Non-Bypassable Transition Charge per kWh 0.235¢ Transmission Adjustment Factor per kWh 1.064¢ Conservation and Load Management Adjustment per kWh 0.230¢
Rates for Standard Offer Service or Last Resort Service (Optional)
Standard Offer per kWh per Standard Offer Service tariff
Last Resort per kWh per Last Resort Service tariff
Tax Note: The rates listed above do not reflect gross earnings tax or sales taxes (when applicable).
However, such taxes, when applicable, will appear on bills sent to customers. Other Rate Clauses apply as usual.

S:\RADATA1\2008 neco\Annual Filing\narrjan09.coversheets.clean.doc
THE NARRAGANSETT ELECTRIC COMPANY Effective Limited Traffic Signal Service (R-02) January 1, 2009 Retail Delivery Service R.I.P.U.C. No. 1179 Monthly Charge as Adjusted Rates for Retail Delivery Service
Unmetered Charge per month $1.83
Non-Bypassable Transition Charge per kWh 0.235¢ Transmission Charge per kWh 0.259¢ Transmission Adjustment Factor per kWh 1.064¢ Distribution Charge per kWh 3.624¢ Conservation and Load Management Adjustment per kWh 0.230¢
Rates for Standard Offer Service or Last Resort (Optional)
Standard Offer per kWh per Standard Offer Service tariff
Last Resort per kWh per Last Resort Service tariff Tax Note: The rates listed above do not reflect gross earnings tax or sales taxes (when applicable).
However, such taxes, when applicable, will appear on bills sent to customers. Other Rate Clauses apply as usual.

S:\RADATA1\2008 neco\Annual Filing\narrjan09.coversheets.clean.doc
THE NARRAGANSETT ELECTRIC COMPANY Effective Limited Service - Private Lighting (S-10) January 1, 2009 Retail Delivery Service R.I.P.U.C. No. 1180 Luminaire Type/Lumens Code Annual kWh Incandescent 1,000 10 440 Mercury Vapor 8,000 Post Top 2 908 4,000 3 561 8,000 4 908 22,000 5 1,897 63,000 6 4,569 22,000 FL 23 1,897 63,000 FL 24 4,569 Sodium Vapor 4,000 70 248 5,800 71 349 9,600 72 490 27,500 74 1,284 50,000 75 1,968 27,500 FL 77 1,284 50,000 FL 78 1,968 9,600 Post Top 79 490 27,500 (24 hr) 84 2,568 Non-Bypassable Transition Charge per kWh 0.235¢ Transmission Charge per kWh 0.259¢ Transmission Adjustment Factor per kWh 1.064¢ Conservation & Load Management Adjustment per kWh 0.230¢ Narragansett Blackstone Newport Zone Zone Zone Streetlight Credit per kWh 0.000¢ 4.420¢ 2.918¢ Standard Offer per Standard Offer Service tariff (Optional) Last Resort per Last Resort Service tariff (Optional) Tax Note:The rates listed above do not reflect gross earnings tax or sales taxes (when applicable). However, such taxes, when applicable, will appear on bills sent to customers. Other Rate Clauses apply as usual.

S:\RADATA1\2008 neco\Annual Filing\narrjan09.coversheets.clean.doc
THE NARRAGANSETT ELECTRIC COMPANY Effective General Streetlighting Service (S-14) January 1, 2009 Retail Delivery Service R.I.P.U.C. No. 1181 Luminaire Type/Lumens Code Annual kWh Incandescent 1,000 10 440 1,500 11 845 Mercury Vapor 8,000 Post Top 02 908 4,000 03 561 8,000 04 908 15,000 17, 18 1,874 22,000 05 1,897 63,000 06 4,569 Sodium Vapor 4,000 70, 710, 711, 750, 755, 756 248 5,800 71 349 9,600 72 490 27,500 74 1,284 50,000 75 1,968 27,500 (24 hr) 84 2,568 50,000 FL 78 1,968 9,600 Post Top 79 490
Non-Bypassable Transition Charge per kWh 0.235¢
Transmission Charge per kWh 0.259¢
Transmission Adjustment Factor per kWh 1.064¢
Conservation & Load Management Adj. per kWh 0.230¢
Narragansett Blackstone Newport Zone Zone Zone
Streetlight Credit per kWh 0.000¢ 4.420¢ 2.918¢
Standard Offer Service per Standard Offer Service tariff (Optional)
Last Resort Service per Last Resort Service tariff (Optional)
Tax Note: The rates listed above do not reflect gross earnings tax or sales taxes (when applicable).
However, such taxes, when applicable, will appear on bills sent to customers. Other Rate Clauses apply as usual.

S:\RADATA1\2008 neco\Annual Filing\narrjan09.coversheets.clean.doc
THE NARRAGANSETT ELECTRIC COMPANY Effective Limited Service All-Electric Living (T-06) January 1, 2009 Retail Delivery Service R.I.P.U.C. No. 1182 Monthly Charge As Adjusted Rates for Retail Delivery Service Residential:
Customer Charge per month $2.75 Distribution Charge per kWh 3.376¢
Minimum Charge per month $2.75
Commercial:
Customer Charge per month $6.00 Distribution Charge per kWh 3.624¢ Minimum Charge per month $6.00
All Classes:
Non-Bypassable Transition Charge per kWh 0.235¢ Transmission Charge per kWh 0.361¢
Transmission Adjustment Factor per kWh 1.064¢
Conservation and Load Management Adjustment per kWh 0.230¢
Rates for Standard Offer Service or Last Resort Service (Optional)
Standard Offer per kWh per Standard Offer Service tariff
Last Resort per kWh per Last Resort Service tariff Tax Note: The rates listed above do not reflect gross earnings tax or sales taxes (when applicable).
However, such taxes, when applicable, will appear on bills sent to customers. Other Rate Clauses apply as usual.

S:\RADATA1\2008 neco\Annual Filing\narrjan09.coversheets.clean.doc
THE NARRAGANSETT ELECTRIC COMPANY Effective Electric Propulsion Rate (X-01) January 1, 2009 High Voltage Delivery Service R.I.P.U.C. No. 1183 Monthly Charge As Adjusted Rates for High Voltage Delivery Service
Customer Charge per month $10,000.00
Transmission Demand Charge per kW $1.34
Non-Bypassable Transition Charge per kWh 0.235¢ Transmission Adjustment Factor per kWh 1.064¢
Distribution Energy Charge per kWh 0.312¢
Conservation and Load Management Adjustment per kWh 0.230¢
Rates for Standard Offer Service or Last Resort Service (Optional)
Standard Offer per kWh per Standard Offer Service tariff
Last Resort per kWh per Last Resort Service tariff
Tax Note: The rates listed above do not reflect gross earnings tax or sales taxes (when applicable).
However, such taxes, when applicable, will appear on bills sent to customers. Other Rate Clauses apply as usual.

S:\RADATA1\2008 neco\Annual Filing\narrjan09.coversheets.clean.doc
THE NARRAGANSETT ELECTRIC COMPANY Effective Station Power Delivery and Reliability Service Rate (M-1) January 1, 2009
Retail Delivery Service
R.I.P.U.C. No. 1184 Rates for Station Power Delivery and Reliability Service Eligible Customers must select one of the two rate Options A or B below: Monthly Charges OPTION A Distribution Delivery Service Charge $3,406.18 per month Non-Bypassable Transition Charge Higher of: 0.235¢ per kWh or $3,500 Conservation and Load Management Charge Higher of 0.230¢ per kWh or $800 OPTION B Distribution Delivery Service Charge $3,406.18 per month Non-Bypassable Transition Charge 0.235¢ per kWh Conservation and Load Management Charge 0.230¢ per kWh Tax Note: The rates listed above do not reflect gross earnings tax or sales taxes (when applicable).
However, such taxes, when applicable, will appear on bills sent to customers.

S:\RADATA1\2008 neco\Annual Filing\narrjan09.coversheets.mtc.doc
THE NARRAGANSETT ELECTRIC COMPANY Effective Basic Residential Rate (A-16) January 1, 2008January 1, 2009 Retail Delivery Service R.I.P.U.C. No. 1170 Monthly Charge As Adjusted Rates for Retail Delivery Service Customer Charge per month $2.75 Non-Bypassable Transition Charge per kWh 0.3220.235¢ Transmission Charge per kWh 0.436¢ Transmission Adjustment Factor per kWh 0.5411.064¢ Distribution Charge per kWh 3.377¢ (Eff. Jan 1, 2008) 3.376¢ (Eff. Jan 1, 2009) Minimum Charge per month $2.75 Conservation and Load Management Adjustment per kWh 0.230¢
Rates for Standard Offer Service or Last Resort Service (Optional) Standard Offer per kWh per Standard Offer Service tariff Last Resort per kWh per Last Resort Service tariff Tax Note: The rates listed above do not reflect gross earnings tax or sales taxes. However, such taxes,
when applicable, will appear on bills sent to customers. Other Rate Clauses apply as usual.

S:\RADATA1\2008 neco\Annual Filing\narrjan09.coversheets.mtc.doc
THE NARRAGANSETT ELECTRIC COMPANY Effective Low Income Rate (A-60) January 1, 2008January 1, 2009 Retail Delivery Service R.I.P.U.C. No. 1171 Monthly Charge As Adjusted Rates for Retail Delivery Service Non-Bypassable Transition Charge per kWh 0.3220.235¢ Transmission Charge per kWh 0.338¢ Transmission Adjustment Factor per kWh 0.5411.064¢ Distribution Charges per kWh December through March First 450 kWhs * 0.382¢ Next 750 kWhs 3.055¢ kWhs in excess of 1200 kWhs 2.548¢ April through November First 450 kWhs * 0.382¢ kWhs in excess of 450 kWhs 3.055¢ Conservation and Load Management Adjustment per kWh 0.230¢ Rates for Standard Offer Service or Last Resort Service (Optional)
Standard Offer per kWh per Standard Offer Service tariff
Last Resort per kWh per Last Resort Service tariff * Includes credit of 1.306¢ per kWh. Tax Note: The rates listed above do not reflect gross earnings tax or sales taxes. However, such
taxes, when applicable, will appear on bills sent to customers. Other Rate Clauses apply as usual.

S:\RADATA1\2008 neco\Annual Filing\narrjan09.coversheets.mtc.doc
THE NARRAGANSETT ELECTRIC COMPANY Effective C&I Back-Up Service Rate (B-32) January 1, 2008January 1, 2009 Retail Delivery Service R.I.P.U.C. No. 1172 Monthly Charge As Adjusted
Rates for Rates for Back-Up Service Supplemental Service
Rates for Retail Delivery Service
Customer Charge per month $236.43 n/a
Transmission Demand Charge per kW n/a $1.27
Distribution Demand Charge per kW $5.12 $2.00 (Eff. January 1, 2008) $5.11 $1.99 (Eff. January 1, 2009) Distribution Demand Charge per kW (Applicable to former Auxiliary Service Customers) $4.11 $2.00 (Eff. January 1, 2008) $5.11 $1.99 (Eff. January 1, 2009)
Transmission Adjustment Factor per kWh n/a 0.5411.064¢
Distribution Energy Charge per kWh n/a 0.889¢
Non-bypassable Transition Charge per kWh n/a 0.3220.235¢
C&LM Adjustment per kWh n/a 0.230¢
Rates for Standard Offer Service or Last Resort Service (Optional)
Standard Offer per kWh n/a per Standard Offer Service tariff
Last Resort per kWh n/a per Last Resort Service tariff Tax Note: The rates listed above do not reflect gross earnings tax or sales taxes. However, such taxes,
when applicable, will appear on bills sent to customers. Other Rate Clauses apply as usual.

S:\RADATA1\2008 neco\Annual Filing\narrjan09.coversheets.mtc.doc
THE NARRAGANSETT ELECTRIC COMPANY Effective 3,000 kW Back-Up Service Rate (B-62) January 1, 2008January 1, 2009 Retail Delivery Service R.I.P.U.C. No. 1173 Monthly Charge As Adjusted
Rates for Rates for Back-Up Service Supplemental Service
Rates for Retail Delivery Service
Customer Charge per month $17,118.72 n/a
Distribution Demand Charge per kW $2.24 $2.24 (Eff. January 1, 2008) $2.22 $2.22 (Eff. January 1, 2009) Distribution Demand Charge per kW (Applicable to former Auxiliary Service Customers) $1.77 $2.24 (Eff. January 1, 2008) $2.22 $2.22 (Eff. January 1, 2009) Transmission Demand Charge per kW n/a $1.39
Transmission Adjustment Factor per kWh n/a 0.5411.064¢
Non-bypassable Transition Charge per kWh n/a 0.3220.235¢ C&LM Adjustment per kWh n/a 0.230¢
Rates for Standard Offer Service or Last Resort Service (Optional)
Standard Offer per kWh n/a per Standard Offer Service tariff
Last Resort per kWh n/a per Last Resort Service tariff Tax Note: The rates listed above do not reflect gross earnings tax or sales taxes. However, such taxes,
when applicable, will appear on bills sent to customers. Other Rate Clauses apply as usual.

S:\RADATA1\2008 neco\Annual Filing\narrjan09.coversheets.mtc.doc
THE NARRAGANSETT ELECTRIC COMPANY Effective Small C&I Rate (C-06) January 1, 2008January 1, 2009 Retail Delivery Service
R.I.P.U.C. No. 1174 Monthly Charge As Adjusted Rates for Retail Delivery Service
Customer Charge per month $6.00
Unmetered Charge per month $1.83 Non-Bypassable Transition Charge per kWh 0.3220.235¢
Transmission Charge per kWh 0.536¢
Transmission Adjustment Factor per kWh 0.5411.064¢
Distribution Charge per kWh 3.634¢ (Eff. January 1, 2008) 3.624¢ (Eff. January 1, 2009)
Conservation and Load Management Adjustment per kWh 0.230¢
Rates for Standard Offer Service or Last Resort Service (Optional)
Standard Offer per kWh per Standard Offer Service tariff
Last Resort per kWh per Last Resort Service tariff Tax Note: The rates listed above do not reflect gross earnings tax or sales taxes. However, such
taxes, when applicable, will appear on bills sent to customers. Other Rate Clauses apply as usual.

S:\RADATA1\2008 neco\Annual Filing\narrjan09.coversheets.mtc.doc
THE NARRAGANSETT ELECTRIC COMPANY Effective Residential Storage Heating Rate (E-30) January 1, 2008January 1, 2009 Retail Delivery Service
R.I.P.U.C. No. 1175 Monthly Charge As Adjusted Rates for Retail Delivery Service
Customer Charge per month $2.75
Non-Bypassable Transition Charge per kWh 0.3220.235¢
Transmission Charge per kWh 0.261¢
Transmission Adjustment Factor per kWh 0.5411.064¢
Distribution Charge per kWh
3.017¢ (Eff. January 1, 2008) 3.376¢ (Eff. January 1, 2009) Conservation and Load Management Adjustment per kWh 0.230¢
Rates for Standard Offer Service or Last Resort Service (Optional) Standard Offer per kWh per Standard Offer Service tariff
Last Resort per kWh per Last Resort Service tariff
Tax Note: The rates listed above do not reflect gross earnings tax or sales taxes. However, such
taxes, when applicable, will appear on bills sent to customers. Other Rate Clauses apply as usual.

S:\RADATA1\2008 neco\Annual Filing\narrjan09.coversheets.mtc.doc
THE NARRAGANSETT ELECTRIC COMPANY Effective Storage Cooling Rate (E-40) January 1, 2008January 1, 2009 Retail Delivery Service
R.I.P.U.C. No 1190 Monthly Charge As Adjusted Rates for Retail Delivery Service
Customer Charge per month $75.15
Non-Bypassable Transition Charge per kWh 0.3220.235¢
Transmission Charge per kWh 0.141¢
Transmission Adjustment Factor per kWh 0.5411.064¢
Distribution Charge per kWh Peak/Shoulder 2.536¢ Off Peak 0.949¢ Conservation and Load Management Adjustment per kWh 0.230¢
Rates for Standard Offer Service or Last Resort Service (Optional) Standard Offer per kWh per Standard Offer Service tariff
Last Resort per kWh per Last Resort Service tariff
Tax Note: The rates listed above do not reflect gross earnings tax or sales taxes. However, such
taxes, when applicable, will appear on bills sent to customers. Other Rate Clauses apply as usual.

S:\RADATA1\2008 neco\Annual Filing\narrjan09.coversheets.mtc.doc
THE NARRAGANSETT ELECTRIC COMPANY Effective General C&I Rate (G-02) January 1, 2008January 1, 2009 Retail Delivery Service R.I.P.U.C. No. 1176 Monthly Charge As Adjusted Rates for Retail Delivery Service
Customer Charge per month $103.41 Transmission Charge per kW in excess of 10 kW $1.40
Distribution Charge per kW in excess of 10 kW $3.22
Non-Bypassable Transition Charge per kWh 0.3220.235¢
Transmission Adjustment Factor per kWh 0.5411.064¢
Distribution Charge per kWh 0.777¢
Conservation and Load Management Adjustment per kWh 0.230¢
Rates for Standard Offer Service or Last Resort Service (Optional)
Standard Offer per kWh per Standard Offer Service tariff
Last Resort per kWh per Last Resort Service tariff Tax Note: The rates listed above do not reflect gross earnings tax or sales taxes. However, such
taxes, when applicable, will appear on bills sent to customers. Other Rate Clauses apply as usual.

S:\RADATA1\2008 neco\Annual Filing\narrjan09.coversheets.mtc.doc
THE NARRAGANSETT ELECTRIC COMPANY Effective 200 kW Demand Rate (G-32) January 1, 2008January 1, 2009 Retail Delivery Service R.I.P.U.C. No. 1177 Monthly Charge As Adjusted Rates for Retail Delivery Service
Customer Charge per month $236.43
Transmission Charge per kW $1.27 Distribution Charge per kW $2.00 (Eff. January 1, 2008) $1.99 (Eff. January 1, 2009)
Non-Bypassable Transition Charge per kWh 0.3220.235¢ Transmission Adjustment Factor per kWh 0.5411.064¢
Distribution Charge per kWh 0.889¢
Conservation and Load Management Adjustment per kWh 0.230¢
Rates for Standard Offer Service or Last Resort Service (Optional)
Standard Offer per kWh per Standard Offer Service tariff Last Resort per kWh per Last Resort Service tariff
Tax Note: The rates listed above do not reflect gross earnings tax or sales taxes (when applicable).
However, such taxes, when applicable, will appear on bills sent to customers. Other Rate Clauses apply as usual.

S:\RADATA1\2008 neco\Annual Filing\narrjan09.coversheets.mtc.doc
THE NARRAGANSETT ELECTRIC COMPANY Effective 3000 kW Demand Rate (G-62) January 1, 2008January 1, 2009 Retail Delivery Service R.I.P.U.C. No. 1178 Monthly Charge As Adjusted Rates for Retail Delivery Services
Customer Charge per month $17,118.72 Transmission Charge per kW $1.39 Distribution Charge per kW $2.24 (Eff. January 1, 2008) $2.22 (Eff. January 1, 2009) Non-Bypassable Transition Charge per kWh 0.3220.235¢ Transmission Adjustment Factor per kWh 0.5411.064¢ Conservation and Load Management Adjustment per kWh 0.230¢
Rates for Standard Offer Service or Last Resort Service (Optional)
Standard Offer per kWh per Standard Offer Service tariff
Last Resort per kWh per Last Resort Service tariff
Tax Note: The rates listed above do not reflect gross earnings tax or sales taxes (when applicable).
However, such taxes, when applicable, will appear on bills sent to customers. Other Rate Clauses apply as usual.

S:\RADATA1\2008 neco\Annual Filing\narrjan09.coversheets.mtc.doc
THE NARRAGANSETT ELECTRIC COMPANY Effective Limited Traffic Signal Service (R-02) January 1, 2008January 1, 2009 Retail Delivery Service R.I.P.U.C. No. 1179 Monthly Charge as Adjusted Rates for Retail Delivery Service
Unmetered Charge per month $1.44 (Eff. January 1, 2008) $1.83 (Eff. January 1, 2009) Non-Bypassable Transition Charge per kWh 0.3220.235¢ Transmission Charge per kWh 0.259¢ Transmission Adjustment Factor per kWh 0.5411.064¢ Distribution Charge per kWh 3.071¢ (Eff. January 1, 2008) 3.624¢ (Eff. January 1, 2009) Conservation and Load Management Adjustment per kWh 0.230¢
Rates for Standard Offer Service or Last Resort (Optional)
Standard Offer per kWh per Standard Offer Service tariff
Last Resort per kWh per Last Resort Service tariff Tax Note: The rates listed above do not reflect gross earnings tax or sales taxes (when applicable).
However, such taxes, when applicable, will appear on bills sent to customers. Other Rate Clauses apply as usual.

S:\RADATA1\2008 neco\Annual Filing\narrjan09.coversheets.mtc.doc
THE NARRAGANSETT ELECTRIC COMPANY Effective Limited Service - Private Lighting (S-10) January 1, 2008January 1, 2009 Retail Delivery Service R.I.P.U.C. No. 1180 Luminaire Type/Lumens Code Annual kWh Incandescent 1,000 10 440 Mercury Vapor 8,000 Post Top 2 908 4,000 3 561 8,000 4 908 22,000 5 1,897 63,000 6 4,569 22,000 FL 23 1,897 63,000 FL 24 4,569 Sodium Vapor 4,000 70 248 5,800 71 349 9,600 72 490 27,500 74 1,284 50,000 75 1,968 27,500 FL 77 1,284 50,000 FL 78 1,968 9,600 Post Top 79 490 27,500 (24 hr) 84 2,568 Non-Bypassable Transition Charge per kWh 0.3220.235¢ Transmission Charge per kWh 0.259¢ Transmission Adjustment Factor per kWh 0.5411.064¢ Conservation & Load Management Adjustment per kWh 0.230¢ Narragansett Blackstone Newport Zone Zone Zone Streetlight Credit per kWh 0.000¢ 4.420¢ 2.918¢ Standard Offer per Standard Offer Service tariff (Optional) Last Resort per Last Resort Service tariff (Optional) Tax Note:The rates listed above do not reflect gross earnings tax or sales taxes (when applicable). However, such taxes, when applicable, will appear on bills sent to customers. Other Rate Clauses apply as usual.

S:\RADATA1\2008 neco\Annual Filing\narrjan09.coversheets.mtc.doc
THE NARRAGANSETT ELECTRIC COMPANY Effective General Streetlighting Service (S-14) January 1, 2008January 1, 2009 Retail Delivery Service R.I.P.U.C. No. 1181 Luminaire Type/Lumens Code Annual kWh Incandescent 1,000 10 440 1,500 11 845 Mercury Vapor 8,000 Post Top 02 908 4,000 03 561 8,000 04 908 15,000 17, 18 1,874 22,000 05 1,897 63,000 06 4,569 Sodium Vapor 4,000 70, 710, 711, 750, 755, 756 248 5,800 71 349 9,600 72 490 27,500 74 1,284 50,000 75 1,968 27,500 (24 hr) 84 2,568 50,000 FL 78 1,968 9,600 Post Top 79 490
Non-Bypassable Transition Charge per kWh 0.3220.235¢
Transmission Charge per kWh 0.259¢
Transmission Adjustment Factor per kWh 0.5411.064¢
Conservation & Load Management Adj. per kWh 0.230¢
Narragansett Blackstone Newport Zone Zone Zone
Streetlight Credit per kWh 0.000¢ 4.420¢ 2.918¢
Standard Offer Service per Standard Offer Service tariff (Optional)
Last Resort Service per Last Resort Service tariff (Optional)
Tax Note: The rates listed above do not reflect gross earnings tax or sales taxes (when applicable).
However, such taxes, when applicable, will appear on bills sent to customers. Other Rate Clauses apply as usual.

S:\RADATA1\2008 neco\Annual Filing\narrjan09.coversheets.mtc.doc
THE NARRAGANSETT ELECTRIC COMPANY Effective Limited Service All-Electric Living (T-06) January 1, 2008January 1, 2009 Retail Delivery Service R.I.P.U.C. No. 1182 Monthly Charge As Adjusted Rates for Retail Delivery Service Residential:
Customer Charge per month $2.75 Distribution Charge per kWh 3.150¢ (Eff. January 1, 2008) 3.376¢ (Eff. January 1, 2009)
Minimum Charge per month $2.75
Commercial:
Customer Charge per month $6.00 Distribution Charge per kWh 3.347¢ (Eff. January 1, 2008) 3.624¢ (Eff. January 1, 2009)
Minimum Charge per month $6.00
All Classes:
Non-Bypassable Transition Charge per kWh 0.3220.235¢ Transmission Charge per kWh 0.361¢
Transmission Adjustment Factor per kWh 0.5411.064¢
Conservation and Load Management Adjustment per kWh 0.230¢
Rates for Standard Offer Service or Last Resort Service (Optional)
Standard Offer per kWh per Standard Offer Service tariff
Last Resort per kWh per Last Resort Service tariff Tax Note: The rates listed above do not reflect gross earnings tax or sales taxes (when applicable).
However, such taxes, when applicable, will appear on bills sent to customers. Other Rate Clauses apply as usual.

S:\RADATA1\2008 neco\Annual Filing\narrjan09.coversheets.mtc.doc
THE NARRAGANSETT ELECTRIC COMPANY Effective Electric Propulsion Rate (X-01) January 1, 2008January 1, 2009 High Voltage Delivery Service R.I.P.U.C. No. 1183 Monthly Charge As Adjusted Rates for High Voltage Delivery Service
Customer Charge per month $10,000.00
Transmission Demand Charge per kW $1.34
Non-Bypassable Transition Charge per kWh 0.3220.235¢ Transmission Adjustment Factor per kWh 0.5411.064¢
Distribution Energy Charge per kWh 0.312¢
Conservation and Load Management Adjustment per kWh 0.230¢
Rates for Standard Offer Service or Last Resort Service (Optional)
Standard Offer per kWh per Standard Offer Service tariff
Last Resort per kWh per Last Resort Service tariff
Tax Note: The rates listed above do not reflect gross earnings tax or sales taxes (when applicable).
However, such taxes, when applicable, will appear on bills sent to customers. Other Rate Clauses apply as usual.

S:\RADATA1\2008 neco\Annual Filing\narrjan09.coversheets.mtc.doc
THE NARRAGANSETT ELECTRIC COMPANY Effective Station Power Delivery and Reliability Service Rate (M-1)January 1, 2008January 1, 2009
Retail Delivery Service
R.I.P.U.C. No. 1184 Rates for Station Power Delivery and Reliability Service Eligible Customers must select one of the two rate Options A or B below: Monthly Charges OPTION A Distribution Delivery Service Charge $3,406.18 per month Non-Bypassable Transition Charge Higher of: 0.3220.235¢ per kWh or $3,500 Conservation and Load Management Charge Higher of 0.230¢ per kWh or $800 OPTION B Distribution Delivery Service Charge $3,406.18 per month Non-Bypassable Transition Charge 0.3220.235¢ per kWh Conservation and Load Management Charge 0.230¢ per kWh Tax Note: The rates listed above do not reflect gross earnings tax or sales taxes (when applicable).
However, such taxes, when applicable, will appear on bills sent to customers.

Schedule JAL-16

NATIONAL GRID R.I.P.U.C. DOCKET NO. ____
JANUARY 2009 ELECTRIC RETAIL RATE FILING WITNESS: JEANNE A. LLOYD
S:\RADATA1\2008 neco\Annual Filing\JALtestimony-2009.doc
Schedule JAL-16
Proposed Standard Offer Service Tariff
Clean and Marked to Show Changes Versions

R.I.P.U.C. No. 2011 Canceling R.I.P.U.C. No. 2008
S:\RADATA1\2008 neco\Annual Filing\so_010109.doc
THE NARRAGANSETT ELECTRIC COMPANY STANDARD OFFER SERVICE
AVAILABILITY
All Customers (including new Customers) who have not elected to take their electric supply from a non-regulated power producer will receive their power supply under this Standard Offer Rate until the Customer either: (1) takes its electric supply from a non-regulated power producer; or (2) takes Last Resort Service.
Customers who leave Standard Offer Service may not return to Standard Offer Service.
Standard Offer Service may be terminated by a Customer upon the next scheduled meter read provided that notice of the change of supplier was received in accordance with the Company’s Terms and Conditions for Nonregulated Power Producers. MONTHLY CHARGE
The Charge for Standard Offer Service will be the sum of the applicable Standard Offer Service charges in addition to all appropriate Retail Delivery charges as stated in the applicable tariff. The monthly charge for Standard Offer Service shall also include the costs incurred by the Company to comply with the Renewable Energy Standard, established in R.I.G.L. Section 39-26-1 and the costs to comply with the Commission’s Rules Governing Energy Source Disclosure. RATE FOR ALL CLASSES
Standard Offer 9.5¢ per kWh Renewable Energy Standard Charge 0.084¢ per kWh
RATE CHANGES
The rates set forth in this tariff are effective for usage on and after January 1, 2009 until changes. Any changes will be filed with the Commission and are subject to Commission review and approval.
Effective January 1, 2009

R.I.P.U.C. No. 20082011 Canceling R.I.P.U.C. No. 2005-A2008
S:\RADATA1\2008 neco\Annual Filing\so_010109.mtc.doc
THE NARRAGANSETT ELECTRIC COMPANY STANDARD OFFER SERVICE
AVAILABILITY
All Customers (including new Customers) who have not elected to take their electric supply from a non-regulated power producer will receive their power supply under this Standard Offer Rate until the Customer either: (1) takes its electric supply from a non-regulated power producer; or (2) takes Last Resort Service.
Customers who leave Standard Offer Service may not return to Standard Offer Service.
Standard Offer Service may be terminated by a Customer upon the next scheduled meter read provided that notice of the change of supplier was received in accordance with the Company’s Terms and Conditions for Nonregulated Power Producers. MONTHLY CHARGE
The Charge for Standard Offer Service will be the sum of the applicable Standard Offer Service charges in addition to all appropriate Retail Delivery charges as stated in the applicable tariff. The monthly charge for Standard Offer Service shall also include the costs incurred by the Company to comply with the Renewable Energy Standard, established in R.I.G.L. Section 39-26-1 and the costs to comply with the Commission’s Rules Governing Energy Source Disclosure. RATE FOR ALL CLASSES
Standard Offer 12.49.5¢ per kWh Renewable Energy Standard Charge 0.084¢ per kWh
RATE CHANGES
The rates set forth in this tariff are effective for usage on and after July 15, 2008January 1, 2009 until changes. Any changes will be filed with the Commission and are subject to Commission review and approval.
Effective July 15, 2008 January 1, 2009

Schedule JAL-17

NATIONAL GRID R.I.P.U.C. DOCKET NO. ____
JANUARY 2009 ELECTRIC RETAIL RATE FILING WITNESS: JEANNE A. LLOYD
S:\RADATA1\2008 neco\Annual Filing\JALtestimony-2009.doc
Schedule JAL-17
Typical Bill Analysis

National GridRIPUC Docket No. ____
Schedule JAL-17Page 1 of 25
File: R:\2008 neco\Annual Filing\[typbills.XLS]Input Section
Date: 13-Nov-08 Calculation of Monthly Typical Bill Time: 07:43 AM Comparison of Present and Proposed Rates
Impact on A-16 Rate Customers
Present Rates Proposed Rates Increase/(Decrease)Monthly Standard Standard Percentage
kWh Total Offer Delivery Total Offer Delivery Amount % of Total of Custs
120 $24.61 $15.61 $9.00 $21.52 $11.98 $9.54 -$3.09 -12.6% 9.0%
240 $46.34 $31.21 $15.13 $40.18 $23.96 $16.22 -$6.16 -13.3% 15.7%
500 $93.44 $65.02 $28.42 $80.60 $49.92 $30.68 -$12.84 -13.7% 38.2%
700 $129.67 $91.03 $38.64 $111.69 $69.88 $41.81 -$17.98 -13.9% 20.2%
950 $174.95 $123.54 $51.41 $150.56 $94.84 $55.72 -$24.39 -13.9% 14.6%
1,000 $184.01 $130.04 $53.97 $158.33 $99.83 $58.50 -$25.68 -14.0% 2.3%
Present Rates: A-16 Proposed Rates: A-16
Customer Charge $2.75 Customer Charge $2.75Transmission Energy Charge (1) kWh x $0.00977 Transmission Energy Charge (2) kWh x $0.01500Distribution Energy Charge kWh x $0.03377 Distribution Energy Charge kWh x $0.03376Transition Energy Charge kWh x $0.00322 Transition Energy Charge kWh x $0.00235C&LM Adjustment kWh x $0.00230 C&LM Adjustment kWh x $0.00230
Gross Earnings Tax 4.00% Gross Earnings Tax 4.00%
Standard Offer Charge (3) kWh x $0.12484 Standard Offer Charge (4) kWh x $0.09584
Note (1): Includes Transmission Adjustment Factor of $0.00541/kWhNote (2): Includes Proposed Transmission Adjustment Factor of $0.01064/kWhNote (3): Includes Standard Offer of $0.124/kWh and Renewable Energy Standard Charge of $0.00084/kWhNote (4): Includes Proposed Standard Offer of $0.095/kWh and Renewable Energy Standard Charge of $0.00084/kWh

National GridRIPUC Docket No. ____
Schedule JAL-17Page 2 of 25
File: R:\2008 neco\Annual Filing\[typbills.XLS]Input Section
Date: 13-Nov-08 Calculation of Monthly Typical Bill Time: 07:43 AM Comparison of Present and Proposed Rates
Impact on A-60 Rate Customers - Winter (December through March)Without Control Credit for Water Heater
Present Rates Proposed Rates Increase/(Decrease)Monthly Standard Standard
kWh Total Offer Delivery Total Offer Delivery Amount % of Total
100 $14.89 $13.00 $1.89 $12.32 $9.98 $2.34 -$2.57 -17.3%
200 $29.79 $26.01 $3.78 $24.66 $19.97 $4.69 -$5.13 -17.2%
300 $44.68 $39.01 $5.67 $36.98 $29.95 $7.03 -$7.70 -17.2%
500 $75.85 $65.02 $10.83 $63.03 $49.92 $13.11 -$12.82 -16.9%
750 $120.05 $97.53 $22.52 $100.80 $74.88 $25.92 -$19.25 -16.0%
1250 $208.17 $162.55 $45.62 $176.08 $124.79 $51.29 -$32.09 -15.4%
Present Rates: A-60 Proposed Rates: A-60
Customer Charge $0.00 Customer Charge $0.00Transmission Energy Charge (1) kWh x $0.00879 Transmission Energy Charge (2) kWh x $0.01402Initial Block Energy Charge (1st 450 kWh) kWh x $0.00382 Initial Block Energy Charge (1st 450 kWh) kWh x $0.00382Second Block Energy Charge (next 750 kWh kWh x $0.03055 Second Block Energy Charge (next 750 kWh kWh x $0.03055Tail Block Energy Charge kWh x $0.02548 Tail Block Energy Charge kWh x $0.02548Transition Energy Charge kWh x $0.00322 Transition Energy Charge kWh x $0.00235C&LM Adjustment kWh x $0.00230 C&LM Adjustment kWh x $0.00230
Gross Earnings Tax 4.00% Gross Earnings Tax 4.00%
Standard Offer Charge (3) kWh x $0.12484 Standard Offer Charge (4) kWh x $0.09584
Note (1): Includes Transmission Adjustment Factor of $0.00541/kWhNote (2): Includes Proposed Transmission Adjustment Factor of $0.01064/kWhNote (3): Includes Standard Offer of $0.124/kWh and Renewable Energy Standard Charge of $0.00084/kWhNote (4): Includes Proposed Standard Offer of $0.095/kWh and Renewable Energy Standard Charge of $0.00084/kWh

National GridRIPUC Docket No. ____
Schedule JAL-17Page 2 of 25
File: R:\2008 neco\Annual Filing\[typbills.XLS]Input Section
Date: 13-Nov-08 Calculation of Monthly Typical Bill Time: 07:43 AM Comparison of Present and Proposed Rates
Impact on A-60 Rate Customers - Winter (December through March)With Control Credit for Water Heater
Present Rates Proposed Rates Increase/(Decrease)Monthly Standard Standard
kWh Total Offer Delivery Total Offer Delivery Amount % of Total
100 $14.75 $13.00 $1.75 $12.32 $9.98 $2.34 -$2.43 -16.5%
200 $29.51 $26.01 $3.50 $24.66 $19.97 $4.69 -$4.85 -16.4%
300 $44.26 $39.01 $5.25 $36.98 $29.95 $7.03 -$7.28 -16.4%
500 $75.17 $65.02 $10.15 $63.03 $49.92 $13.11 -$12.14 -16.2%
750 $119.02 $97.53 $21.49 $100.80 $74.88 $25.92 -$18.22 -15.3%
1250 $207.14 $162.55 $44.59 $176.08 $124.79 $51.29 -$31.06 -15.0%
Present Rates: A-60 Proposed Rates: A-60
Customer Charge $0.00 Customer Charge $0.00Transmission Energy Charge (1) kWh x $0.00879 Transmission Energy Charge (2) kWh x $0.01402Initial Block Energy Charge (1st 450 kWh) kWh x $0.00382 Initial Block Energy Charge (1st 450 kWh) kWh x $0.00382Second Block Energy Charge (next 750 kWh kWh x $0.03055 Second Block Energy Charge (next 750 kWh kWh x $0.03055Tail Block Energy Charge kWh x $0.02548 Tail Block Energy Charge kWh x $0.02548Transition Energy Charge kWh x $0.00322 Transition Energy Charge kWh x $0.00235C&LM Adjustment kWh x $0.00230 C&LM Adjustment kWh x $0.00230Water Heating Credit (1st 750 kWhs) kWh x -$0.00132 Water Heating Credit (1st 750 kWhs) kWh x $0.00000
Gross Earnings Tax 4.00% Gross Earnings Tax 4.00%
Standard Offer Charge (3) kWh x $0.12484 Standard Offer Charge (4) kWh x $0.09584
Note (1): Includes Transmission Adjustment Factor of $0.00541/kWhNote (2): Includes Proposed Transmission Adjustment Factor of $0.01064/kWh Note (3): Includes Standard Offer of $0.124/kWh and Renewable Energy Standard Charge of $0.00084/kWhNote (4): Includes Proposed Standard Offer of $0.095/kWh and Renewable Energy Standard Charge of $0.00084/kWh

National GridRIPUC Docket No. ____
Schedule JAL-17Page 2 of 25
File: R:\2008 neco\Annual Filing\[typbills.XLS]Input Section
Date: 13-Nov-08 Calculation of Monthly Typical Bill Time: 07:43 AM Comparison of Present and Proposed Rates
Impact on A-60 Rate Customers - Non-Winter (April through November)Without Control Credit for Water Heater
Present Rates Proposed Rates Increase/(Decrease)Monthly Standard Standard
kWh Total Offer Delivery Total Offer Delivery Amount % of Total
100 $14.89 $13.00 $1.89 $12.32 $9.98 $2.34 -$2.57 -17.3%
200 $29.79 $26.01 $3.78 $24.66 $19.97 $4.69 -$5.13 -17.2%
300 $44.68 $39.01 $5.67 $36.98 $29.95 $7.03 -$7.70 -17.2%
500 $75.85 $65.02 $10.83 $63.03 $49.92 $13.11 -$12.82 -16.9%
750 $120.05 $97.53 $22.52 $100.80 $74.88 $25.92 -$19.25 -16.0%
1250 $208.43 $162.55 $45.88 $176.35 $124.79 $51.56 -$32.08 -15.4%
Present Rates: A-60 Proposed Rates: A-60
Customer Charge $0.00 Customer Charge $0.00Transmission Energy Charge (1) kWh x $0.00879 Transmission Energy Charge (2) kWh x $0.01402Initial Block Energy Charge (1st 450 kWh) kWh x $0.00382 Initial Block Energy Charge (1st 450 kWh) kWh x $0.00382Tail Block Energy Charge kWh x $0.03055 Tail Block Energy Charge kWh x $0.03055Transition Energy Charge kWh x $0.00322 Transition Energy Charge kWh x $0.00235C&LM Adjustment kWh x $0.00230 C&LM Adjustment kWh x $0.00230
Gross Earnings Tax 4.0% Gross Earnings Tax 4.0%
Standard Offer Charge (3) kWh x $0.12484 Standard Offer Charge (4) kWh x $0.09584
Note (1): Includes Transmission Adjustment Factor of $0.00541/kWhNote (2): Includes Proposed Transmission Adjustment Factor of $0.01064/kWhNote (3): Includes Standard Offer of $0.124/kWh and Renewable Energy Standard Charge of $0.00084/kWhNote (4): Includes Proposed Standard Offer of $0.095/kWh and Renewable Energy Standard Charge of $0.00084/kWh

National GridRIPUC Docket No. ____
Schedule JAL-17Page 2 of 25
File: R:\2008 neco\Annual Filing\[typbills.XLS]Input Section
Date: 13-Nov-08 Calculation of Monthly Typical Bill Time: 07:43 AM Comparison of Present and Proposed Rates
Impact on A-60 Rate Customers - Non-Winter (April through November)With Control Credit for Water Heater
Present Rates Proposed Rates Increase/(Decrease)Monthly Standard Standard
kWh Total Offer Delivery Total Offer Delivery Amount % of Total
100 $14.75 $13.00 $1.75 $12.32 $9.98 $2.34 -$2.43 -16.5%
200 $29.51 $26.01 $3.50 $24.66 $19.97 $4.69 -$4.85 -16.4%
300 $44.26 $39.01 $5.25 $36.98 $29.95 $7.03 -$7.28 -16.4%
500 $75.17 $65.02 $10.15 $63.03 $49.92 $13.11 -$12.14 -16.2%
750 $119.02 $97.53 $21.49 $100.80 $74.88 $25.92 -$18.22 -15.3%
1250 $207.40 $162.55 $44.85 $176.35 $124.79 $51.56 -$31.05 -15.0%
Present Rates: A-60 Proposed Rates: A-60
Customer Charge $0.00 Customer Charge $0.00Transmission Energy Charge (1) kWh x $0.00879 Transmission Energy Charge (2) kWh x $0.01402Initial Block Energy Charge (1st 450 kWh) kWh x $0.00382 Initial Block Energy Charge (1st 450 kWh) kWh x $0.00382Tail Block Energy Charge kWh x $0.03055 Tail Block Energy Charge kWh x $0.03055Transition Energy Charge kWh x $0.00322 Transition Energy Charge kWh x $0.00235C&LM Adjustment kWh x $0.00230 C&LM Adjustment kWh x $0.00230Water Heating Credit (1st 750 kWhs) kWh x -$0.00132 Water Heating Credit (1st 750 kWhs) kWh x $0.00000
Gross Earnings Tax 4.0% Gross Earnings Tax 4.0%
Standard Offer Charge (3) kWh x $0.12484 Standard Offer Charge (4) kWh x $0.09584
Note (1): Includes Transmission Adjustment Factor of $0.00541/kWhNote (2): Includes Proposed Transmission Adjustment Factor of $0.01064/kWhNote (3): Includes Standard Offer of $0.124/kWh and Renewable Energy Standard Charge of $0.00084/kWhNote (4): Includes Proposed Standard Offer of $0.095/kWh and Renewable Energy Standard Charge of $0.00084/kWh

National GridRIPUC Docket No. ____
Schedule JAL-17Page 6 of 25
File: R:\2008 neco\Annual Filing\[typbills.XLS]Input Section
Date: 13-Nov-08 Calculation of Monthly Typical Bill Time: 07:43 AM Comparison of Present and Proposed Rates
Impact on C-06 Rate Customers
Present Rates Proposed Rates Increase/(Decrease)Monthly Standard Standard Percentage
kWh Total Offer Delivery Total Offer Delivery Amount % of Total of Custs
250 $52.47 $32.51 $19.96 $46.03 $24.96 $21.07 -$6.44 -12.3% 35.2%
500 $98.68 $65.02 $33.66 $85.80 $49.92 $35.88 -$12.88 -13.1% 17.0%
1,000 $191.11 $130.04 $61.07 $165.34 $99.83 $65.51 -$25.77 -13.5% 19.0%
1,500 $283.54 $195.06 $88.48 $244.89 $149.75 $95.14 -$38.65 -13.6% 9.8%
2,000 $375.98 $260.08 $115.90 $324.44 $199.67 $124.77 -$51.54 -13.7% 19.1%
Present Rates: C-06 Proposed Rates: C-06
Customer Charge $6.00 Customer Charge $6.00Transmission Energy Charge (1) kWh x $0.01077 Transmission Energy Charge (2) kWh x $0.01600Distribution Energy Charge kWh x $0.03634 Distribution Energy Charge kWh x $0.03624Transition Energy Charge kWh x $0.00322 Transition Energy Charge kWh x $0.00235C&LM Adjustment kWh x $0.00230 C&LM Adjustment kWh x $0.00230
Gross Earnings Tax 4.00% Gross Earnings Tax 4.00%
Standard Offer Charge (3) kWh x $0.12484 Standard Offer Charge (4) kWh x $0.09584
Note (1): Includes Transmission Adjustment Factor of $0.00541/kWhNote (2): Includes Proposed Transmission Adjustment Factor of $0.01064/kWhNote (3): Includes Standard Offer of $0.124/kWh and Renewable Energy Standard Charge of $0.00084/kWhNote (4): Includes Proposed Standard Offer of $0.095/kWh and Renewable Energy Standard Charge of $0.00084/kWh

National GridRIPUC Docket No. ____
Schedule JAL-17Page 7 of 25
File: R:\2008 neco\Annual Filing\[typbills.XLS]Input Section
Date: 13-Nov-08 Calculation of Monthly Typical Bill Time: 07:43 AM Comparison of Present and Proposed Rates
Impact on R-02 (Phase-out to C-06) Rate Customers
Present Rates Proposed Rates Increase/(Decrease)Monthly Standard Standard Percentage
kWh Total Offer Delivery Total Offer Delivery Amount % of Total of Custs
250 $45.53 $32.51 $13.02 $40.96 $24.96 $16.00 -$4.57 -10.0% 15.6%
500 $89.56 $65.02 $24.54 $80.01 $49.92 $30.09 -$9.55 -10.7% 23.1%
1,000 $177.61 $130.04 $47.57 $158.11 $99.83 $58.28 -$19.50 -11.0% 49.2%
1,500 $265.67 $195.06 $70.61 $236.22 $149.75 $86.47 -$29.45 -11.1% 10.3%
2,000 $353.73 $260.08 $93.65 $314.33 $199.67 $114.66 -$39.40 -11.1% 1.8%
Present Rates: R-02 (Phase-out to C-06) Proposed Rates: R-02 (Phase-out to C-06)
Unmetered Charge $1.44 Unmetered Charge $1.83Transmission Energy Charge (1) kWh x $0.00800 Transmission Energy Charge (2) kWh x $0.01323Distribution Energy Charge kWh x $0.03071 Distribution Energy Charge kWh x $0.03624Transition Energy Charge kWh x $0.00322 Transition Energy Charge kWh x $0.00235C&LM Adjustment kWh x $0.00230 C&LM Adjustment kWh x $0.00230
Gross Earnings Tax 4.00% Gross Earnings Tax 4.00%
Standard Offer Charge (3) kWh x $0.12484 Standard Offer Charge (4) kWh x $0.09584
Note (1): Includes Transmission Adjustment Factor of $0.00541/kWhNote (2): Includes Proposed Transmission Adjustment Factor of $0.01064/kWhNote (3): Includes Standard Offer of $0.124/kWh and Renewable Energy Standard Charge of $0.00084/kWhNote (4): Includes Proposed Standard Offer of $0.095/kWh and Renewable Energy Standard Charge of $0.00084/kWh

National GridRIPUC Docket No. ____
Schedule JAL-17Page 8 of 25
File: R:\2008 neco\Annual Filing\[typbills.XLS]Input Section
Date: 13-Nov-08 Calculation of Monthly Typical Bill Time: 07:43 AM Comparison of Present and Proposed Rates
Impact on E-30 (Phase-out to A-16) Rate Customers
Present Rates Proposed Rates Increase/(Decrease)Monthly Standard Standard Percentage
kWh Total Offer Delivery Total Offer Delivery Amount % of Total of Custs
1,000 $178.44 $130.04 $48.40 $156.51 $99.83 $56.68 -$21.93 -12.3% 15.4%
2,500 $441.79 $325.10 $116.69 $386.98 $249.58 $137.40 -$54.81 -12.4% 15.4%
5,000 $880.73 $650.21 $230.52 $771.10 $499.17 $271.93 -$109.63 -12.4% 38.5%
10,000 $1,758.60 $1,300.42 $458.18 $1,539.32 $998.33 $540.99 -$219.28 -12.5% 0.0%
25,000 $4,392.19 $3,251.04 $1,141.15 $3,844.01 $2,495.83 $1,348.18 -$548.18 -12.5% 7.7%
50,000 $8,781.51 $6,502.08 $2,279.43 $7,685.16 $4,991.67 $2,693.49 -$1,096.35 -12.5% 23.1%
Present Rates: E-30 (Phase-out to A-16) Proposed Rates: E-30 (Phase-out to A-16)
Customer Charge $2.75 Customer Charge $2.75Transmission Energy Charge (1) kWh x $0.00802 Transmission Energy Charge (2) kWh x $0.01325Distribution Energy Charge kWh x $0.03017 Distribution Energy Charge kWh x $0.03376Transition Energy Charge kWh x $0.00322 Transition Energy Charge kWh x $0.00235C&LM Adjustment kWh x $0.00230 C&LM Adjustment kWh x $0.00230
Gross Earnings Tax 4.00% Gross Earnings Tax 4.00%
Standard Offer Charge (3) kWh x $0.12484 Standard Offer Charge (4) kWh x $0.09584
Note (1): Includes Transmission Adjustment Factor of $0.00541/kWhNote (2): Includes Proposed Transmission Adjustment Factor of $0.01064/kWhNote (3): Includes Standard Offer of $0.124/kWh and Renewable Energy Standard Charge of $0.00084/kWhNote (4): Includes Proposed Standard Offer of $0.095/kWh and Renewable Energy Standard Charge of $0.00084/kWh

National GridRIPUC Docket No. ____
Schedule JAL-17Page 9 of 25
File: R:\2008 neco\Annual Filing\[typbills.XLS]Input Section
Date: 13-Nov-08 Calculation of Monthly Typical Bill Time: 07:43 AM Comparison of Present and Proposed Rates
Impact on G-02 Rate Customers
Hours Use: 200
Monthly Power Present Rates Proposed Rates Increase/(Decrease) Standard Standard
kW kWh Total Offer Delivery Total Offer Delivery Amount % of Total
20 4,000 $753.93 $520.17 $233.76 $651.26 $399.33 $251.93 -$102.67 -13.6%
50 10,000 $1,795.43 $1,300.42 $495.01 $1,538.76 $998.33 $540.43 -$256.67 -14.3%
100 20,000 $3,531.26 $2,600.83 $930.43 $3,017.93 $1,996.67 $1,021.26 -$513.33 -14.5%
150 30,000 $5,267.09 $3,901.25 $1,365.84 $4,497.09 $2,995.00 $1,502.09 -$770.00 -14.6%
Present Rates: G-02 Proposed Rates: G-02
Customer Charge $103.41 Customer Charge $103.41Transmission Demand Charge-xcs 10 kW kW x $1.40 Transmission Demand Charge-xcs 10 kW kW x $1.40Transmission Adjustment Factor kWh x $0.00541 Transmission Adjustment Factor kWh x $0.01064Distribution Demand Charge-xcs 10 kW kW x $3.22 Distribution Demand Charge-xcs 10 kW kW x $3.22Distribution Energy Charge kWh x $0.00777 Distribution Energy Charge kWh x $0.00777Transition Energy Charge kWh x $0.00322 Transition Energy Charge kWh x $0.00235C&LM Adjustment kWh x $0.00230 C&LM Adjustment kWh x $0.00230
Gross Earnings Tax 4.00% Gross Earnings Tax 4.00%
Standard Offer Charge (3) kWh x $0.12484 Standard Offer Charge (4) kWh x $0.09584
Note (3): Includes Standard Offer of $0.124/kWh and Renewable Energy Standard Charge of $0.00084/kWhNote (4): Includes Proposed Standard Offer of $0.095/kWh and Renewable Energy Standard Charge of $0.00084/kWh

National GridRIPUC Docket No. ____
Schedule JAL-17Page 10 of 25
File: R:\2008 neco\Annual Filing\[typbills.XLS]Input Section
Date: 13-Nov-08 Calculation of Monthly Typical Bill Time: 07:43 AM Comparison of Present and Proposed Rates
Impact on G-02 Rate Customers
Hours Use: 300
Monthly Power Present Rates Proposed Rates Increase/(Decrease) Standard Standard
kW kWh Total Offer Delivery Total Offer Delivery Amount % of Total
20 6,000 $1,052.97 $780.25 $272.72 $898.97 $599.00 $299.97 -$154.00 -14.6%
50 15,000 $2,543.04 $1,950.63 $592.41 $2,158.03 $1,497.50 $660.53 -$385.01 -15.1%
100 30,000 $5,026.47 $3,901.25 $1,125.22 $4,256.47 $2,995.00 $1,261.47 -$770.00 -15.3%
150 45,000 $7,509.91 $5,851.88 $1,658.03 $6,354.91 $4,492.50 $1,862.41 -$1,155.00 -15.4%
Present Rates: G-02 Proposed Rates: G-02
Customer Charge $103.41 Customer Charge $103.41Transmission Demand Charge-xcs 10 kW kW x $1.40 Transmission Demand Charge-xcs 10 kW kW x $1.40Transmission Adjustment Factor kWh x $0.00541 Transmission Adjustment Factor kWh x $0.01064Distribution Demand Charge-xcs 10 kW kW x $3.22 Distribution Demand Charge-xcs 10 kW kW x $3.22Distribution Energy Charge kWh x $0.00777 Distribution Energy Charge kWh x $0.00777Transition Energy Charge kWh x $0.00322 Transition Energy Charge kWh x $0.00235C&LM Adjustment kWh x $0.00230 C&LM Adjustment kWh x $0.00230
Gross Earnings Tax 4.00% Gross Earnings Tax 4.00%
Standard Offer Charge (3) kWh x $0.12484 Standard Offer Charge (4) kWh x $0.09584
Note (3): Includes Standard Offer of $0.124/kWh and Renewable Energy Standard Charge of $0.00084/kWhNote (4): Includes Proposed Standard Offer of $0.095/kWh and Renewable Energy Standard Charge of $0.00084/kWh

National GridRIPUC Docket No. ____
Schedule JAL-17Page 11 of 25
File: R:\2008 neco\Annual Filing\[typbills.XLS]Input Section
Date: 13-Nov-08 Calculation of Monthly Typical Bill Time: 07:43 AM Comparison of Present and Proposed Rates
Impact on G-02 Rate Customers
Hours Use: 400
Monthly Power Present Rates Proposed Rates Increase/(Decrease) Standard Standard
kW kWh Total Offer Delivery Total Offer Delivery Amount % of Total
20 8,000 $1,352.01 $1,040.33 $311.68 $1,146.68 $798.67 $348.01 -$205.33 -15.2%
50 20,000 $3,290.63 $2,600.83 $689.80 $2,777.31 $1,996.67 $780.64 -$513.32 -15.6%
100 40,000 $6,521.68 $5,201.67 $1,320.01 $5,495.01 $3,993.33 $1,501.68 -$1,026.67 -15.7%
150 60,000 $9,752.72 $7,802.50 $1,950.22 $8,212.72 $5,990.00 $2,222.72 -$1,540.00 -15.8%
Present Rates: G-02 Proposed Rates: G-02
Customer Charge $103.41 Customer Charge $103.41Transmission Demand Charge-xcs 10 kW kW x $1.40 Transmission Demand Charge-xcs 10 kW kW x $1.40Transmission Adjustment Factor kWh x $0.00541 Transmission Adjustment Factor kWh x $0.01064Distribution Demand Charge-xcs 10 kW kW x $3.22 Distribution Demand Charge-xcs 10 kW kW x $3.22Distribution Energy Charge kWh x $0.00777 Distribution Energy Charge kWh x $0.00777Transition Energy Charge kWh x $0.00322 Transition Energy Charge kWh x $0.00235C&LM Adjustment kWh x $0.00230 C&LM Adjustment kWh x $0.00230
Gross Earnings Tax 4.00% Gross Earnings Tax 4.00%
Standard Offer Charge (3) kWh x $0.12484 Standard Offer Charge (4) kWh x $0.09584
Note (3): Includes Standard Offer of $0.124/kWh and Renewable Energy Standard Charge of $0.00084/kWhNote (4): Includes Proposed Standard Offer of $0.095/kWh and Renewable Energy Standard Charge of $0.00084/kWh

National GridRIPUC Docket No. ____
Schedule JAL-17Page 12 of 25
File: R:\2008 neco\Annual Filing\[typbills.XLS]Input Section
Date: 13-Nov-08 Calculation of Monthly Typical Bill Time: 07:43 AM Comparison of Present and Proposed Rates
Impact on G-02 Rate Customers
Hours Use: 500
Monthly Power Present Rates Proposed Rates Increase/(Decrease) Standard Standard
kW kWh Total Offer Delivery Total Offer Delivery Amount % of Total
20 10,000 $1,651.06 $1,300.42 $350.64 $1,394.38 $998.33 $396.05 -$256.68 -15.5%
50 25,000 $4,038.24 $3,251.04 $787.20 $3,396.57 $2,495.83 $900.74 -$641.67 -15.9%
100 50,000 $8,016.88 $6,502.08 $1,514.80 $6,733.56 $4,991.67 $1,741.89 -$1,283.32 -16.0%
150 75,000 $11,995.54 $9,753.13 $2,242.41 $10,070.53 $7,487.50 $2,583.03 -$1,925.01 -16.0%
Present Rates: G-02 Proposed Rates: G-02
Customer Charge $103.41 Customer Charge $103.41Transmission Demand Charge-xcs 10 kW kW x $1.40 Transmission Demand Charge-xcs 10 kW kW x $1.40Transmission Adjustment Factor kWh x $0.00541 Transmission Adjustment Factor kWh x $0.01064Distribution Demand Charge-xcs 10 kW kW x $3.22 Distribution Demand Charge-xcs 10 kW kW x $3.22Distribution Energy Charge kWh x $0.00777 Distribution Energy Charge kWh x $0.00777Transition Energy Charge kWh x $0.00322 Transition Energy Charge kWh x $0.00235C&LM Adjustment kWh x $0.00230 C&LM Adjustment kWh x $0.00230
Gross Earnings Tax 4.00% Gross Earnings Tax 4.00%
Standard Offer Charge (3) kWh x $0.12484 Standard Offer Charge (4) kWh x $0.09584
Note (3): Includes Standard Offer of $0.124/kWh and Renewable Energy Standard Charge of $0.00084/kWhNote (4): Includes Proposed Standard Offer of $0.095/kWh and Renewable Energy Standard Charge of $0.00084/kWh

National GridRIPUC Docket No. ____
Schedule JAL-17Page 13 of 25
File: R:\2008 neco\Annual Filing\[typbills.XLS]Input Section
Date: 13-Nov-08 Calculation of Monthly Typical Bill Time: 07:43 AM Comparison of Present and Proposed Rates
Impact on G-02 Rate Customers
Hours Use: 600
Monthly Power Present Rates Proposed Rates Increase/(Decrease) Standard Standard
kW kWh Total Offer Delivery Total Offer Delivery Amount % of Total
20 12,000 $1,950.09 $1,560.50 $389.59 $1,642.09 $1,198.00 $444.09 -$308.00 -15.8%
50 30,000 $4,785.84 $3,901.25 $884.59 $4,015.84 $2,995.00 $1,020.84 -$770.00 -16.1%
100 60,000 $9,512.09 $7,802.50 $1,709.59 $7,972.09 $5,990.00 $1,982.09 -$1,540.00 -16.2%
150 90,000 $14,238.34 $11,703.75 $2,534.59 $11,928.34 $8,985.00 $2,943.34 -$2,310.00 -16.2%
Present Rates: G-02 Proposed Rates: G-02
Customer Charge $103.41 Customer Charge $103.41Transmission Demand Charge-xcs 10 kW kW x $1.40 Transmission Demand Charge-xcs 10 kW kW x $1.40Transmission Adjustment Factor kWh x $0.00541 Transmission Adjustment Factor kWh x $0.01064Distribution Demand Charge-xcs 10 kW kW x $3.22 Distribution Demand Charge-xcs 10 kW kW x $3.22Distribution Energy Charge kWh x $0.00777 Distribution Energy Charge kWh x $0.00777Transition Energy Charge kWh x $0.00322 Transition Energy Charge kWh x $0.00235C&LM Adjustment kWh x $0.00230 C&LM Adjustment kWh x $0.00230
Gross Earnings Tax 4.00% Gross Earnings Tax 4.00%
Standard Offer Charge (3) kWh x $0.12484 Standard Offer Charge (4) kWh x $0.09584
Note (3): Includes Standard Offer of $0.124/kWh and Renewable Energy Standard Charge of $0.00084/kWhNote (4): Includes Proposed Standard Offer of $0.095/kWh and Renewable Energy Standard Charge of $0.00084/kWh

National GridRIPUC Docket No. ____
Schedule JAL-17Page 14 of 25
File: R:\2008 neco\Annual Filing\[typbills.XLS]Input Section
Date: 13-Nov-08 Calculation of Monthly Typical Bill Time: 07:43 AM Comparison of Present and Proposed Rates
Impact on G-32 Rate Customers
Hours Use: 200
Monthly Power Present Rates Proposed Rates Increase/(Decrease) Standard Standard
kW kWh Total Offer Delivery Total Offer Delivery Amount % of Total
200 40,000 $6,955.03 $5,201.67 $1,753.36 $5,926.28 $3,993.33 $1,932.95 -$1,028.75 -14.8%
750 150,000 $25,404.09 $19,506.25 $5,897.84 $21,546.28 $14,975.00 $6,571.28 -$3,857.81 -15.2%
1,000 200,000 $33,790.03 $26,008.33 $7,781.70 $28,646.28 $19,966.67 $8,679.61 -$5,143.75 -15.2%
1,500 300,000 $50,561.91 $39,012.50 $11,549.41 $42,846.28 $29,950.00 $12,896.28 -$7,715.63 -15.3%
2,500 500,000 $84,105.65 $65,020.83 $19,084.82 $71,246.28 $49,916.67 $21,329.61 -$12,859.37 -15.3%
Present Rates: G-32 Proposed Rates: G-32
Customer Charge $236.43 Customer Charge $236.43Transmission Demand Charge kW x $1.27 Transmission Demand Charge kW x $1.27Transmission Adjustment Factor kWh x $0.00541 Transmission Adjustment Factor kWh x $0.01064Distribution Demand Charge kW x $2.00 Distribution Demand Charge kW x $1.99Distribution Energy Charge kWh x $0.00889 Distribution Energy Charge kWh x $0.00889Transition Energy Charge kWh x $0.00322 Transition Energy Charge kWh x $0.00235C&LM Adjustment kWh x $0.00230 C&LM Adjustment kWh x $0.00230
Gross Earnings Tax 4% Gross Earnings Tax 4%
Standard Offer Charge (3) kWh x $0.12484 Standard Offer Charge (4) kWh x $0.09584
Note (3): Includes Standard Offer of $0.124/kWh and Renewable Energy Standard Charge of $0.00084/kWhNote (4): Includes Proposed Standard Offer of $0.095/kWh and Renewable Energy Standard Charge of $0.00084/kWh

National GridRIPUC Docket No. ____
Schedule JAL-17Page 15 of 25
File: R:\2008 neco\Annual Filing\[typbills.XLS]Input Section
Date: 13-Nov-08 Calculation of Monthly Typical Bill Time: 07:43 AM Comparison of Present and Proposed Rates
Impact on G-32 Rate Customers
Hours Use: 300
Monthly Power Present Rates Proposed Rates Increase/(Decrease) Standard Standard
kW kWh Total Offer Delivery Total Offer Delivery Amount % of Total
200 60,000 $9,968.78 $7,802.50 $2,166.28 $8,426.70 $5,990.00 $2,436.70 -$1,542.08 -15.5%
750 225,000 $36,705.66 $29,259.38 $7,446.28 $30,922.84 $22,462.50 $8,460.34 -$5,782.82 -15.8%
1,000 300,000 $48,858.78 $39,012.50 $9,846.28 $41,148.36 $29,950.00 $11,198.36 -$7,710.42 -15.8%
1,500 450,000 $73,165.03 $58,518.75 $14,646.28 $61,599.41 $44,925.00 $16,674.41 -$11,565.62 -15.8%
2,500 750,000 $121,777.53 $97,531.25 $24,246.28 $102,501.49 $74,875.00 $27,626.49 -$19,276.04 -15.8%
Present Rates: G-32 Proposed Rates: G-32
Customer Charge $236.43 Customer Charge $236.43Transmission Demand Charge kW x $1.27 Transmission Demand Charge kW x $1.27Transmission Adjustment Factor kWh x $0.00541 Transmission Adjustment Factor kWh x $0.01064Distribution Demand Charge kW x $2.00 Distribution Demand Charge kW x $1.99Distribution Energy Charge kWh x $0.00889 Distribution Energy Charge kWh x $0.00889Transition Energy Charge kWh x $0.00322 Transition Energy Charge kWh x $0.00235C&LM Adjustment kWh x $0.00230 C&LM Adjustment kWh x $0.00230
Gross Earnings Tax 4% Gross Earnings Tax 4%
Standard Offer Charge (3) kWh x $0.12484 Standard Offer Charge (4) kWh x $0.09584
Note (3): Includes Standard Offer of $0.124/kWh and Renewable Energy Standard Charge of $0.00084/kWhNote (4): Includes Proposed Standard Offer of $0.095/kWh and Renewable Energy Standard Charge of $0.00084/kWh

National GridRIPUC Docket No. ____
Schedule JAL-17Page 16 of 25
File: R:\2008 neco\Annual Filing\[typbills.XLS]Input Section
Date: 13-Nov-08 Calculation of Monthly Typical Bill Time: 07:43 AM Comparison of Present and Proposed Rates
Impact on G-32 Rate Customers
Hours Use: 400
Monthly Power Present Rates Proposed Rates Increase/(Decrease) Standard Standard
kW kWh Total Offer Delivery Total Offer Delivery Amount % of Total
200 80,000 $12,982.53 $10,403.33 $2,579.20 $10,927.12 $7,986.67 $2,940.45 -$2,055.41 -15.8%
750 300,000 $48,007.22 $39,012.50 $8,994.72 $40,299.41 $29,950.00 $10,349.41 -$7,707.81 -16.1%
1,000 400,000 $63,927.53 $52,016.67 $11,910.86 $53,650.44 $39,933.33 $13,717.11 -$10,277.09 -16.1%
1,500 600,000 $95,768.16 $78,025.00 $17,743.16 $80,352.53 $59,900.00 $20,452.53 -$15,415.63 -16.1%
2,500 1,000,000 $159,449.41 $130,041.67 $29,407.74 $133,756.69 $99,833.33 $33,923.36 -$25,692.72 -16.1%
Present Rates: G-32 Proposed Rates: G-32
Customer Charge $236.43 Customer Charge $236.43Transmission Demand Charge kW x $1.27 Transmission Demand Charge kW x $1.27Transmission Adjustment Factor kWh x $0.00541 Transmission Adjustment Factor kWh x $0.01064Distribution Demand Charge kW x $2.00 Distribution Demand Charge kW x $1.99Distribution Energy Charge kWh x $0.00889 Distribution Energy Charge kWh x $0.00889Transition Energy Charge kWh x $0.00322 Transition Energy Charge kWh x $0.00235C&LM Adjustment kWh x $0.00230 C&LM Adjustment kWh x $0.00230
Gross Earnings Tax 4% Gross Earnings Tax 4%
Standard Offer Charge (3) kWh x $0.12484 Standard Offer Charge (4) kWh x $0.09584
Note (3): Includes Standard Offer of $0.124/kWh and Renewable Energy Standard Charge of $0.00084/kWhNote (4): Includes Proposed Standard Offer of $0.095/kWh and Renewable Energy Standard Charge of $0.00084/kWh
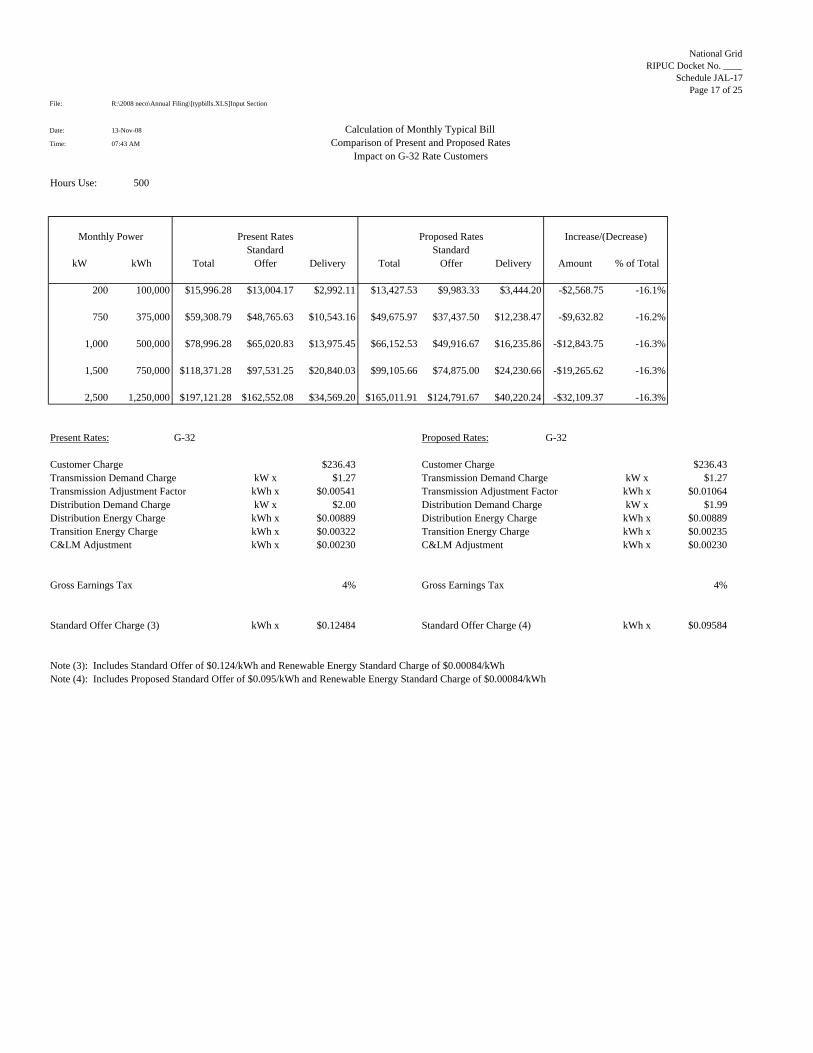
National GridRIPUC Docket No. ____
Schedule JAL-17Page 17 of 25
File: R:\2008 neco\Annual Filing\[typbills.XLS]Input Section
Date: 13-Nov-08 Calculation of Monthly Typical Bill Time: 07:43 AM Comparison of Present and Proposed Rates
Impact on G-32 Rate Customers
Hours Use: 500
Monthly Power Present Rates Proposed Rates Increase/(Decrease) Standard Standard
kW kWh Total Offer Delivery Total Offer Delivery Amount % of Total
200 100,000 $15,996.28 $13,004.17 $2,992.11 $13,427.53 $9,983.33 $3,444.20 -$2,568.75 -16.1%
750 375,000 $59,308.79 $48,765.63 $10,543.16 $49,675.97 $37,437.50 $12,238.47 -$9,632.82 -16.2%
1,000 500,000 $78,996.28 $65,020.83 $13,975.45 $66,152.53 $49,916.67 $16,235.86 -$12,843.75 -16.3%
1,500 750,000 $118,371.28 $97,531.25 $20,840.03 $99,105.66 $74,875.00 $24,230.66 -$19,265.62 -16.3%
2,500 1,250,000 $197,121.28 $162,552.08 $34,569.20 $165,011.91 $124,791.67 $40,220.24 -$32,109.37 -16.3%
Present Rates: G-32 Proposed Rates: G-32
Customer Charge $236.43 Customer Charge $236.43Transmission Demand Charge kW x $1.27 Transmission Demand Charge kW x $1.27Transmission Adjustment Factor kWh x $0.00541 Transmission Adjustment Factor kWh x $0.01064Distribution Demand Charge kW x $2.00 Distribution Demand Charge kW x $1.99Distribution Energy Charge kWh x $0.00889 Distribution Energy Charge kWh x $0.00889Transition Energy Charge kWh x $0.00322 Transition Energy Charge kWh x $0.00235C&LM Adjustment kWh x $0.00230 C&LM Adjustment kWh x $0.00230
Gross Earnings Tax 4% Gross Earnings Tax 4%
Standard Offer Charge (3) kWh x $0.12484 Standard Offer Charge (4) kWh x $0.09584
Note (3): Includes Standard Offer of $0.124/kWh and Renewable Energy Standard Charge of $0.00084/kWhNote (4): Includes Proposed Standard Offer of $0.095/kWh and Renewable Energy Standard Charge of $0.00084/kWh

National GridRIPUC Docket No. ____
Schedule JAL-17Page 18 of 25
File: R:\2008 neco\Annual Filing\[typbills.XLS]Input Section
Date: 13-Nov-08 Calculation of Monthly Typical Bill Time: 07:43 AM Comparison of Present and Proposed Rates
Impact on G-32 Rate Customers
Hours Use: 600
Monthly Power Present Rates Proposed Rates Increase/(Decrease) Standard Standard
kW kWh Total Offer Delivery Total Offer Delivery Amount % of Total
200 120,000 $19,010.03 $15,605.00 $3,405.03 $15,927.95 $11,980.00 $3,947.95 -$3,082.08 -16.2%
750 450,000 $70,610.34 $58,518.75 $12,091.59 $59,052.53 $44,925.00 $14,127.53 -$11,557.81 -16.4%
1,000 600,000 $94,065.03 $78,025.00 $16,040.03 $78,654.61 $59,900.00 $18,754.61 -$15,410.42 -16.4%
1,500 900,000 $140,974.41 $117,037.50 $23,936.91 $117,858.78 $89,850.00 $28,008.78 -$23,115.63 -16.4%
2,500 1,500,000 $234,793.16 $195,062.50 $39,730.66 $196,267.11 $149,750.00 $46,517.11 -$38,526.05 -16.4%
Present Rates: G-32 Proposed Rates: G-32
Customer Charge $236.43 Customer Charge $236.43Transmission Demand Charge kW x $1.27 Transmission Demand Charge kW x $1.27Transmission Adjustment Factor kWh x $0.00541 Transmission Adjustment Factor kWh x $0.01064Distribution Demand Charge kW x $2.00 Distribution Demand Charge kW x $1.99Distribution Energy Charge kWh x $0.00889 Distribution Energy Charge kWh x $0.00889Transition Energy Charge kWh x $0.00322 Transition Energy Charge kWh x $0.00235C&LM Adjustment kWh x $0.00230 C&LM Adjustment kWh x $0.00230
Gross Earnings Tax 4% Gross Earnings Tax 4%
Standard Offer Charge (3) kWh x $0.12484 Standard Offer Charge (4) kWh x $0.09584
Note (3): Includes Standard Offer of $0.124/kWh and Renewable Energy Standard Charge of $0.00084/kWhNote (4): Includes Proposed Standard Offer of $0.095/kWh and Renewable Energy Standard Charge of $0.00084/kWh

National GridRIPUC Docket No. ____
Schedule JAL-17Page 19 of 25
File: R:\2008 neco\Annual Filing\[typbills.XLS]Input Section
Date: 13-Nov-08 Calculation of Monthly Typical Bill Time: 07:43 AM Comparison of Present and Proposed Rates
Impact on G-62 Rate Customers
Hours Use: 200
Monthly Present Rates Proposed Rates Increase/(Decrease) Power Standard Standard
kW kWh Total Offer Delivery Total Offer Delivery Amount % of Total
3,000 600,000 $114,032.00 $78,025.00 $36,007.00 $98,569.50 $59,900.00 $38,669.50 -$15,462.50 -13.6%
5,000 1,000,000 $178,165.34 $130,041.67 $48,123.67 $152,394.50 $99,833.33 $52,561.17 -$25,770.84 -14.5%
7,500 1,500,000 $258,332.00 $195,062.50 $63,269.50 $219,675.75 $149,750.00 $69,925.75 -$38,656.25 -15.0%
10,000 2,000,000 $338,498.66 $260,083.33 $78,415.33 $286,957.00 $199,666.67 $87,290.33 -$51,541.66 -15.2%
20,000 4,000,000 $659,165.34 $520,166.67 $138,998.67 $556,082.00 $399,333.33 $156,748.67 -$103,083.34 -15.6%
Present Rates: G-62 Proposed Rates: G-62
Customer Charge $17,118.72 Customer Charge $17,118.72Transmission Demand Charge kW x $1.39 Transmission Demand Charge kW x $1.39Transmission Adjustment Factor kWh x $0.00541 Transmission Adjustment Factor kWh x $0.01064Distribution Demand Charge kW x $2.24 Distribution Demand Charge kW x $2.22Distribution Energy Charge kWh x $0.00000 Distribution Energy Charge kWh x $0.00000Transition Energy Charge kWh x $0.00322 Transition Energy Charge kWh x $0.00235C&LM Adjustment kWh x $0.00230 C&LM Adjustment kWh x $0.00230
Gross Earnings Tax 4% Gross Earnings Tax 4%
Standard Offer Charge (3) kWh x $0.12484 Standard Offer Charge (4) kWh x $0.09584
Note (3): Includes Standard Offer of $0.124/kWh and Renewable Energy Standard Charge of $0.00084/kWhNote (4): Includes Proposed Standard Offer of $0.095/kWh and Renewable Energy Standard Charge of $0.00084/kWh

National GridRIPUC Docket No. ____
Schedule JAL-17Page 20 of 25
File: R:\2008 neco\Annual Filing\[typbills.XLS]Input Section
Date: 13-Nov-08 Calculation of Monthly Typical Bill Time: 07:43 AM Comparison of Present and Proposed Rates
Impact on G-62 Rate Customers
Hours Use: 300
Monthly Present Rates Proposed Rates Increase/(Decrease) Power Standard Standard
kW kWh Total Offer Delivery Total Offer Delivery Amount % of Total
3,000 900,000 $156,460.13 $117,037.50 $39,422.63 $133,297.63 $89,850.00 $43,447.63 -$23,162.50 -14.8%
5,000 1,500,000 $248,878.88 $195,062.50 $53,816.38 $210,274.71 $149,750.00 $60,524.71 -$38,604.17 -15.5%
7,500 2,250,000 $364,402.31 $292,593.75 $71,808.56 $306,496.06 $224,625.00 $81,871.06 -$57,906.25 -15.9%
10,000 3,000,000 $479,925.75 $390,125.00 $89,800.75 $402,717.42 $299,500.00 $103,217.42 -$77,208.33 -16.1%
20,000 6,000,000 $942,019.50 $780,250.00 $161,769.50 $787,602.83 $599,000.00 $188,602.83 -$154,416.67 -16.4%
Present Rates: G-62 Proposed Rates: G-62
Customer Charge $17,118.72 Customer Charge $17,118.72Transmission Demand Charge kW x $1.39 Transmission Demand Charge kW x $1.39Transmission Adjustment Factor kWh x $0.00541 Transmission Adjustment Factor kWh x $0.01064Distribution Demand Charge kW x $2.24 Distribution Demand Charge kW x $2.22Distribution Energy Charge kWh x $0.00000 Distribution Energy Charge kWh x $0.00000Transition Energy Charge kWh x $0.00322 Transition Energy Charge kWh x $0.00235C&LM Adjustment kWh x $0.00230 C&LM Adjustment kWh x $0.00230
Gross Earnings Tax 4% Gross Earnings Tax 4%
Standard Offer Charge (3) kWh x $0.12484 Standard Offer Charge (4) kWh x $0.09584
Note (3): Includes Standard Offer of $0.124/kWh and Renewable Energy Standard Charge of $0.00084/kWhNote (4): Includes Proposed Standard Offer of $0.095/kWh and Renewable Energy Standard Charge of $0.00084/kWh

National GridRIPUC Docket No. ____
Schedule JAL-17Page 21 of 25
File: R:\2008 neco\Annual Filing\[typbills.XLS]Input Section
Date: 13-Nov-08 Calculation of Monthly Typical Bill Time: 07:43 AM Comparison of Present and Proposed Rates
Impact on G-62 Rate Customers
Hours Use: 400
Monthly Present Rates Proposed Rates Increase/(Decrease) Power Standard Standard
kW kWh Total Offer Delivery Total Offer Delivery Amount % of Total
3,000 1,200,000 $198,888.25 $156,050.00 $42,838.25 $168,025.75 $119,800.00 $48,225.75 -$30,862.50 -15.5%
5,000 2,000,000 $319,592.41 $260,083.33 $59,509.08 $268,154.92 $199,666.67 $68,488.25 -$51,437.49 -16.1%
7,500 3,000,000 $470,472.63 $390,125.00 $80,347.63 $393,316.38 $299,500.00 $93,816.38 -$77,156.25 -16.4%
10,000 4,000,000 $621,352.84 $520,166.67 $101,186.17 $518,477.83 $399,333.33 $119,144.50 -$102,875.01 -16.6%
20,000 8,000,000 $1,224,873.66 $1,040,333.33 $184,540.33 $1,019,123.67 $798,666.67 $220,457.00 -$205,749.99 -16.8%
Present Rates: G-62 Proposed Rates: G-62
Customer Charge $17,118.72 Customer Charge $17,118.72Transmission Demand Charge kW x $1.39 Transmission Demand Charge kW x $1.39Transmission Adjustment Factor kWh x $0.00541 Transmission Adjustment Factor kWh x $0.01064Distribution Demand Charge kW x $2.24 Distribution Demand Charge kW x $2.22Distribution Energy Charge kWh x $0.00000 Distribution Energy Charge kWh x $0.00000Transition Energy Charge kWh x $0.00322 Transition Energy Charge kWh x $0.00235C&LM Adjustment kWh x $0.00230 C&LM Adjustment kWh x $0.00230
Gross Earnings Tax 4% Gross Earnings Tax 4%
Standard Offer Charge (3) kWh x $0.12484 Standard Offer Charge (4) kWh x $0.09584
Note (3): Includes Standard Offer of $0.124/kWh and Renewable Energy Standard Charge of $0.00084/kWhNote (4): Includes Proposed Standard Offer of $0.095/kWh and Renewable Energy Standard Charge of $0.00084/kWh

National GridRIPUC Docket No. ____
Schedule JAL-17Page 22 of 25
File: R:\2008 neco\Annual Filing\[typbills.XLS]Input Section
Date: 13-Nov-08 Calculation of Monthly Typical Bill Time: 07:43 AM Comparison of Present and Proposed Rates
Impact on G-62 Rate Customers
Hours Use: 500
Monthly Present Rates Proposed Rates Increase/(Decrease) Power Standard Standard
kW kWh Total Offer Delivery Total Offer Delivery Amount % of Total
3,000 1,500,000 $241,316.38 $195,062.50 $46,253.88 $202,753.88 $149,750.00 $53,003.88 -$38,562.50 -16.0%
5,000 2,500,000 $390,305.96 $325,104.17 $65,201.79 $326,035.12 $249,583.33 $76,451.79 -$64,270.84 -16.5%
7,500 3,750,000 $576,542.94 $487,656.25 $88,886.69 $480,136.69 $374,375.00 $105,761.69 -$96,406.25 -16.7%
10,000 5,000,000 $762,779.91 $650,208.33 $112,571.58 $634,238.25 $499,166.67 $135,071.58 -$128,541.66 -16.9%
20,000 10,000,000 $1,507,727.84 $1,300,416.67 $207,311.17 $1,250,644.50 $998,333.33 $252,311.17 -$257,083.34 -17.1%
Present Rates: G-62 Proposed Rates: G-62
Customer Charge $17,118.72 Customer Charge $17,118.72Transmission Demand Charge kW x $1.39 Transmission Demand Charge kW x $1.39Transmission Adjustment Factor kWh x $0.00541 Transmission Adjustment Factor kWh x $0.01064Distribution Demand Charge kW x $2.24 Distribution Demand Charge kW x $2.22Distribution Energy Charge kWh x $0.00000 Distribution Energy Charge kWh x $0.00000Transition Energy Charge kWh x $0.00322 Transition Energy Charge kWh x $0.00235C&LM Adjustment kWh x $0.00230 C&LM Adjustment kWh x $0.00230
Gross Earnings Tax 4% Gross Earnings Tax 4%
Standard Offer Charge (3) kWh x $0.12484 Standard Offer Charge (4) kWh x $0.09584
Note (3): Includes Standard Offer of $0.124/kWh and Renewable Energy Standard Charge of $0.00084/kWhNote (4): Includes Proposed Standard Offer of $0.095/kWh and Renewable Energy Standard Charge of $0.00084/kWh

National GridRIPUC Docket No. ____
Schedule JAL-17Page 23 of 25
File: R:\2008 neco\Annual Filing\[typbills.XLS]Input Section
Date: 13-Nov-08 Calculation of Monthly Typical Bill Time: 07:43 AM Comparison of Present and Proposed Rates
Impact on G-62 Rate Customers
Hours Use: 600
Monthly Present Rates Proposed Rates Increase/(Decrease) Power Standard Standard
kW kWh Total Offer Delivery Total Offer Delivery Amount % of Total
3,000 1,800,000 $283,744.50 $234,075.00 $49,669.50 $237,482.00 $179,700.00 $57,782.00 -$46,262.50 -16.3%
5,000 3,000,000 $461,019.50 $390,125.00 $70,894.50 $383,915.33 $299,500.00 $84,415.33 -$77,104.17 -16.7%
7,500 4,500,000 $682,613.25 $585,187.50 $97,425.75 $566,957.00 $449,250.00 $117,707.00 -$115,656.25 -16.9%
10,000 6,000,000 $904,207.00 $780,250.00 $123,957.00 $749,998.67 $599,000.00 $150,998.67 -$154,208.33 -17.1%
20,000 12,000,000 $1,790,582.00 $1,560,500.00 $230,082.00 $1,482,165.33 $1,198,000.00 $284,165.33 -$308,416.67 -17.2%
Present Rates: G-62 Proposed Rates: G-62
Customer Charge $17,118.72 Customer Charge $17,118.72Transmission Demand Charge kW x $1.39 Transmission Demand Charge kW x $1.39Transmission Adjustment Factor kWh x $0.00541 Transmission Adjustment Factor kWh x $0.01064Distribution Demand Charge kW x $2.24 Distribution Demand Charge kW x $2.22Distribution Energy Charge kWh x $0.00000 Distribution Energy Charge kWh x $0.00000Transition Energy Charge kWh x $0.00322 Transition Energy Charge kWh x $0.00235C&LM Adjustment kWh x $0.00230 C&LM Adjustment kWh x $0.00230
Gross Earnings Tax 4% Gross Earnings Tax 4%
Standard Offer Charge (3) kWh x $0.12484 Standard Offer Charge (4) kWh x $0.09584
Note (3): Includes Standard Offer of $0.124/kWh and Renewable Energy Standard Charge of $0.00084/kWhNote (4): Includes Proposed Standard Offer of $0.095/kWh and Renewable Energy Standard Charge of $0.00084/kWh

National GridRIPUC Docket No. ____
Schedule JAL-17Page 24 of 25
File: R:\2008 neco\Annual Filing\[typbills.XLS]Input Section
Date: 13-Nov-08 Calculation of Monthly Typical Bill Time: 07:43 AM Comparison of Present and Proposed Rates
Impact on T-06 (Phase-out to A-16) Rate Customers
Present Rates Proposed Rates Increase/(Decrease)Monthly Standard Standard Percentage
kWh Total Offer Delivery Total Offer Delivery Amount % of Total of Custs
500 $91.86 $65.02 $26.84 $80.21 $49.92 $30.29 -$11.65 -12.7% 3.0%
1,000 $180.86 $130.04 $50.82 $157.55 $99.83 $57.72 -$23.31 -12.9% 24.7%
2,000 $358.86 $260.08 $98.78 $312.24 $199.67 $112.57 -$46.62 -13.0% 13.9%
5,000 $892.87 $650.21 $242.66 $776.31 $499.17 $277.14 -$116.56 -13.1% 14.9%
10,000 $1,782.87 $1,300.42 $482.45 $1,549.74 $998.33 $551.41 -$233.13 -13.1% 7.2%
20,000 $3,562.86 $2,600.83 $962.03 $3,096.62 $1,996.67 $1,099.95 -$466.24 -13.1% 8.8%
Present Rates: T-06 (Phase-out to A-16) Proposed Rates: T-06 (Phase-out to A-16)
Customer Charge $2.75 Customer Charge $2.75Transmission Energy Charge (1) kWh x $0.00902 Transmission Energy Charge (2) kWh x $0.01425Distribution Energy Charge kWh x $0.03150 Distribution Energy Charge kWh x $0.03376Transition Energy Charge kWh x $0.00322 Transition Energy Charge kWh x $0.00235C&LM Adjustment kWh x $0.00230 C&LM Adjustment kWh x $0.00230
Gross Earnings Tax 4.00% Gross Earnings Tax 4.00%
Standard Offer Charge (3) kWh x $0.12484 Standard Offer Charge (4) kWh x $0.09584
Note (1): Includes Transmission Adjustment Factor of $0.00541/kWhNote (2): Includes Proposed Transmission Adjustment Factor of $0.01064/kWhNote (3): Includes Standard Offer of $0.124/kWh and Renewable Energy Standard Charge of $0.00084/kWhNote (4): Includes Proposed Standard Offer of $0.095/kWh and Renewable Energy Standard Charge of $0.00084/kWh
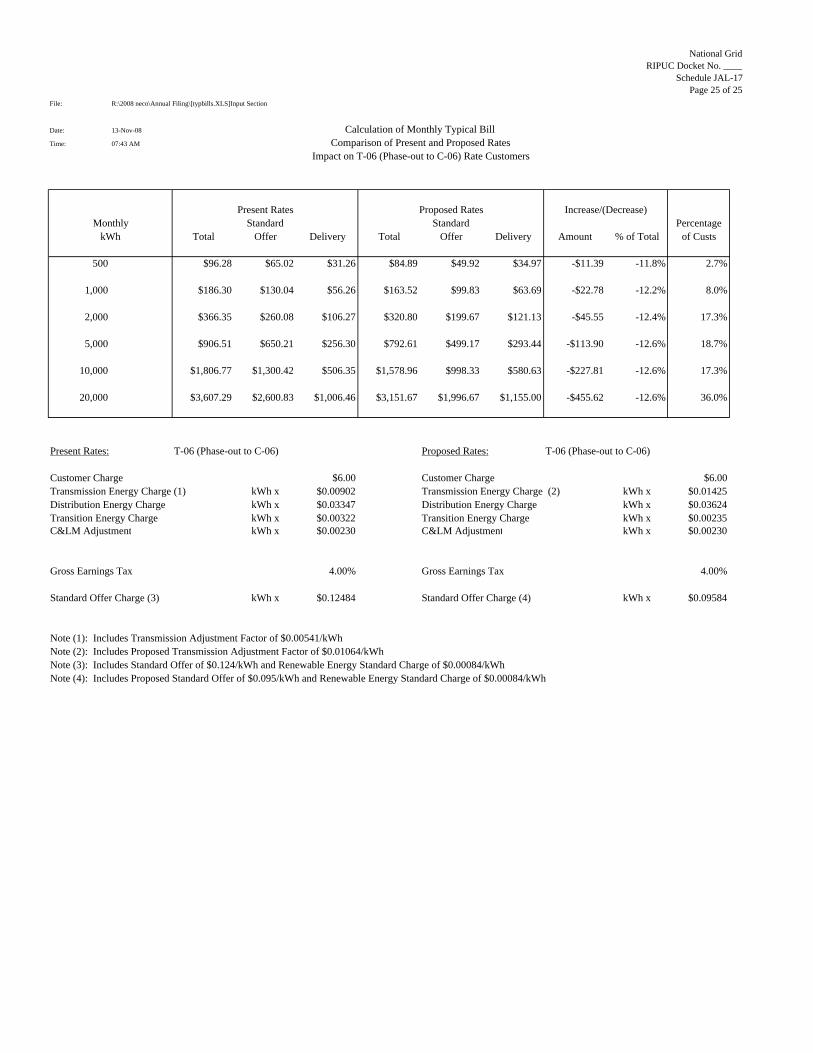
National GridRIPUC Docket No. ____
Schedule JAL-17Page 25 of 25
File: R:\2008 neco\Annual Filing\[typbills.XLS]Input Section
Date: 13-Nov-08 Calculation of Monthly Typical Bill Time: 07:43 AM Comparison of Present and Proposed Rates
Impact on T-06 (Phase-out to C-06) Rate Customers
Present Rates Proposed Rates Increase/(Decrease)Monthly Standard Standard Percentage
kWh Total Offer Delivery Total Offer Delivery Amount % of Total of Custs
500 $96.28 $65.02 $31.26 $84.89 $49.92 $34.97 -$11.39 -11.8% 2.7%
1,000 $186.30 $130.04 $56.26 $163.52 $99.83 $63.69 -$22.78 -12.2% 8.0%
2,000 $366.35 $260.08 $106.27 $320.80 $199.67 $121.13 -$45.55 -12.4% 17.3%
5,000 $906.51 $650.21 $256.30 $792.61 $499.17 $293.44 -$113.90 -12.6% 18.7%
10,000 $1,806.77 $1,300.42 $506.35 $1,578.96 $998.33 $580.63 -$227.81 -12.6% 17.3%
20,000 $3,607.29 $2,600.83 $1,006.46 $3,151.67 $1,996.67 $1,155.00 -$455.62 -12.6% 36.0%
Present Rates: T-06 (Phase-out to C-06) Proposed Rates: T-06 (Phase-out to C-06)
Customer Charge $6.00 Customer Charge $6.00Transmission Energy Charge (1) kWh x $0.00902 Transmission Energy Charge (2) kWh x $0.01425Distribution Energy Charge kWh x $0.03347 Distribution Energy Charge kWh x $0.03624Transition Energy Charge kWh x $0.00322 Transition Energy Charge kWh x $0.00235C&LM Adjustment kWh x $0.00230 C&LM Adjustment kWh x $0.00230
Gross Earnings Tax 4.00% Gross Earnings Tax 4.00%
Standard Offer Charge (3) kWh x $0.12484 Standard Offer Charge (4) kWh x $0.09584
Note (1): Includes Transmission Adjustment Factor of $0.00541/kWhNote (2): Includes Proposed Transmission Adjustment Factor of $0.01064/kWhNote (3): Includes Standard Offer of $0.124/kWh and Renewable Energy Standard Charge of $0.00084/kWhNote (4): Includes Proposed Standard Offer of $0.095/kWh and Renewable Energy Standard Charge of $0.00084/kWh

Testimony of
John D
. Warshaw

NATIONAL GRID R.I.P.U.C. DOCKET NO. ____
JANUARY 2009 ELECTRIC RETAIL RATE FILING WITNESS: JOHN D. WARSHAW
DIRECT TESTIMONY
OF
JOHN D. WARSHAW

NATIONAL GRID R.I.P.U.C. DOCKET NO. ____
JANUARY 2009 ELECTRIC RETAIL RATE FILING WITNESS: JOHN D. WARSHAW
Table of Contents
I. Introduction and Qualifications ...........................................................................................1 II. Purpose of Testimony ..........................................................................................................2 III. Description of Standard Offer Supply Costs .......................................................................2
IV. Fuel Index Estimate for the Period January 2009 through December 2009........................4 V. Conclusion ...........................................................................................................................6

NATIONAL GRID R.I.P.U.C. DOCKET NO. ____
JANUARY 2009 ELECTRIC RETAIL RATE FILING WITNESS: JOHN D. WARSHAW
Page 1 of 6
R:\2008 neco\Annual Filing\JDWTestimony-2009.doc
I. Introduction and Qualifications 1
Q. Please state your name and business address. 2
A. My name is John D. Warshaw, and my business address is 55 Bearfoot Road, 3
Northborough, Massachusetts 01532. 4
5
Q. Please state your position. 6
A. I am a Principal Analyst in Regulated Electric Load and Distributed Generation for 7
National Grid USA Service Company, Inc. I conduct power procurement and energy 8
supply related activities for National Grid’ s New England operating companies, 9
including The Narragansett Electric Company (“Company”). These activities include the 10
procurement of power for Standard Offer Service and Last Resort Service. 11
12
Q. Will you describe your educational background and training? 13
A. I graduated from the State University of New York Maritime College in 1977 with a 14
Bachelor of Science in Nuclear Science. I received a Masters in Business Administration 15
from Northeastern University in 1986. In 1992, I earned a Masters of Arts in Energy and 16
Environmental Management from Boston University. 17
18
Q. What is your professional background? 19
A. In May 2000, I joined the National Grid USA Service Company as a Principal Analyst in 20
Energy Supply – New England. In my position I have conducted a number of 21
solicitations for wholesale power to meet the needs of National Grid USA’s New 22

NATIONAL GRID R.I.P.U.C. DOCKET NO. ____
JANUARY 2009 ELECTRIC RETAIL RATE FILING WITNESS: JOHN D. WARSHAW
Page 2 of 6
R:\2008 neco\Annual Filing\JDWTestimony-2009.doc
England distribution companies. I also administer both short-term and long-term power 1
purchase agreements for National Grid USA’s New England distribution companies. 2
Prior to my employment at National Grid USA, I was employed at COM/Energy (now 3
NSTAR) from 1992 to 2000. From 1992 to 1997, I was a Rate Analyst in Regulatory 4
Affairs at COM/Energy responsible for supporting state and federal rate filings. In 1997, 5
I transferred to COM/Electric to work in Power Supply Administration. 6
7
Q. Have you previously testified before the Rhode Island Public Utilities Commission 8
(“Commission”)? 9
A. Yes. 10
11
II. Purpose of Testimony 12
Q. What is the purpose of your testimony? 13
A. The purpose of my testimony is to provide an estimate of the costs the Company expects 14
to incur under its Standard Offer supply contracts for the period January 2009 through 15
December 2009. 16
17
III. Description of Standard Offer Supply Costs 18
Q. What are the Company’s current arrangements for procurement of Standard Offer 19
Service? 20
A. The Company has contracts with three suppliers to serve the load within its pre-merger 21
service territory (“Narragansett Zone”). The Company also has four contracts with 22

NATIONAL GRID R.I.P.U.C. DOCKET NO. ____
JANUARY 2009 ELECTRIC RETAIL RATE FILING WITNESS: JOHN D. WARSHAW
Page 3 of 6
R:\2008 neco\Annual Filing\JDWTestimony-2009.doc
suppliers to serve the load within the service territory of the former Blackstone Valley 1
Electric Company and Newport Electric Corporation (“EUA Zone”). All of the 2
Company’s contracts run through December 31, 2009. 3
4
Q. Please describe the costs that the Company incurs under the Standard Offer supply 5
contracts. 6
A. The Standard Offer supply contracts include two basic price components – a base price 7
and, for some contracts, a fuel index adjustment provision. 8
9
Q. What is the base price in effect for calendar year 2008 and calendar year 2009? 10
A. The base price for calendar year 2008 is 6.7¢/kWh. The base price for calendar year 11
2009 is 7.1¢/kWh. 12
13
Q. Can you describe the fuel index adjustment provision that is contained in the Standard 14
Offer contracts? 15
A. Yes. Some of the Company’s contracts with its Standard Offer suppliers contain a fuel 16
index adjustment provision that provides additional payments to those suppliers in the 17
event of substantial increases in the market price of No. 6 residual fuel oil (1% sulphur) 18
and natural gas. In short, the provision compares the sum of the twelve-month rolling 19
average of oil and natural gas prices to a preset trigger point. If the sum of the fuel index 20
values exceeds the trigger point in a given month then the Company makes additional 21
payments to the suppliers in that month. If the sum of the fuel index values is less than or 22

NATIONAL GRID R.I.P.U.C. DOCKET NO. ____
JANUARY 2009 ELECTRIC RETAIL RATE FILING WITNESS: JOHN D. WARSHAW
Page 4 of 6
R:\2008 neco\Annual Filing\JDWTestimony-2009.doc
equal to the trigger point in a given month, no additional payments are made in that 1
month. Comparisons are made each month and thus payments may be made in some 2
months and not in others. The text of the fuel index adjustment provision that is 3
applicable to the Standard Offer contracts in the Narragansett Zone is provided as 4
Schedule JDW-1. 5
6
IV. Fuel Index Estimate for the Period January 2009 through December 2009 7
Q. Has the Company conducted an estimate of expected costs under the fuel index 8
adjustment provisions for the period January 2009 through December 2009? 9
A. Yes. The Company has estimated its expected costs under the fuel index adjustment 10
provisions using average natural gas and crude oil futures prices as reported in The Wall 11
Street Journal on November 7, November 10, 2008, and November 11, 2008. 12
13
Q. What natural gas and oil prices were used in the current estimate? 14
A. Schedule JDW-2 provides the natural gas and oil values used in the analysis. 15
16
Q. What are the resulting fuel index trigger payments? 17
A. Schedule JDW-3 provides the resulting fuel index adjustment payments from the 18
analysis. The analysis shows that the Company would pay an arithmetic average fuel 19
index adjustment payment for the period January 2009 through December 2009 of 20
2.973¢/kWh for the Narragansett Zone load which corresponds to an arithmetic average 21

NATIONAL GRID R.I.P.U.C. DOCKET NO. ____
JANUARY 2009 ELECTRIC RETAIL RATE FILING WITNESS: JOHN D. WARSHAW
Page 5 of 6
R:\2008 neco\Annual Filing\JDWTestimony-2009.doc
of 2.200¢/kWh applicable to both zones. The fuel index adjustment is not applicable for 1
the EUA Zone load in this period. 2
3
Q. How do these costs compare to current market costs for power? 4
A. The Company’s market cost proxy for comparable service is the cost it incurs to procure 5
its Last Resort Service requirements in Rhode Island or the cost its affiliates incur to 6
procure their Default Service requirements in Massachusetts. In September 2008, the 7
Company procured Last Resort Service for the period November 2008 through April 8
2009 at an arithmetic average rate of 10.568 ¢/kWh for its residential customers and 9
10.475 ¢/kWh for its commercial and industrial customers. 10
11
Also in September 2008, the Company’s affiliate in Massachusetts procured its Default 12
Service requirements for the period November 2008 through April 2009 at an arithmetic 13
average rate of 11.357 ¢/kWh for residential customers and 11.228 ¢/kWh for small 14
commercial customers. For large commercial and industrial customers in Massachusetts, 15
the Company procured Default Service requirements for the period November 2008 16
through January 2009 at an arithmetic average rate of 12.377 ¢/kWh for the SEMA zone, 17
11.157 ¢/kWh for the NEMA zone and 10.515 ¢/kWh for the WCMA zone. These 18
prices do not include the cost of meeting any Renewable Portfolio Standards in 19
Massachusetts or Rhode Island. 20
21
Q. Can you provide the details of the current fuel index adjustment provision calculations? 22

NATIONAL GRID R.I.P.U.C. DOCKET NO. ____
JANUARY 2009 ELECTRIC RETAIL RATE FILING WITNESS: JOHN D. WARSHAW
Page 6 of 6
R:\2008 neco\Annual Filing\JDWTestimony-2009.doc
A. Yes. Detailed calculations are provided in Schedule JDW-4. 1
2
V. Conclusion 3
Q. Does this conclude your testimony? 4
A. Yes, it does. 5

Schedules of
John D
. Warshaw

NATIONAL GRID R.I.P.U.C. DOCKET NO. ____
JANUARY 2009 ELECTRIC RETAIL RATE FILING WITNESS: JOHN D. WARSHAW
Schedules
Schedule JDW-1 Standard Offer Fuel Index Adjustment Provision for Narragansett Zone Contracts
Schedule JDW-2 Gas and Oil Values Used in Company’s Analysis October 27,
2008, October 28, 2008 and October 29, 2008 Schedule JDW-3 Summary of Additional Payments Estimated to be Made Pursuant
to the Fuel Index Adjustment Provisions Based on October 27-29, 2008 Fuel Costs
Schedule JDW-4 Determination of Market Gas Price

Schedule JDW
-1

NATIONAL GRID R.I.P.U.C. DOCKET NO. ____
JANUARY 2009 ELECTRIC RETAIL RATE FILING WITNESS: JOHN D. WARSHAW
Schedule JDW-1
Standard Offer Fuel Index Adjustment Provision for Narragansett Zone Contracts

NATIONAL GRID R.I.P.U.C. DOCKET NO. ____
Schedule JDW-1 Page 1 of 3
S:\RADATA1\2008 neco\Annual Filing\JDWTestimony-2009.doc
Standard Offer Fuel Index Adjustment Provision For Narragansett Zone Contracts
In the event of substantial increases in the market prices of No. 6 residual fuel oil (1%
sulphur) and natural gas after 1999, NECO will pay additional amounts to Seller in accordance with this Standard Offer Fuel Index Adjustment Provision, which is calculated as follows:
The Stipulated Price that is in effect for a given billing month is multiplied by a “Fuel Index Adjustment” that is set equal to 1.0 and thus has no impact on the rate paid unless the “Market Gas Price” plus “Market Oil Price” for the billing month exceeds the “Fuel Trigger Point” then in effect, where:
The Stipulated Price is the following predetermined, flat rate, for energy consumed at the customer meter point:
Calendar Year Price per Kilowatt hour
1998 3.2 cents 1999 3.5 cents 2000 3.8 cents 2001 3.8 cents 2002 4.2 cents 2003 4.7 cents 2004 5.1 cents 2005 5.5 cents 2006 5.9 cents 2007 6.3 cents 2008 6.7 cents 2009 7.1 cents
Seller will be paid the difference between the Stipulated Price as adjusted in accordance with this Standard Offer Fuel Adjustment Provision and the Stipulated Price for each kilowatt-hour it provides in the applicable month.
Market Gas Price is the average of the values of “Gas Index” for the most recent available twelve months where:
Gas Index is the average of the daily settlement prices for the last three days that the NYMEX Contract (as defined below) for the month of delivery trades as reported in “The Wall Street Journal,” expressed in dollars per MMBtu. NYMEX Contract shall mean the New York Mercantile Exchange Natural Gas Futures Contract as approved by the Commodity Futures Trading Commission for the purchase and sale of natural gas at Henry Hub;

NATIONAL GRID R.I.P.U.C. DOCKET NO. ____
Schedule JDW-1 Page 2 of 3
S:\RADATA1\2008 neco\Annual Filing\JDWTestimony-2009.doc
Market Oil Price is the average of the values of “Oil Index” for the most recent available twelve months where:
Oil Index is the average for the month of the daily low quotations for cargo delivery of 1.0% sulphur No. 6 residual fuel oil into New York harbor, as reported in “Platt’s Oilgram U.S. Marketscan” in dollars per barrel and converted to dollars per MMBtu by dividing by 6.3; and
If the indices referred to above should become obsolete or no longer suitable, NECO
shall file alternate indices with the RIPUC.
Fuel Trigger Point is the following amounts, expressed in dollars per MMBtu, applicable for all months in the specified calendar year: 2000 $5.35/MMBtu 2001 $5.35 2002 $6.09 2003 $7.01 2004 $7.74 2005 * $8.48 2006 * $9.22 2007 * $9.95 2008 * $10.69 2009 * $11.42 * For Narragansett Zone only

NATIONAL GRID R.I.P.U.C. DOCKET NO. ____
Schedule JDW-1 Page 3 of 3
S:\RADATA1\2008 neco\Annual Filing\JDWTestimony-2009.doc
In the event that the Fuel Trigger Point is exceeded, the Fuel Adjustment value for the
billing month is determined based according to the following formula:
Fuel = (Market Gas Price +$.60/MMBtu)+(Market Oil Price +$.04/MMBtu) Adjustment Fuel Trigger Point+$.60+$.04/MMBtu
Where:
Market Gas Price, Market Oil Price and Fuel Trigger Point are as defined above. The values of $.60 and $.04/MMBtu represent for gas and oil respectively, estimated basis differentials or market costs of transportation from the point where the index is calculated to a proxy power plant in the New England market.
For example if at a point in the year 2002 the Market Gas Price and Market Oil Price
total $6.50 ($3.50/MMBtu plus $3.00/MMBtu respectively), the Fuel Trigger Point of 6.09 would be exceeded. In this case the Fuel Adjustment value would be:
($3.50+$.60/MMBtu)+($3.00+$.04/MMBtu) = 1.0609 $6.09+$.60+$.04/MMBtu
The Stipulated Price is increased by this Fuel Adjustment factor for the billing month, becoming 4.4548�/kWh (4.2 x 1.0609).
In subsequent months the same comparisons are made and, if applicable, a Fuel Adjustment determined.

Schedule JDW
-2

NATIONAL GRID R.I.P.U.C. DOCKET NO. ____
JANUARY 2009 ELECTRIC RETAIL RATE FILING WITNESS: JOHN D. WARSHAW
Schedule JDW-2
Gas and Oil Values Used in Company’s Analysis
November 7, 2008, November 10, 2008 and November 11, 2008

National Grid R.I.P.U.C. Docket No. ____
Schedule JDW-2 Page 1 of 1
S:\RADATA1\2008 neco\Annual Filing\JDWTestimony-2009.doc
Gas and Oil Values Used in Company’s Analysis
November 7, 2008, November 10, 2008 and November 11, 2008 ($/mmBtu)
Month Gas Index Oil Index Jan-09 7.079 5.99 Feb-09 7.132 6.08 Mar-09 7.092 6.17 Apr-09 7.035 6.26 May-09 7.087 6.34 Jun-09 7.201 6.46 Jul-09 7.328 6.50
Aug-09 7.411 6.58 Sep-09 7.443 6.65 Oct-09 7.523 6.72 Nov-09 7.853 6.80 Dec-09 8.225 6.87

Schedule JDW
-3

NATIONAL GRID R.I.P.U.C. DOCKET NO. ____
JANUARY 2009 ELECTRIC RETAIL RATE FILING WITNESS: JOHN D. WARSHAW
Schedule JDW-3
Summary of Additional Payments Estimated to be Made Pursuant
to the Fuel Index Adjustment Provisions Based on November 7-11, 2008 Fuel Costs

National Grid R.I.P.U.C. Docket No. ____
Schedule JDW-3 Page 1 of 1
S:\RADATA1\2008 neco\Annual Filing\JDWTestimony-2009.doc
Summary of Additional Payments Estimated to be
Made Pursuant to the Fuel Index Adjustment Provisions Based on November 7-11, 2008 Fuel Costs
(Cents/kWh)
Month Narragansett Zone
EUA Zone
Jan-09 5.426 n/a Feb-09 5.131 n/a Mar-09 4.770 n/a Apr-09 4.330 n/a May-09 3.751 n/a Jun-09 3.035 n/a Jul-09 2.225 n/a
Aug-09 1.715 n/a Sep-09 1.359 n/a Oct-09 1.225 n/a Nov-09 1.300 n/a Dec-09 1.412 n/a

Schedule JD
W-4

NATIONAL GRID R.I.P.U.C. DOCKET NO. ____
JANUARY 2009 ELECTRIC RETAIL RATE FILING WITNESS: JOHN D. WARSHAW
Schedule JDW-4
Determination of Market Gas Price

National GridR.I.P.U.C. No. ____
Schedule JDW-4Page 1 of 3
Prices published in WSJ on: 07-Nov-08 10-Nov-08 11-Nov-08
DETERMINATION OF MARKET GAS PRICE
(Col. A) (Col. B) (Col. C) (Col. D) (Col. E) (Col. F) (Col. G) (Col. H) (Col. I)
Last NGrid's EUA's SOS
Contract Month Settlement Prices ($/mmBtu) Gas Market Market Delivery
Month of Trading 3rd Last 2nd Last Last Index Gas Price Gas Price Month
Jan-06 Dec-05 $12.283 $11.022 $11.431 $11.579 $8.989 n/a Jan-06Feb-06 Jan-06 $8.460 $8.229 $8.400 $8.363 $9.156 n/a Feb-06Mar-06 Feb-06 $7.283 $7.458 $7.112 $7.284 $9.243 n/a Mar-06Apr-06 Mar-06 $7.067 $7.214 $7.233 $7.171 $9.246 n/a Apr-06May-06 Apr-06 $7.558 $7.254 $7.198 $7.337 $9.274 n/a May-06Jun-06 May-06 $5.964 $5.975 $5.925 $5.955 $9.248 n/a Jun-06Jul-06 Jun-06 $5.969 $6.107 $5.887 $5.988 $9.151 n/a Jul-06
Aug-06 Jul-06 $6.409 $6.887 $7.042 $6.779 $9.095 n/a Aug-06Sep-06 Aug-06 $7.157 $6.472 $6.816 $6.815 $8.818 n/a Sep-06Oct-06 Sep-06 $4.475 $4.526 $4.201 $4.401 $8.101 n/a Oct-06
Nov-06 Oct-06 $7.693 $7.497 $7.153 $7.448 $7.549 n/a Nov-06Dec-06 Nov-06 $7.718 $7.998 $8.318 $8.011 $7.261 n/a Dec-06Jan-07 Dec-06 $6.635 $6.113 $5.838 $6.195 $6.812 n/a Jan-07Feb-07 Jan-07 $6.905 $7.175 $6.917 $6.999 $6.699 n/a Feb-07Mar-07 Feb-07 $7.727 $7.755 $7.547 $7.676 $6.731 n/a Mar-07Apr-07 Mar-07 $7.254 $7.503 $7.558 $7.438 $6.754 n/a Apr-07May-07 Apr-07 $7.598 $7.689 $7.508 $7.598 $6.775 n/a May-07Jun-07 May-07 $7.681 $7.640 $7.591 $7.637 $6.916 n/a Jun-07Jul-07 Jun-07 $6.940 $6.877 $6.929 $6.915 $6.993 n/a Jul-07
Aug-07 Jul-07 $5.925 $5.943 $6.110 $5.993 $6.927 n/a Aug-07Sep-07 Aug-07 $5.380 $5.593 $5.430 $5.468 $6.815 n/a Sep-07Oct-07 Sep-07 $6.370 $6.360 $6.423 $6.384 $6.980 n/a Oct-07
Nov-07 Oct-07 $7.188 $7.218 $7.269 $7.225 $6.962 n/a Nov-07Dec-07 Nov-07 $7.723 $7.557 $7.203 $7.494 $6.919 n/a Dec-07Jan-08 Dec-07 $7.025 $7.046 $7.172 $7.081 $6.992 n/a Jan-08Feb-08 Jan-08 $7.983 $8.095 $7.996 $8.025 $7.078 n/a Feb-08Mar-08 Feb-08 $9.186 $9.206 $8.930 $9.107 $7.197 n/a Mar-08Apr-08 Mar-08 $9.419 $9.572 $9.578 $9.523 $7.371 n/a Apr-08May-08 Apr-08 $10.790 $10.963 $11.280 $11.011 $7.655 n/a May-08Jun-08 May-08 $11.857 $11.801 $11.916 $11.858 $8.007 n/a Jun-08Jul-08 Jun-08 $13.011 $12.753 $13.105 $12.956 $8.510 n/a Jul-08
Aug-08 Jul-08 $9.084 $9.163 $9.217 $9.155 $8.774 n/a Aug-08Sep-08 Aug-08 $7.825 $8.278 $8.394 $8.166 $8.999 n/a Sep-08Oct-08 Sep-08 $7.679 $7.724 $7.472 $7.625 $9.102 n/a Oct-08
Nov-08 Oct-08 $6.121 $6.186 $6.469 $6.259 $9.022 n/a Nov-08Dec-08 Nov-08 $6.757 $7.248 $6.705 $6.903 $8.972 n/a Dec-08Jan-09 Dec-08 $6.968 $7.419 $6.851 $7.079 $8.972 n/a Jan-09Feb-09 Jan-09 $7.020 $7.459 $6.916 $7.132 $8.898 n/a Feb-09Mar-09 Feb-09 $6.992 $7.399 $6.886 $7.092 $8.730 n/a Mar-09Apr-09 Mar-09 $6.962 $7.307 $6.836 $7.035 $8.523 n/a Apr-09May-09 Apr-09 $7.027 $7.342 $6.891 $7.087 $8.196 n/a May-09Jun-09 May-09 $7.150 $7.450 $7.004 $7.201 $7.808 n/a Jun-09Jul-09 Jun-09 $7.285 $7.570 $7.129 $7.328 $7.338 n/a Jul-09
Aug-09 Jul-09 $7.370 $7.650 $7.214 $7.411 $7.193 n/a Aug-09Sep-09 Aug-09 $7.402 $7.682 $7.246 $7.443 $7.133 n/a Sep-09Oct-09 Sep-09 $7.482 $7.762 $7.326 $7.523 $7.125 n/a Oct-09
Nov-09 Oct-09 $7.822 $8.082 $7.656 $7.853 $7.257 n/a Nov-09Dec-09 Nov-09 $8.202 $8.442 $8.031 $8.225 $7.368 n/a Dec-09
Notes:Col. A - Contract refers to the NYMEX Natural Gas Futures Contract, as approved by the CFTC,
for the purchase and sale of natural gas at Henry Hub.Col. B - Month that trading for the Contract ends (the month before the delivery month)Col. C - Settlement price for the third last trading day as reported in the Wall Street Journal. (Jan-99 - Dec-08) - Settlement price as reported in the Wall Street Journal on 11-07-08 (Jan-09 - Dec-09)Col. D - Settlement price for the second last trading day as reported in the Wall Street Journal. (Jan-99 - Dec-08) - Settlement price as reported in the Wall Street Journal on 11-10-08 (Jan-09 - Dec-09)Col. E - Settlement price for the last trading day as reported in the Wall Street Journal. (Jan-99 - Dec-08) - Settlement price as reported in the Wall Street Journal on 11-11-08 (Jan-09 - Dec-09)Col. F - Average value of Col. C, Col. D and Col. E (=AVERAGE(Col. C..Col. E))Col. G - Average of the most recent twelve months of values in Col. F (including current SOS delivery month)Col. H - Average of the most recent six months of values in Col. F (ending month prior to SOS delivery month)Col. I - month in which SOS was delivered at wholesale.

National GridR.I.P.U.C. No. ____
Schedule JDW-4Page 2 of 3
DETERMINATION OF MARKET OIL PRICE
(Col. A) (Col. B) (Col. HH) (Col. II) (Col. JJ) (Col. KK) (Col. LL) (Col. MM) (Col. NN) (Col. OO) (Col. PP) (Col. QQ)SOS NGrid's EUA's
Delivery Trading Sum of # of Conversion Oil Index Market Market Prices published in Wall Street Journal on:Month Month Values Values Factor ($/mmBtu) Oil Price Oil Price Average 07-Nov-08 10-Nov-08 11-Nov-08
Jan-06 Jan-06 948.15 20 6.3 7.525 6.797 n/a 57.9800 57.98 57.98 57.98 <=Jan closing from WSJ on 12/20/05Feb-06 Feb-06 911.50 19 6.3 7.615 7.025 n/a 68.3500 68.35 68.35 68.35 <=Feb closing from WSJ on 01/20/06Mar-06 Mar-06 1086.62 23 6.3 7.499 7.181 n/a 61.1000 61.10 61.10 61.10 <=Mar closing from WSJ on 02/21/06Apr-06 Apr-06 967.73 19 6.3 8.085 7.343 n/a 60.5700 60.57 60.57 60.57 <=Apr closing from WSJ on 03/21/06
May-06 May-06 1081.50 22 6.3 7.803 7.494 n/a 71.9500 71.95 71.95 71.95 <=May closing from WSJ on 04/20/06Jun-06 Jun-06 1060.25 22 6.3 7.650 7.591 n/a 69.2300 69.23 69.23 69.23 <=June closing from WSJ on 05/22/06Jul-06 Jul-06 923.40 19 6.3 7.714 7.675 n/a 70.3300 70.33 70.33 70.33 <=July closing from WSJ on 06/20/06
Aug-06 Aug-06 1155.05 23 6.3 7.971 7.736 n/a 73.0800 73.08 73.08 73.08 <=Aug closing from WSJ on 07/20/06Sep-06 Sep-06 796.22 20 6.3 6.319 7.592 n/a 72.6300 72.63 72.63 72.63 <=Sep closing from WSJ on 08/22/06Oct-06 Oct-06 863.40 22 6.3 6.229 7.451 n/a 60.4600 60.46 60.46 60.46 <=Oct closing from WSJ on 09/20/06
Nov-06 Nov-06 847.60 20 6.3 6.727 7.404 n/a 56.8200 56.82 56.82 56.82 <=Nov closing from WSJ on 10/20/06Dec-06 Dec-06 799.00 20 6.3 6.341 7.290 n/a 55.8100 55.81 55.81 55.81 <=Dec closing from WSJ on 11/17/06Jan-07 Jan-07 743.10 20 6.3 5.898 7.154 n/a 63.1500 63.15 63.15 63.15 <=Jan closing from WSJ on 12/19/06Feb-07 Feb-07 759.45 19 6.3 6.345 7.048 n/a 51.1300 51.13 51.13 51.13 <=Feb closing from WSJ on 01/22/07Mar-07 Mar-07 935.70 22 6.3 6.751 6.986 n/a 58.0700 58.07 58.07 58.07 <=Mar closing from WSJ on 02/20/07Apr-07 Apr-07 941.55 20 6.3 7.473 6.935 n/a 56.7300 56.73 56.73 56.73 <=April 2007 closing from WSJ on 03/20/07
May-07 May-07 1151.60 22 6.3 8.309 6.977 n/a 63.3800 63.38 63.38 63.38 <=May 2007 closing from WSJ on 04/20/07Jun-07 Jun-07 1132.60 21 6.3 8.561 7.053 n/a 64.9700 64.97 64.97 64.97 <=June 2007 closing from WSJ on 05/22/07Jul-07 Jul-07 1197.55 21 6.3 9.052 7.165 n/a 68.1900 68.19 68.19 68.19 <=July 2007 closing from WSJ on 06/20/07
Aug-07 Aug-07 1249.15 23 6.3 8.621 7.219 n/a 75.5700 75.57 75.57 75.57 <=August 2007 closing from WSJ on 07/20/07Sep-07 Sep-07 1092.55 19 6.3 9.127 7.453 n/a 69.4700 69.47 69.47 69.47 <=September 2007 closing from WSJ on 08/21/07Oct-07 Oct-07 1427.75 23 6.3 9.853 7.755 n/a 83.3200 83.32 83.32 83.32 <=October 2007 closing from WSJ on 09/21/07
Nov-07 Nov-07 1502.60 21 6.3 11.358 8.141 n/a 87.5600 87.56 87.56 87.56 <=November 2007 closing from WSJ on 10/22/07Dec-07 Dec-07 1303.50 18 6.3 11.495 8.570 n/a 95.1000 95.10 95.10 95.10 <=December 2007 closing from WSJ on 11/16/07Jan-08 Jan-08 1560.10 21 6.3 11.792 9.061 n/a 90.4900 90.49 90.49 90.49 <=January 2008 closing from WSJ on 12/18/07Feb-08 Feb-08 1410.80 20 6.3 11.197 9.466 n/a 89.850 89.85 89.85 89.85 <=February 2008 closing from WSJ on 01/22/08Mar-08 Mar-08 1450.45 20 6.3 11.512 9.862 n/a 100.740 100.74 100.74 100.74 <=March 2008 closing from WSJ on 02/20/08Apr-08 Apr-08 1764.65 22 6.3 12.732 10.301 n/a 104.480 104.48 104.48 104.48 <=April 2008 closing from WSJ on 03/19/08
May-08 May-08 1881.60 21 6.3 14.222 10.793 n/a 119.370 119.37 119.37 119.37 <=May 2008 closing from WSJ on 04/22/08Jun-08 Jun-08 2169.45 21 6.3 16.398 11.447 n/a 129.070 129.07 129.07 129.07 <=June 2008 closing from WSJ on 05/20/08Jul-08 Jul-08 2409.00 22 6.3 17.381 12.141 n/a 134.620 134.62 134.62 134.62 <=July 2008 closing from WSJ on 06/20/08
Aug-08 Aug-08 2013.25 21 6.3 15.217 12.690 n/a 127.950 127.95 127.95 127.95 <=Aug 2008 closing from WSJ on 07/22/08Sep-08 Sep-08 1744.10 21 6.3 13.183 13.028 n/a 114.980 114.98 114.98 114.98 <=Sep 2008 closing from WSJ on 08/20/08Oct-08 Oct-08 1355.85 23 6.3 9.357 12.987 n/a 120.920 120.92 120.92 120.92 <=Oct 2008 closing from WSJ on 09/22/08
Nov-08 Nov-08 302.95 7 6.3 6.870 12.613 n/a 70.860 70.86 70.86 70.86 <=Nov 2008 closing from WSJ on 10/21/08Dec-08 Dec-08 60.93 6.3 5.91 12.147 n/a 60.927 61.04 62.41 59.33Jan-09 Jan-09 61.79 6.3 5.99 11.664 n/a 61.787 61.87 63.27 60.22Feb-09 Feb-09 62.71 6.3 6.08 11.237 n/a 62.707 62.81 64.19 61.12Mar-09 Mar-09 63.63 6.3 6.17 10.792 n/a 63.633 63.76 65.09 62.05Apr-09 Apr-09 64.53 6.3 6.26 10.252 n/a 64.530 64.69 65.95 62.95
May-09 May-09 65.41 6.3 6.34 9.596 n/a 65.413 65.61 66.79 63.84Jun-09 Jun-09 66.58 6.3 6.46 8.767 n/a 66.583 66.49 68.57 64.69Jul-09 Jul-09 67.05 6.3 6.50 7.860 n/a 67.053 67.33 68.32 65.51
Aug-09 Aug-09 67.83 6.3 6.58 7.140 n/a 67.833 68.16 69.06 66.28Sep-09 Sep-09 68.60 6.3 6.65 6.596 n/a 68.603 68.99 69.80 67.02Oct-09 Oct-09 69.36 6.3 6.72 6.377 n/a 69.360 69.80 70.53 67.75
Nov-09 Nov-09 70.11 6.3 6.80 6.370 n/a 70.107 70.59 71.25 68.48Dec-09 Dec-09 70.84 6.3 6.87 6.451 n/a 70.840 71.36 71.96 69.20
Notes:Col. A - month in which SOS was delivered at wholesale.Col. B - month in which oil prices were quoted and delivered.Col. C - Col. GG - daily prices as quoted by Platt's MarketScan. (not shown)Col. HH - sum of values in Col. C through Col. GG. (Jan-99 - Nov-08) -Nov-08 Final Crude oil contract price as reported in the Wall Street Journal on 10/21/08 - average of Crude oil contract prices as reported in the Wall Street Journal on Col. II - number of non-zero values in Col. C through Col. GG.Col. JJ - a fixed factor of 6.3 mmBtu per bbl.Col. KK - Col. HH divided by (Col. II x Col. JJ) (Jan-99 - Nov-08)' - Current month value Col. HH * Nov-08 value in Col KK/70.86 (Nov-08 - Dec-09) - Where 70.86 represents the closing value from the WSJ on 10/21/08Col. LL - Average of the most recent twelve months of values in Col. KK (including current SOS delivery month)Col. MM - Average of the most recent six months of values in Col. KK (ending month prior to SOS delivery month)

National GridR.I.P.U.C. No. ____
Schedule JDW-4Page 3 of 3
(Col. A) (Col. B) (Col. C) (Col. D) (Col. E) (Col. F) (Col. G) (Col. H) (Col. I) (Col. J) (Col. K) (Col. L) (Col. M) (Col. N)SOS NGrid's NGrid's NGrid's NGrid's NGrid's EUA's EUA's EUA's EUA's EUA's Ngrid EUA Weighted
Delivery Market Gas Market Oil Fuel Fuel Adjustment Market Gas Market Oil Fuel Fuel Adjustment Adjustment Adjustment AdjustmentJan-06 $8.98864 $6.79699 $15.7856 $9.22 1.66589 n/a n/a n/a $9.22 n/a 3.929 n/a 2.907Feb-06 $9.15558 $7.02450 $16.1801 $9.22 1.70589 n/a n/a n/a $9.22 n/a 4.165 n/a 3.082Mar-06 $9.24267 $7.18060 $16.4233 $9.22 1.73055 n/a n/a n/a $9.22 n/a 4.310 n/a 3.190Apr-06 $9.24628 $7.34323 $16.5895 $9.22 1.74742 n/a n/a n/a $9.22 n/a 4.410 n/a 3.263
May-06 $9.27375 $7.49446 $16.7682 $9.22 1.76554 n/a n/a n/a $9.22 n/a 4.517 n/a 3.342Jun-06 $9.24811 $7.59066 $16.8388 $9.22 1.77270 n/a n/a n/a $9.22 n/a 4.559 n/a 3.374Jul-06 $9.15058 $7.67509 $16.8257 $9.22 1.77137 n/a n/a n/a $9.22 n/a 4.551 n/a 3.368
Aug-06 $9.09453 $7.73645 $16.8310 $9.22 1.77190 n/a n/a n/a $9.22 n/a 4.554 n/a 3.370Sep-06 $8.81775 $7.59239 $16.4101 $9.22 1.72922 n/a n/a n/a $9.22 n/a 4.302 n/a 3.184Oct-06 $8.10106 $7.45117 $15.5522 $9.22 1.64221 n/a n/a n/a $9.22 n/a 3.789 n/a 2.804
Nov-06 $7.54919 $7.40395 $14.9531 $9.22 1.58145 n/a n/a n/a $9.22 n/a 3.431 n/a 2.539Dec-06 $7.26086 $7.28991 $14.5508 $9.22 1.54065 n/a n/a n/a $9.22 n/a 3.190 n/a 2.360Jan-07 $6.81225 $7.15429 $13.9665 $9.95 1.37928 n/a n/a n/a $9.95 n/a 2.389 n/a 1.768Feb-07 $6.69858 $7.04844 $13.7470 $9.95 1.35855 n/a n/a n/a $9.95 n/a 2.259 n/a 1.672Mar-07 $6.73125 $6.98610 $13.7174 $9.95 1.35575 n/a n/a n/a $9.95 n/a 2.241 n/a 1.658Apr-07 $6.75350 $6.93510 $13.6886 $9.95 1.35303 n/a n/a n/a $9.95 n/a 2.224 n/a 1.646
May-07 $6.77531 $6.97725 $13.7526 $9.95 1.35907 n/a n/a n/a $9.95 n/a 2.262 n/a 1.674Jun-07 $6.91553 $7.05318 $13.9687 $9.95 1.37948 n/a n/a n/a $9.95 n/a 2.391 n/a 1.769Jul-07 $6.99283 $7.16463 $14.1575 $9.95 1.39731 n/a n/a n/a $9.95 n/a 2.503 n/a 1.852
Aug-07 $6.92728 $7.21875 $14.1460 $9.95 1.39623 n/a n/a n/a $9.95 n/a 2.496 n/a 1.847Sep-07 $6.81500 $7.45277 $14.2678 $9.95 1.40772 n/a n/a n/a $9.95 n/a 2.569 n/a 1.901Oct-07 $6.98031 $7.75476 $14.7351 $9.95 1.45185 n/a n/a n/a $9.95 n/a 2.847 n/a 2.107
Nov-07 $6.96175 $8.14064 $15.1024 $9.95 1.48653 n/a n/a n/a $9.95 n/a 3.065 n/a 2.268Dec-07 $6.91867 $8.57009 $15.4888 $9.95 1.52302 n/a n/a n/a $9.95 n/a 3.295 n/a 2.438Jan-08 $6.99247 $9.06130 $16.0538 $10.69 1.47341 n/a n/a n/a $10.69 n/a 3.172 n/a 2.347Feb-08 $7.07794 $9.46565 $16.5436 $10.69 1.51665 n/a n/a n/a $10.69 n/a 3.462 n/a 2.562Mar-08 $7.19719 $9.86236 $17.0596 $10.69 1.56218 n/a n/a n/a $10.69 n/a 3.767 n/a 2.787Apr-08 $7.37092 $10.30063 $17.6716 $10.69 1.61620 n/a n/a n/a $10.69 n/a 4.129 n/a 3.055
May-08 $7.65531 $10.79342 $18.4487 $10.69 1.68479 n/a n/a n/a $10.69 n/a 4.588 n/a 3.395Jun-08 $8.00703 $11.44651 $19.4535 $10.69 1.77348 n/a n/a n/a $10.69 n/a 5.182 n/a 3.835Jul-08 $8.51044 $12.14061 $20.6511 $10.69 1.87918 n/a n/a n/a $10.69 n/a 5.890 n/a 4.359
Aug-08 $8.77394 $12.69032 $21.4643 $10.69 1.95095 n/a n/a n/a $10.69 n/a 6.371 n/a 4.715Sep-08 $8.99878 $13.02828 $22.0271 $10.69 2.00062 n/a n/a n/a $10.69 n/a 6.704 n/a 4.961Oct-08 $9.10217 $12.98693 $22.0891 $10.69 2.00610 n/a n/a n/a $10.69 n/a 6.741 n/a 4.988
Nov-08 $9.02164 $12.61294 $21.6346 $10.69 1.96598 n/a n/a n/a $10.69 n/a 6.472 n/a 4.789Dec-08 $8.97239 $12.14726 $21.1197 $10.69 1.92053 n/a n/a n/a $10.69 n/a 6.168 n/a 4.564Jan-09 $8.97225 $11.66375 $20.6360 $11.42 1.76418 n/a n/a n/a $11.42 n/a 5.426 n/a 4.015Feb-09 $8.89783 $11.23728 $20.1351 $11.42 1.72265 n/a n/a n/a $11.42 n/a 5.131 n/a 3.797Mar-09 $8.72992 $10.79207 $19.5220 $11.42 1.67181 n/a n/a n/a $11.42 n/a 4.770 n/a 3.530Apr-09 $8.52258 $10.25241 $18.7750 $11.42 1.60987 n/a n/a n/a $11.42 n/a 4.330 n/a 3.204
May-09 $8.19556 $9.59568 $17.7912 $11.42 1.52830 n/a n/a n/a $11.42 n/a 3.751 n/a 2.776Jun-09 $7.80750 $8.76711 $16.5746 $11.42 1.42741 n/a n/a n/a $11.42 n/a 3.035 n/a 2.246Jul-09 $7.33847 $7.86041 $15.1989 $11.42 1.31334 n/a n/a n/a $11.42 n/a 2.225 n/a 1.646
Aug-09 $7.19319 $7.14031 $14.3335 $11.42 1.24158 n/a n/a n/a $11.42 n/a 1.715 n/a 1.269Sep-09 $7.13300 $6.59597 $13.7290 $11.42 1.19146 n/a n/a n/a $11.42 n/a 1.359 n/a 1.006Oct-09 $7.12453 $6.37656 $13.5011 $11.42 1.17256 n/a n/a n/a $11.42 n/a 1.225 n/a 0.907
Nov-09 $7.25742 $6.37048 $13.6279 $11.42 1.18308 n/a n/a n/a $11.42 n/a 1.300 n/a 0.962Dec-09 $7.36756 $6.45056 $13.8181 $11.42 1.19885 n/a n/a n/a $11.42 n/a 1.412 n/a 1.045
Notes:Col. A - month in which SOS was delivered at wholesaleCol. B - Average of the values of Gas Index for the most recent 12 months. (Col. G - Determination of Market Gas Price)Col. C - Average of the values of Oil Index for the most recent 12 months. (Col. LL - Determination of Market Oil Price)Col. D - Col. B + Col. CCol. E - Applicable value from the Standard Offer Supply Contracts.Col. F - @if(Col. D > Col. E, (Col. B + $0.60 + Col. C +$0.04) / (Col. E +$0.64), 1.000)Col. G - Average of the values of Gas Index for the most recent 6 months. (Col. H - Determination of Market Gas Price)Col. H - Average of the values of Oil Index for the most recent 6 months. (Col. I - Determination of Market Oil Price)Col. I - Col. G + Col. HCol. J - Applicable value from the Standard Offer Supply Contracts.Col. K - @if(Col. I > Col. J, (Col. G + $0.60 + Col. H +$0.04) / (Col. J +$0.64), 1.000)Col. L - (Col. F - 1.0)* Applicable Contract Price from the Standard Offer Supply Contracts.Col. M - (Col. K - 1.0) * Applicable Contract Price from the Standard Offer Supply Contracts.
DETERMINATION OF FUEL ADJUSTMENT VALUE

Testimony of
Pam
ela A. V
iapiano

NATIONAL GRID R.I.P.U.C. DOCKET NO. ____
JANUARY 2009 ELECTRIC RETAIL RATE FILING WITNESS: PAMELA A. VIAPIANO
DDIIRREECCTT TTEESSTTIIMMOONNYY
OOFF
PPAAMMEELLAA AA.. VVIIAAPPIIAANNOO

NATIONAL GRID R.I.P.U.C. DOCKET NO. ____
JANUARY 2009 ELECTRIC RETAIL RATE FILING WITNESS: PAMELA A. VIAPIANO
Table of Contents
Testimony I. Introduction and Qualifications…………………………………….. Page 1 II. Purpose of Testimony………………………………………………. Page 2 III. Summary of Transmission Services Provided to Narragansett……..
Page 3
A. Explanation of ISO/RTO Tariff Services, Rates & Charges
Page 4
B. Explanation of Schedule 21 Tariff Services & Charges Page 10 IV. Estimate of Narragansett’s Transmission Expenses………………... Page 11 V. Explanation of Primary Changes from Last Year’s Forecasted
Expenses.............................................................................................. Page 16

NATIONAL GRID R.I.P.U.C. DOCKET NO. ____
JANUARY 2009 ELECTRIC RETAIL RATE FILING WITNESS: PAMELA A. VIAPIANO
Page 1 OF 20 I. Introduction and Qualifications 1
Q. Please state your name and business address. 2
A. My name is Pamela A. Viapiano. My business address is 25 Research Drive, 3
Westborough, Massachusetts 01582 4
Q. By whom are you employed and in what capacity? 5
A. Effective October 1, 2007, I was named Vice President of Transmission Finance 6
for National Grid USA Service Company, Inc. (“Service Co”). Service Co is a 7
subsidiary of National Grid USA, which in turn is a subsidiary of National Grid 8
plc, a London-based international energy company. In my current position I have 9
overall responsibility for financial reporting and wholesale billing and 10
administration and development of transmission tariffs and rates for National Grid 11
plc’s transmission business in the United States which includes New England 12
Power (“NEP”) in New England and Niagara Mohawk Power Corporation in New 13
York. The U.S. Transmission Finance team provides support for National Grid’s 14
transmission rate filings at the Federal Energy Regulatory Commission (“FERC”), 15
monitors ISO New England (“ISO-NE” and New York ISO (“NYISO”) 16
Transmission Tariffs, and is involved in most transmission-related pricing policy 17
and regulatory matters impacting National Grid including supporting National 18
Grid’s current Transmission Adjustment Clause filing before the Rhode Island 19
Public Utilities Commission (“Commission”). 20
21
Q. Please describe your educational and professional background. 22

NATIONAL GRID R.I.P.U.C. DOCKET NO. ____
JANUARY 2009 ELECTRIC RETAIL RATE FILING WITNESS: PAMELA A. VIAPIANO
Page 2 OF 20 A. I graduated from Clark University in Worcester, Massachusetts in 1987 with a 1
Bachelors of Arts in Computer Science. Over my twenty-one year career with 2
National Grid USA, I have held a number of positions in the rates area, including 3
Manager of Transmission Rates and Manager of Regulatory Policy. I have 4
submitted testimony before FERC and in a number of retail rate filings. 5
6
Q. Have you previously testified before the Commission? 7
A. Yes. I have submitted testimony in previous dockets in support of the estimate of 8
transmission costs for The Narragansett Electric Company d/b/a National Grid 9
(“Narragansett” or “Company”) in prior years. 10
11
II. Purpose of Testimony 12
Q. What is the purpose of your testimony? 13
A. My testimony addresses the estimated 2009 transmission expenses and ISO-NE 14
expenses for Narragansett. First, I will summarize the various transmission 15
services provided to Narragansett and how Narragansett pays for such services. 16
Second, I will provide testimony supporting the forecast of transmission expenses 17
that Narragansett is expected to incur in 2009. As described more fully in the 18
second part of my testimony, the Company expects to see an increase of $32 19
million in prospective transmission expenses, caused primarily by the impact of 20
additional transmission plant investment being completed across all of New 21
England. 22

NATIONAL GRID R.I.P.U.C. DOCKET NO. ____
JANUARY 2009 ELECTRIC RETAIL RATE FILING WITNESS: PAMELA A. VIAPIANO
Page 3 OF 20 1
III. Summary of Transmission Services Provided to Narragansett 2
Q. Please explain the history of Narragansett’s transmission service under rate 3
schedules approved by the FERC. 4
A. Effective January 1, 1998, Narragansett received transmission services, on behalf 5
of its entire customer base, under two tariffs: NEPOOL’s FERC Electric Tariff 6
No. 1 (“NEPOOL Tariff”) and NEP’s FERC Electric Tariff No. 9 (“NEP T-9 7
Tariff”). Additionally, effective January 1, 1999, Narragansett took service under 8
ISO-NE’s FERC Electric Tariff No. 1 (“ISO-NE Tariff”). 9
10
Effective February 1, 2005, FERC issued an order authorizing ISO-NE to begin 11
operating as a Regional Transmission Operator (“RTO”) (“ISO as the RTO”) and 12
at that time, ISO-NE replaced NEPOOL as the transmission provider in New 13
England. The new ISO-NE Transmission, Markets and Services Tariff 14
(“ISO/RTO Tariff”) replaced the three separate tariffs referred to above by 15
aggregating them into a single, omnibus tariff. As a result, NEP and ISO as the 16
RTO now charge Narragansett under this superseding omnibus tariff. 17
18
The terms, conditions and rate schedules from these three separate tariffs have 19
been transferred to the ISO/RTO Tariff as follows: 20
1. Schedule 21 and Schedule 21-NEP of the ISO/RTO Tariff capture the 21
former NEP T-9 Tariff, 22

NATIONAL GRID R.I.P.U.C. DOCKET NO. ____
JANUARY 2009 ELECTRIC RETAIL RATE FILING WITNESS: PAMELA A. VIAPIANO
Page 4 OF 20
2. Section II (up through and including Schedule 19) of the ISO/RTO Tariff 1
captures the former NEPOOL Tariff, and 2
3. Section IV.A of the ISO/RTO Tariff captures the former ISO-NE Tariff. 3
The prospective charges to Narragansett, therefore, are separately identified as (1) 4
NEP local charges, (2) ISO-NE regional charges (formerly NEPOOL), and (3) 5
ISO/RTO administrative charges. 6
7
Q. Please describe further the types of transmission services that are billed to 8
Narragansett under the ISO/RTO Tariff. 9
A. New England’s transmission rates utilize a highway/local pricing structure. That 10
is, Narragansett receives regional transmission service over “highway” 11
transmission facilities under Section II of the ISO/RTO Tariff, and receives local 12
transmission service over local transmission facilities under Schedule 21 of the 13
ISO/RTO Tariff. Additionally, transmission scheduling and market 14
administration services are provided by ISO-NE under Section IV.A of the 15
ISO/RTO Tariff. 16
17
A. Explanation of ISO/RTO Tariff Services, Rates & Charges 18
Q. Please explain the services provided to Narragansett under the ISO/RTO Tariff. 19
A. Section II of the ISO/RTO Tariff provides access over New England’s looped 20
transmission facilities, more commonly known as Pool Transmission Facilities 21
(“PTF”) or bulk transmission facilities. These facilities serve as New England’s 22

NATIONAL GRID R.I.P.U.C. DOCKET NO. ____
JANUARY 2009 ELECTRIC RETAIL RATE FILING WITNESS: PAMELA A. VIAPIANO
Page 5 OF 20
electric transmission “highway”, and the service provided over these facilities is 1
referred to as Regional Network Service (“RNS”). In addition, the ISO/RTO 2
Tariff provides for Black Start, Reactive Power, and Scheduling, System Control 3
and Dispatch Services, as described more fully later in this testimony. 4
5
Q. How are the costs for RNS recovered? 6
A. The ISO-NE RNS Rate (“RNS Rate”) recovers the RNS costs, and is determined 7
annually based on an aggregation of the transmission revenue requirements of 8
each of the transmission owners in New England, calculated in accordance with a 9
FERC-approved formula. Pursuant to a NEPOOL Settlement dated April 7, 1999, 10
which was incorporated into the ISO/RTO Tariff, the RNS Rate has transitioned 11
from zonal rates to a single, “postage stamp” rate in New England. The transition 12
was completed on March 1, 2008. 13
14
Q. Please describe the ISO-NE Black Start, Reactive Power, and Scheduling, System 15
Control and Dispatch Services that are included in the ISO/RTO Tariff. 16
A. ISO-NE Black Start Service, also known as System Restoration and Planning 17
Service from Generators, is necessary to ensure the continued reliable operation 18
of the New England transmission system. This service allows for the designation 19
of generators with the capability of supplying load and ability to start without an 20
outside electrical supply to re-energize the transmission system following a 21
system-wide blackout. 22

NATIONAL GRID R.I.P.U.C. DOCKET NO. ____
JANUARY 2009 ELECTRIC RETAIL RATE FILING WITNESS: PAMELA A. VIAPIANO
Page 6 OF 20 1
Reactive Power Service, also known as Reactive Supply and Voltage Control 2
from Generation Sources Service, is necessary to maintain transmission voltages 3
on the ISO-NE transmission system within acceptable limits and requires that 4
generation facilities be operated to produce or absorb reactive power. This 5
service must be provided for each transaction on the ISO-NE transmission system. 6
The amount of reactive power support that must be supplied for transactions is 7
based on the support necessary to maintain transmission voltages within limits 8
generally accepted and is consistently sustained in the region. 9
10
Lastly, Scheduling, System Control and Dispatch Service (“Scheduling & 11
Dispatch Service”) consists of the services required to schedule the movement of 12
power through, out of, within, or into the ISO-NE Control Area over the PTF and 13
to maintain System Control. Scheduling & Dispatch Service also provides for the 14
recovery of certain charges that reflect expenses incurred in the operation of 15
satellite dispatch centers. 16
17
Q. How are the ISO-NE charges for Black Start and Reactive Power assessed to 18
Narragansett? 19
A. ISO-NE assesses charges for Black Start and Reactive Power Services to 20
Narragansett each month based on Narragansett’s proportionate share of its 21
network load to ISO-NE’s total load. 22

NATIONAL GRID R.I.P.U.C. DOCKET NO. ____
JANUARY 2009 ELECTRIC RETAIL RATE FILING WITNESS: PAMELA A. VIAPIANO
Page 7 OF 20 1
Q. How are the charges for Scheduling & Dispatch Services assessed to 2
Narragansett? 3
A. Charges for Scheduling & Dispatch Service are based on the expenses incurred by 4
the ISO and by the individual transmission owners in the operation of local 5
control dispatch centers or otherwise to provide Scheduling & Dispatch Service. 6
The expenses incurred by the ISO in providing these services are recovered under 7
Section IV, Schedule 1 of the Transmission, Markets and Services Tariff. These 8
costs are allocated to Narragansett each month based on the FERC fixed rate for 9
the month times Narragansett’s monthly Network Load. 10
11
The costs incurred by the individual transmission owners in providing Scheduling 12
& Dispatch Service over PTF facilities, including the costs of operating local 13
control centers, are recovered under Section II, Schedule 1 of the Open Access 14
Transmission Tariff (“OATT”). These costs are allocated to Narragansett each 15
month based on a formula rate that is determined each year based on the prior 16
year’s costs incurred times Narragansett’s monthly Network Load. 17
18
The costs of Scheduling & Dispatch Service for transmission service over 19
transmission facilities other than PTF are charged under Schedule 21 of the 20
OATT. Thus, there are three types of Scheduling & Dispatch costs that are 21
similar, but are charged to Narragansett through three different tariff mechanisms. 22

NATIONAL GRID R.I.P.U.C. DOCKET NO. ____
JANUARY 2009 ELECTRIC RETAIL RATE FILING WITNESS: PAMELA A. VIAPIANO
Page 8 OF 20 1
Q. Are there any other applicable ISO charges which you have not mentioned 2
previously in this testimony? 3
A. Yes. The ISO/RTO Tariff also charges for costs associated with its Load 4
Response Program. 5
6
Q. Please describe the ISO-NE Load Response Program. 7
A. The Load Response Program is used to facilitate load response during periods of 8
peak electricity demand by providing appropriate incentives. Load Response 9
Program incentives are available to any Market Participant or Non-Market 10
Participant which enrolls itself and/or one or more retail customers to provide a 11
reduction in their electricity consumption in the New England Control Area 12
during peak demand periods. Incentives are payments for reducing your load 13
during peak demand periods. However, if the participant fails to reduce 14
consumption when scheduled, such entity could end up owing money to the ISO-15
New England. 16
17
Q. How are these Load Response Program costs allocated? 18
A. Any monthly charges or credits are allocated to the Network Load on a system- 19
wide basis. 20
21

NATIONAL GRID R.I.P.U.C. DOCKET NO. ____
JANUARY 2009 ELECTRIC RETAIL RATE FILING WITNESS: PAMELA A. VIAPIANO
Page 9 OF 20 Q. What administrative services and/or charges flow through to Narragansett under 1
Section IV.A of the ISO/RTO Tariff? 2
A. There are three different charges that flow through to Narragansett under Section 3
IV.A of the ISO/RTO Tariff under Schedule 1, Schedule 4, and Schedule 5. First, 4
Schedule 1 provides for one component of the administration of Scheduling & 5
Dispatch, as described earlier in my testimony. Second, Schedule 4 of the 6
ISO/RTO Tariff provides for the collection of FERC Annual Charges, and third 7
under the new Schedule 5, the ISO acts as the billing and collection agent for the 8
New England States Committee on Electricity’s (NESCOE) annual budget. 9
Historically, ISO- New England had also provided Energy Administration Service 10
(“EAS”) and Reliability Administrative Service (“RAS”) to Narragansett under 11
Schedules 2 and 3 of Section IV.A of ISO/RTO Tariff. However, these services 12
in past years related to Narragansett’s prior standard offer arrangements entered 13
into with TransCanada that have since expired. Those services are now taken 14
directly from ISO-New England by the standard offer and default service 15
providers. 16
17
Q. Please explain the background behind the inclusion of the NESCOE charges 18
under Schedule 5 of the ISO/RTO Tariff, Section IV.A. 19
A. Formed by a memorandum of understanding between ISO-NE and NEPOOL and 20
approved by FERC in the fall of 2007, the NESCOE was established. NESCOE 21
created a formal role for the six New England state’s participation on an ongoing 22

NATIONAL GRID R.I.P.U.C. DOCKET NO. ____
JANUARY 2009 ELECTRIC RETAIL RATE FILING WITNESS: PAMELA A. VIAPIANO
Page 10 OF 20
basis in the decision-making process of the RTO. It stands to represent the policy 1
perspectives of the New England Governors’ and their collective interests in 2
promoting a regional electric system that ensures the lowest reasonable long-term 3
costs for customers while maintaining reliable service and environmental quality. 4
5
Q. How are the ISO/RTO Tariff charges assessed? 6
A. The ISO assesses the charges in Section IV.A, excluding Schedule 4, based upon 7
stated rates pursuant to the ISO/RTO Tariff. These stated rates are adjusted 8
annually when the ISO files a revised budget and cost allocation proposal to 9
become effective January 1st each year. Narragansett is charged the stated rate for 10
these services as part of the ISO’s monthly billing process, based on its network 11
load for Schedule 1 and Schedule 5 charges. Schedule 4 charges are based upon 12
FERC’s total assessment to the New England Control Area, and are directly 13
assessed to NEP based on its proportion of total MWhs of transmission (including 14
Narragansett’s) to the total of the New England Control Areas’ total MWhs. 15
NEP, in turn, allocates a portion of the charges received under Schedule 5 to 16
Narragansett through Schedule 21-NEP. 17
18
B. Explanation of Schedule 21-NEP Tariff Services & Charges 19
Q. What services are provided to Narragansett under Schedule 21-NEP of the 20
ISO/RTO Tariff? 21

NATIONAL GRID R.I.P.U.C. DOCKET NO. ____
JANUARY 2009 ELECTRIC RETAIL RATE FILING WITNESS: PAMELA A. VIAPIANO
Page 11 OF 20 A. Schedule 21-NEP provides service over NEP’s local, non-highway transmission 1
facilities, considered non-PTF facilities (“Non-PTF”). The service provided over 2
the Non-PTF is referred to as Local Network Service (“LNS”). NEP also 3
provides metering, transformation and certain ancillary services to Narragansett to 4
the extent such services are required by Narragansett and not otherwise provided 5
under the ISO/RTO Tariff. 6
7
Q. Please explain the metering and transformation services provided by NEP. 8
A. NEP separately surcharges the appropriate customers for these services. NEP 9
provides metering service when a customer uses NEP-owned meter equipment to 10
measure the delivery of transmission service. NEP provides transformation 11
service when a customer uses NEP-owned transformation facilities to step down 12
voltages from 69 kV or greater to a distribution voltage. 13
14
IV. Estimate of Narragansett’s Transmission Expenses 15
Q. Was the forecast for Narragansett’s transmission and ISO expenses for 2009 done 16
by you or under your supervision? 17
A. Yes. Based on our knowledge of the ISO billing processes, we estimate the total 18
transmission and ISO expenses (including certain ancillary services) for 2009 to 19
be approximately $103.9 million, as shown in Schedule PAV-1, Summary Page 1. 20
This equates to an increase of $31.9 million over expenses embedded in 21
Narragansett’s retail rates in 2008. 22

NATIONAL GRID R.I.P.U.C. DOCKET NO. ____
JANUARY 2009 ELECTRIC RETAIL RATE FILING WITNESS: PAMELA A. VIAPIANO
Page 12 OF 20 1
Q. How have the ISO Charges shown on line 3 of Schedule PAV-1 been forecasted? 2
A. As indicated in Schedule PAV-3,we have applied an estimated rate increase to the 3
total R N S rate currently in effect to reflect the forecast of PTF plant additions 4
across New England, as estimated by the New England transmission owners, (see 5
PAV-7) to be included in the annual formula rate effective June 1st 2009. The 6
estimated rate increase is calculated by multiplying the total New England 7
estimated 2009 plant additions by the historic 2007 PTF Revenue Requirement to 8
Plant ratio as calculated in the PTO Informational Filing with FERC on July 31, 9
2008 and dividing by the ISO-NE network load. The estimated 2009 RNS 10
transmission charges to Narragansett are then calculated by taking this forecasted 11
RNS rate, divided by 12, multiplied by Narragansett’s monthly network load. 12
The resulting calculation is shown in column 2 of Schedule PAV-2, page 1of 2. 13
14
Q. Schedule PAV-1 also includes estimated ISO charges for Scheduling and 15
Dispatch, Load Response, Black Start, and Reactive Power. How were these 16
costs forecasted, as shown? 17
A. I will explain each below, out of sequence. The Black Start costs shown on line 6 18
of Schedule PAV-1 were derived in two steps. First, as shown in Section II of 19
Schedule PAV-4 (line 5), we estimated the cost for Black Start Service by 20
combining the actual monthly ISO Black Start expenses for the period January 21
through July 2008 and the prior year’s historical data from August through 22

NATIONAL GRID R.I.P.U.C. DOCKET NO. ____
JANUARY 2009 ELECTRIC RETAIL RATE FILING WITNESS: PAMELA A. VIAPIANO
Page 13 OF 20
December 2007. This region-wide estimate is divided by the ISO’s 2007 Network 1
Load to calculate an estimated annual rate, as shown on line 7. We then 2
calculated a monthly rate (annual rate divided by 12), as shown on line 8. To 3
obtain the estimate of Black Start costs that would be charged to Narragansett, we 4
multiplied the monthly rate by Narragansett’s monthly network load, as shown for 5
each month in column 2 of PAV-2, page 1. Using this methodology, we estimate 6
$650,309 to be allocated to Narragansett for 2009. 7
8
Q. How have you performed the estimate for Reactive Power costs for Narragansett? 9
A. The estimated Reactive Power cost for the New England region was calculated 10
by using the full year 2007 actual ISO costs (as 2008 data was unavailable) as 11
shown in Section I of Schedule PAV-4 (line 1). The annual rate is determined by 12
dividing the total Reactive Power costs charged in the region for that 12 month 13
historic period by the ISO’s 2007 Network Load. The monthly rate (annual rate 14
divided by 12) is then multiplied by Narragansett’s monthly network load to 15
determine the estimated charges for Reactive Power Service. Using this 16
methodology, we estimate $3,963,174 to be allocated to Narragansett for 2009. 17
18
Q. How did you forecast the Scheduling and Dispatch costs shown on line 4 of PAV-19
1? 20
A. My estimate is shown in column (3) of PAV-2, page 1. This amount was derived 21
by simply using the currently effective OATT Schedule 1 rate of $1.2299729 per 22

NATIONAL GRID R.I.P.U.C. DOCKET NO. ____
JANUARY 2009 ELECTRIC RETAIL RATE FILING WITNESS: PAMELA A. VIAPIANO
Page 14 OF 20
kW-year, divided by 12, and further multiplied by Narragansett’s network load as 1
shown monthly in column (1) of PAV-2, page 1 of 2. 2
3
Q. Have you included any RMR contract charges to Narragansett for 2009? 4
A. No. Narragansett has not incurred any RMR contract charges as there have been 5
no RMR contracts for the Rhode Island reliability region over the past year. 6
Therefore, we have not forecasted any RMR contract costs for 2009. 7
8
Q. Have you included any Load Response Program charges to Narragansett for 9
2009? 10
A. Yes. My estimate for 2009 Load Response Program costs is shown on line 5 of 11
Schedule PAV-1. For this estimate, actual costs incurred by Narragansett for the 12
periods January through June 2008 were used along with the average of these 13
months to complete the estimate for July through December. The monthly cost 14
estimate is shown in column 5 of Schedule PAV-2 page 1of 2, totaling $805,440. 15
16
Q. Can you please explain the forecast of charges shown in line 8 and 9 of Schedule 17
PAV-1? 18
A. Yes. I described these costs earlier in my testimony. Line 8 shows the 2009 19
forecast of charges to Narragansett under Schedule 1, Scheduling and Load 20
Dispatch Administrative schedules through Section IV.A of the ISO/RTO Tariff. 21
The estimate is based on the ISO revenue requirement for Schedule 1 filed each 22

NATIONAL GRID R.I.P.U.C. DOCKET NO. ____
JANUARY 2009 ELECTRIC RETAIL RATE FILING WITNESS: PAMELA A. VIAPIANO
Page 15 OF 20
year with FERC. The ISO filed its proposed 2009 revenue requirement with 1
FERC on October 31, 2008. To estimate Narragansett’s 2009 ISO charges, the 2
ISO’s actual costs for the period January through August 2008 as well as the 3
monthly estimates for September through December are adjusted by an 4
inflationary factor shown on line 16 of PAV-2, page 2. This inflationary factor is 5
intended to recognize the increase or decrease in the ISO’s revenue requirement 6
and the associated components of that revenue requirement from the budget as 7
filed for the previous year. Line 9 shows our estimated 2009 NESCOE charges 8
under Schedule 5 of Section IV.A of the ISO/RTO Tariff. For calendar year 9
2009, each customer that is obligated to pay the Regional Network Service rate 10
pays each month, in arrears, an amount equal to the product of $.00263 kW times 11
its monthly network load for that month. For the purposes of the 2009 estimate, 12
actual ISO charges for the periods January through August 2008 were used as a 13
baseline in projecting the full year. These charges are shown in Schedule PAV-2 14
on page 2. The total estimated amount of direct ISO/RTO Tariff charges under 15
Section IV.A for the region is estimated to be $1,651,808. These estimates are 16
taken from page 2 of PAV-2 and then reflected on line 8 and 9 of Schedule PAV-17
1. 18
19
Q. What is the sub-total of transmission expenses attributable to charges from the 20
ISO-NE? 21

NATIONAL GRID R.I.P.U.C. DOCKET NO. ____
JANUARY 2009 ELECTRIC RETAIL RATE FILING WITNESS: PAMELA A. VIAPIANO
Page 16 OF 20 A. The sub-total of ISO-NE charges is $77,187,007, which is the sum of lines 3 1
through 9 on Schedule PAV-1. 2
3
Q. Have you estimated the charges to Narragansett under Schedule 21 of the 4
ISO/RTO Tariff? 5
A. Yes. Lines 1 and 2 of Schedule PAV-1 show the amount of forecasted charges 6
from New England Power Company pursuant to the Local Network Service 7
(“LNS”) tariff. The total amount of expenses is $26,731,315 which represents a 8
net increase in the total revenue requirement of New England Power Company 9
allocated to Narragansett of approximately $8 million for 2009. This net increase 10
in the revenue requirement is primarily driven by the estimated increase in costs 11
for the approximately $6 million of capital additions forecasted for 2009. 12
Schedule PAV-6 shows the calculation of the total NEP revenue requirement 13
applicable to all customers in New England. NEP allocates Non-PTF expenses to 14
Narragansett’s customers on a load ratio share basis, as shown in Schedule PAV-5 15
column (1). Metering, transformation and ancillary service charges are based on 16
current rates and are assessed to Narragansett based on a per meter and peak load 17
basis, respectively. 18
19
V. Explanation of Primary Changes from Last Year’s Forecasted Expenses 20
Q. What is the effect on Narragansett’s 2009 transmission expenses? 21

NATIONAL GRID R.I.P.U.C. DOCKET NO. ____
JANUARY 2009 ELECTRIC RETAIL RATE FILING WITNESS: PAMELA A. VIAPIANO
Page 17 OF 20 A. As mentioned earlier in my testimony, the estimated 2009 Narragansett 1
transmission and ISO expenses of $103.9 million represents a net increase of $32 2
million from the 2008 forecast of transmission expenses for Narragansett. This 3
total increase is due to 1) An increase in the actual RNS rates effective June 1, 4
2008 of $13 million; 2) An estimated additional RNS rate increase effective June 5
1, 2009 based on the PTF transmission plant investment forecasted to go “in-6
service” in 2009 across New England, resulting in an additional $10 million 7
increase in Narragansett’s Regional Network Service PTF transmission charges; 8
3.) NEP is forecasting an $8 million increase in local Non-PTF expenses due 9
primarily to increases in Non-PTF investment and 4.) An additional $1 million in 10
Reactive Power Expenses. 11
12
Q. What is causing the $13 million ISO-NE RNS rate increase from 2008 ? 13
A. There were several factors that caused the increase from 2008. First, there is an 14
increase of approximately $8m in expense for the period January through May 15
2009 as compared to expenses as forecasted for January through May 2008. This 16
is the result of RNS rates being updated effective June 1 of each year. Therefore 17
the forecasted January through May 2008 expenses included in last year’s filing 18
do not reflect the increase of approximately $16.00 per MW year to the RNS rate 19
that became effective June 1, 2008 that resulted primarily from an estimated $1.2 20
billion of expected transmission plant investment to be placed in-service over the 21
2008 calendar year. Second, the actual 2008 ISO-NE RNS rate effective June 1, 22
NATIONAL GRID R.I.P.U.C. DOCKET NO. ____
JANUARY 2009 ELECTRIC RETAIL RATE FILING WITNESS: PAMELA A. VIAPIANO
Page 18 OF 20
2008 of $43.87 per MW year reflecting the $1.2 billion of additional plant 1
investment was $6.73 per MW year higher than the $34.14 per MW year 2
anticipated in our estimate as filed last year. This was primarily due to an 3
unanticipated under-recovery of 2007 transmission expenses and an under 4
estimate of the $1.2 billion of the 2008 additional plant investment of 5
approximately $200 million. 6
7
Q. What PTF plant investment is driving the increase in the ISO-NE RNS charges to 8
Narragansett effective June 1, 2009? 9
A. Of the total estimated $24 million increase to the 2009 forecast of ISO PTF 10
transmission expenses, approximately $10 million is due to a significant number 11
of capital additions forecasted by the Transmission Owners to go into service in 12
2009. Schedule PAV-7 is a schedule showing an estimated $1.3 billion of PTF 13
plant additions for 2009 as provided by the Transmission Owners. This list was 14
newly created by the Transmission Owners this year in an effort to improve our 15
ability to forecast the impact of capital investment on RNS rates. In prior years, 16
forecasts had been based on the figures as reported in the ISO-NE last approved 17
Regional System Plan. This year, revised estimates are intended to 1) include the 18
most current project cost forecasts and 2) refine phasing of when project spending 19
is placed into service and capture any PTF capital expenditure not included in the 20
ISO-NE Regional System Plan. 21
22

NATIONAL GRID R.I.P.U.C. DOCKET NO. ____
JANUARY 2009 ELECTRIC RETAIL RATE FILING WITNESS: PAMELA A. VIAPIANO
Page 19 OF 20 Q. What are the major projects driving the significant level of projected plant 1
additions for 2009? 2
A. Based on our review of ISO-NE Regional System Plan, the three largest 3
transmission projects in New England with portions of the project having 4
projected in service dates during 2009 are: (1) Northeast Utilities and United 5
Illuminating Southwest Connecticut Reliability; (2) NSTAR’s 345 kV 6
Transmission Reliability Project; and (3) National Grid’s Wakefield Junction 7
Substation. The Northeast Utilities/United Illuminating Southwest Connecticut 8
Reliability Project installs a 345 kV transmission loop in southwest Connecticut 9
to address reliability needs in the area. The 345 kV loop includes a line from 10
Bethel to Norwalk (Phase I) and from Beseck Junction to Norwalk (Phase II). 11
The project increases the ability to transfer power into the area and resolves long-12
standing short-circuit concerns by relocating interconnections of several 13
generating units from the 115kV system to the 345 kV system. The NSTAR 345 14
kV Transmission Reliability Project installs three 345 kV transmission cables 15
from Stoughton to Boston to address reliability needs in the area. The project 16
increases the ability to transfer power into the Boston area. The first two cables 17
were placed in-service in 2006; the third cable is presently being installed and 18
commissioned. National Grid’s Merrimack Valley/North Shore Reliability 19
Project reinforces the transmission system in northeast Massachusetts to support 20
future load growth, provide adequate capacity to transfer power within the local 21
area, support the long-term Boston Import needs, and replace the functionality of 22

NATIONAL GRID R.I.P.U.C. DOCKET NO. ____
JANUARY 2009 ELECTRIC RETAIL RATE FILING WITNESS: PAMELA A. VIAPIANO
Page 20 OF 20
the ageing Golden Hills 345-115 kV substation. The major components of the 1
project include a new 345-115 Wakefield Junction substation, a new West 2
Amesbury 345-115 kV substation, expansion and reconfiguration of the Sandy 3
Pond 345 kV switchyard, conversion of an existing 23 kV line to 115 kV between 4
King Street and West Amesbury, and various other upgrades to existing 115 kV 5
lines and terminal equipment to improve system thermal capacity, voltage 6
performance, and short-circuit interrupting capability. 7
8 9 Q. Does this conclude your testimony? 10
A. Yes. 11

Schedules of
Pam
ela A. V
iapiano

NATIONAL GRID R.I.P.U.C. DOCKET NO. ____
JANUARY 2009 ELECTRIC RETAIL RATE FILING WITNESS: PAMELA A. VIAPIANO
Schedules
Schedule PAV-1 Summary of Transmission Expenses Estimated for 2009 Schedule PAV-2 Summary of ISO-NE Charges Estimated for 2009 Schedule PAV-3 PTF Rate Calculation Estimated for 2009 Schedule PAV-4 Summary of Reactive Power & Black Start Costs Estimated for
2009 Schedule PAV-5 Summary of New England Power Schedule No. 21 Charges
Estimated for 2009 Schedule PAV-6 Non-PTF Revenue Requirement Estimated for 2009 Schedule PAV-7 Forecasted PTF Capital Additions In Service - 2009

Schedule PA
V-1

NATIONAL GRID R.I.P.U.C. DOCKET NO. ____
JANUARY 2009 ELECTRIC RETAIL RATE FILING WITNESS: PAMELA A. VIAPIANO
Schedule PAV-1
Summary of Transmission Expenses Estimated for 2008

National GridR.I.P.U.C No. _____
Schedule PAV-1Summary
Page 1 of 1
2009 ForecastNEP Charges
1 Non-PTF $25,766,7972 Other NEP Charges 964,518
Sub-Total NEP Charges $26,731,315ISO Charges
3 PTF $68,462,3014 Scheduling & Dispatch 1,653,9765 Load Response 805,4406 Black Start 650,3097 Reactive Power 3,963,174
Sub-Total ISO Charges $75,535,199ISO-NE Administrative Charges
8 Schedule 1 - Scheduling & Dispatch $1,609,3689 Schedule 5 - NESCOE 42,440
Sub-Total ISO-NE Charges $1,651,808
10 Total Expenses Flowing Through Current Rates $103,918,322
Line 1 = PAV-5: Column (2), Line 13Line 2 = PAV-5: Sum of Column (3) thru (5), Line 13 Line 3 = PAV-2, page 1: Column (2), Line 13Line 4 = PAV-2, page 1: Column (3), Line 13Line 5 = PAV-2, page 1: Column (5), Line 13Line 6 = PAV-2, page 1: Column (6), Line 13Line 7 = PAV-2, page 1: Column (7), Line 13Line 8 = PAV-2, page 2: Column (1), Line 13Line 9 = PAV-2, page 2: Column (2), Line 13Line 10 = Sum of Line 1 thru Line 9
National Grid: Narragansett Electric CompanySummary of Transmission Expenses
Estimated For the Year 2009

Schedule PAV
-2

NATIONAL GRID R.I.P.U.C. DOCKET NO. ____
JANUARY 2009 ELECTRIC RETAIL RATE FILING WITNESS: PAMELA A. VIAPIANO
Schedule PAV-2
Summary of ISO-NE Charges Estimated for 2008

National GridR.I.P.U.C. Docket No. ______
Schedule PAV-2Summary of ISO Charges
Page 1 of 2
(1) (2) (3) (4) (5) (6) (7) (8)Monthly PTF Demand Scheduling Reliability Load Black Reactive Total
PTF kW Load Charge & Dispatch Must Run Response Start Power ISO
1 January 1,360,850 $4,975,041 $139,484 $0 $11,454 $54,842 $334,225 $5,515,0462 February 1,286,073 4,701,669 131,820 0 78,687 51,829 315,860 5,279,8633 March 1,155,691 4,225,014 118,456 0 39,832 46,574 283,838 4,713,7134 April 1,067,184 3,901,447 109,384 0 55,749 43,008 262,100 4,371,6885 May 1,094,066 3,999,723 112,139 0 56,437 44,091 268,703 4,481,0936 June 1,768,978 8,113,712 181,316 0 65,181 71,290 434,461 8,865,9607 July 1,626,961 7,462,328 166,760 0 100,375 65,567 399,582 8,194,6118 August 1,546,960 7,095,390 158,560 0 129,245 62,342 379,933 7,825,4719 September 1,443,947 6,622,904 148,001 0 67,120 58,191 354,633 7,250,849
10 October 1,290,855 5,920,722 132,310 0 67,120 52,021 317,034 6,489,20711 November 1,189,425 5,455,496 121,913 0 67,120 47,934 292,123 5,984,58612 December 1,305,710 5,988,857 133,832 0 67,120 52,620 320,682 6,563,111
13 12-Mo Total 16,136,700 $68,462,301 $1,653,976 $0 $805,440 $650,309 $3,963,174 $75,535,199
Line 1-12: Column (1) = NEPOOL Monthly Statements January 2008 - August 2008 for actuals and September 2007 - December 2007 for estimatesLine 1-5: Column (2) = PAV-3, Line 1 * Column (1) / 12Line 6-12: Column (2) = PAV-3, Line 6 * Column (1) / 12Line 1-12: Column (3) = Current Rate * Column (1) / 12 Rate = 1.2299729 /kW-YrLine 1-12: Column (4) = 0 [No Reliability Must Run Contracts are currently in effect for Rhode Island]Line 1-12: Column (5) = ISO Monthly Statements January 2008 - August 2008 for actuals - average of those months for the estimates for Sept - Dec 2008 as the Sept - Dec 2007 actuals were highLine 1-12: Column (6) = PAV-4, Line 8 * Column (1)Line 1-12: Column (7) = PAV-4, Line 4 * Column (1)Line 1-12: Column (8) = Sum of Columns (2) thru (7)Line 13 = Sum of Line 1 thru Line 12
National Grid: Narragansett Electric CompanySummary of ISO Charges
Estimated For the Year 2009

National GridR.I.P.U.C. Docket No. _____
Schedule PAV-2Summary of ISO-NE Administrative Expenses
Page 2 of 2
(1) (2) (3)Sch. 1 Total
Scheduling Sch. 5 ISO-NE Admin& Dispatch NESCOE Charges
1 January $144,660 $3,579 $148,2392 February 132,476 3,382 $135,8593 March 120,961 3,039 $124,0014 April 112,223 2,807 $115,0305 May 115,453 2,877 $118,3316 June 189,673 4,652 $194,3267 July 170,719 4,279 $174,9988 August 161,222 4,069 $165,2909 September 126,862 3,798 $130,660
10 October 113,854 3,395 $117,24911 November 104,449 3,128 $107,57712 December 116,815 3,434 $120,249
13 Totals $1,609,368 $42,440 $1,651,808
14 2008 Budget $24,409,40615 2009 Budget $26,424,50516 % Change 8.26%
Line 1-12: Columns (1) = Monthly ISO Bills for periods January 2008 - August 2008 and September 2007 - December 2007 for estimatesLine 1-12: Column (2) = Estimates based on Monthly PTF load * 2009 charge of $.00263 per kW-mo from ISO NESCOE Budget Filing 10/31/2008Line 13 = Sum of Line 1 thru Line 12Line 14 = ISO-NE Proposed Schedule 1 Operating Budget (Year 2008) based on the 10/31/07 FERC filingLine 15 = ISO-NE Proposed Schedule 1 Operating Budget (Year 2009) based on the 10/31/08 FERC filingLine 16 = Line 15-Line 14 / Line 14
National Grid: Narragansett Electric CompanySummary of ISO-NE Administrative Expenses
Estimated For the Year 2009

Schedule PA
V-3

NATIONAL GRID R.I.P.U.C. DOCKET NO. ____
JANUARY 2009 ELECTRIC RETAIL RATE FILING WITNESS: PAMELA A. VIAPIANO
Schedule PAV-3
PTF Rate Calculation Estimated for 2008

National GridR.I.P.U.C. Docket No. _____
Schedule PAV-3WorkpaperPage 1 of 1
Development of PTF Rate:
1 Total Regional Network Service Rate through May 31, 2009 $43.87 /KW-YR
ESTIMATED Increase in ISO Rate Effective June 1, 2009
2 Total ESTIMATED PTO Plant Additions $1,329,138,488
3 * Revenue Requirement to Plant Ratio 18.05%
4 / 2007 ISO Network Load 21,485,999
5 Additional Estimated ISO Regional Network Service Rate $11.17 /KW-YR
6 Regional Network Service Rate in effect June 1, 2009 throu $55.04 /KW-YR
Line 1 = PTO Supplemental Filing Line 2 = Per PTO submissions dated 10/29/2008Line 3 = PTO RWG Presentation 7/22/08Line 4 = PTO Informational Filing dated 7/31/08Line 5 = Line 2 * Line 3 / Line 4Line 6 = Line 1 + Line 5
New England Power CompanyPTF Rate Calculation
Estimated For the Year 2009

Schedule PA
V-4

NATIONAL GRID R.I.P.U.C. DOCKET NO. ____
JANUARY 2009 ELECTRIC RETAIL RATE FILING WITNESS: PAMELA A. VIAPIANO
Schedule PAV-4
Summary of Reactive Power & Black Start Costs Estimated for 2008

National GridR.I.P.U.C. Docket No. ______
Schedule PAV-4Workpaper
Page 1 of 1
National Grid: Narragansett Electric CompanySummary of Reactive Power & Black Start Costs
Estimated For the Year 2009
Section I: Development of Reactive Power Estimate
1 Estimated Total ISO Reactive Power Costs $63,313,1992 2007 ISO Network Load (KW) 21,485,999
3 Estimated Rate / KW-Yr $2.9467
4 Estimated Rate / KW-Mo 0.2456
Section II: Development of Black Start Costs
5 Estimated Total ISO Black Start Costs $10,397,4756 2007 ISO Network Load (KW) 21,485,999
7 Estimated Rate / KW-Yr $0.4839
8 Estimated Rate / KW-Mo $0.0403
Line 1 = ISO Schedule 2 Settlement Reports for period January 2007 - December 2007Line 2 = 12 CP Network Loads from Informational Filing dated 07/31/08Line 3 = Line 1 / Line 2Line 4 = Line 3 / 12Line 5 = ISO Schedule 16 Settlement Rprts for Jan 2008 - July 2008 for actuals and August 2007 - December 2007 for estimatesLine 6 = Line 2Line 7 = Line 5 / Line 6Line 8 = Line 7 / 12

Schedule PAV
-5

NATIONAL GRID R.I.P.U.C. DOCKET NO. ____
JANUARY 2009 ELECTRIC RETAIL RATE FILING WITNESS: PAMELA A. VIAPIANO
Schedule PAV-5
Summary of New England Power Schedule No. 21 Charges Estimated for 2008

National GridR.I.P.U.C Docket No. _____
Schedule PAV-5NEP Schedule 21 Charges
Page 1 of 1
(1) (2) (3) (4) (5) (6)Non- PTF Load Non-PTF
Ratio Demand Scheduling & Transformer Meter Total% Share Charge Dispatch Surcharge Surcharge NEP Costs
1 January 25.60% $2,103,067 $70,229 $1,929 $1,022 $2,176,2472 February 25.62% 2,104,716 7,462 1,929 1,022 2,115,128 3 March 25.34% 2,081,516 149,486 1,929 1,022 2,233,953 4 April 25.80% 2,118,923 101,989 1,929 1,022 2,223,862 5 May 25.16% 2,066,789 104,047 1,929 1,022 2,173,785 6 June 26.44% 2,172,007 102,610 1,929 1,022 2,277,567 7 July 26.23% 2,154,214 46,536 1,929 1,022 2,203,700 8 August 27.99% 2,299,269 57,831 1,929 1,022 2,360,050 9 September 26.35% 2,164,737 77,843 1,929 1,022 2,245,530
10 October 27.75% 2,279,269 61,639 1,929 1,022 2,343,858 11 November 26.02% 2,137,472 100,928 1,929 1,022 2,241,350 12 December 25.38% 2,084,818 48,515 1,929 1,022 2,136,284
13 12- Mo Total $25,766,797 $929,116 $23,142 $12,260 $26,731,315
Lines 1-12: Column (1) = Monthly Network Load Files for January 2008 - September 2008 for actuals and October 2007 - December 2007 for estimates Lines 1-12: Column (2) = Column (1) * Schedule PAV-6, Line 3 / 12Lines 1-12: Column (3) = Monthly Network Bills for periods January 2008 - August 2008 and September 2007 - December 2007 for estimates Lines 1-12: Column (4) & (5) = Current rates as of June 2008Lines 1-12: Column (6) = Sum of Column (2) thru (5) Line 13 = Sum of Line 1 through Line 12
National Grid: Narragansett Electric CompanySummary of New England Power - Schedule No. 21 Charges
Estimated For the Year 2009

Schedule PA
V-6

NATIONAL GRID R.I.P.U.C. DOCKET NO. ____
JANUARY 2009 ELECTRIC RETAIL RATE FILING WITNESS: PAMELA A. VIAPIANO
Schedule PAV-6
Non-PTF Revenue Requirement Estimated for 2008

National GridR.I.P.U.C. Docket No. ______
Schedule PAV-6WorkpaperPage 1 of 1
New England Power Company
Section II:1 NEP's Schedule 21 Non-PTF Revenue Requirement (12 mos. Ended 12/31/08) $92,884,229
.2 Adjustment for Forecasted 2009 Capital Additions $5,688,000
3 Estimated 2009 Non-PTF Revenue Requirement $98,572,229
Adjustment for Year End 2009 Capital Additions4 Estimated 2009 Non-PTF Transmission Additions for Lines - In Service $11,100,0005 Estimated. 2009 Non-PTF Transmission Additions for Substations - In Service $20,500,0006 Estimated NEP 2009 Transmission Plant Additions $31,600,0007 Non-PTF Transmission Plant Carrying Charge 18%
8 Adjustment for Forecasted 2009 Capital Additions $5,688,000
Section III:Transmission Plant Carrying Charge
9 NEP's Schedule 21 Revenue Requirement 92,884,22910 Total Revenue Credit (12 Mos. Ended 12/31/08) 174,667,57011 Total Transmission Integrated Facilities Credit (12 Mos. Ended 12/31/08) (44,692,680)
12 Sub-Total Revenue Requirement 222,859,119
13 Total Transmission Plant (as of 9/30/08) 1,213,452,216
14 Non-PTF Transmission Plant Carrying Charge 18%
Line 1 = NEP Schedule 21 Billing - January - August 2008 for actuals, Sept-December 2007 for estimatesLine 2 = Line 8Line 3 = Line 1 + Line 2Line 4 & 5 = Estimated NEP In-Service Non-PTF additions for CY 2009 for Line and SubstationsLine 6 = Line 4 + Line 5Line 7 = Line 14Line 8 = Line 6 * Line 7Line 9 thru 11 = NEP Schedule 21 Billings January - August 2008 for actuals, Sept-December 2007 for estimatesLine 12 = Sum of Lines 9 thru 11Line 13 = NEP Schedule 21 BillingLine 14 = Line 12 / Line 13
Non-PTF Revenue RequirementEstimated For the Year 2009

Schedule PAV
-7

NATIONAL GRID R.I.P.U.C. DOCKET NO. ____
JANUARY 2009 ELECTRIC RETAIL RATE FILING WITNESS: PAMELA A. VIAPIANO
Schedule PAV-7
Forecasted PTF Capital Additions In Service - 2009

National GridR.I.P.U.C. Docket No. ______
Schedule PAV-7WorkpaperPage 1 of 1
Participating Transmission OwnersForecast of RNS Rate Impacts
For the Period CY09
Estimated / Forecasted PTF Capital Additions In Service2009
Bangor Hydro 30,000,000$ Central Maine Power 38,680,488$ Florida Power & Light-NED 20,000,000$ Holyoke Gas and Electric -$ National Grid 156,200,000$ NSTAR Electric Company 125,000,000$ Northeast Utilities 596,700,000$ United Ulluminating Company 327,561,000$ VT Transco 34,997,000$
Total 1,329,138,488$
Source: Participating Transmission Owners (PTO) Committee