
VIA ELECTRONIC FILING Adam ... - Florida Power & Light
43
Florida Power & Light Company 700 Universe Boulevard, Juno Beach, FL 33408 R. Wade Litchfield Vice President & General Counsel Florida Power & Light Company 700 Universe Boulevard Juno Beach, FL 33408-0420 (561) 691-7101 March 12, 2021 VIA ELECTRONIC FILING Adam Teitzman, Commission Clerk Division of the Commission Clerk and Administrative Services Florida Public Service Commission 2540 Shumard Oak Boulevard Tallahassee, FL 32399-0850 Re: Docket No. 20210015-EI Petition by FPL for Base Rate Increase and Rate Unification Dear Mr. Teitzman: Attached for filing on behalf of Florida Power & Light Company (“FPL”) in the above-referenced docket are the Direct Testimony and Exhibits of FPL witness Thomas Broad. Please let me know if you should have any questions regarding this submission. (Document 8 of 69) Sincerely, R. Wade Litchfield Vice President & General Counsel Florida Power & Light Company RWL:ec
Transcript of VIA ELECTRONIC FILING Adam ... - Florida Power & Light

Florida Power & Light Company
700 Universe Boulevard, Juno Beach, FL 33408
R. Wade Litchfield Vice President & General Counsel Florida Power & Light Company
700 Universe Boulevard Juno Beach, FL 33408-0420
(561) 691-7101
March 12, 2021
VIA ELECTRONIC FILING Adam Teitzman, Commission Clerk Division of the Commission Clerk and Administrative Services Florida Public Service Commission 2540 Shumard Oak Boulevard Tallahassee, FL 32399-0850
Re: Docket No. 20210015-EI Petition by FPL for Base Rate Increase and Rate Unification
Dear Mr. Teitzman:
Attached for filing on behalf of Florida Power & Light Company (“FPL”) in the above-referenced docket are the Direct Testimony and Exhibits of FPL witness Thomas Broad.
Please let me know if you should have any questions regarding this submission.
(Document 8 of 69)
Sincerely,
R. Wade Litchfield Vice President & General Counsel Florida Power & Light Company
RWL:ec

h
1
BEFORE THE FLORIDA PUBLIC SERVICE COMMISSION 1
FLORIDA POWER & LIGHT COMPANY 2
DIRECT TESTIMONY OF THOMAS BROAD 3
DOCKET NO. 20210015-EI 4
MARCH 12, 2021 5
6
7
8
9
10
11
12
13
14
15
16
17
18
19
20
21
22
23

h
2
TABLE OF CONTENTS 1
I. INTRODUCTION ..................................................................................... 3 2
II. FOSSIL/SOLAR GENERATING FLEET PERFORMANCE .................. 8 3
III. FOSSIL/SOLAR GENERATING FLEET NON-FUEL O&M AND 4
CAPEX .................................................................................................... 18 5
6
7
8
9
10
11
12
13
14
15
16
17
18
19
20
21
22
23
24

h
3
I. INTRODUCTION 1
2
Q. Please state your name and business address. 3
A. My name is Thomas Broad, and my business address is Florida Power & Light 4
Company, 700 Universe Boulevard, Juno Beach, Florida, 33408. 5
Q. By whom are you employed, and what is your position? 6
A. I am employed by NextEra Energy as the Vice President of Power Generation 7
Operations and Pipelines in the Power Generation Division (“PGD”) Business 8
Unit. 9
Q. Please describe your duties and responsibilities in that position. 10
A. I am responsible for the operations and maintenance of all of the Company’s 11
fossil/solar power plant generation across Florida, including traditional fossil fuel-12
fired steam boilers, combined cycle (“CC”), aero-derivative and large frame 13
simple cycle combustion turbine (“CT”), and solar / battery technologies. 14
Q. Please describe your educational background and professional experience. 15
A. I earned a Bachelor of Science Degree in Engineering - Marine from Maine 16
Maritime Academy and a Master of Business Administration from Nova 17
Southeastern University. I also am a Certified Six Sigma Black Belt. Overall, I 18
have more than three decades of Power Generation related experience. My 19
extensive professional background involves technical, managerial, and 20
commercial experience in progressively more demanding assignments. 21
22
23
h
4
I joined Florida Power & Light in 1985 on the Marketing Services Team. I have 1
since served as Vice President - Central Maintenance, where I led the safe and 2
cost-effective execution of major maintenance activities throughout the U.S. and 3
Canada. I also served as Vice President - Engineering & Construction, where I 4
was responsible for leading all engineering and construction activities for NextEra 5
Energy’s generation fleet. Beginning 2018, I then served as Vice President – 6
Solar, Battery Storage, and Pipelines for NextEra Energy projects across the 7
United States, Canada and Spain. 8
9
I am currently Vice President of PGD’s Fossil/Solar Operations with responsibility 10
for over 600 employees and 69 electrical generating units with a combined non-11
nuclear production capacity of approximately 25,000 MW in 2020. FPL’s 12
generating fleet (“fossil/solar”) is the largest and most fuel-efficient utility fleet in 13
the country. With FPL and Gulf utilities merging, this capacity increases another 14
2,400 MW totaling more than 27,000 MW. 15
Q. Are you sponsoring any exhibits in this case? 16
A. Yes. I am sponsoring the following exhibits: 17
TB-1 Consolidated MFRs Sponsored or Co-sponsored by Thomas Broad 18
TB-2 Supplemental FPL and Gulf Standalone Information in MFR Format 19
Sponsored or Co-sponsored by Thomas Broad 20
TB-3 FPL Fossil/Solar Fleet MW Capability and Technology Changes 21
TB-4 FPL Fleet Performance Improvements 22
TB-5 FPL 15 Year NFOM, NHR & EFOR Performance Comparison 23

h
5
TB-6 Pg. 1 of 2 FPL Fossil/Solar Fleet Heat Rate Comparison 1
TB-6 Pg. 2 of 2 Cumulative Benefits from FPL’s Modernized Fleet 2
TB-7 FPL’s/Gulf’s Fleet Level O&M, Heat Rate and EFOR Performance 3
Comparisons 4
TB-8 FPL’s/Gulf’s CC & PV Plant Level O&M Performance Comparisons 5
TB-9 FPL’s/Gulf’s Total O&M and CAPEX Maintenance Expenditure, 6
Heat Rate & EFOR Comparisons 7
Q. Are you sponsoring or co-sponsoring any consolidated Minimum Filing 8
Requirements (“MFRs”) in this case? 9
A. Yes. Exhibit TB-1 lists the consolidated MFRs that I am sponsoring or co-10
sponsoring. 11
Q. Are you sponsoring or co-sponsoring any schedules in “Supplement 1 – FPL 12
Standalone Information in MFR Format” and “Supplement 2 – Gulf 13
Standalone Information in MFR Format”? 14
A. Yes. Exhibit TB-2 lists the supplemental FPL and Gulf standalone information in 15
MFR format that I am sponsoring or co-sponsoring. 16
Q. How will you refer to FPL and Gulf when discussing them in testimony? 17
A. When discussing operations or time periods prior to January 1, 2019 (when Gulf 18
was acquired by FPL’s parent company, NextEra Energy, Inc.), “FPL” and “Gulf” 19
will refer to their pre-acquisition status, when they were legally and operationally 20
separate companies. For operations or time periods between January 1, 2019 and 21
January 1, 2022, “FPL” and “Gulf” will refer to their status as separate ratemaking 22
entities, recognizing that they were merged legally on January 1, 2021 and 23
h
6
consolidation proceeded throughout this period. Finally, operations or time 1
periods after January 1, 2022 are referred to as FPL only because Gulf will be 2
consolidated into FPL. Therefore, unless otherwise noted, my testimony addresses 3
requests for the consolidated company. 4
Q. What is the purpose of your testimony? 5
A. The purpose of my testimony is to support the reasonableness of the fossil/solar 6
generating fleet non-fuel operating and maintenance expenses (“O&M”) and 7
capital expenditures (“CAPEX”) in providing service to customers. My testimony 8
addresses two major areas: (1) fossil/solar generating fleet performance; and (2) 9
fossil/solar generating fleet non-fuel O&M and maintenance/reliability CAPEX 10
for the integrated FPL fleet. I convey that FPL aggressively manages its operating 11
costs and remains one of the most cost-efficient generating utilities in the nation. 12
At the same time, FPL has lowered its operating costs and has improved its overall 13
performance since the last base rate proceeding. I further demonstrate that the 14
FPL and Gulf fleets have provided and, with appropriate rate adjustments covering 15
projected costs, the combined FPL fleet will continue to provide customers with 16
reliable and even more efficient and cost-effective service. 17
Q. Please summarize your testimony. 18
A. Over the last thirty years, FPL has continuously transformed its fossil/solar 19
generating fleet and has substantially improved its operating performance across 20
key indicators integral to the reliable and cost-efficient generation of electricity for 21
customers (as shown on Exhibits TB-3 and TB-4). Also, among large electric 22
utility fossil fleets over the last 15 years (as shown on Exhibit TB-5), FPL’s 23
h
7
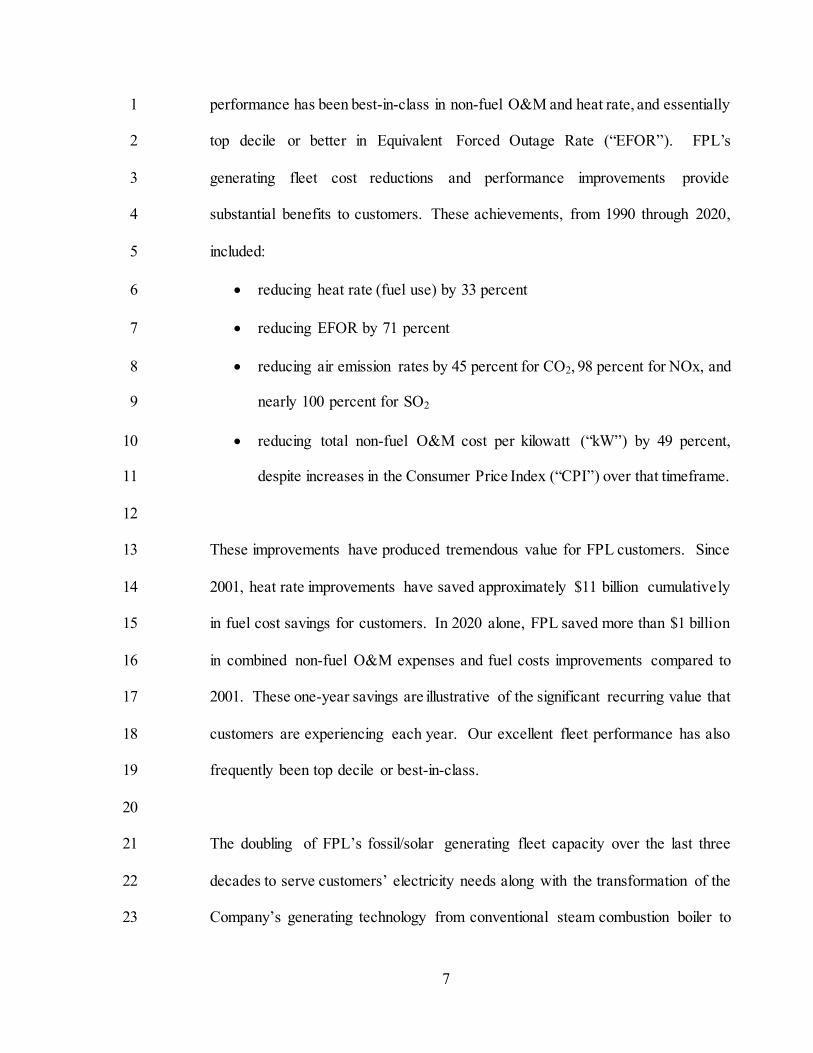
performance has been best-in-class in non-fuel O&M and heat rate, and essentially 1
top decile or better in Equivalent Forced Outage Rate (“EFOR”). FPL’s 2
generating fleet cost reductions and performance improvements provide 3
substantial benefits to customers. These achievements, from 1990 through 2020, 4
included: 5
reducing heat rate (fuel use) by 33 percent 6
reducing EFOR by 71 percent 7
reducing air emission rates by 45 percent for CO2, 98 percent for NOx, and 8
nearly 100 percent for SO2 9
reducing total non-fuel O&M cost per kilowatt (“kW”) by 49 percent, 10
despite increases in the Consumer Price Index (“CPI”) over that timeframe. 11
12
These improvements have produced tremendous value for FPL customers. Since 13
2001, heat rate improvements have saved approximately $11 billion cumulatively 14
in fuel cost savings for customers. In 2020 alone, FPL saved more than $1 billion 15
in combined non-fuel O&M expenses and fuel costs improvements compared to 16
2001. These one-year savings are illustrative of the significant recurring value that 17
customers are experiencing each year. Our excellent fleet performance has also 18
frequently been top decile or best-in-class. 19
20
The doubling of FPL’s fossil/solar generating fleet capacity over the last three 21
decades to serve customers’ electricity needs along with the transformation of the 22
Company’s generating technology from conventional steam combustion boiler to 23

h
8
other cleaner, more efficient combined cycle (“CC”) and free-fuel solar 1
photovoltaic (“PV”) units are key drivers of FPL’s operating improvements (as 2
reflected in Exhibits TB-3 through TB-6). FPL’s outstanding performance 3
improvements provide customers with cleaner, more cost-effective and fuel-4
efficient generation. Maintenance/reliability CAPEX and non-fuel O&M funding 5
are essential to providing these performance improvement benefits, and PGD’s 6
prudent management of these funds plays a significant role in achieving our 7
exceptional generating fleet performance. Furthermore, the integration of FPL and 8
Gulf into one utility is allowing us to take full advantage of our demonstrated 9
strengths and bring further benefits to customers. 10
11
II. FOSSIL/SOLAR GENERATING FLEET PERFORMANCE 12
13
Q. What indicators does FPL use to measure the operating performance of its 14
fleet of generating units? 15
A. FPL uses a number of indicators to measure the performance of its fleet. These 16
indicators include, among others shown on Exhibit TB-4: heat rate to measure the 17
amount of fuel used to produce a unit of electricity; EFOR to measure reliability; 18
and non-fuel O&M in dollars per installed kW of capacity (“$/kW”) to measure 19
resource management cost effectiveness. As shown in the exhibits to my 20
testimony, the indicators for FPL’s generating fleet performance compare very 21
favorably with the energy industry as well as with FPL’s long-term historical 22
performance. 23
h
9
Q. Please describe the indicator FPL uses to measure generating efficiency. 1
A. The key indicator of generating efficiency in converting fuel to electricity is heat 2
rate, measuring the amount of fuel required to generate a kilowatt hour (“kWh”) 3
of power. Heat rate is expressed in British Thermal Units per kilowatt-hour 4
(“Btu/kWh”) and calculated by dividing the total Btu heat input (from fuel burned) 5
by the net kWh of electricity produced by those units. Significantly, the lower the 6
heat rate, the less fuel is required to generate the same amount of electricity, and 7
the greater the customer savings in fuel costs. 8
Q. What actions have been taken to achieve and maintain generating fleet heat 9
rate performance improvements to date? 10
A. As shown in Exhibit TB-6-Pg.1, system heat rate performance gains have been 11
achieved by constructing new, highly efficient gas-fired combined cycle units, and 12
by converting older power plants into modern combined cycle units. These new 13
units, along with upgrading our turbine and combustion technology, provide 14
significant fuel cost savings to customers and reduced air emissions while utilizing 15
existing sites. Integrating new, fuel-free solar plants into the generating fleet is 16
further improving performance by generating electricity without fuel use. 17
18
Additionally, maintaining power plant operating performance is essential because 19
generating equipment wears and deteriorates over time, necessitating efforts to 20
minimize heat rate degradation and restore lost generating unit performance. 21
Sustaining the operational performance of this growing fleet of fuel-efficient 22
facilities requires ongoing CAPEX to support this equipment maintenance. 23
h
10
Q. Has the generating efficiency of FPL’s fleet improved over time? 1
A. Yes. FPL’s long term generating efficiency improvement is included in Exhibit 2
TB-4, showing a generating fleet heat rate reduction from 10,214 Btu/kWh to 3
6,878 Btu/kWh, representing a 33 percent efficiency improvement from 1990 4
through 2020. As further highlighted on Exhibit TB-6-Pg.1, an improvement in 5
heat rate (29 percent) occurred between 2001 and 2020, representing 6
approximately $11 billion in cumulative fuel cost savings for customers over that 7
timeframe, and more than half a billion dollars in 2020 alone. Since 2017, the fleet 8
heat rate has improved by 8 percent. Although fuel prices may vary in the future, 9
FPL customers will always have lower relative fuel charges because of FPL’s 10
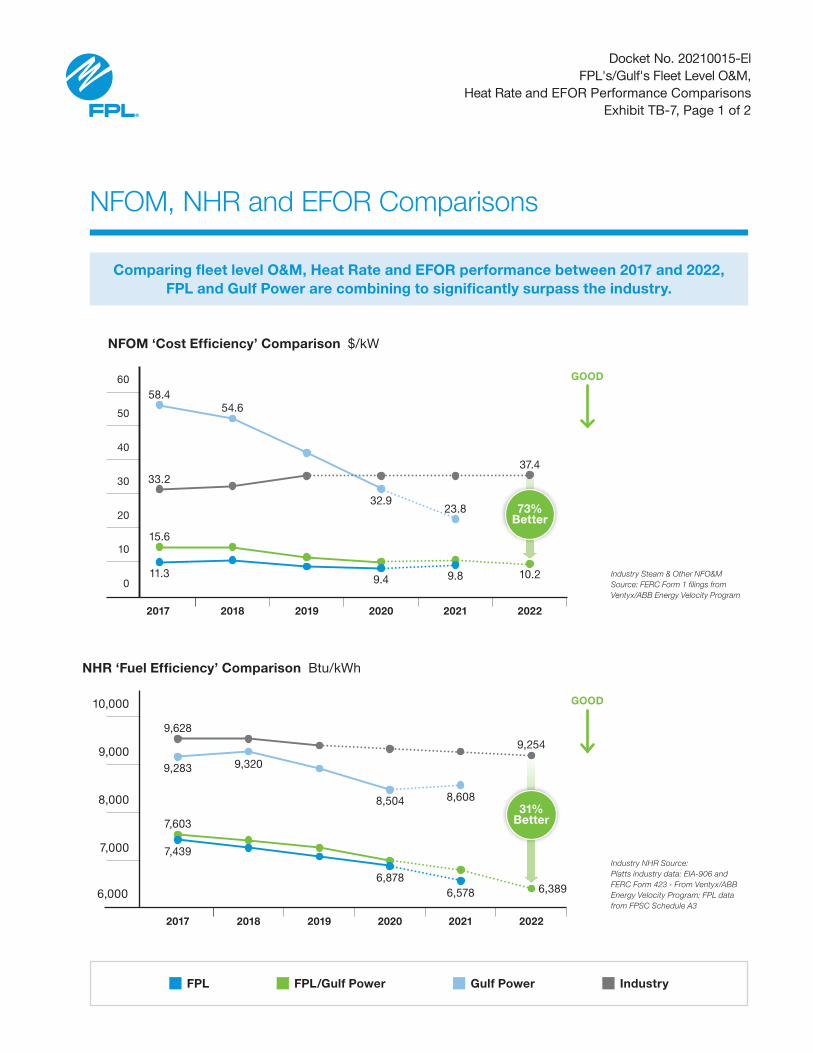
generating efficiency improvements. Additionally, Exhibit TB-7 reflects that both 11
FPL and Gulf have actual and projected heat rate trend improvements from 2018, 12
Gulf’s pre-acquisition year, into the future as both fleets are integrated, further 13
modernized, and improved. 14
Q. How does FPL’s generating fleet heat rate performance compare to that of 15
others in the industry? 16
A. As shown on Exhibit TB-6-Pg. 1, FPL’s generating fleet heat rate compares 17
extremely favorably to the industry. Between 2001 and 2019, the industry average 18
heat rate improved less than ten percent (from 10,472 Btu/kWh to 9,476 Btu/kWh). 19
In contrast, FPL’s heat rate improved more than 25 percent (from 9,635 Btu/kWh 20
to 7,070 Btu/kWh) over the same period. In fact, FPL’s fleet heat rate improved 21
5 percent in just two years’ time from 2017 to 2019 (roughly three times the 22
industry improvement over this period) due to several key actions: (a) retiring 23

h
11
2,800 MWs of less-efficient coal and oil/gas burning fossil steam capacity; (b) 1
adding approximately 1,720 MWs of highly-efficient combined cycle capacity; 2
and (c) adding 900 MWs of solar plants. FPL’s generating fleet heat rate 3
performance also has been best-in-class every year over the last 15 years as shown 4
on Exhibit TB-5. 5
6
Also, as shown on Exhibit TB-7, FPL’s / Gulf’s respective and combined fleet 7
heat rates are much better than the average industry performance. Heat rates are 8
expected to continue improving as the combined FPL / Gulf fleet is further 9
transformed to more-efficient modernized technology. 10
Q. Please explain how a modernized generating fleet using combined cycle and 11
solar units benefits customers. 12
A. FPL’s generating plant technology transformation to combined cycle and solar 13
powered units improves overall fleet heat rate performance, benefiting customers in 14
three important ways: avoiding fuel cost, avoiding oil use, and avoiding air 15
emissions. As shown on Exhibit TB-6-Pg. 2 for example, from 2001 through 2020, 16
FPL’s cumulative 29 percent heat rate improvement contributed benefits, as follows: 17
~ $11 billion of fuel costs avoided 18
~ 600 million barrels of oil burn avoided 19
~ 165 million tons of CO2 emissions avoided 20
21
In simple terms, a 29 percent heat rate improvement in FPL’s generating fleet since 22
2001 represents more than half a billion dollars in fuel cost savings in 2020 alone. 23

h
12
Since 1990, FPL has reduced its fossil/solar generating fleet CO2 emission rate by 1
45 percent and reduced NOx and SO2 emission rates by 98 and nearly 100 percent, 2
respectively (as shown on Exhibit TB-4). This impressive achievement has 3
resulted in a reduced rate of greenhouse gas and other air emissions, thereby 4
contributing to a cleaner environment. Additionally, our modern, state-of-the-art 5
power plants require significantly fewer people than the older power plants they 6
replaced, also providing non-fuel O&M cost savings for customers. FPL’s fleet 7
fuel cost savings and emission benefits from efficiency improvements will 8
continue to grow as new and modernized units are placed in service. The planned 9
addition of approximately 2,900 MW of highly efficient combined cycle / solar / 10
battery storage generation from 2021 through 2022, coupled with the retirement 11
of nearly 2,300 MW of coal and oil/gas burning fossil steam units, further 12
exemplify the Company’s commitment both to fuel cost reduction and 13
environmental sustainability. 14
Q. Please describe the indicator used to measure plant reliability. 15
A. EFOR represents generating plant reliability and is a measure of a unit’s inability 16
to provide electricity when dispatched to operate. EFOR is reported as the 17
percentage of hours when a generating unit could not deliver electricity relative to 18
all the hours during which that unit was called upon to operate. FPL and Gulf 19
continually strive for, and have achieved, low generating fleet EFOR. This results 20
in greater availability of efficient generating capacity for customers. 21
22
23
h
13
Q. Has the EFOR of the generating fleet also improved over time? 1
A. Yes. As shown on Exhibit TB-4, the EFOR of FPL’s generating fleet has been 2
reduced more than 71 percent (from 1990 through 2020), and as shown on Exhibit 3
TB-7, both FPL and Gulf’s EFORs are exceptionally low, signifying highly 4
reliable generating fleets. 5
Q. How does the EFOR of FPL’s and Gulf’s generating fleets compare to the 6
industry? 7
A. Among large electric utility fossil fleets over the last 15 years, FPL has essentially 8
been a top decile or better EFOR performer as shown on Exhibit TB-5. Also, both 9
FPL’s and Gulf’s generating fleet EFOR performance, currently averaging 0.8 10
percent, have significantly outperformed the higher latest industry average of 8.4 11
percent as shown on Exhibit TB-7. Both fleets’ EFORs are also considered best-12
in-class performance. 13
Q. How does excellent generating fleet EFOR performance benefit customers? 14
A. Excellent fleet EFOR performance represents better reliability and provides more 15
opportunity for highly efficient capacity to operate and minimize customer fuel 16
costs and air emissions. 17
Q. Please summarize the operating performance of FPL’s generating fleet. 18
A. As discussed previously, the transformation of FPL’s generating fleet since 1990 19
(referenced on Exhibit TB-3) has enabled significant performance improvement 20
across key indicators (as shown on Exhibit TB-4) integral to generating electricity 21
for our customers. These performance improvements include: 22
reducing heat rate (fuel use) by 33 percent 23
h
14
reducing EFOR by 71 percent 1
reducing air emission rates by 45 percent for CO2, 98 percent for NOx and 2
nearly 100 percent for SO2 3
reducing total non-fuel O&M cost per kW by 49 percent (see Section III 4
below) 5
6
In brief, FPL’s fossil generating fleet has industry-leading performance, either top 7
decile or best-in-class. In fact, as shown on Exhibit TB-5, among large electric 8
utility fossil fleets over the last 15 years, FPL’s performance has been best-in-class 9
in non-fuel O&M and heat rate, and essentially top decile or better in EFOR. This 10
superior performance in these metrics is expected to continue, or get even better, 11
in the future with sustained financial ability to make the changes and investments 12
needed, along with the integration of best practices between the two companies. 13
Q. What has been FPL’s generating fleet performance improvement since its last 14
rate case? 15
A. From 2017 – 2020, FPL’s Fossil/Solar Fleet performance improvements include: 16
reducing heat rate by 8 percent 17
reducing EFOR by 64 percent 18
reducing air emission rates by 13 percent for CO2, 54 percent for NOx and 19
80 percent for SO2 20
reducing total non-fuel O&M cost per kW by 16 percent 21

h
15
Q. How has PGD integrated FPL and Gulf operations to become one utility? 1
A. PGD is supporting the combined utility generating system functioning as one 2
company in all respects including a common set of generation resources with 3
functionally integrated operations. PGD’s overall strategy was not to wait, but to 4
integrate Gulf early on upon acquisition. This proactive plan included readying 5
systems and applications to drive efficiencies and involved such facets as: 6
o People and culture 7
o Safety reviews and practices 8
o Integrating operational and maintenance processes 9
o Integrating Engineering and Central Maintenance staff organizations 10
o Quality and Six Sigma training 11
o Production Health Dashboard integration 12
o Cost controls and reviews (weekly and monthly) 13
o Production metric controls and reviews (weekly and monthly) 14
15
As an operationally consolidated company, FPL is well-positioned to continue 16
driving costs below the national average, while optimizing its generation, 17
including: 18
– Increased fuel diversity and efficiency 19
– Reduced emissions 20
– Excellent reliability and resilience 21
– Shared best practices 22

h
16
– Improved asset management 1
– Improved opportunity for coordinated storm response 2
Q. What improvements are occurring on the Gulf system? 3
A. As shown on Exhibit TB-7, since Gulf’s 2018 pre-acquisition status, a number of 4
ongoing operating improvement areas include: 5
o EFOR has improved approximately 90 percent, from 3.2 percent in 2018 6
to 0.3 percent in 2020 – representing top decile to best-in-class 7
performance. 8
o Heat rate has improved approximately 8 percent from 9,320 Btu/kWh in 9
2018 down to about 8,500 Btu/kWh in 2020. Combined cycle Plant Smith 10
combustion turbine upgrades completed in 2019 increased base load 11
capacity by approximately 100 MW, and along with the Blue Indigo PV 12
Solar Site addition, are contributing to this greater generation efficiency. 13
o Non-fuel O&M has also markedly decreased in total dollar cost, from $124 14
million in 2018 to $80 million in 2020. In terms of $/kW, non-fuel O&M 15
cost has likewise decreased 40 percent from approximately $55/kW in 16
2018 to $33/kW in 2020. This $/kW cost performance improvement from 17
2018 to 2020 means that Gulf’s competitive position went from being 60 18
percent higher than the fossil generating industry average to 12 percent 19
below in the last two years. 20
o Additionally, CO2 emission rates improved 18 percent over the same 2018 21
to 2020 period consistent with the combined cycle and solar plant capacity 22
additions mentioned above and general shift away from coal fuel. 23
h
17
Also, management’s actions have produced a significant decrease in Gulf’s 1
Environmental Cost Recovery Clause costs, and productivity, reflected as 2
megawatts managed per employee, improved from 8.5 in 2017 to approximately 3
23 in 2020. Furthermore, various additional actions underway or planned (unit 4
modernizations, additions, retirements and fuel conversions) would further 5
contribute to improvements in EFOR, O&M, fuel efficiency, and emission rates. 6
In fact, by the end of 2021, Gulf will have added three 74.5 MW solar facilities to 7
their service area, providing 224 megawatts of fuel-free energy to Northwest 8
Florida. 9
Q. Has the Gulf acquisition provided any benefits to FPL’s generation fleet? 10
A. Yes. In addition to Gulf’s highly reliable generating fleet, Gulf brought a separate 11
labor force that now provides an overall larger, high-quality team to draw from for 12
emergency and storm support. The combined entities also result in increased cost-13
efficiency and enhanced operations through best practice sharing. Furthermore, 14
Gulf’s workforce brings with it several important qualities: 15
o A proven dedication to reliable generation operations. 16
o Strong operational talent that allows for additional resource sharing to 17
maintain reliability. 18
o The ability to provide storm support through a diversified and 19
expanded presence in Florida. 20
21
22

h
18
III. FOSSIL/SOLAR GENERATING FLEET NON-FUEL O&M AND CAPEX 1
2
Q. How has FPL improved the generating fleet’s non-fuel O&M over time? 3
A. We have worked aggressively to reduce and contain expenses over the last three 4
decades despite a 97 percent cumulative increase in CPI. During that timeframe, 5
FPL’s total non-fuel O&M per unit of installed capacity was reduced 49 percent, 6
from $18.5//kW in 1990 to $9.4/kW in 2020 (as shown on Exhibit TB-4). Another 7
indication of FPL’s excellent O&M performance (as depicted on Exhibit TB-5), is 8
when comparing to latest available 2019 industry peer group average cost 9
($37.5/kW), FPL’s $9.5/kW cost is 75 percent lower. In addition, if FPL’s 10
generating fleet cost of $18.5/kW in 1990 was escalated by CPI to 2020, it would 11
be $36.6/kW, or notably more than triple FPL’s $9.4/kW actual cost. Given FPL’s 12
2020 fleet capacity of about 25,000 MW, this approximate $27/kW difference 13
versus either the industry average or FPL’s CPI-escalated cost since 1990 14
represents significant annual non-fuel O&M savings of more than $600 million in 15
2020 alone. 16
17
Since 2017 alone, FPL’s Fossil/Solar Fleet reduced total non-fuel O&M cost per 18
kW by 17 percent from $11.3 to $9.4. Additionally, Exhibit TB-5 shows that over 19
the last 15 years, FPL’s generating fleet has been best-in-class in total non-fuel 20
O&M per kW among its large electric utility fleet peers. FPL witness Reed’s 21

h
19
Productive Efficiency O&M comparison (Exhibit JJR-6, page 12) further supports 1
FPL’s production fleet non-fuel O&M performance excellence. 2
3
Contributing to FPL’s overall excellent generating fleet cost performance is 4
PGD’s resource management improvements as shown on Exhibit TB-4, indicating 5
that by 2020, FPL’s generating fleet staffing per MW of capacity was about 80 6
percent less than it was in 1990. 7
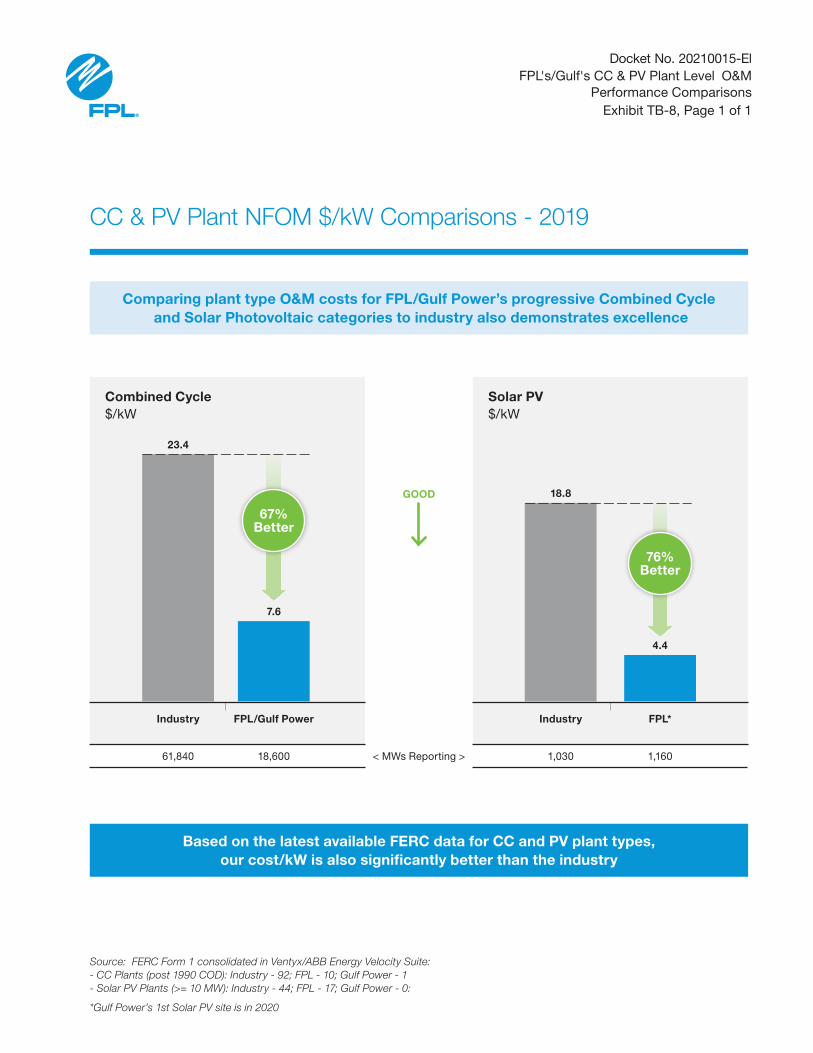
Q. Considering that combined cycle and solar photovoltaic plants are becoming 8
an increasingly greater factor in FPL’s expanding and improving operating 9
fleet, how does FPL’s O&M performance for these plant types compare to 10
the industry’s performance with the same CC and PV technologies? 11
A. In a separate comparison of these transformative CC and PV technology plants 12
shown on Exhibit TB-8, both FPL and Gulf performed at superior levels in the CC 13
plant O&M cost category (roughly 70 percent better) compared to the industry. 14
FPL’s solar PV plant group’s performance was also strong. 15
Q. How does PGD operate and maintain its solar sites to achieve their superior 16
cost efficiency? 17
A. FPL currently has 33 operating solar sites in Florida comprising approximately 18
2,300 MW of total installed generating capacity, which is expected to grow. To 19
successfully operate and maintain these sites, PGD typically applies the principles 20
of automation, lean staffing, and cost-effective maintenance and inspection 21
practices, for example using drone technology. As mentioned by FPL witness 22
Valle, FPL developed and continues to improve advanced monitoring technology 23
h
20
and performance analysis tools for its solar energy centers. FPL uses these tools 1
to optimize plant operations, drive process efficiencies, and facilitate the 2
deployment of technical skills as demand for services grows. In 2017, FPL 3
established a Renewable Operations Control Center (“ROCC”) to serve as the 4
centralized remote operations center for all FPL PV solar and energy storage 5
facilities. The ROCC provides a mechanism to efficiently manage daily work 6
activities and ensure effective deployment of best operating practices at all of 7
FPL’s renewable energy centers. The FPL team has leveraged these capabilities 8
along with its broad range of experience to develop robust and industry-leading 9
operating plans that deliver high levels of reliability and availability at low cost. 10
Q. How does PGD’s 2022 Test Year and 2023 Subsequent Year projected levels 11
of base non-fuel O&M for the Steam and Other Production functions 12
compare to the Commission’s benchmarks on MFR C-41? 13
A. PGD’s Steam and Other Production levels of base non-fuel O&M for both the 14
2022 Test Year and the 2023 Subsequent Year are well below the MFR C-41 O&M 15
benchmark levels on both a portfolio and functional basis for both FPL and Gulf, 16
as well as on a PGD consolidated level. For the 2022 Test Year, PGD’s base non-17
fuel O&M funds request is approximately $106 million below the benchmark. 18
PGD’s base non-fuel O&M funds request is approximately $102 million below the 19
benchmark for the 2023 Subsequent Year. This is an impressive accomplishment 20
given the addition of two CC plants (~2,900 MW), four CTs (~900 MW), 55 large-21
scale solar PV plants (~4,000 MW), and three battery energy storage sites (~470 22
MW) since 2018, the base year of FPL’s O&M benchmark calculation. 23

h
21
As shown on Exhibit TB-3, FPL distinctively transformed and modernized its 1
generating fleet portfolio which, along with our aggressive efforts to reduce and 2
contain expenses, avoided significant O&M costs for customers, reduced air 3
emissions, reduced oil fuel reliance, significantly improved operating fleet 4
performance, and made FPL an industry leader in low-cost generation. 5
Q. Comparing the 2022 Test Year to the 2021 Prior Year, are there any accounts 6
in which the change to PGD non-fuel O&M exceeds the threshold defined in 7
MFR C-8? 8
A. FPL has three accounts (502, 510, and 512) that are favorable to the defined 9
thresholds as reductions referenced in MFR C-8, and one account (549) that has 10
increased. I will address each such account. 11
12
Decrease of FERC Steam Production Account 502 – Steam Expenses: The $10.3 13
million decrease in this category is primarily attributable to the Gulf Clean Energy 14
Center (formerly known as Plant Crist) plant conversion from coal to natural gas, 15
which eliminated the need for limestone for the scrubbers. Additional reductions 16
were achieved with the Scherer Unit 4 and Manatee Units 1 & 2 steam plant 17
retirements. 18
19
Decrease of FERC Steam Production Account 510 - Maintenance Supervision and 20
Engineering: The $5.0 million decrease in this category is primarily attributable 21
to the Scherer Unit 4 and Manatee Units 1 & 2 steam plant retirements. 22
23
h
22
Decrease of FERC Steam Production Account 512 - Maintenance of Boiler Plant: 1
The $16.6 million decrease in this category is primarily attributable to the Gulf 2
Clean Energy Center plant conversion from coal to natural gas, which eliminated 3
the need for limestone and the associated O&M costs to operate and maintain its 4
scrubbers. There are also staff reductions that reflect a more efficient natural gas 5
plant configuration as well as reduced maintenance. Additional reductions were 6
achieved with the Scherer Unit 4 and Manatee Units 1 & 2 steam plant retirements. 7
8
Increase of FERC Other Production Account 549 – Miscellaneous Other Power 9
Generation Expenses: The approximate $6.9 million increase in this category is 10
related to the addition of six solar sites in 2022 that total approximately 447 MW 11
of clean generating capability as well as the creation of a consolidated control 12
room and fossil center of work excellence for the combined cycle fleet. 13
Q. Regarding CAPEX, are there any significant long-term infrastructure 14
capacity additions or replacements that will deliver improved system 15
reliability or economic benefits? 16
A. Yes. Based upon our 2020 Ten Year Site Plan (“TYSP”), in addition to the 2,600 17
MW of generating capability (approximately 1,720 CC MWs plus 900 PV MWs) 18
added from 2017 to 2019, FPL’s and Gulf’s roughly 5,000 MW of projected 19
generating capacity additions from 2020 to 2022 focus on several key areas: 33 20
new solar sites comprising approximately 2,450 MW total installed renewable 21
capacity; 2,200 MW of oil and coal steam unit retirements (at two sites); 1,200 22
MW of modernized combined cycle capacity (the Dania Beach Clean Energy 23
h
23
Center “DBEC” Unit 7); 938 MW of new fast-starting CTs (at the Gulf Clean 1
Energy Center); and approximately 470 MW of battery energy storage capacity 2
charged by fuel-free solar generation, with the largest 409 MW battery facility in 3
2021 to partially offset the retirement of Manatee Units 1 & 2. This 409-megawatt 4
Manatee Energy Storage Center will be the world’s largest integrated solar 5
powered battery system. 6
7
In summary, FPL projects to add, or will have added, approximately 8,400 MW 8
total of new generating capacity from 2017 to 2023 with more than 50 percent 9
Solar PV/Battery Storage capacity versus Natural Gas CC/GT capacity. In 2024 10
and 2025, FPL projects to add even more PV solar capacity (see FPL witnesses 11
Valle and Sim’s testimony for 2024 and 2025 site additions). The reliable 12
operation and maintenance of this additional highly efficient generating capability 13
will also become PGD’s functional responsibility. 14
Q. How will these new generation additions deliver improved system reliability 15
or economic benefits? 16
A. These new generation additions cited above will continue and, in some cases, 17
improve the excellent performance and operational metrics that I have discussed 18
previously and have shown on my Exhibit TB-4. 19
Q. Apart from the new generation that you just discussed, are there any 20
additional CAPEX projects that will improve fleet performance? 21
A. Yes. There are several combined cycle generation upgrade projects that FPL is 22
undertaking to provide greater generating efficiency and higher power outputs. 23
h
24
Additionally, in 2020, we initiated the fuel conversion of Gulf’s Clean Energy 1
Center Units 6 & 7 from coal to cleaner natural gas which, as noted in FPL’s 2020 2
TYSP, is expected to result in both lower cost energy generated by the units and 3
significant cost savings. 4
Q. Would you please provide detail on the generation upgrade projects that you 5
mentioned? 6
A. Yes. As referenced in the direct testimony of FPL witness Bores, there are several 7
key generation upgrade projects that FPL has undertaken to provide benefits for 8
customers. These upgrade projects across nine combined cycle units, primarily 9
involving 26 General Electric (GE) and 9 Mitsubishi CTs, are projected to result 10
in approximately $780 million in cumulative present value of revenue 11
requirements (“CPVRR”) savings over their operating life. Besides an 12
incremental generating fleet efficiency improvement, the total projected peak 13
capacity addition from these upgrades through 2022 is more than 1,000 MW. 14
Q. Would you please discuss the plant conversion of Gulf’s Clean Energy Center 15
Units 6 & 7? 16
A. Yes. In 2020, Gulf converted the former Crist Units 6 & 7 from coal to burning 17
cleaner natural gas. The result of this project is this plant now runs 100 percent 18
on natural gas providing labor, materials and contractor savings. Specifically, a 19
natural gas plant configuration enabled headcount reductions of over 60 personnel 20
in 2020 and expected materials and contractor savings of approximately $11.5 21
million from 2022 forward. 22
23

h
25
The primary savings from the conversion are decreases in FERC non-fuel O&M 1
cost steam production accounts 502 and 512. These decreases are referenced 2
previously in my testimony and are integrated into the improving Gulf fleet O&M 3
cost trend shown on my Exhibit TB-7. This coal-to-gas fuel conversion results in 4
reduced CO2 emission rates of over 40 percent at the Gulf Clean Energy Center 5
which complements continued emission rate reductions summarized in fleet level 6
operating metrics shown on my Exhibit TB-4. 7
Q. What are FPL’s / Gulf’s actual and projected generating fleet non-8
construction CAPEX over the 2017-2023 period? 9
A. “Non-construction” refers to all operating plant overhaul and non-overhaul 10
maintenance/reliability capital expenditures. FPL’s / Gulf’s total fleet average 11
non-construction CAPEX over the 2017 to 2023 timeframe is approximately $630 12
million annually. Approximately 75 percent of that CAPEX over the final five 13
years is comprised of overhaul-related costs, and those expenditures are essential 14
in maintaining reliability and minimizing fuel usage. 15
Q. What is the definition of a “major overhaul”? 16
A. A major overhaul is defined as an overhaul that is performed on larger equipment 17
components, such as CTs, and has a duration of 21 days or greater. 18
Q. What are the key drivers of the number of Major Overhauls scheduled for 19
2022? 20
A. The number of major overhauls required to be performed in 2022 are primarily 21
due to the growth of our fleet and the timing and number of units added over the 22
last two decades. From 2001 through 2022, FPL will have added more than 17,000 23
h
26
MW of combined and simple cycle units at 16 generating units on 11 different 1
sites. These include about 60 new CTs and their associated major components – 2
generators, heat recovery steam generators (“HRSG”) and steam turbine 3
generators, along with the balance of plant equipment (motors, fans, valves, etc.). 4
Each of these major components periodically requires a major overhaul, but the 5
cycle varies depending upon the manufacturer of the equipment and the type of 6
component. 7
8
To secure the operational benefits of this growing fleet of fuel-efficient facilities, 9
ongoing maintenance and associated CAPEX is necessary. There are 10
approximately eight major overhauls scheduled to be performed in 2022. A Hot 11
Gas Path for the Combustion Turbines is scheduled for Cape Canaveral Unit 3. 12
Generator Minor outages are scheduled at Port Everglades Unit 5 and for Ft. Myers 13
Unit 3. A Combustion Turbine Inspection is scheduled at Lauderdale Unit 6. A 14
Steam Turbine Major is scheduled at Martin Unit 3. At West County, a 15
Combustion Turbine and Generator Major is scheduled at Unit 1 and a Steam 16
Turbine and Generator Major is scheduled at Unit 2. Major overhauls are 17
necessary to maintain unit and system efficiency, performance and reliability. 18
Q. Are these overhaul expenses in 2022 unusual? 19
A. No. For FPL, base non-fuel O&M overhaul expenses for the period of 2017 20
through 2023 average approximately $34.9 million per year. The 2022 base non-21
fuel O&M overhaul expense forecast is approximately $34.4 million. As 22

h
27
discussed earlier, FPL and Gulf are significantly below base non-fuel O&M 1
benchmarks. 2
Q. What steps have FPL and Gulf taken, or is FPL planning to take, to reduce 3
O&M and CAPEX associated with operating and maintaining the generating 4
fleet? 5
A. PGD’s cost practices and procedures for controlling expenses have resulted in its 6
continually-improving cost profile as shown in Exhibits TB-4, TB-7, and TB-9. 7
Both O&M and capital cost discipline is a day-to-day priority throughout PGD. 8
We aggressively strive for continual operational excellence along with sharing and 9
replicating cost efficiency improvements across the generating fleet. FPL has 10
further implemented and continues to undertake significant actions to reduce costs 11
primarily through retiring approximately 5,000 MW of older, less efficient 12
generating units over the 2017 to 2022 timeframe as discussed in FPL’s 2020 13
TYSP including: Lauderdale Units 4 & 5 (900 combined MW), Martin Units 1 & 14
2 (1,600 combined MW), St. Johns River Power Park Coal Plant (250 MW share), 15
Manatee Units 1&2 (1,600 combined MW), and Scherer 4 Coal Unit (600 MW 16
share). Gulf is further projected to be retiring approximately 600 MW of coal-17
fueled capacity at the Gulf Clean Energy Center along with its ownership portion 18
of Plant Daniel Units 1 and 2 during the subsequent three-year (2023 - 2025) 19
period, further reducing emission rates. 20
21
Also, as mentioned earlier, contributing to FPL’s overall excellent generating fleet 22
cost performance is PGD’s substantial resource management (staffing rate) 23

h
28
improvement as shown on Exhibit TB-4. Our modern, state-of-the-art power 1
plants require significantly fewer people than the older power plants they replaced. 2
Our solar power plants require even lower staffing. 3
Q. Are FPL’s generating fleet O&M and CAPEX forecasts reasonable? 4
A. Yes. For the reasons outlined in detail in my testimony and exhibits, FPL’s 2022 5
test year and 2023 subsequent year generating fleet O&M and CAPEX forecasts 6
are reasonable and reflect our intentions for continued superior performance. As 7
discussed previously, PGD has the leadership and performance track record for 8
managing and sustaining excellent generating fleet performance. Summarizing: 9
PGD’s commitment to low-cost, reliable generating fleet performance has 10
been demonstrated by holding non-fuel O&M $/kW cost essentially level 11
for the last 30 years despite inflation, resulting in best-in-class cost 12
performance. 13
Our investments have provided and will continue to provide long-term 14
customer benefits through direct operating or maintenance cost savings, 15
increased generating efficiency that provides fuel and air emission 16
avoidance, and maintained or improved system reliability. 17
Ongoing maintenance in the form of additional reliability overhauls and 18
spare parts however is required to continue achieving the operational 19
benefits of this growing fleet of fuel-efficient facilities. FPL has a 20
demonstrated track record, as my testimony and exhibits demonstrate, to 21
ensure such costs are reasonable and prudent. 22
h
29
In addition to FPL’s proven track record of providing cost-effective, 1
reliable, efficient power, our combined total non-fuel O&M and CAPEX 2
compares well to industry-weighted CC/PV/Coal technology costs 3
developed by the U.S. Department of Energy’s Energy Information 4
Administration (“EIA”). 5
Essentially, FPL’s combined fleet $/kW costs outperform the industry 6
across various comparative views, whether: 7
o by total fleet non-fuel O&M on Exhibit TB-7; 8
o by key plant type (CC and PV) non-fuel O&M on Exhibit TB-8; 9
o or by their combined total non-fuel O&M and CAPEX Major 10
Maintenance expenditures versus EIA’s industry-weighted 11
CC/PV/Coal cost on Exhibit TB-9. 12
In all cases, FPL’s costs are lower and more economical for customers 13
while providing better heat rate and reliability. Our value proposition 14
continues to get even better through investment, operational 15
improvements, and cost-efficient performance. PGD has demonstrated 16
prudent management of its operations over extended periods, with 17
exceptionally positive results, and as an organization is enthusiastic and 18
focused on continuing to transform and improve the consolidated FPL 19
generating fleet to provide even more cost-effective, reliable, and 20
environmentally friendly power for customers. 21
Q. Does this conclude your direct testimony? 22
A. Yes, it does. 23

Docket No. 20210015-EIConsolidated MFRs Sponsored or Co-Sponsored by Thomas Broad
Exhibit TB-1, Page 1 of 1
Florida Power & Light Company
MFR Period Title
B-18PriorTestSubsequent
FUEL INVENTORY BY PLANT
B-15TestSubsequent PROPERTY HELD FOR FUTURE USE - 13 MONTH AVERAGE
B-24TestSubsequent LEASING ARRANGEMENTS
C-08TestSubsequent DETAIL OF CHANGES IN EXPENSES
C-15HistoricTestSubsequent
INDUSTRY ASSOCIATION DUES
C-34HistoricSubsequent STATISTICAL INFORMATION
C-41TestSubsequent O & M BENCHMARK VARIANCE BY FUNCTION
C-43TestSubsequent SECURITY COSTS
F-08TestSubsequent ASSUMPTIONS
CONSOLIDATED MFRs SPONSORED OR CO-SPONSORED BY THOMAS BROAD
SOLE SPONSOR:
CO-SPONSOR:

Docket No. 20210015-EISupplemental FPL and Gulf Standalone Information in MFR Format
Sponsored or Co-Sponsored by Thomas BroadExhibit TB-2, Page 1 of 2
Florida Power & Light Company
Schedule Period Title
B-18TestSubsequent FUEL INVENTORY BY PLANT
B-15TestSubsequent PROPERTY HELD FOR FUTURE USE - 13 MONTH AVERAGE
B-24TestSubsequent LEASING ARRANGEMENTS
C-08TestSubsequent DETAIL OF CHANGES IN EXPENSES
C-15TestSubsequent INDUSTRY ASSOCIATION DUES
C-34Subsequent
STATISTICAL INFORMATION
C-41TestSubsequent O & M BENCHMARK VARIANCE BY FUNCTION
C-43TestSubsequent SECURITY COSTS
F-08TestSubsequent ASSUMPTIONS
SUPPLEMENT 1 - FPL STANDALONE INFORMATION IN MFR FORMAT SPONSORED OR CO-SPONSORED BY THOMAS BROAD
SOLE SPONSOR:
CO-SPONSOR:

Docket No. 20210015-EISupplemental FPL and Gulf Standalone Information in MFR
Format Sponsored or Co-Sponsored by Thomas BroadExhibit TB-2, Page 2 of 2
Florida Power & Light Company
Schedule Period Title
B-18TestSubsequent FUEL INVENTORY BY PLANT
B-15TestSubsequent PROPERTY HELD FOR FUTURE USE - 13 MONTH AVERAGE
B-24TestSubsequent LEASING ARRANGEMENTS
C-08TestSubsequent DETAIL OF CHANGES IN EXPENSES
C-34Subsequent
STATISTICAL INFORMATION
C-43TestSubsequent SECURITY COSTS
F-08TestSubsequent ASSUMPTIONS
SUPPLEMENT 2 - GULF STANDALONE INFORMATION IN MFR FORMAT SPONSORED OR CO-SPONSORED BY THOMAS BROAD
SOLE SPONSOR:
CO-SPONSOR:

22%
81%
82%
80%
1990 FPL
10,700
2017 FPL
1%
22,800
2020 FPL
24,900
2022 FPL/Gulf Power
29,1002
FPL Fossil/Solar Fleet MW Capability and Technology Changes1
Docket No. 20210015-ElFPL Fossil/Solar Fleet MW Capability and Technology Changes
Exhibit TB-3, Page 1 of 1
For perspective, in several decades FPL’s fossil/solar generating fleet transformed in scale and makeup from FERC “Steam” Boiler to efficient “Other1” CC and PV technology
Modernizing and diversifying the expanded fleet provides customers with cleaner, state-of-the-art electric power generation and its associated performance benefits
78%
18%
9%
9%
6%
14%
1 By FERC “Steam” & “Other” Production Categories. “Other” Production capacity represents combined (& simple) cycle gas turbine (CCGT) and solar photovoltaic (PV) type units in FPL’s fleet.
2 Assumes combined company operations starting in 2022. MW capabilities reflect unit additions, retirements, and miscellaneous capacity changes.
Steam (Combustion Boiler)Other (Solar PV/Battery)Other (Combined Cycle/GT)
30,000
20,000
10,000
0

FPL Fleet Performance Improvements (i.e. impact factor reductions) (1990 vs. 2020)
Docket No. 20210015-ElFPL Fleet Performance Improvements
Exhibit TB-4, Page 1 of 1
1 Injuries & Illnesses per 200,000 labor-hrs (~100 employees); 2 Emission rates include solar contribution; 3 969 Employees / 24,912 MW.
Safety (OSHA Rate)1
-98%
Fuel Use (Heat Rate)
-33%
Forced Outage (EFOR)
-71%
Unavail-ability
(100-EAF)
-64%
($/kW)
-49%
(c/kWh)
-64%
CO2
-45%
NOX
-98%
Staffing Rate3
-81%
SO2
~-100%
NF O&M COST EMISSION RATES2
YEAR OSHA RATE BTU/KWH EFOR % 100-EAF % $/KW C/KWH LBS/MWH LBS/MWH LBS/MWH EMPL/MW
1990 4.95 10,214 2.77 100-
81.7=18.3 18.5 0.64 1,464 6.51 5.24 0.21
2020 0.10 6,878 .80 100-
93.4=6.6 9.4 0.23 809 0.01 0.12 0.04
Results > Safer More
Efficient More
Reliable More
Available Lower Cost
Lower Cost
Cleaner Cleaner Cleaner More
Productive
GOOD
As FPL transformed its fossil/solar generating fleet, it made substantial operational and cost performance improvements
FPL’s fleet improvements in safety, fuel efficiency, reliability, cost, emissions and productivity are integral to more cost effectively generating electricity for customers

FPLTop Quartile Top DecilePeer Average
FPL Fossil/Solar vs. Industry Utility Peer Group* Performance Comparisons
A comparison of non-fuel O&M, Heat Rate and EFOR performance indicates FPL has essentially been a Best-in-Class or Top Decile performer vs. industry for 15 years
* Industry NFOM & NHR comparisons based on FERC Form 1-reporting large utility fossil ‘Steam plus Other’ capacity fleets: (> 5,000 mw);from ABB’s Velocity Power Industry database. Industry benchmarks (Top Decile, Quartile, Average) exclude FPL.
Cost $/kW
Btu/kWh
GOOD
GOOD
32
10,000
36
10,500
24
9,000
28
9,500
16
8,000
20
8,500
12
7,500
8
7,000
4
0
6,500
06
06
07
07
08
08
09
09
10
10
11
11
12
12
13
13
14
14
15
15
16
16
17
17
18
18
19
19
20
20
9.4
20.6
37.5
18.3
9.5
7,0706,878
28.9
19.4
16.6
10.3
Signifies Best-In-Class performance, currently 9.5
Signifies Best-In-Class performance, currently 7,070
Docket No. 20210015-ElFPL 15 Year NFOM, NHR & EFOR Performance Comparison
Exhibit TB-5, Page 1 of 2
10,013
9,569
9,668
9,367
8,579
8,162
8,445

FPL Fossil/Solar vs. Industry Utility Peer Group* Performance Comparisons
* Industry EFOR Source: North American Electric Reliability Council (NERC) for FERC ‘Steam & Other’ Capacity Fleets (>5,000 MW). Note: asidefrom the 2006 1.31% EFOR impact due to OEM Industry-wide CT compressor issue, FPL would also be Best-in-Class at 1.71% EFOR in 2006as well. All EFOR performance excludes PV Solar consistent with NERC reporting.
Docket No. 20210015-ElFPL 15 Year NFOM, NHR & EFOR Performance Comparison
Exhibit TB-5, Page 2 of 2
GOOD
Signifies Best-In-Class performance, currently 1.3
8.52
5.22
3.89
0.81.31.0
7.12
4.89
2.87
3.02
36
16
12
8
4
0
EFOR%
06 07 08 09 10 11 12 13 14 15 16 17 18 19 20
FPLTop Quartile Top DecilePeer Average
A comparison of non-fuel O&M, Heat Rate and EFOR performance indicates FPL has essentially been a Best-in-Class or Top Decile performer vs. industry for 15 years

FPL Fossil/Solar Fleet Heat Rate Comparison(Fuel Use Rate)
Since 2001, FPL’s modernization efforts improved our fossil/solar generating efficiency by 29%, driving us from 8% to beyond 25% better than the industry
Docket No. 20210015-ElFPL Fossil/Solar Fleet Heat Rate Comparison
Exhibit TB-6, Page 1 of 2
1 Source: ABB-Ventyx: U.S. generating plants (Excl. FPL/NEE). 2 FPL plant capacity rounded. * 2022 reflects merged FPL & Gulf fleet heat rate
Our heat rate improvement trend significantly avoids fuel use and hundreds of millions in cost annually and will continue as more efficient units are integrated
A. PFM CC Repowering (1,400 MW)
B. PSR 4&5 CC Repowering (1,900 MW)
C. PMG 8 & PMT 3 CC (2,000 MW)
D. PTF 5 CC (1,100 MW)
E. WCEC 1-3 CC (3,600 MW)
F. Solar (100 MW)
G. CCEC & RBEC (2,400 MW)
H. PEEC CC (1,200 MW) & Solar (200 MW)
I. Solar (600 MW) SJRPP Coal & PMR 1&2& PFL 4&5 ret. (-2,760 MW)
J. Solar (300 MW) OCEC CC (1,720 MW)
K. Solar (1,100 MW)
L. Solar (670 MW), Batteries (470 MW) & Scherer4 coal & PMT 1&2 ret. (-2,250 MW)
M. Solar (450 MW) & DBEC (1160 MW)
FPL Fossil/Solar Fleet Heat Rate Comparison (Fuel Use Rate)
GOOD
11,000
10,500
10,000
9,500
9,000
8,500
8,000
7,500
7,000
6,500
6,000
01 0905 13 1803 1107 15 2002 1006 14 1904 12 1708 16 21 22
10,472
9,476
6,8787,070
~6,400*
9,635
B B
C D
E E
E F
G G H
I J J
K
LM
C
A
29% FPL Efficiency
Improvement
FPL2
Industry1

Cumulative Benefits from FPL’s Modernized Fleet since 2001
In addition to fuel cost savings, modernizing FPL’s fossil/solar generating fleet significantly avoided oil usage and emissions for Florida
Docket No. 20210015-ElCumulative Benefits from FPL’s Modernized Fleet
Exhibit TB-6, Page 2 of 2
FPL’s well-operated, modernized fleet has provided significant customer benefits which will further increase with generating fleet improvements
GOOD
-12
-8
-10
-6
-4
-2
0 01 02 03 04 05 06 07 08 09 10 11 12 13 14 15 16 17 18 19 20
~ $11 Billion Fuel Cost Savings
01 02 03 04 05 06 07 08 09 10 11 12 13 14 15 16 17 18 19 20
GOOD
-600
-400
-500
-300
-200
-100
0
~ 600 Million Oil Barrels Avoided
01 02 03 04 05 06 07 08 09 10 11 12 13 14 15 16 17 18 19 20
GOOD
-130
-150
-170
-110
-70
-90
-50
-30
-10
0
~ 165 Million Tons CO2 Emissions Avoided
$ B
ILL
ION
MIL
LIO
N B
BL
SM
ILL
ION
TO
NS
NFOM, NHR and EFOR Comparisons
Comparing fleet level O&M, Heat Rate and EFOR performance between 2017 and 2022, FPL and Gulf Power are combining to significantly surpass the industry.
Docket No. 20210015-ElFPL's/Gulf's Fleet Level O&M,
Heat Rate and EFOR Performance Comparisons Exhibit TB-7, Page 1 of 2
Industry Steam & Other NFO&M Source: FERC Form 1 filings from Ventyx/ABB Energy Velocity Program
Industry NHR Source: Platts industry data: EIA-906 and FERC Form 423 - From Ventyx/ABB Energy Velocity Program: FPL data from FPSC Schedule A3
NFOM ‘Cost Efficiency’ Comparison $/kW
60
50
40
30
20
10
0
2017 2018
58.454.6
32.923.8
33.2
15.6
11.3 9.4 9.8 10.2
37.4
2019 2020 2021 2022
73% Better
NHR ‘Fuel Efficiency’ Comparison Btu/kWh
FPL FPL/Gulf Power Gulf Power Industry
31% Better
9,628
9,283
7,603
7,439
9,320
8,504
9,254
6,3896,578
8,608
6,878
10,000
9,000
8,000
7,000
6,000
2017 2018 2019 2020 2021 2022
GOOD
GOOD

NFOM, NHR and EFOR Comparisons
Docket No. 20210015-ElFPL's/Gulf's Fleet Level O&M,
Heat Rate and EFOR Performance Comparisons Exhibit TB-7, Page 2 of 2
Industry EFOR Source: North American Electric Reliability Council (NERC); Average EFOR for fossil steam and combined cycle units for all reporting companies. Gulf Power's 2018 EFOR excludes the impact of Hurricane Michael and 2020 EFOR excludes the impact of Hurricane Sally. All EFOR excludes PV Solar per NERC Reporting regs.
10.0
6.0
8.0
4.0
2.0
0
2017 2018 2019 2020 2021 2022
8.4
1.51.5
0.8
0.3
3.2
9.0
2.2
1.2 1.3
1.01.8
82% Better
EFOR ‘Unreliability’ Comparison %
FPL FPL/Gulf Power Gulf Power Industry
FPL and Gulf Power's combined lower cost, more efficient, and more reliable operations are translating to greater value and benefit for customers
GOOD
FPL*
4.4
76% Better
1,160
Industry
18.8
1,030
CC & PV Plant NFOM $/kW Comparisons - 2019
Docket No. 20210015-ElFPL's/Gulf's CC & PV Plant Level O&M
Performance Comparisons Exhibit TB-8, Page 1 of 1
Comparing plant type O&M costs for FPL/Gulf Power’s progressive Combined Cycle and Solar Photovoltaic categories to industry also demonstrates excellence
Combined Cycle $/kW
Solar PV $/kW
Based on the latest available FERC data for CC and PV plant types, our cost/kW is also significantly better than the industry
GOOD
< MWs Reporting >
Industry
23.4
FPL/Gulf Power
7.6
67% Better
61,840 18,600
Source: FERC Form 1 consolidated in Ventyx/ABB Energy Velocity Suite: - CC Plants (post 1990 COD): Industry - 92; FPL - 10; Gulf Power - 1- Solar PV Plants (>= 10 MW): Industry - 44; FPL - 17; Gulf Power - 0:
*Gulf Power’s 1st Solar PV site is in 2020

Industry ’19-’20 CC/
PV/Coal $/kW
Industry 2019
Heat Rate (latest)
Industry 2019 EFOR
(latest)
FPL/Gulf Power
’19-’20 Joint Ownership
$/kW
FPL/Gulf Power
2019 Joint Ownership Heat Rate
FPL/Gulf Power
2019 Joint Ownership
EFOR
FPL/Gulf Power ‘21-’22
Merged Ops $/kW
38.5
9,476
36.0
7,208
33.5
1.2
8.5
Total O&M + CAPEX Maintenance $/kW Expenditure*, Heat Rate and % EFOR Comparisons
Docket No. 20210015-ElFPL’s/Gulf’s Total O&M and CAPEX Maintenance
Expenditure, Heat Rate & EFOR ComparisonsExhibit TB-9, Page 1 of 1
Comparing FPL/Gulf Power’s combined fossil/solar fleet Total O&M + CAPEX costs along with operational performance to Industry
Compared to the industry, the FPL/Gulf Power fleet's O&M + CAPEX costs are trending lower while providing more fuel efficient reliable generation with improvements in 2020
* Cost comparisons involve similar Industry CC / PV / Coal technology weightings, and include all Fixed, Variable, and Major Maintenancecosts converted to regional $ per installed kW for two-year actual and projected periods (‘19-’20 & ’21-’22) since prior Test Year.
FPL/Gulf Power costs exclude CT upgrades and construction CAPEX, but reflect Total fossil/solar non-fuel O&M (Base plus Environmentaland Capacity Clauses) including all central fleet support services, and CAPEX maintenance. All EFOR performance excludes PV Solarconsistent with NERC reporting requirements.
Industry Source: U.S. Energy Information Administration (U.S. DOE/EIA) “Updated Capital Cost Estimates for Utility Scale ElectricityGenerating Plants” 2013, prepared by SAIC for EIA’s Electricity Market Model (EMM) & National Energy Modeling System (NEMS). Industry-weighted estimate used PGD’s ’19-’20: 82% CC, 10% Coal, & 8% PV MW mix; and 80% CC; 7% Coal, 14% PV by ’21-’22).
Note: FPL’s/Gulf Power’s ‘19-’22 four year average Total Expenditure rate of $34.8/kW (not displayed) was also 10% better than thecomparable Industry-weighted ’19-’22 average projection of $38.4/kW.
GOOD