VI. Financial markets - Bank for International Settlements BIS 78th Annual Report VI. Financial...
25
92 BIS 78th Annual Report VI. Financial markets Highlights During the period from June 2007 to mid-May 2008, concerns over losses on US subprime mortgage loans escalated into widespread financial stress, raising fears about the stability of banks and other financial institutions. What initially appeared to be a contained problem quickly spread across other credit segments and broader financial markets to the point where sizeable parts of the financial system became largely dysfunctional. Surging demand for liquidity, coupled with growing concerns about counterparty risk, led to unprecedented pressures in major interbank markets, while bond yields in advanced industrial economies tumbled as investors sought safe havens amid fears that economic growth would weaken. Equity markets in advanced industrial countries were also weak, with financial shares selling off particularly sharply. A bright spot was emerging financial markets, which in contrast to previous episodes of broad-based asset market weakness proved to be more resilient than those in the advanced industrial economies. The financial market turmoil unfolded in six stages, starting in mid-June 2007: (i) a dramatic widening of spreads on mortgage products following large- scale rating downgrades on subprime mortgage-backed securities and the closure of a number of hedge funds with subprime exposure; (ii) the extension of the sell-off to a wide variety of credit and other markets from mid-July, including structured products more generally; (iii) the expansion of the turmoil into short-term credit and, particularly, interbank money markets from end-July; (iv) broader problems for the financial sector from mid-October, including for companies such as financial guarantors; (v) increasingly dysfunctional markets against the backdrop of a marked worsening of the US macroeconomic outlook from early 2008, accompanied by rising fears about systemic risks, when spreads of even the highest-quality assets moved out to unusually wide levels; (vi) recovery in the wake of the Federal Reserve-facilitated takeover of a troubled US investment bank in March 2008. Anatomy of the credit market turmoil of 2007–08 Global credit markets experienced a large-scale sell-off during the period under review, as broad-based deleveraging combined with uncertainty about the size and valuation of credit exposures. The chain of events started with what appeared at first to be a relatively contained problem in the US subprime mortgage sector, but quickly spread to other markets. In an environment of rather accommodative financial conditions and elevated risk appetite, use of credit derivatives and securitisation technology had aided the build-up of substantial leverage in the financial system as a whole. When this leverage started to be unwound in the face of subprime losses, price deterioration led to margin calls and further deleveraging. With liquidity evaporating, valuations Credit markets sold off markedly … … in what started as a “subprime crisis”
Transcript of VI. Financial markets - Bank for International Settlements BIS 78th Annual Report VI. Financial...
92 BIS 78th Annual Report
VI. Financial markets
Highlights
During the period from June 2007 to mid-May 2008, concerns over losses onUS subprime mortgage loans escalated into widespread financial stress, raising fears about the stability of banks and other financial institutions. Whatinitially appeared to be a contained problem quickly spread across other credit segments and broader financial markets to the point where sizeableparts of the financial system became largely dysfunctional. Surging demandfor liquidity, coupled with growing concerns about counterparty risk, led tounprecedented pressures in major interbank markets, while bond yields inadvanced industrial economies tumbled as investors sought safe havens amidfears that economic growth would weaken. Equity markets in advanced industrial countries were also weak, with financial shares selling off particularlysharply. A bright spot was emerging financial markets, which in contrast toprevious episodes of broad-based asset market weakness proved to be moreresilient than those in the advanced industrial economies.
The financial market turmoil unfolded in six stages, starting in mid-June2007: (i) a dramatic widening of spreads on mortgage products following large-scale rating downgrades on subprime mortgage-backed securities and the closure of a number of hedge funds with subprime exposure; (ii) the extensionof the sell-off to a wide variety of credit and other markets from mid-July,including structured products more generally; (iii) the expansion of the turmoilinto short-term credit and, particularly, interbank money markets from end-July;(iv) broader problems for the financial sector from mid-October, including forcompanies such as financial guarantors; (v) increasingly dysfunctional marketsagainst the backdrop of a marked worsening of the US macroeconomic outlook from early 2008, accompanied by rising fears about systemic risks,when spreads of even the highest-quality assets moved out to unusually widelevels; (vi) recovery in the wake of the Federal Reserve-facilitated takeover ofa troubled US investment bank in March 2008.
Anatomy of the credit market turmoil of 2007–08
Global credit markets experienced a large-scale sell-off during the period underreview, as broad-based deleveraging combined with uncertainty about thesize and valuation of credit exposures. The chain of events started with whatappeared at first to be a relatively contained problem in the US subprimemortgage sector, but quickly spread to other markets. In an environment ofrather accommodative financial conditions and elevated risk appetite, use ofcredit derivatives and securitisation technology had aided the build-up of substantial leverage in the financial system as a whole. When this leveragestarted to be unwound in the face of subprime losses, price deterioration led tomargin calls and further deleveraging. With liquidity evaporating, valuations
Credit markets sold off markedly …
… in what started as a “subprime crisis”
93BIS 78th Annual Report
came under greater downward pressure and became increasingly uncertain.The resulting retrenchment of positions across markets triggered a sharp anddisorderly repricing of risky assets that continued through much of the period.
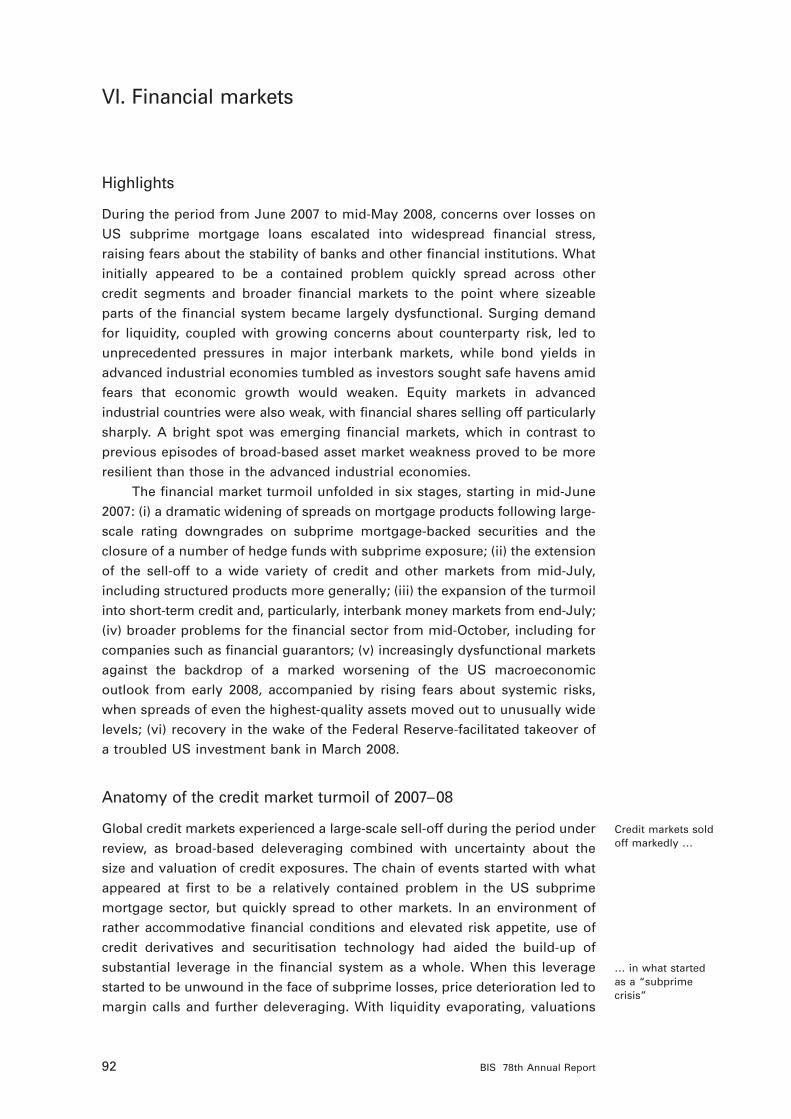
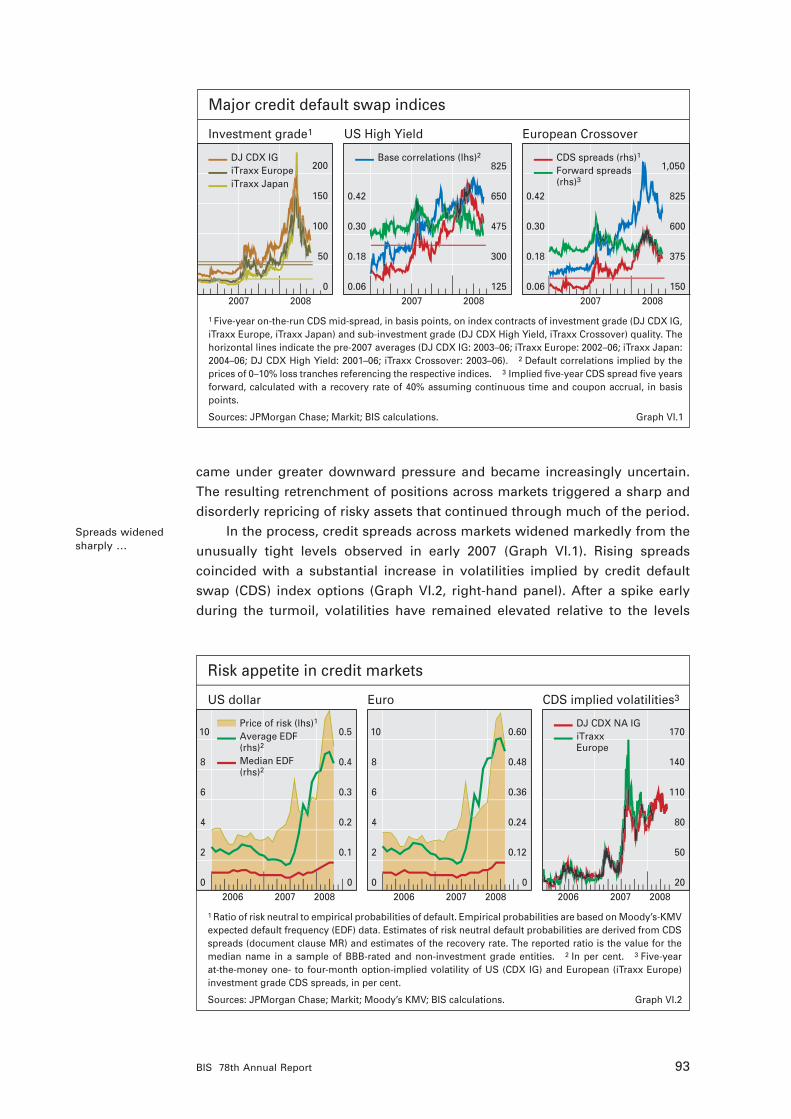
In the process, credit spreads across markets widened markedly from theunusually tight levels observed in early 2007 (Graph VI.1). Rising spreads coincided with a substantial increase in volatilities implied by credit defaultswap (CDS) index options (Graph VI.2, right-hand panel). After a spike earlyduring the turmoil, volatilities have remained elevated relative to the levels
Spreads widened sharply …
0
50
100
150
200
2007 2008
DJ CDX IG iTraxx EuropeiTraxx Japan
0.06
0.18
0.30
0.42
125
300
475
650
825
2007 20080.06
0.18
0.30
0.42
150
375
600
825
1,050
2007 2008
Base correlations (lhs)2 CDS spreads (rhs)1 Forward spreads(rhs)3
Major credit default swap indices
Investment grade1 US High Yield European Crossover
Graph VI.1
1 Five-year on-the-run CDS mid-spread, in basis points, on index contracts of investment grade (DJ CDX IG, iTraxx Europe, iTraxx Japan) and sub-investment grade (DJ CDX High Yield, iTraxx Crossover) quality. The horizontal lines indicate the pre-2007 averages (DJ CDX IG: 2003–06; iTraxx Europe: 2002–06; iTraxx Japan: 2004–06; DJ CDX High Yield: 2001–06; iTraxx Crossover: 2003–06). 2 Default correlations implied by the prices of 0–10% loss tranches referencing the respective indices. 3 Implied five-year CDS spread five years forward, calculated with a recovery rate of 40% assuming continuous time and coupon accrual, in basis points.
Sources: JPMorgan Chase; Markit; BIS calculations.
20
50
80
110
140
170
2006 2007 2008
DJ CDX NA IG iTraxxEurope
0
2
4
6
8
10
0
0.1
0.2
0.3
0.4
0.5
2006 2007 2008
Price of risk (lhs)1
0
2
4
6
8
10
0
0.12
0.24
0.36
0.48
0.60
2006 2007 2008
Average EDF (rhs)2
Median EDF (rhs)2
Risk appetite in credit markets
US dollar Euro CDS implied volatilities3
Graph VI.2
1 Ratio of risk neutral to empirical probabilities of default. Empirical probabilities are based on Moody’s-KMV expected default frequency (EDF) data. Estimates of risk neutral default probabilities are derived from CDS spreads (document clause MR) and estimates of the recovery rate. The reported ratio is the value for the median name in a sample of BBB-rated and non-investment grade entities. 2 In per cent. 3 Five-year at-the-money one- to four-month option-implied volatility of US (CDX IG) and European (iTraxx Europe) investment grade CDS spreads, in per cent.
Sources: JPMorgan Chase; Markit; Moody’s KMV; BIS calculations.
94 BIS 78th Annual Report
… and volatilities spiked …
… to levels consistent withstrongly risingdefault rates
observed since index inception in 2002–03, indicating heightened uncertaintyabout shorter-run developments. Plummeting investor risk tolerance, in turn,resulted in sharply rising risk premia for credit products (Graph VI.2, left-handand centre panels). The price of credit risk, as extracted from credit spread-implied and empirical default probabilities of lower-quality borrowers, increasedmarkedly in June and July, and further into 2008.
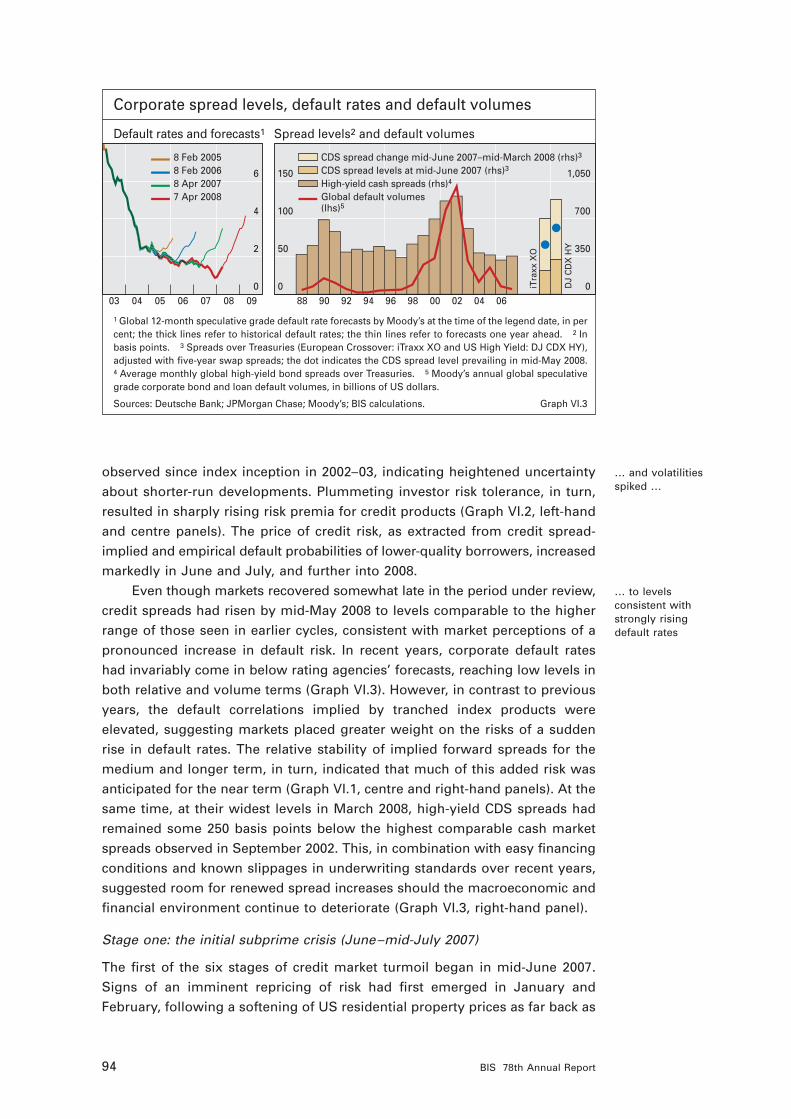
Even though markets recovered somewhat late in the period under review,credit spreads had risen by mid-May 2008 to levels comparable to the higherrange of those seen in earlier cycles, consistent with market perceptions of apronounced increase in default risk. In recent years, corporate default rateshad invariably come in below rating agencies’ forecasts, reaching low levels inboth relative and volume terms (Graph VI.3). However, in contrast to previousyears, the default correlations implied by tranched index products were elevated, suggesting markets placed greater weight on the risks of a suddenrise in default rates. The relative stability of implied forward spreads for themedium and longer term, in turn, indicated that much of this added risk wasanticipated for the near term (Graph VI.1, centre and right-hand panels). At thesame time, at their widest levels in March 2008, high-yield CDS spreads hadremained some 250 basis points below the highest comparable cash marketspreads observed in September 2002. This, in combination with easy financingconditions and known slippages in underwriting standards over recent years,suggested room for renewed spread increases should the macroeconomic andfinancial environment continue to deteriorate (Graph VI.3, right-hand panel).
Stage one: the initial subprime crisis (June–mid-July 2007)
The first of the six stages of credit market turmoil began in mid-June 2007.Signs of an imminent repricing of risk had first emerged in January and February, following a softening of US residential property prices as far back as
0
2
4
6
03 04 05 06 07 08 09
8 Feb 20058 Feb 20068 Apr 20077 Apr 2008
0
50
100
150
0
350
700
1,050
88 90 92 94 96 98 00 02 04 06
CDS spread change mid-June 2007–mid-March 2008 (rhs)3
CDS spread levels at mid-June 2007 (rhs)3 High-yield cash spreads (rhs)4 Global default volumes(lhs)5
Corporate spread levels, default rates and default volumes
Default rates and forecasts1 Spread levels2 and default volumes
iTra
xx X
O
DJ
CD
X H
Y
Graph VI.3
1 Global 12-month speculative grade default rate forecasts by Moody’s at the time of the legend date, in per cent; the thick lines refer to historical default rates; the thin lines refer to forecasts one year ahead. 2 In basis points. 3 Spreads over Treasuries (European Crossover: iTraxx XO and US High Yield: DJ CDX HY), adjusted with five-year swap spreads; the dot indicates the CDS spread level prevailing in mid-May 2008. 4 Average monthly global high-yield bond spreads over Treasuries. 5 Moody’s annual global speculative grade corporate bond and loan default volumes, in billions of US dollars.
Sources: Deutsche Bank; JPMorgan Chase; Moody’s; BIS calculations.

95BIS 78th Annual Report
Timeline of key events
2007
14–22 June Rumours surface that two Bear Stearns-managed hedge funds invested in securities
backed by subprime mortgage loans have incurred heavy losses and that $3.8 billion
worth of bonds are up for sale to finance margin calls. News reports eventually confirm
that one of the funds is kept open through a loan injection, while the other is to be
liquidated.
10–12 July S&P places $7.3 billion worth of 2006 vintage ABS backed by residential mortgage loans
on negative ratings watch and announces a review of CDO deals exposed to such
collateral; Moody’s downgrades $5 billion worth of subprime mortgage bonds and
places 184 mortgage-backed CDO tranches on downgrade review. Fitch places 33
classes from 19 structured finance CDOs on credit watch negative.
30 July– Germany’s IKB warns of subprime-related losses and reveals that its main shareholder,
1 August Kreditanstalt für Wiederaufbau (KfW), has assumed its financial obligations from
liquidity facilities provided to an ABCP conduit exposed to subprime loans. A €3.5 billion
rescue fund is put together by KfW and a group of public and private sector banks.
31 July– American Home Mortgage Investment Corporation announces its inability to fund
9 August lending obligations and, one week later, files for Chapter 11 bankruptcy. Union
Investment, a German fund manager, stops withdrawals from one of its funds. Three
ABCP programmes, including one linked to American Home, extend the maturity of
their liabilities, the first ever such extensions. BNP Paribas freezes redemptions for
three investment funds, citing an inability to value them in the current environment.
9–10 August The ECB injects €95 billion of overnight liquidity into the interbank market, marking the
beginning of a set of extraordinary moves by the central bank community. The Federal
Reserve conducts three extraordinary auctions of overnight funds, injecting a total of
$38 billion, and issues a statement similar to that of the ECB.
13–17 September Northern Rock, a UK mortgage lender, runs into liquidity problems, which eventually
trigger a bank run and the announcement of a deposit guarantee by the UK Treasury.
18 September– Repeated writedowns and quarterly losses are reported by major financial
4 November institutions. A number of high-profile CEOs leave their positions amid top management
reorganisations.
11–23 October Moody’s downgrades some 2,500 subprime bonds issued in 2006, followed by a
series of S&P subprime downgrades in the following days. S&P also puts 590 CDOs
on ratings watch negative and downgrades 145 tranches of CDOs worth $3.7 billion;
Moody’s downgrades 117 CDO tranches later in the same week, and Fitch places some
$37 billion worth of CDOs under review.
24 October– Various financial guarantors announce third quarter losses; Fitch announces that it is
5 November considering cutting the AAA rating of certain monoline insurers.
12 December Central banks from five currency areas announce coordinated measures designed to
make turn-of-the year funding available to a larger number of institutions.
19 December ACA, a financial guarantor rated A, is downgraded by S&P to CCC, triggering collateral
calls from its counterparties for which repeated waiver periods are negotiated during
the following months. S&P’s rating outlooks for other monolines are lowered from
stable to negative.
Continued on page 96.

96 BIS 78th Annual Report
2006. However, this early sell-off of instruments exposed to mortgage creditwas partly reversed during subsequent months. By contrast, in June, with evidence of a severe erosion in mortgage quality accumulating since 2006,large-scale rating actions on subprime residential mortgage-backed securities(RMBS) coincided with news about the imminent shutdown of two hedgefunds with large subprime exposures (Table VI.1). As the two funds wereforced to delever, concerns about distressed asset sales caused credit spreadsfor subprime mortgage products to widen beyond their previous peaks (Graph VI.4, left-hand panel).
The initial sell-off was confined tosubprime credits …
2008
2–4 January Weak purchasing managers’ data and labour market reports point to a marked
weakening in the US economy and trigger fears about global growth.
14–31 January The ECB, Federal Reserve and Swiss National Bank carry out additional long-term
funding operations in US dollars.
15 January Citigroup announces a fourth quarter loss, partly due to $18 billion of additional
writedowns on mortgage-related exposures, starting another string of similar news
from other financial institutions.
18–31 January Fitch downgrades Ambac, a monoline insurer, by two notches from AAA and later also
downgrades monolines SCA and FGIC to A and AA respectively. Some 290,000 insured
issues, mostly municipal bonds, are downgraded as a result. Later, S&P downgrades
FGIC to AA, and further rating actions by all three major rating agencies are taken on
the monolines in the following weeks.
21–30 January The Federal Reserve delivers a 75 basis point inter-meeting rate cut, following
broad-based global equity and credit market weakness. The policy rate is lowered by
another 50 basis points in the following week.
28 February– Peloton Partners announces the closure of a $2 billion ABS fund and temporarily halts
7 March redemptions from another fund, following margin calls by lenders. Thornburg
Mortgage admits delays in meeting margin calls on repo borrowings and eventually
defaults on such payments. Carlyle Group’s mortgage bond fund also fails to meet
margin calls, leading to a suspension of trading as investors force the sale of some of
the fund’s holdings. Pressures spread to European government bond markets, with
pronounced liquidity tiering across issuers and market segments.
7–16 March The Federal Reserve announces an increase of $40 billion in the size of its new Term
Auction Facility and, a few days later, expands its securities lending activities through a
$200 billion Term Securities Lending Facility that lends Treasury securities against a
range of eligible assets. Later the same week, it announces a new Primary Dealer
Credit Facility that extends discount window-type borrowing to the primary dealer
community. Additional initiatives are announced by other central banks, including
renewed auctions of US dollar funds.
14–17 March Failure to roll over repo funds causes an acute liquidity shortage at Bear Stearns,
emergency discount window borrowing and a subsequent takeover by JPMorgan.
2 May The ECB, Federal Reserve and Swiss National Bank announce a further expansion of
their US dollar liquidity measures.
Sources: Bloomberg; Financial Times; The Wall Street Journal; company press releases. Table VI.1

97BIS 78th Annual Report
Stage two: spillovers into other credit markets (mid- to end-July 2007)
While valuation losses on higher-rated exposures and instruments other thanresidential mortgage products were initially quite limited, the sell-off spreadquickly during the second stage of the turmoil (Graph VI.4, left- and right-handpanels). Increasingly, lenders felt inadequately protected in an environment ofrising volatility, leading to larger haircuts on RMBS, margin calls and morebroad-based deleveraging. Amid concerns about forced sales of better-qualityassets, mark to market losses mounted. As a result, the turmoil deepenedfrom mid-July and into August, affecting such sectors as leveraged loans and commercial mortgages. As demand for loans and similar assets from collateralised debt obligations (CDOs) dried up, numerous leveragedbuyout (LBO) deals had to be delayed or pulled from the market. Commercial mortgage-backed securities faced similar strains, as evidenced byindicators such as the CMBX index, possibly reflecting concerns about theextent to which weakening underwriting standards in the residential sectormight have spread to the commercial mortgage business (Graph VI.4, right-hand panel).
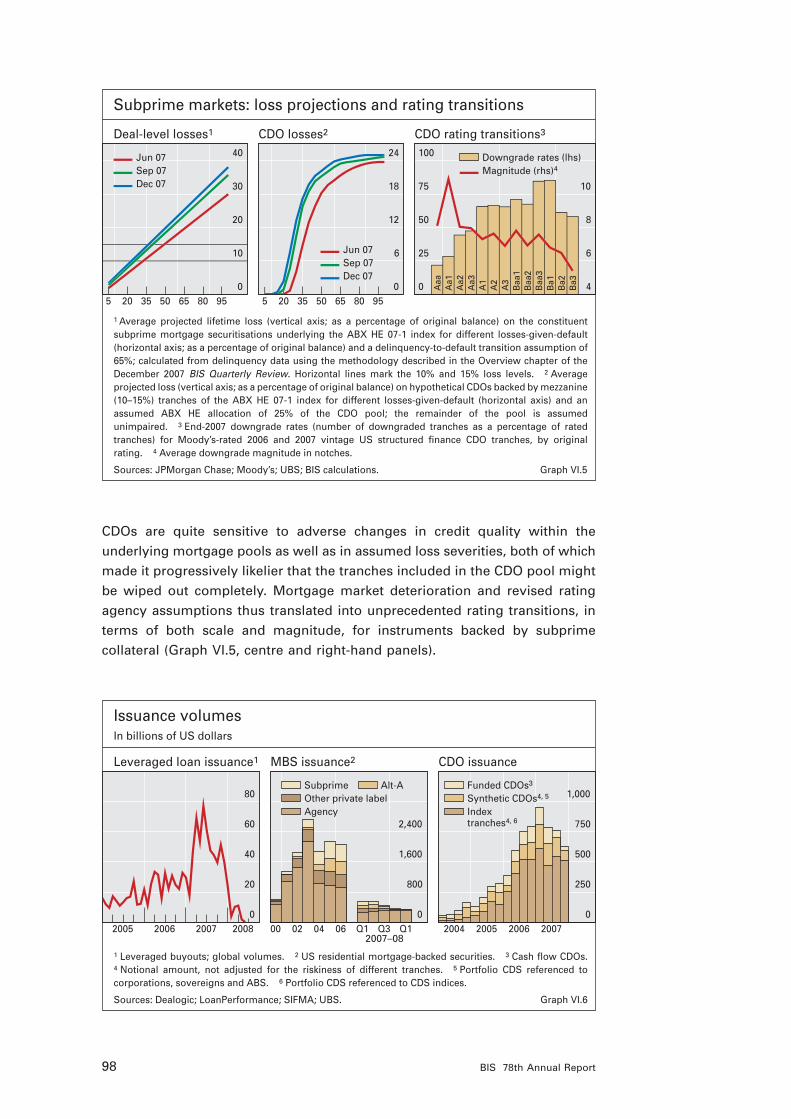
Uncertainties about the size and distribution of mortgage-related losses,as well as the lags until their realisation, were among the key drivers of market developments. With these uncertainties also came increased doubtsabout the reliability of ratings for structured finance products and the impactof the deterioration in mortgage quality on rating transitions. As mortgagedelinquencies accumulated, so did projected losses, implying loss rates onrecent-vintage subprime mortgage pools of 20% or higher, even under fairlyoptimistic assumptions (Graph VI.5, left-hand panel). On this basis, investorsgrew increasingly concerned about losses spreading along the securitisationchain, for example on instruments such as CDOs that themselves resecuritisemezzanine tranches of subprime mortgage deals. Projected losses on such
… but quickly spread across markets …
… reflecting uncertainties aboutthe size and distribution of losses …
0
4,000
8,000
12,000
16,000
2007 2008
BBB-ratedAAA-ratedAA-rated A-rated
10
20
30
40
50
2007 2008
ABX HE 07-1ABX HE 07-2
0
60
120
180
240
2007 2008
CMBX index4 Student loan5
Credit card6
US securitisation markets
ABX tranche spreads1 Implied time-to-writedown2 AAA tranche spreads3
Graph VI.4
1 Implied index spreads from CDS contracts on subprime mortgage bonds (index series ABX HE 07-1), in basis points. 2 Implied time to full writedown (loss) of tranche principal in months; calculated from prices for the ABX HE 07-1 and 07-2 index series (backed by subprime MBS originated in the second half of 2006 and the first half of 2007, respectively) referencing tranches rated BBB–. 3 In basis points. 4 Spreads on CDS index contracts referencing AAA-rated tranches of US commercial mortgage-backed securities (CMBX index, series 3). 5 Ten-year student loan ABS spreads to one-month Libor. 6 Ten-year floating credit card loan spreads to one-month Libor.
Sources: JPMorgan Chase; Markit; BIS calculations.
0
10
20
30
40
5 20 35 50 65 80 95 5 20 35 50 65 80 95
Jun 07Sep 07Dec 07
0
6
12
18
24
Jun 07Sep 07Dec 07
0
25
50
75
100
4
6
8
10
Downgrade rates (lhs)Magnitude (rhs)4
Aaa
Aa1
Aa2
Aa3
A1
A2
A3
Baa
1B
aa2
Baa
3B
a1B
a2B
a3
Subprime markets: loss projections and rating transitions
Deal-level losses1 CDO losses2 CDO rating transitions3
Graph VI.5
1 Average projected lifetime loss (vertical axis; as a percentage of original balance) on the constituent subprime mortgage securitisations underlying the ABX HE 07-1 index for different losses-given-default (horizontal axis; as a percentage of original balance) and a delinquency-to-default transition assumption of 65%; calculated from delinquency data using the methodology described in the Overview chapter of the December 2007 BIS Quarterly Review. Horizontal lines mark the 10% and 15% loss levels. 2 Average projected loss (vertical axis; as a percentage of original balance) on hypothetical CDOs backed by mezzanine (10–15%) tranches of the ABX HE 07-1 index for different losses-given-default (horizontal axis) and an assumed ABX HE allocation of 25% of the CDO pool; the remainder of the pool is assumed unimpaired. 3 End-2007 downgrade rates (number of downgraded tranches as a percentage of rated tranches) for Moody’s-rated 2006 and 2007 vintage US structured finance CDO tranches, by original rating. 4 Average downgrade magnitude in notches.
Sources: JPMorgan Chase; Moody’s; UBS; BIS calculations.
98 BIS 78th Annual Report
CDOs are quite sensitive to adverse changes in credit quality within the underlying mortgage pools as well as in assumed loss severities, both of whichmade it progressively likelier that the tranches included in the CDO pool mightbe wiped out completely. Mortgage market deterioration and revised ratingagency assumptions thus translated into unprecedented rating transitions, interms of both scale and magnitude, for instruments backed by subprime collateral (Graph VI.5, centre and right-hand panels).
0
20
40
60
80
2005 2006 2007 20080
800
1,600
2,400
00 02 04 06 Q1 Q3 Q1
Subprime Other private labelAgency
Alt-A
0
250
500
750
1,000
2004 2005 2006 2007
Funded CDOs3 Synthetic CDOs4, 5
Index tranches4, 6
Issuance volumesIn billions of US dollars
Leveraged loan issuance1 MBS issuance2 CDO issuance
Graph VI.6
1 Leveraged buyouts; global volumes. 2 US residential mortgage-backed securities. 3 Cash flow CDOs.4 Notional amount, not adjusted for the riskiness of different tranches. 5 Portfolio CDS referenced to corporations, sovereigns and ABS. 6 Portfolio CDS referenced to CDS indices.
Sources: Dealogic; LoanPerformance; SIFMA; UBS.
2007–08

99BIS 78th Annual Report
… and unprecedentednumbers of ratingdowngrades
A full-blown crisis erupted in August …
… following investor withdrawalfrom ABCP …
Against this background, large parts of the investor community essentiallywithdrew from structured assets altogether. Investors, particularly those that had historically relied chiefly on ratings in their risk management andinvestment decisions, started to question that reliance in the face of the unexpected and growing wave of downgrades. Loss of confidence in structuredfinance ratings, in turn, meant that demand for tranched credit products collapsed from the high levels observed in recent years, aggravating thedecline in issuance volumes that had started early in the credit crisis (Graph VI.6). Activity in single- and multi-name CDS, in contrast, held upthroughout the turmoil, with notional amounts growing by more than 35%during the second half of 2007.
Stage three: squeezed liquidity and involuntary reintermediation (August 2007)
The third stage saw the credit market turmoil expand into short-term credit andinterbank money markets. The initial mortgage market correction had beenaccommodated by the dealer community, which absorbed the affected assetsin the face of shrinking demand. As originators continued to feed new loansinto the securitisation pipeline, dealers withdrew, forcing the originators todraw down bank lines for financing. Investors, in turn, began to focus moreclosely on credit quality and valuation challenges in illiquid markets, and anumber of asset managers halted redemptions on investment funds.
As the crisis turned increasingly into one of asset valuation, investorspulled out of the market and caused an unprecedented wave of involuntaryreintermediation. The first signs of the impending liquidity squeeze came inthe asset-backed commercial paper (ABCP) market, when issuers began toencounter difficulties rolling over outstanding volumes. Pressures were particularly intense for structures with less than complete liquidity support fromtheir sponsoring financial institutions, such as ABCP financing the asset poolsof structured investment vehicles (SIVs), or paper backed by assets linked to
0.70
0.85
1.00
1.15
1.30
2007 2008
Banks’ securities holdings2
Asset-backed Non-asset-backed
0
50
100
150
200
250
1 2 3 4 5 6
31 Aug 0726 Oct 0725 Jan 0828 Mar 08
0
10
20
30
40
50
Asset-backed commercial paper (ABCP) markets
US CP outstanding1 Maturing ABCP3 ABCP volumes by type4
Mul
ti-se
ller
Arb
itrag
e/hy
brid
Sin
gle
selle
r
SIV
CD
O/C
DO
-lite
Oth
er
Graph VI.7
1 In trillions of US dollars. 2 Holdings of “other securities” by large domestically chartered commercial and foreign-related banks in the United States; not seasonally adjusted. 3 Maturity of outstanding ABCP, weeks after date; in billions of US dollars. 4 Global outstanding volumes at end-March 2007 by issuing vehicle; as a percentage of total volumes.
Sources: Federal Reserve Board; Bloomberg; Citigroup; BIS calculations.

100 BIS 78th Annual Report
… and surging demand for liquidityin interbank markets
After a short respite …
… sentiment worsened onceagain …
… following repeated writedowns bymajor banks …
… concerns about ongoing deleveraging …
individual originators (Graph VI.7, right-hand panel). Volumes collapsed andthe maturity profile of outstanding paper deteriorated, with markets stabilisingonly in early 2008. While some of the most troubled conduits were liquidated,many migrated back onto the balance sheets of their sponsors, adding tobanks’ securities holdings (Graph VI.7, left-hand and centre panels). As aresult, when nervousness about funding needs and banks’ conditional liabilitiesintensified, liquidity demand surged, causing an outsize and protracted disruption in interbank money markets that signalled the advent of a broaderfinancial market crisis.
Stage four: broad-based financial sector strains (September–November 2007)
Credit markets recovered temporarily in September, but experienced a newbout of large-scale spread widening in October and November. The respite wasafforded in part by repeated central bank liquidity injections aimed at easingthe squeeze in money markets. Late September, in particular, saw a broadupturn in credit markets, with the US Federal Open Market Committee’s decision to cut the federal funds target by 50 basis points on 18 Septembertriggering a strong price reaction across all market segments. Adding to thepositive sentiment, sizeable write-offs announced by major commercial andinvestment banks were seen as providing much needed transparency aboutmortgage-related losses. Recovering demand for such exposures, in turn,allowed banks to place some of their accumulated leveraged loan and bonddeals that were awaiting financing (Graph VI.6, left-hand panel; see ChapterVII for more detail). However, sentiment worsened again from mid-October,following another wave of downgrades of RMBS and CDO ratings and negativefinancial sector news.
During this fourth stage of the turmoil, credit-related losses in the financialsector turned out to be larger than expected, adding to uncertainties aboutasset valuations and fears of broader economic weakness (see Chapter VII).Large upward revisions of earlier writedown announcements, in particular,triggered investor doubts about banks’ ability to appropriately value and manage their exposures. Combined with renewed credit market weakness,this suggested that even more losses could be about to materialise. One signof concern about related financial sector strains was the pricing of credit protection against the default risk of banks and other financial institutions,with spreads rising above the peaks they had reached during the summer(Graph VI.8, left-hand panel).
Continued uncertainty about valuations was prompted in part by fearsabout asset sales by structured vehicles and further mortgage market deterioration. One factor was ratings-based and market value-related structuralprovisions in CDOs and SIVs that seemed likely to force liquidations of underlying collateral pools once deal-specific threshold levels were crossed.Another factor was that losses on subprime exposures were increasinglyexpected to eventually push through existing subordination layers (Graph VI.5,left-hand panel), leading the more senior tranches of recent mortgage securitisations to underperform lower-rated ones. Prices on the latter tranches,in turn, started to reflect expectations of full writedown of tranche principal

101BIS 78th Annual Report
… and looming monoline downgrades
Amid rising fears about growth …
by early 2010. While a further deterioration in mortgage fundamentals subsequently accelerated these implied times-to-writedown, loss accumulationwas still expected to continue well into 2009 (Graph VI.4, centre panel).
In the process of these price adjustments, mortgage-related losses alsostarted to emerge outside the banking sector, particularly among monolinefinancial guarantors, entities that specialise in writing insurance on a variety ofhighly rated bonds and structured products. Widening credit spreads on seniortranches of structured instruments had translated into mark to market losseson the value of insurance the monolines had written on mortgage-backedproducts. Anticipated increases in future claims thus caused CDS spreads ofthe monolines to widen sharply in the fourth quarter and into the new year,foreshadowing a string of negative rating actions on key monolines (Graph VI.8,left-hand panel). Looming monoline downgrades, in turn, meant further pressures on bank balance sheets arising from expected valuation changes forcredit insurance that had been provided on banks’ retained exposures tosenior CDO tranches, as well as from liquidity backstops for monoline-enhanced money market instruments. As a result, the widening of financialsector spreads was more pronounced than that of other market segments,contributing to an overall underperformance of investment grade benchmarksvis-à-vis lower-quality assets (Graph VI.8, centre panel).
Stage five: growth fears and dysfunctional markets (January–mid-March 2008)
After a short lull in credit market conditions in December, disappointingmacroeconomic indicators caused yet another widespread repricing of risk inearly 2008. This fifth period of very negative credit market sentiment followedthe release of data in early January indicating weak growth in the US manufacturing sector along with disappointing labour market developments.
0
250
500
750
2007 2008
North American banksEuropean banks Monolines
350
500
650
800
950
2007 2008
CDX ratio iTraxx ratio
–200
–100
0
100
3.0
4.5
6.0
7.5
2007 2008
7-day auction rate (rhs)4
1-mth auction rate (rhs)4
Municipal spreads (lhs)5
Financial sector and municipal spreads1
Financial sector spreads2 Relative spreads3 US municipal spreads
Graph VI.8
1 The horizontal lines indicate pre-2007 averages (left-hand panel: 2001–06; right-hand panel: seven-day and one-month rate: May–December 2006, municipal spreads: 2001–06). 2 The sample consists of 14 investment and commercial banks headquartered in North America, 11 universal banks headquartered in Europe and seven financial guarantors for the monolines; in basis points. 3 Relative spread movements on the basis of five-year on-the-run CDS index spread ratios; for the CDX, high-yield over investment grade index; for the iTraxx, crossover over main index. 4 SIFMA tax-exempt index rate, in per cent. 5 Over two-year Treasury bonds, in basis points.
Sources: Bloomberg; Markit; BIS calculations.

102 BIS 78th Annual Report
Concerns about risks to growth were further fuelled by rising fears of a creditcrunch (see Chapters II and VII). Related nervousness about feedback effectsbetween macroeconomic and financial developments reached a climax on 21 and 22 January. Following the downgrade of a large monoline insurer theprevious Friday, risky assets sold off across markets and countries, and markets remained volatile into February and March, despite extraordinary policy rate cuts by the Federal Reserve on 22 and 30 January.
By that point, investor withdrawal from various financial markets hadintensified to such an extent that parts of the financial system became dysfunctional, causing further financial retrenchment. Reflecting these difficultconditions, spreads on even the most highly rated and otherwise liquid assetsreached unusually wide levels in early 2008. This included markets, such asthose for certain US student loan securitisations, whose underlying exposuresare almost entirely protected by federal guarantees (Graph VI.4, right-handpanel). While, at these elevated spread levels, primary issuance continued,arranging banks were finding it difficult to place anything but the most seniortranches. With the remainder of the issued structures being retained, thisadded to existing constraints on bank capital.
In late February and early March, with balance sheet pressures continuingto intensify, banks sought to further cut their exposures across various business lines, contributing to another fall in investor risk appetite. One suchmove was the withdrawal of banks’ implicit liquidity support for an estimated$330 billion worth of auction rate securities, which provide long-term financingto municipal and other borrowers in the United States at variable short-terminterest rates tied to an auction process. Failed auctions and the resulting rateresets thus raised the cost of financing for these borrowers (Graph VI.8, right-hand panel). Pressures were also evident elsewhere, such as in the marketsfor highly rated US agency and private label mortgage-backed securities,which experienced a rapid increase in price uncertainty. The deterioration in confidence regarding asset values culminated in early March, when thetightening of repo haircuts caused a number of hedge funds and other leveraged investors to unwind existing exposures, threatening a cascade offurther margin calls and widening spreads.
Events came to a head in the week beginning 10 March. This started withthe Federal Reserve’s announcement of an expansion of its securities lendingactivities targeting the large US dealer banks, later supplemented by a temporary facility providing overnight loans against a broad range of collateral(see Chapter IV). While the initial announcement seemed to provide temporaryrelief, the US investment bank Bear Stearns suffered a severe liquidity shortage later in the week. This led to its takeover by JPMorgan the followingMonday, a measure facilitated by the Federal Reserve.
Stage six: the crest of the credit crisis to date (mid-March–May 2008)
These developments appeared to herald a turning point, with markets movinginto the sixth and, to date, final stage of the financial turmoil. Consistent with perceptions of a considerable reduction in systemic risk, spreads, particularlythose for financial sector and other investment grade firms, retreated
… credit markets turned increasinglydysfunctional …
… triggering furtherdeleveraging …
… and heightened asset price uncertainty
Repeated central bank action …
… and the takeover of a major investment bank …
… seemed to mark a turning point inmarket sentiment

103BIS 78th Annual Report
substantially following the takeover of Bear Stearns from the peaks reachedduring previous weeks. Amid signs of short covering, the tightening continuedthrough April, with spreads rallying back to where they had been in mid-January, and seeming to stabilise around these levels from early May.
Even so, interbank money markets failed to recover. Given continued capital and funding constraints for some investors as well as the disappearanceof demand from structures such as SIVs and CDOs, large overhangs of creditexposure continued to weigh on markets. By mid-May, with the credit cyclecontinuing to deteriorate and higher default rates looming, it remainedunclear whether liquidity supply and risk appetite had recovered sufficiently tohelp maintain this improved credit market environment on a sustained basis.
Money markets hit by liquidity squeeze
One of the key distinguishing features of the financial turmoil was the onset ofunprecedented dislocations in interbank markets, and in money markets morebroadly, resulting from a surge in liquidity demand and a loss of confidencein the creditworthiness of counterparties. The initial trigger for these severetensions was serious liquidity disruptions in the $1.2 trillion ABCP market during the third stage of the unfolding financial turmoil, as described above.These disruptions quickly led to deep concern about the adverse effects ofpotentially large-scale reintermediation linked to banks providing backup creditlines for vehicles active in the ABCP market and, subsequently, in other markets.Worries about the liquidity and capital implications for banks engenderedgrowing distrust towards counterparties, while uncertainty about the stabilityof the banking system as a whole grew, as indicated by widening swap spreads(see below). In this environment, banks became less willing to lend money toother banks, while, at the same time, concerns about their own liquidityrequirements led to rapidly increasing demand for borrowed funds. Adding tothis, money market mutual funds, which traditionally have been providers offunding for banks, shifted a large portion of their investments away from banksand into safe government debt, as their appetite for risk fell sharply (see below).
Central bank liquidity injections alleviated some of the pressures in interbank markets (see Chapter IV), but uncertainty about future liquidity needsand counterparty risk persisted. As a result, interest rates in the interbank market remained elevated and volatile relative to comparable rates throughoutmuch of the period under review. Moreover, with most central banks initiallyfocusing on alleviating strains in the very shortest maturity segment, tensionsfurther out in the maturity spectrum soon became particularly pronounced,inducing central banks to shift their attention increasingly to liquidity shortagesat longer maturities.
Such liquidity strains were evident from the unprecedented, persistentwidening of spreads between interbank rates for term lending and overnightindex swap (OIS) rates at corresponding maturities. For example, prior to theoutbreak of the financial turmoil, three-month Libor rates had exceeded OISrates by only a few basis points on average, but from late July 2007 the difference surged to levels sometimes exceeding 100 basis points (Graph VI.9).
Severe disruptions in interbank markets …
… led to sharply higher interbankrates …

0
40
80
120
160
2007 2008
Libor-OIS1
0
40
80
120
160
2007 2008
CDS2
0
40
80
120
160
2007 2008
Implied forward
Interest rate and bank credit spreadsIn basis points
United States Euro area United Kingdom
Graph VI.9
1 Three-month Libor rates minus corresponding OIS rates (for the euro area, EONIA swap). 2 Average of the five-year on-the-run CDS spreads for the panel banks reporting Libor quotes in the domestic currency’s panel.
Sources: Bloomberg; BIS calculations.
104 BIS 78th Annual Report
Interbank and OIS rates both reflect investors’ expectations about future interest rates, but because interbank lending involves payment of the entireprincipal up front whereas OIS contracts are settled on a net basis at maturity,they differ substantially with respect to their liquidity and credit risk implications. The sharp widening in Libor-OIS spreads therefore clearly signalled some combination of greater preference for liquidity and risingcounterparty risk premia. Moreover, implied forward spreads at the end of theperiod under review suggested that investors expected this to be a persistentphenomenon (Graph VI.9).
The relative contributions of liquidity and credit risk to the rise in interbankrates have proved very hard to disentangle, not least because the two components are highly interrelated. The behaviour of Libor banks’ CDSspreads vis-à-vis Libor-OIS spreads suggests that, while credit concerns haveindeed played a role in driving interbank rates during the turmoil, liquidity factors have accounted for much of the dynamics (Graph VI.9). In addition, thecyclical pattern in Libor-OIS spreads to some extent also indicated seasonalliquidity shortages related to end-quarter and end-year funding concerns, whichwere more severe than normal after the first half of 2007. Further complicatingmatters, worries about the reliability of the Libor fixing mechanism began tosurface as the gridlock in interbank markets persisted, in particular for US dollar loans. Specifically, market participants voiced suspicions that somebanks in the Libor panel may have been reporting rates lower than their actualborrowing costs in order to appear stronger from a liquidity/credit risk perspective. Following reports in April that the British Bankers’ Associationwas investigating this issue, US dollar Libor rates suddenly jumped to levelsthat seemed more in line with actual borrowing rates.
One characteristic of the strains in interbank markets during the financialturbulence seems to have been difficulties for European banks, in particular,in obtaining US dollar funding, as the demand for dollar liquidity surged. BISdata on banks’ total cross-border positions by nationality suggest that
… due to counterparty riskconcerns and surging liquiditydemand
European banks were hit by dollarfunding problems

105BIS 78th Annual Report
significant differences in the global funding patterns of European and US banks may have been behind these difficulties. Over the past few years,US banks have increasingly borrowed US dollars from non-banks, and havechannelled these funds to unaffiliated banks through the interbank market(Graph VI.10, left-hand panel). At the same time, European banks haveincreasingly transformed interbank funds, and those from official monetaryauthorities, into US dollar-denominated claims on non-banks (Graph VI.10,centre panel). Overall, by the fourth quarter of 2007, US banks’ total net dollar claims on other banks had reached $421 billion, while European banks’net dollar liabilities to banks stood at almost $900 billion. Frequent rolloversby European banks of short-term dollar borrowing in the interbank market, inorder to finance longer-term investments in non-banks, had been practisedwithout problems for many years. However, as market tensions rose in thesecond half of 2007, with European banks sharing in the $380 billion declinein outstanding ABCP volumes that had to be taken back on balance sheet, thisneed for constant refinancing contributed to the liquidity squeeze witnessed inthe interbank market. Some foreign exchange swap and cross-currency swapmarkets displayed notable signs of strain consistent with this: US interest ratesderived from foreign exchange swap prices at times deviated significantly fromactual US dollar Libor during the turmoil (Graph VI.10, right-hand panel).
Credit turmoil spilled over to equity markets
Equity prices in the advanced industrial economies began to fall over the summer of 2007, following the widening of CDS spreads during the onset of thecredit market turmoil (Graph VI.11, left-hand panel). Stock prices dropped further in late 2007 and early 2008, as renewed credit-related concerns and the
Equity prices began to fall over thesummer …
2.0
2.8
3.6
4.4
5.2
6.0
2007 2008
FX swap US dollar Libor
–900
–600
–300
0
300
600
97 99 01 03 05 07
Total Interbank Monetaryauthorities
–900
–600
–300
0
300
600
97 99 01 03 05 07
Other banksNon-banks
Funding in the US dollar interbank market and swap-implied rates
US banks1 European banks1 FX swap-implied rates2
Graph VI.10
1 Net claims by bank nationality; calculated as cross-border claims minus cross-border liabilities. The interbank component is further broken down into inter-office claims (not shown), claims on other banks and claims on official monetary authorities; in billions of US dollars. 2 Three-month FX swap-implied US dollar rates calculated from euro Libor, in per cent; estimated according to the methodology described in N Baba, F Packer and T Nagano, “The spillover of money market turbulence to FX swap and cross-currency swap markets”, BIS Quarterly Review, March 2008.
Sources: Bloomberg; BIS locational banking statistics by nationality; BIS calculations.

106 BIS 78th Annual Report
worsening of the US macroeconomic outlook triggered worries about futureprofits and depressed investors’ risk tolerance. From mid-March 2008, however,share prices recovered sharply across the board, following the takeover of BearStearns by JPMorgan. Between end-March 2007 and mid-May 2008, the S&Pindex was almost unchanged, while the Nikkei 225 and DJ EURO STOXXindices fell by 18% and 9%, respectively.
Weakness concentrated in the financial sector and Japanese shares
Equity market weakness was initially concentrated in the financial sector, withbank stocks being hit particularly hard. From end-March 2007 to mid-May2008, global financial shares fell by almost 20%, the fastest pace of decline sincethe end of 1994, when the Morgan Stanley Capital International (MSCI) financialindex became available. By contrast, performance of non-financials was mixed.While the slump in the US housing was reflected in the underperformanceand steep decline in share prices in such sectors as housing construction,gains were recorded in the materials and energy sectors, due to the strongperformance of commodity markets over the period (Graph VI.11, centre panel).
Japanese equities overall showed the largest decline among advancedeconomy markets (Graph VI.11, left-hand panel). Despite the fact that Japanese financial institutions were reported to be less exposed to subprimeloans than their US and European counterparts, Japanese financial sharesrecorded a large loss. The outsize decline was also due in part to concernsabout the negative impact of the US economic slowdown on Japaneseexporters, as well as the further appreciation of the yen. Periods of rapid yenappreciation against the dollar have often coincided with weak Japaneseshare prices in the past. In line with this, the main Japanese share index fellby more than 20% as the yen appreciated by a relatively large 14% against thedollar between end-2007 and mid-March 2008.
25
50
75
100
125
03 04 05 06 07 08
S&P 500 DJ EURO STOXXFTSE 100 Nikkei 225
25
50
75
100
125
03 04 05 06 07 08
IndustrialsFinancials Materials Energy
Home construction3
10
25
40
55
70
03 04 05 06 07 08
S&P 500DAX 30 TOPIX
Equity prices and earnings expectations
Major equity indices1 Sectoral indices1, 2 Earnings revisions4
Graph VI.11
1 End-week data, in local currency; end-December 2006 = 100. 2 MSCI equity indices. 3 Equity index calculated by Datastream. 4 Diffusion index of monthly revisions in 12-month forward earnings per share, calculated as the percentage of companies for which analysts revised their earnings forecast upwards plus half of the percentage of companies for which analysts left their forecast unchanged, to adjust for analysts’ systematic overestimation of earnings.
Sources: Bloomberg; Datastream; I/B/E/S; BIS calculations.
… with bank stocks hit particularly hard
Japanese equities showed the largestdecline

107BIS 78th Annual Report
Elevated US recession risk weighed on earnings expectations
A key drag on share prices was the sharp reversal in expectations for earningsof listed firms in advanced economy markets. This largely reflected growingconcerns that the US slowdown might be more severe and prolonged thanpreviously thought. From mid-2007, diffusion indices of revisions in 12-monthforward earnings per share in major markets plunged to levels not seen since2002 (Graph VI.11, right-hand panel). These downbeat forecasts were subsequently validated by reported earnings. Cumulative earnings per share inthe United States fell by more than 20% (year over year, share-weighted basis)in the fourth quarter of 2007, considerably more than the 3% decline in theprevious quarter. In January 2008, accumulating evidence of weaker real economic activity prompted further downward revisions to expected earnings.From March 2008, however, earnings expectations started to recover in theUnited States and key European countries.
At the same time, heightened uncertainties about the outlook resulted inmuch higher volatility and declining risk tolerance. Option-implied marketvolatility in the United States, on an uptrend since early 2007, reached 30% inAugust 2007 and early 2008, close to levels last seen in April 2003. This ismore than twice the 2004–06 average of 14%, and substantially higher thanthe historical (1986–2006) average of around 20% (Graph VI.12, left-hand panel).Volatilities in other equity markets followed a similar pattern, with the surgebeing particularly pronounced in Japan, where volatility approached the peakseen in 2001. Indicators of investors’ tolerance for risk in equity markets, measured by differences between the statistical distribution of actual equityreturns and the distribution implied by option prices, also deteriorated markedlyup to March 2008, reaching the lowest levels since 2005 (Graph VI.12, centrepanel). Following the news of the takeover of Bear Stearns in mid-March,
Earnings expectations fellsharply on evidence of weakereconomic activity
Volatility increased and risk tolerancedeclined
0
15
30
45
60
87 90 93 96 99 02 05 08
VIX2 DJ EURO STOXXFTSE 100 Nikkei 225
–6
–4
–2
0
2
2005 2006 2007 2008
S&P 500 DAX 30 FTSE 100 Principal component4
0
20
40
60
80
89 92 95 98 01 04 07
S&P 500DAX 30 TOPIX
Equity market volatility and valuations
Implied volatility1 Risk tolerance3 12-month forward P/E ratio5
Graph VI.12
1 Annualised volatility implied by the price of at-the-money call option contracts on stock market indices; monthly averages, in per cent. 2 Based on S&P 500; prior to 1990, based on S&P 100. 3 Derived from the differences between two distributions of returns, one implied by option prices, the other based on actual returns estimated from historical data; weekly averages of daily data. 4 First principal component of risk tolerance indicators for the S&P 500, DAX 30 and FTSE 100. 5 Ratio of the stock price and 12-month forward earnings per share.
Sources: Bloomberg; I/B/E/S; BIS calculations.

0
2
4
6
00 02 04 06 080
2
4
6
00 02 04 06 080
2
4
6
00 02 04 06 08
Long-term1
Short-term2
Interest ratesIn per cent
United States Euro area Japan
Graph VI.13
1 Ten-year government bond yield; for the euro area, German bund. 2 Three-month interbank offered rate.
Sources: Bloomberg; national data.
108 BIS 78th Annual Report
however, equity prices in advanced industrial economies rebounded, in linewith a decline in volatilities and recovering risk appetite.
Declining risk appetite up to March 2008 was also evidenced by lower valuations, based on price/earnings ratios. Forward-looking valuation measuresfell over the period, as downward revisions in earnings did not keep pace withthe sharper decline in equity prices, despite analysts’ increasing pessimism.For example, the S&P 500 fell from around 14 times one-year-ahead forecastearnings in 2006 to 13 in March 2008, its lowest level since 1995. The level inMarch 2008 was well below the average since 1988, but in line with averagesduring 1988–97, which excludes the valuation peaks of the late 1990s, a periodmarked by extreme optimism among equity investors (Graph VI.12, right-handpanel). Valuation measures based on the DAX and TOPIX declined as well; byMarch 2008 they stood well below long-term averages.
Bond yields fell sharply as the financial turmoil deepened
After seeing mostly rising long-term yields in the first half of 2007, developedcountry government bond markets experienced rapidly falling yields as theturmoil broke out. This strong downward pressure on yields was the result ofa combination of flight to safety and expectations of lower interest rates as theoutlook for economic growth deteriorated. The impact of both factors wasespecially evident in the United States, where the economy appeared particularly fragile. Between the local pre-turmoil peak in mid-June 2007 –which was still low by historical standards – and the Bear Stearns collapsearound mid-March 2008, 10-year US government bond yields fell by almost200 basis points to around 3.35%, a level not seen since 2003 (Graph VI.13,left-hand panel). Yields also dropped in the euro area and Japan, although toa lesser extent, reflecting perceptions that downside risks for these economieswere less acute than for the United States: 10-year euro area bond yields fellnearly 100 basis points to below 3.70%, while corresponding Japanese yieldsdeclined by some 70 basis points to just below 1.30% (Graph VI.13, centre andright-hand panels). As the situation in global financial markets seemed to
Forward-looking valuation measuresfell
Bond yields tumbled …

109BIS 78th Annual Report
stabilise and improve to some extent from around mid-March 2008, bondyields recovered somewhat: between mid-March and mid-May, 10-year US andeuro area yields rose by around 50 basis points, while in Japan they increasedby more than 40 basis points.
Flight to safety led to scramble for government securities
When credit markets first started to sell off in summer 2007, investors quicklybegan scaling back their holdings of risky assets, leading to much higherdemand for relatively safe government securities. Apart from tumbling yields,the result was a shortage of available government bills and bonds for repotransactions, particularly towards the end of 2007 and in early 2008. Thisshortage manifested itself in a sharp increase in the number of Treasury“fails” in the United States, ie situations in which a trade involving Treasurysecurities fails to settle on schedule (including both fails to receive and fails todeliver). Whereas such fails had averaged around $90 billion per week in thefirst three quarters of 2007, they more than doubled in the fourth quarter toover $200 billion per week, and surged further to a weekly average in excessof $700 billion in the first one and a half quarters of 2008.
The flight to safety, in combination with the rush for liquidity, resulted ina significant rise in inflows into money market funds. In the United States, forexample, while total net assets in money market funds had fluctuated between $1.8 trillion and $2.4 trillion during 2000–06, they soared to more than$3.1 trillion by end-2007 and increased further to over $3.5 trillion three monthslater, before stabilising. With a large part of these inflows being invested inshort-dated government securities, this added to the severe downward pressure on such securities, in particular US Treasury bills (Graph VI.14, left-hand panel). On occasion, the three-month T-bill traded more than 180 basispoints below the corresponding expected average federal funds rate, asreflected by the three-month OIS rate. At the same time, a number of mutualfunds that had invested in short-term securities related to subprime mortgages
… as investors sought safe havens …
0
1
2
3
4
5
2007 2008
Fed funds target Fed funds effective3-m US T-bill 3-m USD OIS
0
15
30
45
60
75
2004 2005 2006 2007 2008
United States Euro area United Kingdom
–15
0
15
30
45
60
2004 2005 2006 2007 2008
Italy Spain PortugalGreece
Interest rates and spreads
US interest rates1 Swap spreads2 Euro yield spreads3
Graph VI.14
1 In per cent. 2 Ten-year, in basis points. 3 Ten-year generic government bond yields minus German generic 10-year government bond yields, in basis points.
Sources: Federal Reserve Board; Bloomberg; JPMorgan Chase; BIS calculations.
110 BIS 78th Annual Report
were hit by the turmoil. Indeed, in some cases these funds required parentinstitutions to inject capital in order to prevent their net asset value from fallingbelow par.
As the market turmoil unfolded, swap spreads widened substantially, with10-year US, euro area and UK spreads reaching levels not seen since 2001(Graph VI.14, centre panel). This seemed to reflect in part heightened concernsamong investors about systemic risks, as fears of instability in the bankingsystem accumulated. In addition, the rise in swap rates vis-à-vis governmentbond yields reflected investors’ flight from risky assets into government securities, as well as increased use of swaps in an effort to hedge credit-related exposures in an environment where liquidity in traditional hedgingmarkets was becoming increasingly scarce.
In yet another sign of heightened liquidity preference and lower appetitefor risk, spreads between German and other individual euro area governmentbond yields widened to unusually high levels after mid-2007 (Graph VI.14,right-hand panel). The spread between Spanish and German 10-year bondyields, for example, rose from around 5 basis points in June 2007 to over 40 basis points in March 2008, and corresponding Italian spreads increasedfrom about 20 to 60 basis points, before recovering somewhat by mid-May.Although some commentators attributed this widening of spreads in part toconcerns about growing stresses within the monetary union linked to differences in fundamentals, it appeared more likely that the lion’s share wasdue to investors’ extreme unwillingness to hold anything but the most liquidsecurities available.
Recession fears drove yields further down
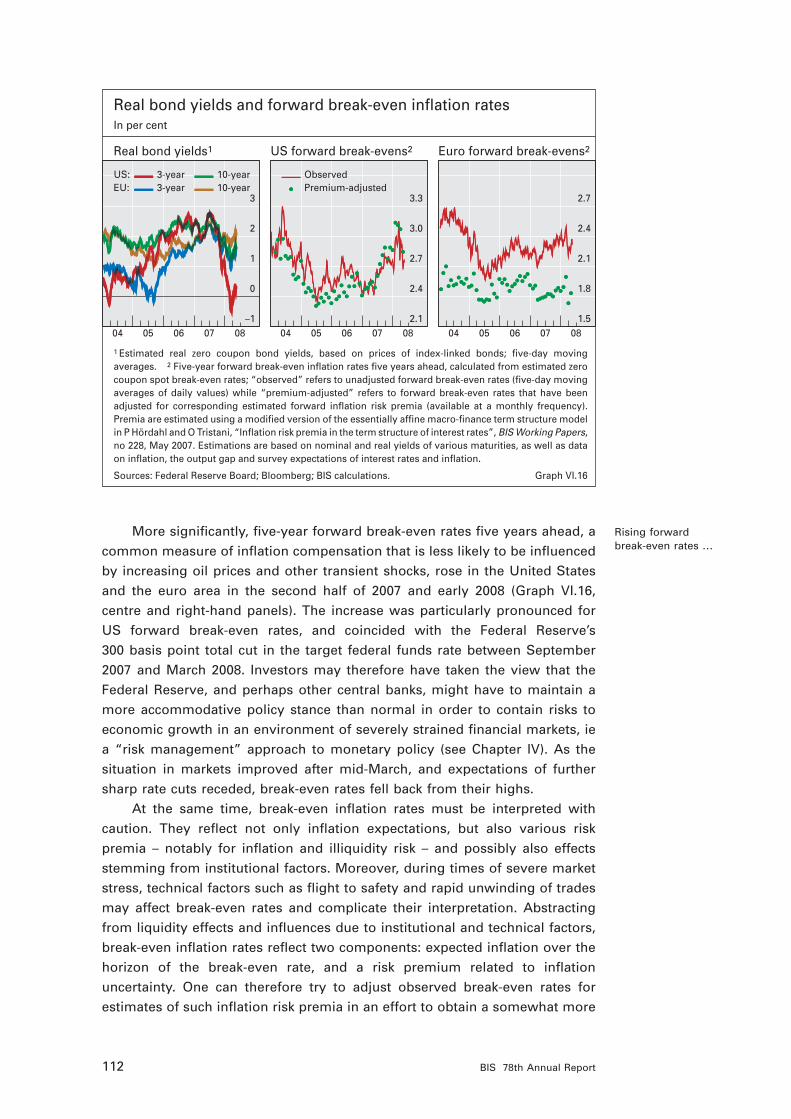
Perceptions of a weakening economic outlook gradually reinforced the downward pressure on yields exerted by the flight to safety. In line with this,around three quarters of the decline in long-term yields seen in the US andeuro area markets for nominal bonds since mid-2007 was attributable to fallinglong-term real yields. Short- to medium-term real yields declined even moresharply: for example, estimated US three-year real zero coupon yields plungedby almost 300 basis points between end-May 2007 and mid-March 2008, totrade at negative yield levels (Graph VI.16, left-hand panel). This largely reflectedexpectations that short-term nominal interest rates would on average be lowerthan inflation in the United States for a number of years to come, implying aprotracted period of low policy rates, presumably as a result of weak growth,coupled with lingering inflation. Short-term real yields also fell in the euro area,but substantially less than in the United States: between end-May 2007 andmid-March 2008, three-year real euro area yields fell by 130 basis points toaround 0.90%. As tensions in financial markets appeared to ease to someextent, real yields also recovered somewhat between mid-March and mid-May.
Despite persistent inflation pressures, market expectations of policy ratecuts intensified as the growth outlook deteriorated, in particular in the UnitedStates. While prices of federal funds futures contracts in early summer 2007had indicated expectations of a broadly stable monetary stance for some time– consistent with Federal Reserve signalling at the time – this picture changed
… amid falling appetite for risk …
… and expectations of weakening economic growth

111BIS 78th Annual Report
rapidly as conditions in financial markets worsened (Graph VI.15, left-handpanel). By the fourth stage of the turmoil, in November 2007, the target federalfunds rate had already been cut by 75 basis points, yet markets expected stillmore easing in the months ahead. With the situation deteriorating further at thebeginning of 2008, the total additional 200 basis point target rate reductionannounced by the Federal Reserve in the first quarter was even larger thanhad been anticipated by investors in late 2007. This, together with new measures announced by the Federal Reserve to provide liquidity to marketparticipants, and the rescue of Bear Stearns in March, seemed to help rebuildsome confidence among investors. By mid-May, following a further 25 basispoint easing on 30 April, prices of federal funds futures contracts indicatedexpectations of a period of interest rates on hold.
In the euro area and Japan, expected policy rates also shifted downwardsas the turmoil unfolded, although, compared to US rates, investors’ revisionswere much more measured, as were subsequent actual policy moves. Prior tothe crisis, markets had seen rates continuing to rise gradually in both the euroarea and Japan (Graph VI.15, centre and right-hand panels). Perceptions thatthese economies were less vulnerable than the United States, in combinationwith central bank signalling, led market participants in the second half of 2007to only gradually reassess their expectations for policy rates in both economies.
Break-even inflation rates rose despite a softening economic outlook
While the outlook for economic activity weakened as the financial turmoilunfolded, this seemed to have little dampening effect on inflation expectations,as measured by surveys of analysts’ inflation forecasts. Part of the reason wasdoubtless an accelerating rise in oil prices as well as a sharp pickup in foodprices, which pushed up headline inflation figures. This probably also contributed to stable and, at times, rising spot break-even inflation rates in theUnited States and in the euro area.
1
2
3
4
5
2007 20083.4
3.7
4.0
4.3
4.6
2007 20080.2
0.5
0.8
1.1
1.4
2007 2008
Target rate1
1 Jun 20072 30 Nov 20072
16 May 20082
Policy rates and implied expectationsIn per cent
United States Euro area Japan
Graph VI.15
1 Central bank policy rate; for the United States, target federal funds rate; for the euro area, ECB main refinancing rate; for Japan, Bank of Japan uncollateralised overnight call rate. 2 Implied one-month rates; observations are positioned on the last business day of the month indicated in the legend; for the United States, federal funds futures; for the euro area, EONIA swap; for Japan, yen OIS.
Sources: Bloomberg; BIS calculations.
The Federal Reserve cut ratessignificantly …
… and investors expected less tightmonetary policyelsewhere
112 BIS 78th Annual Report
More significantly, five-year forward break-even rates five years ahead, acommon measure of inflation compensation that is less likely to be influencedby increasing oil prices and other transient shocks, rose in the United Statesand the euro area in the second half of 2007 and early 2008 (Graph VI.16, centre and right-hand panels). The increase was particularly pronounced forUS forward break-even rates, and coincided with the Federal Reserve’s 300 basis point total cut in the target federal funds rate between September2007 and March 2008. Investors may therefore have taken the view that theFederal Reserve, and perhaps other central banks, might have to maintain amore accommodative policy stance than normal in order to contain risks toeconomic growth in an environment of severely strained financial markets, iea “risk management” approach to monetary policy (see Chapter IV). As the situation in markets improved after mid-March, and expectations of furthersharp rate cuts receded, break-even rates fell back from their highs.
At the same time, break-even inflation rates must be interpreted with caution. They reflect not only inflation expectations, but also various risk premia – notably for inflation and illiquidity risk – and possibly also effectsstemming from institutional factors. Moreover, during times of severe marketstress, technical factors such as flight to safety and rapid unwinding of tradesmay affect break-even rates and complicate their interpretation. Abstractingfrom liquidity effects and influences due to institutional and technical factors,break-even inflation rates reflect two components: expected inflation over thehorizon of the break-even rate, and a risk premium related to inflation uncertainty. One can therefore try to adjust observed break-even rates for estimates of such inflation risk premia in an effort to obtain a somewhat more
Rising forward break-even rates …
–1
0
1
2
3
04 05 06 07 08
US:EU:
3-year3-year
10-year10-year
2.1
2.4
2.7
3.0
3.3
04 05 06 07 08
Observed Premium-adjusted
1.5
1.8
2.1
2.4
2.7
04 05 06 07 08
Real bond yields and forward break-even inflation ratesIn per cent
Real bond yields1 US forward break-evens2 Euro forward break-evens2
Graph VI.16
1 Estimated real zero coupon bond yields, based on prices of index-linked bonds; five-day moving averages. 2 Five-year forward break-even inflation rates five years ahead, calculated from estimated zero coupon spot break-even rates; “observed” refers to unadjusted forward break-even rates (five-day moving averages of daily values) while “premium-adjusted” refers to forward break-even rates that have been adjusted for corresponding estimated forward inflation risk premia (available at a monthly frequency). Premia are estimated using a modified version of the essentially affine macro-finance term structure model in P Hördahl and O Tristani, “Inflation risk premia in the term structure of interest rates”, BIS Working Papers, no 228, May 2007. Estimations are based on nominal and real yields of various maturities, as well as data on inflation, the output gap and survey expectations of interest rates and inflation.
Sources: Federal Reserve Board; Bloomberg; BIS calculations.

113BIS 78th Annual Report
accurate picture of investors’ inflation expectations. Estimates of inflation premia can be obtained, for example, by jointly modelling the dynamics ofnominal and index-linked bond yields together with macro variables. Accordingto estimates from such a model, the rise in the US forward break-even rateuntil around mid-March seemed to be largely due to rising long-horizon inflation expectations (Graph VI.16, centre panel). By contrast, while some ofthe short-term fluctuations in euro area forward break-even inflation rates alsoappeared to reflect changing inflation expectations, the model estimates suggest that much of the increase that took place in the second half of 2007and early 2008 was attributable to rising inflation risk premia (Graph VI.16,right-hand panel).
Emerging market assets showed signs of resilience
Emerging market asset values, which experienced significant growth in thefirst half of 2007, generally proved to be more resilient during the turmoil thanthose of comparable asset classes elsewhere and, indeed, than in previousepisodes of market turbulence in advanced economies.
During the first half of 2007, emerging market asset prices soared, underpinned by yet another year of strong economic performance. Emergingeconomies continued to experience rapid growth, with surging commodityprices supporting further improvements in fiscal and balance of paymentspositions in many countries (see Chapter III). Despite a brief period of marketturbulence in late February 2007, the JPMorgan EMBIG index of spreads onUS dollar-denominated sovereign debt continued to drift lower up to mid-year,reaching an all-time low of 151 basis points in early June (Graph VI.17, centrepanel). Emerging equity markets also saw strong gains, with the MSCI indexup 16% by mid-year (Graph VI.17, left-hand panel).
… seemed to signal higherexpected US inflation
75
100
125
150
175
2007 2008
S&P 500 Asia Latin AmericaEurope
0
200
400
600
800
2007 2008
IG2, 3
HY2, 4
EMBIG5
EM2, 6
91
94
97
100
103
–15 –10 –5 0 5 10 15
MSCI EMS&P 500
Emerging market financial indicators
Equity indices1 Credit spreads Relative performance7
Graph VI.17
1 3 January 2007 = 100. 2 Five-year on-the-run CDS spreads, in basis points. 3 DJ CDX IG High Volatility. 4 DJ CDX HY. 5 JPMorgan Chase EMBI Global (EMBIG) sovereign stripped spreads, in basis points. 6 DJ CDX EM. 7 Thick lines indicate the average over 11 turbulent periods, from 2000 to July 2007, where turbulent periods are defined as sudden and sustained increases in the VIX index. Thin lines indicate the average over three post-July 2007 turbulent periods, starting on 20 July, 1 November and 27 December, respectively. The horizontal axis indicates the number of trading days before and after the start of a turbulent period.
Sources: Bloomberg; JPMorgan Chase; BIS calculations.

114 BIS 78th Annual Report
In line with the general repricing of risk, emerging market asset valuesexperienced considerable swings in the second half of the year, although not aslarge as those observed in some mature economies. Between end-June and26 November 2007, spreads on emerging market sovereign debt widened by107 basis points, much less than the widening in US high-yield credit marketsover the same period. Moreover, while the cost of insuring emerging marketsovereign debt against default, tracked by the CDX EM index, rose during theturmoil, spreads on CDS contracts of similar maturity on some US investmentgrade paper rose even more. By November 2007, the CDX EM had fallen wellbelow the high-volatility subindex of the North American investment gradeCDX index (Graph VI.17, centre panel).
Emerging equity markets were hit particularly hard during the initial stagesof the turmoil, although they proved to be more resilient relative to markets insome mature economies during later stages. From their peak on 23 July, theygave back a large part of their gains from the first half of the year over the nextmonth, with the broad MSCI emerging market index down 18% by 17 August,compared to a 10% decline in the global index over the same period. However,emerging market equities rebounded in September and October, boosted byparticularly strong performance in Asia (24%) and Latin America (25%) duringthese months. By year-end, the broad indices for each of the three emergingregions were still above their 23 July levels, while the major indices for theUnited States, Japan and Europe had all registered declines of 4% or more.
As in advanced industrial economies, concerns over a more widespreadslowdown in growth clearly began to weigh on many emerging markets inearly 2008. The string of weak real side data for the United States released inJanuary sparked a global equity market sell-off, leaving the broad emergingmarket index down more than 10% for the month. Spreads on emerging marketsovereign debt also widened in the wake of the sell-off, with the EMBIG
Emerging market assets followedglobal markets lower in August …
… and in early 2008
–0.2
0
0.2
0.4
0.6
–0.4
0
0.4
0.8
1.2
97 99 01 03 05 07–1.5
0
1.5
3.0
4.5
–0.8
0
0.8
1.6
97 99 01 03 05 07–0.3
0
0.3
0.6
0.9
–0.6
0
0.6
1.2
97 99 01 03 05 07
Index levels (lhs) S&P 500 index (rhs)Oil price (rhs)
Agricultural prices (rhs)US High Yield (rhs)
Sensitivity of emerging market equity indices to global factors1
Asia-Pacific Latin America Emerging Europe
Graph VI.18
1 The lines plot the estimated coefficients from 100-day rolling regressions of the daily percentage change in the MSCI regional equity index on the daily percentage change in the S&P 500 index, the daily percentage change in the price of oil, the daily percentage change in the price of agricultural products, and the daily percentage point change in Merrill Lynch US High Yield option-adjusted spreads. Only coefficients with an associated t-statistic larger than 1.5 are plotted.
Source: BIS calculations.

115BIS 78th Annual Report
ultimately reaching 339 basis points on 17 March, as news of the worseningfinancial distress of Bear Stearns reached the market.
The sharp declines in emerging equity markets in early 2008 differed significantly across countries. Rising commodity prices provided support formarkets in Russia, Latin America and the Middle East but at the same timefuelled concerns about domestic inflation in all emerging regions (see Chapter III). Latin American equity markets quickly rebounded after the January sell-off, with indices in Brazil, Chile and Peru trading near their all-timehighs in late March. In contrast, Asian equity markets had fallen more than 20%by mid-March, with markets in China, India and the Philippines down the most.In China, in particular, efforts by the domestic authorities to slow the economy,combined with an appreciation of the renminbi against the US dollar and risingfood and oil prices, caused equity investors to question the valuations of Chinese corporates, which by late 2007 had exhibited price/earnings ratiosnear 50. By 18 April 2008, the Shanghai equity index had fallen by almost 50%from its 16 October 2007 peak, eliminating much of the gains achieved earlierin 2007.
Throughout the period of market turbulence, asset values in manyemerging economies were supported by perceptions that the downside risksto growth were more limited than for the United States and other advancedindustrial economies (see Chapter III). In both emerging equity and credit markets, asset prices thus exhibited a somewhat muted sensitivity to movements in US equity and credit markets relative to earlier periods. Forexample, in three distinct episodes of sudden and sustained increases involatility in US equity markets since July 2007, emerging market equity pricesheld up relatively well, outperforming the S&P 500 during the first 15 trading
–0.30
–0.15
0
0.15
0.30
0.45
98 00 02 04 06 08 98 00 02 04 06 08–0.6
–0.3
0
0.3
0.6
0.9
98 00 02 04 06 08
Model 1 minus model 2 (lhs)
Model 1 (rhs)Model 2 (rhs)
Conditional correlation between emerging market and US credit spreads1
Asia-Pacific Latin America Emerging Europe
Graph VI.19
1 Model 1 tracks the time-varying correlation between the daily changes in option-adjusted spreads on the JPMorgan Chase EMBI Global Diversified index for each region and changes in option-adjusted spreads on the Merrill Lynch US high-yield index, estimated using a bivariate GARCH model. Model 2 tracks these correlations estimated with a model which controls for global factors (option-adjusted spreads on the Merrill Lynch US investment grade index, MSCI Global equity index and the S&P GSCI Commodity price index); 10-day moving average.
Sources: Bloomberg; JPMorgan Chase; Merrill Lynch; national data; BIS calculations.
Surging commodities supported equitymarkets in somecountries
Price sensitivity to US market moveshas declined …

116 BIS 78th Annual Report
days in each period (Graph VI.17, right-hand panel). This stands in contrast toprevious periods of turbulence in US markets, when emerging markets tendedto underperform.
In part, the resilience of emerging market assets has reflected both robustdomestic growth in many countries and support from surging commodityprices. Some statistical evidence drawn from rolling panel regressions seemsto confirm this observation (Graph VI.18). The sensitivity to US equity markets,which had been rising in most regions since 2003, started to wane in mid-2006,and then fell significantly after July 2007 as the financial turmoil erupted. Over this same period, the daily changes in commodity prices seemed toemerge as more important drivers of emerging equity returns, particularly inLatin America.
Estimates based on credit spread data provide some evidence of a similar disconnect between emerging market sovereign debt markets andthose for US high-yield credit. A simple estimate of the time-varying correlationbetween spreads in these markets stayed at a relatively high level by historicalstandards, following a generally upward trend since at least 2004 (green linein Graph VI.19). However, once other US and global factors (commodity prices,global equity prices and US investment grade credit spreads) are taken intoaccount (red line), the correlations showed a more significant drop from 2007,particularly during the recent period of credit market turmoil.
… in both emerging equitymarkets …
… and emerging credit markets