'VI - Defense Technical Information Center · 7.2 Metric: Schedule ... 8. IMPLEMENTATION...
99
TECHNICAL REPORT NO. 532 -L:'i SCT-ftARE TEST AND EVALUATION PANEL (STEP) SOFTWARE METRICS INITIATIVES REPORT HENRY P. BETZ PATRICK J. O'NEILL APRIL 1993 APPROVED FOR PUBLIC RELEASE; DISTRIBUTION IS UNLIMITED. Accesion For-.. NTIS CRA&M-- DTIC TAB ] U•,annouiced Q Justification By 'Distribution I Availability Codes Avail and I or Disi Special 'VI
Transcript of 'VI - Defense Technical Information Center · 7.2 Metric: Schedule ... 8. IMPLEMENTATION...

TECHNICAL REPORT NO. 532
-L:'i SCT-ftARE TEST AND EVALUATION PANEL (STEP)
SOFTWARE METRICS INITIATIVES REPORT
HENRY P. BETZPATRICK J. O'NEILL
APRIL 1993
APPROVED FOR PUBLIC RELEASE; DISTRIBUTION IS UNLIMITED.
Accesion For-..
NTIS CRA&M--DTIC TAB ]U•,annouiced QJustification
By'Distribution I
Availability Codes
Avail and I orDisi Special
'VI

ACKNOWLEDGEMENTS
The U.S. Army Nateriel Systems Analysis Activity (AMSAA) recognizes thefollowing individual for contributing to this report:
Peer Reviewer: Barry H. Bramell, Reliability, Availability, andMaintainability Division (RAND)
Authors: Henry P. Betz, RAND, Patrick O'Neill, Combat Support Division.
/
a/
iii The next page i s blank.

CONTENTS
PAGE
ACKNOWLEDGEMENTS ................................................. tt
1. INTRODUCTION ............................................... 1
2. MEMBERSHIP ................................. . ............ .1
3. OBJECTIVES ................................................. 1
* 4. METHODOLOGY ............ .......... 1
"5. METRIC CRITERIA ............................................ 2
6. FINDINGS ................................................... 3
7. METRIC SET ......................... 47.1 Metric: Cost ........................ 77.2 Metric: Schedule ............................... 147.3 Metric: Computer Resource Utilization (CRU) .......... 197.4 Metric: Software Engineering Environment ............. 247.5 Metric: Requirements Traceability .................... 277.6 Metric: Requirements Stability ....................... 337.7 Metric: Design Stability ............................ 387.8 Metric: Complexity ................................... 427.9 Metric: Breadth of Testing .......................... 497.10 Metric: Depth of Testitg ............................. 537.11 Metric: Fault Profiles ............................... 577.12 Metric: Reliability .................................. 64
8. IMPLEMENTATION CONSIDERATIONS .............................. 678.1 Qualifying Rules ...................................... 678.2 Grandfathering ........................................ 678.3 Data Collection ....................................... 678.4 Life Cycle Application ................................ 69
9. TAILORING .................................................. 71
10. JUSTIFICATION FOR METRIC SET ............................... 71
- 11. COSTS AND BENEFITS ......................................... 74
12. METRICS DATA BASE .................................. ........ 74
13. RECOMMENDATIONS ............................................ 75
14. CONCERNS ................................................... 76
V

CONTENTS (Continued)
PAGE
APPENDIX
A - OPTIONAL METRICS .............................. .............. 79A.1 Metric: Manpower ....... .... ...................... 81A.2 Metric: Development Progress ......................... 85
ACRONYMN ........................ . . . . . . . . . . . .... 89
DISTRIBUTION LIST ................................................ 93
b
vi

ARMY SOFTWARE TEST AND EVALUATION PANEL (STEP)
SOFTWARE METRICS INITIATIVES REPORT
1. INTRODUCTION
This report documents the efforts and portrays the findings and recom-mendations of the Army Software Test and Evaluation Panel (STEP) Subgroup onMeasures. The final recommendations include the mandatory use of a minimum,common set of software metrics in order to better measure and manage softwaredevelopment from the test and evaluation perspective. This set of measuresshould be used to help determine whether the system under consideration hasdemonstrated the necessary functionality, maturity, and readiness to proceedto the next stage of development or testing. This set of metrics is a minimumset; other metrics of specific interest to a certain agency or point of viewcan and should be collected if desired.
Of course, there are many characteristics of the software that need tobe evaluated for quality and conformance but do not lend themselves tomeasurement. These quality factors remain important to any evaluation ofsoftware. Metrics are simply one element of a set of tools that should beused in a software evaluation.
2. MEMBERSHIP
The Measures Subgroup of the STEP was chaired by the U.S. Army MaterielSystems Analysis Activity (AMSAA). The following organizations participatedin the subgroup activities: AMSAA; Test and Evaluation Command (TECON);Communications and Electronics Command (CECOM) Concurrent Engineering Direc-torate; CECON Center for Software Engineering; Armaments, Munitions, andChemical Command (ANCCOM) Product Assurance and Test Directorate; InformationSystems Support Command (ISSC); Information Systems Engineering Command(ISEC); Operational Test and Evaluation Command (OPTEC); Headquarters, ArmyMateriel Command (HQ, AMC); the Software Engineering Institute (SEI); AirForce Operational Test and Evaluation Center (AFOTEC).
3. OBJECTIVES
The objective of the Measures Subgroup was to force Army level focus onthe application of the principles of Total Quality Management (TQM) to thedevelopment and management of software. Specifically, the group's mission wasto develop a common set of measures which can be used throughout the softwarelife cycle to Judge the maturity and readiness of the software to proceed tothe next stage of development or testing.
4. METHODOLOGY
The Measures Subgroup was formed because the consensus of the STEP was
that measuring software characteristics may help to improve the Army's abilityto manage software development. The subgroup did not by itself study thecurrent software development, test, and evaluation process; that effort wasundertaken and documented by other STEP subgroups. Hence, the implicitassumption was that the measurement of software characteristics should beapplied regardless of the process framework.

The problem of developing a set of measures was approached from theviewpoint that first, it must be determined what was important to measure, andsecond, appropriate metrics must be found to measure those important charac-teristics of the software. The emphasis on TQM meant that both process andproduct measures had to be developed, so that the process can continually beimproved.
The group first attempted to capture the state of the Army in softwaremeasurement, as well as the state of the art. These states were examined byway of literature searches, limited case studies, and discussions withrecognized experts in the academic world, industry, and government.
The group also recognized early on that it was important to have atractable set of measures. It was imperative that the most important softwarecharacteristics be measured, while keeping the sheer volume of metrics to amanageable number. Along the same lines, thought was given to the developmentof metrics whose inputs would be relatively easy to collect. These goals wereimportant in order to avoid yet another exhaustive compendium of metrics. Tobe acceptable to both the Army's development community as well as the test andevaluation community, the set of measures must be necessarily tractable whilecovering the entire spectrum of software characteristics that are important totest and evaluation. The group's concern about having a minimum set of.metrics was later reinforced and applauded by NASA personnel, who are recog-nized in many circles as the government leader in the use of software metrics.
5. METRIC CRITERIA
In order to fit the somewhat restrictive guideline of representing asingle, minimum, useful set of measures, it was necessary to establish certaincriteria for accepting a metric.
First, the metric had to address the objectives and mission of thegroup. Therefore, focus was placed upon the following areas of interest:demonstrated results under stress loads, demonstrated functionality, complete-ness of the development process, and readiness of the product for advancementto the next milestone or test.
Second, in order for the metric to be useful it was felt that it must beunambiguous; possess a prescribed method for data gathering and evaluation; beeasy to gather and non-labor intensive to evaluate; be consistently interpret-ed; prescribe resulting actions that are objective, timely, and finite; andhave intrinsic worth (i.e., demonstrate value-added).
Lastly, the group also agreed that, to the extent possible, question-naires, weighting schemes, and other subjective techniques would be avoided.
2

6. FINDINGS
The group quickly discovered that there is no shortage of metric ideas.Indeed, many organizations (government and private sector) use some type ofsoftware metrics, and many academic researchers are pursuing novel ideas andapproaches. The group consensus, as supported by both document reviews andpersonal contacts, was that the Army does not in general use metrics to helpmeasure software readiness. While there are a few pockets of metric use inthe Army, those pockets use metrics in differing fashions. Furthermore, theuse of metrics is not approached in an engineering fashion.
A related problem in the Army (as indicated through the case studiesperformed by the STEP) is that even when metrics are specified in documentslike the Test and Evaluation Master Plan (TEMP), the data are often notcollected. Further, in some instances the basic data are collected but arenot reported in a timely fashion.
Through literature searches, months of subgroup efforts, case studies,and visits to key industrial, government, and academic institutions, thesubgroup arrived at a minimum set of software metrics. This minimum set wassent through a limited Army staffing. Section 7 describes the recommendedmetric set in detail.
3

7. METRIC SET
The recommended minimum metric set is described in this section. In thecourse of the subgroup activities, the number of metrics varied between nineand fifteen. The final outcome was a recommended minimum set consisting oftwelve metrics. Two of the additional three metrics, while not part of theminimum set, are described in Appendix A as optional. These two metrics(manpower, development progress) were moved out of the minimum set because ofseveral reasons: they were among the most costly metrics in terms of datacollection; their basic data are often collected as part of existing programdevelopment or test and evaluation activities; the set of fifteen was deemedtoo large. The metric on documentation, which was in earlier versions of theset, has been deleted entirely, primarily due to the fact that the groupconsidered it too subjective for purposes of measurement, as well as overlylabor intensive. An assessment of documentation is typically performed as aroutine part of an independent government evaluation.
The metrics are not given in priority order. Rather, we have attemptedto group them in a logical fashion: management metrics, requirements metrics,and quality metrics. The management metrics (cost, schedule, computerresource utilization, software engineering environment) deal with management,contracting, and programmatic issues. The requirement metrics (requirementstraceability, requirements stability) deal with the specification, transla-tion, and volatility of requirements (reqts). The quality metrics (designstability, complexity, breadth of testing, depth of testing, fault profiles,reliability) deal with testing and quality aspects. Cost and schedule, inaddition to being useful as measures, should also be helpful in evaluating theutility of the other metrics (e.g., as predictors).
The metrics span both process and product measures. However, there isnot a clean delineation between which metrics are process measures and whichare product measures. Indeed, some measures fall into both categories.
Several things must be kept in mind in reading this section.In keeping with the underlying STEP tenet of encouraging a single Armysoftware T&E process, an attempt was made to address both systems governed bythe AR 70 series of regulations and those governed by the AR 25 series ofregulations.. That is, the metrics are intended to address a single Armyprocess for both Materiel Systems Computer Resources (MSCR) (formerly MissionCritical Computer Resources (MCCR)) and Automated Information Systems (AIS).
Many terms are tied to the life cycle model portrayed in DOD-STD-2167Aand DOD-STD-2168. However, the entire metrics definition activity, as well asall other STEP activities, has been predicated on the recognition that manyArmy systems currently being developed are using a non-traditional systemacquisition model, including several derivatives of the Army StreamlinedAcquisition Program (ASAP). For example, many of today's systems are follow-ing an evolutionary acquisition strategy (e.g., the Army Tactical Command andControl System (ATCCS) and its component systems). Some of the systems chosenas case studies for the Metrics Subgroup (e.g., the All Source Analysis Systemand the Maneuver Control System) are being developed using non-traditional
4

strategies. It is the firm belief of the STEP that the metrics can also beapplied to systems using these non-traditional strategies.
In a similar vein, many terms used to depict the software life cycle areterms which traaitionally pertain to a waterfall software life cycle model.The metrics r-,n also be applied to systems whose software is being developedfollowino ither a "spiral" life cycle model or some other non-traditionalderivative.
While some of the metric descriptions assume that the software is beingdeveloped by a contractor, an attempt has been made to use the term "develop-er" in lieu of "contractor." In this context, the term "developer" refers toeither a private contractor or an in-house government development activity.Regardless of who the developer is, the same metrics should be used.
It must also be pointed out that the graphs shown in this section aremerely for illustration. Many trends are possible for each metric. Addition-ally, there are other ways of processing and dl playing the data to becollected that may be very appropriate for specific systems.
Finally, it must be stated that the metrics should be used as indica-tors; they should be used to portray trends over time, rather than placing toomuch importance on a calculated value at a single point in time. The trendscan be studied in and of themselves, or they can be compared with trends fromsimilar systems that have already been built. Within the body of thissection, we have tried to specify rules of thumb for those metrics whereexperience seems to indicate that a single value makes sense. As the metricsbecome proven, validated entities, numerical thresholds and exit criteria mayemerge. Even as a scientifically validated set, however, the metrics remainmost useful when used as indicators of trends.
Table 7-1 presents a list of the metrics with a summary of the primarycharacteristics the metrics are intended to address.
5

do0
4' C 4. 44
0- 4- U 0 *- 4.4' 41 C . . 4
4. U.4..- .1- 16 .. @b F
4j. 0.0. . 0 0
be ~ ~ Y UmI@b 4A 0 4 I 44,IVO 16
44 1: "A0 4A0 4 0 5g
C 4-9 g- 4.06.
S4 Cv~ Yb 0. oe
0 1.- ?A 4A4
I'0 YbS 04 YbF acc 0Cb Yb 0 -S 4- U U 4 .0 Sj
UA 40 IC Ul 16 US W 4A Ub 0
000~4 0 0#A ~ 0 *5-. 16 L-. 40' 16 L. L. Yb S. U. 5 ~ *4.bi4. 4JY 4A16C 4.4. 4.0 4. 4.4 4a O
0 c
0~F "- aa--Yb 4-I. b 0
"-~~ ~ U-4 P I 0 v
~~4&4I1~do

7.1 Metric: Cost.
Puroose/Descriotion:
The cost metric provides insights into how well the cost of softwaredevelopment is being controlled. The metric takes aavantage of existingacquisition policies with an emphasis added to ensure that software items andwork are properly identified and allocated. It provides visibility of currentcost and overall schedule variances, indications of likely trouble areas,trends for future costs and overall schedule, and estimated cost at completionof the development effort.
Additionally, historical data on this metric will be one of the primarymeasures of program success or failure. An attempt will be made to correlatecost (in conjunction with other measures of success/failure (e.g., schedule,degree of user acceptance)) with the relative predictive value of othermetrics, thus aiding in the validation process.
Life Cycle Application:
Planning for cost data collection begins in the development of a WorkBreakdown Structure (WBS) for each Request For Proposal (RFP), ensuring thatsoftware items are incorporated into the WBS and retained in the Contract WBS(CWBS). This metric continues through the life of the contract(s). If thesoftware developer is a government agency, the same cost data must be collect-ed.
Algorithm/Graohical Disol1a:
Cost data are collected in accordance with current Department of Defense(DOD) and Department of the Army (DA) policies for Cost/Schedule ControlSystems Criteria (C/SCSC), Cost/Schedule Status Report (C/SSR) or ContractFunds Status Report (CFSR), whichever is appropriate for the scope of theoverall program effort. Software costs and schedules must be readily identi-fiable in the reports. This could be accomplished with a WBS that separatessoftware from other aspects of the program, or through a simple data basemanagement system that extracts the software metrics data from the larger dataset provided by the developer.
Figures 7.1-1 and 7.1-2 show typical cost/schedule displays. Figure7.1-1 displays cumulative cost and schedule data using "earned value' andactual costs relative to that which is planned, while Figure 7.1-2 displayssimilar information as deviations from the contract cost/schedule. They canbe cumulative for the whole program or broken out for critical or high riskarea displays.
The following definitions should be used in implementing the costmetric:
Budgeted Cost of Work Scheduled (BCWS) - the sum of the budgets for allwork packages, the level of effort, and apportioned effort scheduled to beaccomplished within a given time period.
7

Budgeted Cost of Work Performed (BCWP) - the sum of the budgets forcompleted work packages and completed portions of open work packages, plus theapplicable portions of the budgets for level of effort and apportioned effort.BCWP is also called earned value.
Actual Cost of Work Performed (ACWP) - the cost actually incurred inaccomplishing the work performed within the given time period.
Contract budget baseline - the total of the original contract targetcost plus negotiated contract changes plus the estimate cost of all autho-rized, unpriced work.
Estimated Cost at Completion (EAC) - the sum of all actual costs to dateplus the estimate for work remaining.
Management Reserve (MR) - that portion of the budget withheld formanagement control purposes rather than designated for the accomplishment of aspecific task.
In addition to the computation of these basic parameters, the followingvalues should also be computed:
Cost variance - BCWP - ACWP
Schedule variance - BCWP - BCWS
8

Millions of Dollars120
EAC°
00 . Contract !2ftt Baseline i
SNo
so- AOW• C ost Variance
40o Cp 'hedule Varlanoc
go-
0C L I IA a I I I I 1 -
0 1 2 8 4 6 6 7 8 9 10 11 12 13 1 15 1617I6S 19Program Month
Irigure 7.1-1
Cost Performance TrendsMillions of Dollars
20
10 Managlement Re serve •o
}Schedule Variance
-10
-20 Cost Variance
40 I I i p a I I I I I I I I JI I I I
o 1 2 8 4 6 e 7 • o 10 U 11If V 1
Program Month
Figure 7.1-29

Data Reouirements:
Cost and schedule data must be collected at least to the level of theCWBS which provides the following data. Data from lower levels are optional;reporting is based on the degree of risk that a particular configuration itempresents to the overall program. MIL-HDBK-WBS.SW shows how to configure agood CWBS that will cover the majority of software costs associated with aprogram. Some tailoring may be required to address program peculiarities.
For purposed of the data requirements, the following activity types aredefined:
Software activity types (for total project):CSCI(s) integration and testingverification and validationsoftware project managementsoftware engineering managementsoftware quality assurancesoftware configuration management
Software activity types (for each CSCI):requirements analysisdesigncoding and unit testingCSC(s) integration and testingFQTproblem resolution
investigationredesignrecoding and unit testingCSC(s) re-integration and testing
As a minimum, for C/SCSC and C/SSR qualifying systems, the followingdata should be supplied for each software activity type listed above:
BCWSBCWPACWPSchedule VarianceCost Variance
In addition, the following data should be collected for the totalproject:
BCWSBCWPACWPSchedule VarianceCost Variance
10

EACManagement Reserve$ invested in tools$ invested in new equipment and facilities
Equipment, facilities, and tools shall include the entire range of newfacilities, equipment, and test program set costs needed to support softwaredevelopment including compilers, operating costs, and tools. Software qualitycosts include all costs associated with the quality support team, includingattendance at configuration audits, document reviews, and related activities.Verification and validation costs include all costs related to verificationand validation by either the developer or an independent agent.
Freouencv Of Reportino:
monthly
Use/Interoretation:
Cost information is indispensable to both the contractor and govert...entprogram offices. MIL-HDBK-WBS.SW provides guidance in developing well definedwork and cost accounting packages dealing specifically with software effort.It amplifies the requirements of NIL-STD-881B, "Work Breakdown Structure forDefense Materiel Items."
When properly identified, reported and interpreted, cost information canshow how the program is progressing. Looking strictly at high level data maymask underlying problems in a lower level that will manifest themselves inlarge program problems downstream if they are not tended to immediately.Thus, it is prudent to require data for all potentially risky areas. However,the degree of detail must be leavened with the cost to collect and analyze thedata. Finally, the Program Manager (PH) must look at the data while they arestill fresh so that problems can be addressed immediately.
In financial terms, the cost data measure earned value (BCWP). Eachitem in the WBS is assigned a value (budgeted cost) and a time when it must becompleted (schedule). As items are completed, the government receives thatvalue for an actual cost at an actual time. If the actual cost is equal to orless than the budgeted cost, things are going well. If the actual cost isgreater than the budgeted cost, it could indicate problems that requireinvestigation.
More simplistically, BCWS is what you should have paid for what youshould have gotten. BCWP is what you should have paid for what you got. ACWPis what you paid for what you got. If ACWP is greater than BCWP, the programis over cost. If BCWS is greater than BCWP the program is behind schedule.The amount of time behind schedule can be determined by determining the timedistance (horizontally) between the two in Figure 7.1-1. Figure 7.1-2displays the cost and schedule variances versus management reserve. In theseexamples, it should be noted that the program is over cost and behind sched-ule.
11

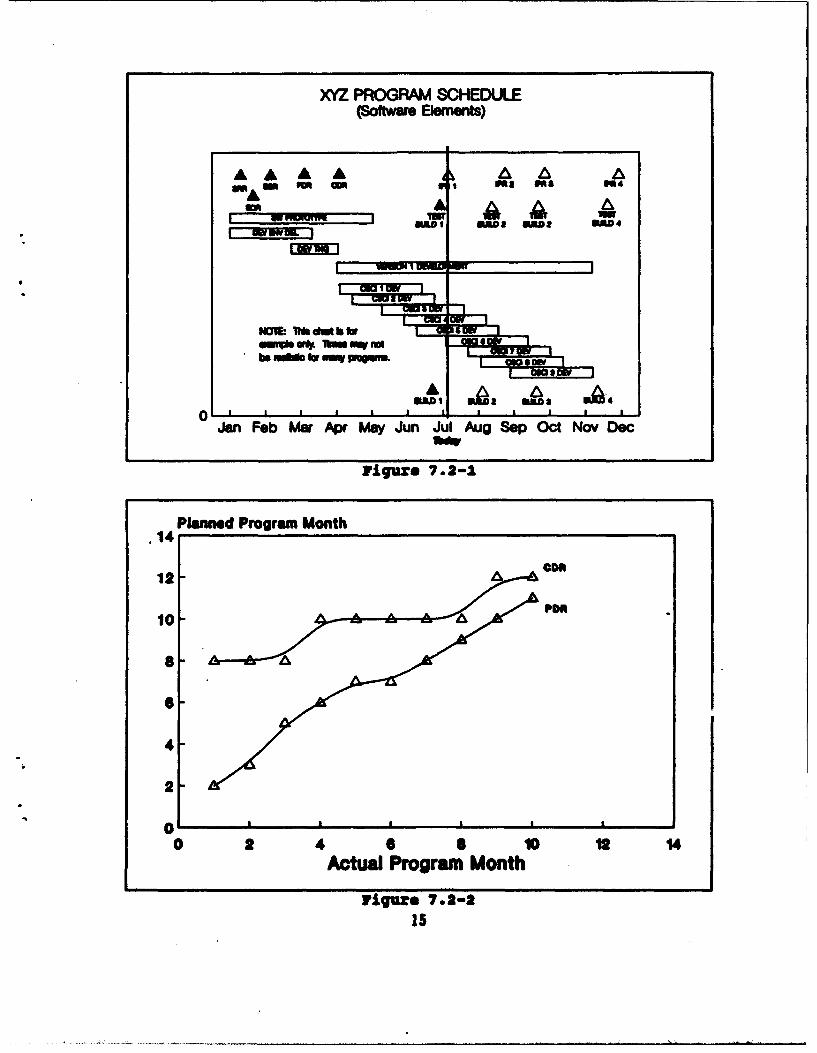
In many cases, costs are a good early indicator that there are problemswith a particular item in the program. Excessive costs can indicate addition-al resources being applied to a tough issue. In software, it could indicatemore programmers, higher level programmers or outside consultants beingassigned to a particular CSCI than planned; it may mean more development toolsor a larger programming environment than forecast; or it could mean a lot ofrecoding.
The data required are forward looking as well as historic. The develop-er is required to provide an estimate at completion for cost and schedule.The government program manager can use the same data to make his own predic-tions as well as to forecast the program's future well-being.
As with any data for cost and schedule, the program management officemust ensure at the outset that the estimates are reasonable throughout thelife of the contract. Front loading costs and back loading schedules (highcosts early with most deliveries occurring late) can give early indications ofsuccess in an unhealthy program.
Properly identifying WBS categories in the contract can allow the PH tolook at the resources expended overall in areas such as requirements analysis,facilities, development equipment/tools, design, coding, testing, rework,documentation, training, etc. Using a flexible data base management systemcould allow the PM to get a good idea of what areas do well and what areasmight need improvement. For instance, the (government or contractor) PM maysee a correlation between higher requirements analysis costs and lower reworkcosts. Or, he may see that a particular group has a considerably lower reworkcost than the others; he might then want to examine their development process-es to see if there are lessons that can be applied to other groups.
At the lower levels of the WBS (software activities), this metric isused to track software expenditures versus allocations over the life of aprogram. Status needs to be determined not only on the present percent ofallocation used, but also in relation to what has been done to date and howmuch is yet to be done (fault profiles, breadth of testing, depth of testing,reliability, (optional) manpower, (optional) development progress). Furtherinsight into risk can be determined by examining expenditures relating torework (i.e., the fixing of faults and changes in requirements). Exceedingthe allocation at any point in time is cause for concern and Investigation.
In addition to being used with the metrics listed in the precedingparagraph, the cost metric should also be used with the detailed schedulemetric, so that a comprehensive view of cost/schedule performance and statuscan be obtained. For example, undesirable cost trends may signal impendingdelays of major events or milestones.
12

Rules of Thumb:
For the lower level WBS software activities, management attention needsto be heightened whenever expenditures are nearing allocated values and muchwork is yet to be done. A program review may be necessary in this case andshould be mandatory when an allocation is actually exceeded.
For higher level WBS costs, when it appears that the contractor is goingto exceed his management reserve in his or the government's estimate atcompletion, a contractor/government level In Process Review (IPR) should berequired. When it appears that either the contract is going to exceed thegovernment's management reserve at completion, or the estimate at completionis going to breach the program baseline, a higher level government IPR shouldbe required.
References:
"Work Breakdown Structure for Software Cost Reporting", MIL-HDBK-WBS.SW(Second Draft), I October 1991.
13

7.2 Metric: Schedule.
Purpose/Description:
The schedule metric provides indications of the changes and adherence tothe planned schedules for major milestones, activities, and key softwaredeliverables. As with the cost metric, the schedule metric takes advantage ofexisting acquisition policies with emphasis placed on lower level scheduleconsiderations to ensure that key milestones, activities, and deliverables arestructured and delivered in a manner that supports overall program success.It provides visibility of current and overall schedule variances, indicationsof likely trouble areas, and trends for the future program schedule.
Also, as with the cost metric, schedule is a primary indicator ofprogram success or failure, and will be used in the correlation and validationprocess described with the cost metric.
Life Cycle Aoolication:
Begin collecting at program start, and continue for the entire softwaredevelopment.
Alaorithm/Graohical DisDlaV:
Plot current program schedule as shown in Figure 7.2-1. Note that thisdisplays only the current schedule. Comparisons with previous schedules,described below, are needed to assess schedule performance.
Plot planned and actual schedules for major milestones and key softwaredeliverables as they change over time. An example is shown in Figure 7.2-2.
In Figure 7.2-2, the Preliminary Design Review (PDR) and Critical DesignReview (CDR) milestone schedules are plotted over time. Any milestone ofinterest can be plotted. Similar plots can also be made for key productdeliverables (e.g., Software Product Specification (SPS)) as well as keyactivities (e.g., development of a CSCI). To read the graph, find the actualdate on the x-axis, and read the appropriate planned date on the y-axis. Forexample, at month one, the PDR was planned for month two, and the CDR wasplanned for month eight. At month two, the PDR schedule has slipped to monththree (a slip of one month), whereas the CDR schedule has remained the same.At month three, the PDR schedule has slipped to month five (an additional slipof two months), whereas the CDR schedule has remained the same.
Plot the planned start and end date for key activities, as they changeover time. An example is shown in Figure 7.2-3.
A table showing the schedule and status of start and end dates for keypresent and future activities and events should be created. Table 7.2-1 servesas a representative example of such a table. A negative entry in a Oslip"column indicates that the date has been moved earlier in time.
14
XYZ PROGRAM SCHEDULEPoftware E~mnwf)
wk Im mm m as gas M-6m
mum12MU
I am off.
NM10dkw U
0 . 1 1 10 21
.14Acua Plonrad Month Mnt
12-r 7a2-
105

Schedule - CSCI2 DevelopmentPlanned Program Month
4 ....... ...... I ................. *........ .. ...... .................. •...............
Start Date
00 2 4 6 a10
Actual Program Month
Fligu~re 7.2-3
Table 7.2-1
Milestone, De- Latest Slip Cumulative Latest Slip Cumulativeliverable, Ac- in Start Date Slip in - n End Date Slip in EndtivSty (months) Start Date (months) Date
(months) (months)PDR 4 5 , N•/A NiA
CDR 3 4 N/A N/A
CSCH Develop- 0 0 00ment
CSC1]2 Develop- 5 7 34mentIntegration ( t4 2 D
TestingFQT 2 3 2 3
TT 0 0 -1 -1
OT 0 0 0 0
16

Data Reauirements:
For the purposes of these data requirements, milestones and deliverablesoccur at a single point in time, whereas activities span a given time period.Therefore, unlike milestones and deliverables, activities have both a startdate and an end date.
for each milestone and deliverable:
(examples of milestones are System Design Review (SDR), System Require-ments Review (SRR), Software Specification Review (SSR), PDR, CDR, Army SystemAcquisition Review Council (ASARC)/Major Automated Information System ReviewCouncil (MAISRC))
(examples of software deliverables are Software Development Plan (SDP),"SPS, System/Segment Specification ISSS), Interface Requirements Specification(IRS), Version Description Document (VDD), Software Requirements Specification(SRS), Software Design Document (SDD), Software Test Plan (STP), Software TestDescription (STD), Software Test Report)
initial planned datepresent planned dateactual date
for each activity:
(examples of activities are CSCI development, Formal Qualification Test(FQT), Functional Configuration Audit (FCA), Physical Configuration Audit(PCA), Technical Test (TT), Operational Test (OT))
initial planned start datepresent planned start dateactual start dateinitial planned end datepresent planned end dateactual end date
Freouencv of Reporting:
monthly
Use/Interoretation:
The schedule metrics, when plotted as they change over time, provideindications of problems In meeting key events or deliveries. These metricsexamine schedule considerations at a finer resolution than the cost metric.
Obviously, the higher the slope of the trend line for each milestone orevent slippage (such as that shown in Figure 7.2-2), the more problems arebeing encountered. Milestone slippages should be investigated. Potentialclustering (i.e., bunching up in time) of key events should be guardedagainst. Figure 7.2-2 indicates a "bunching upw of the two main designreviews (PDR and CDR). Such a condition may possibly indicate a compressedphase of activity, which may be an early warning sign of problems.
17

In a similar fashion, the key present and future activities should beexamined using plots similar to that shown in Figure 7.2-3. Such portrayalscan illuminate slips in schedule, as well as possible compressions or expan-sions of the activity's duration.
An additional method for analyzing the schedule for activities andevents is to create and analyze a table similar to Table 7.2-1. Compressionor expansion within an activity can be viewed by comparing the time allocatedto it as reflected in the "latest slip" column, to the time allocated to itpreviously. Compression or expansion among events and activities can be seenby looking at relative start and end dates between them.
The schedule metric should be used in conjunction with several othermetrics to help judge program risk. For example, it should be used with thetest coverage metrics to determine if there is enough time remaining on thecurrent schedule to allow for the completion of all testing.
The schedule metric passes no judgement on the achievability of thedeveloper's initial schedule.
Rules of Thumb:
No formal rules for the trend of the schedule metrics are given.However, large slippages or compressions are indicative of problems. Maintain-ing conformance with calendar driven schedules should not be used as the basisfor proceeding beyond milestones.
References:
None.
18

7.3 Metric: ComDuter Resource Utilization (CRU).
Purpose/Description:
This metric is intended to show the degree to which estimates and"mieasurements of the target computer resources (central processing unit (CPU)capacity, memory/storage capacity, and input/output (I/O) capacity) used arechanging or approaching the limits of resource availability and specifiedconstraints. Overutilization of computer resources can have serious impactson cost, schedule, and supportability. Approaching resource capacity maynecessitate hardware change or software redesign. Exceeding specified reserverequirements can have similar impacts in the post deployment phase. Properuse of this metric can also assure that each resource in the system hasadequate reserve to allow for future growth due to changing or additionalrequirements without requiring redesign. This metric can be applied to asystem architecture which is distributed or centralized.
Life Cycle AoRlication:
Early in the design phase, utilization budgets should te established foreach processor and I/O channel in the system. Memory/storage usage budgetsshould be allocated ti all computer software units (CSUs) (i.e., the lowestdesign element that is separately testable), computer software components(CSCs), computer software configuration items (CSCIs), and temporary andpermanent data files early in the design phase. Based on these estimates,each device (CPU, I/O, and memory/storage) should be sized so that only halfof the available capacity of the device is utilized. These targets should bedocumented in the SSS and analyzed with respect to current estimates at eachdesign review.
All changes to these initial estimates should be reported, includingthose caused by hardware modifications. For the memory and I/O categories,actual usage should be measured monthly during coding, unit testing, integra-tion testing, CSCI testing and system level testing. For the CPU usagestatistic, measurements should be taken monthly after the beginning of unittesting. Actual utilization should be formally demonstrated at the systemlevel for each resource under peak loading conditions during FQT, and duringPost Deployment Software Support (PDSS) if additional capability is added.
Algorithm/Graphical DisolaY:
The allocation for each resource type should not exceed the target upperbound utilization for any category (for some systems, the allocation equalsthe target upper bound).
CPU and I/O resource utilization are typically measured by the system.While the measurements contribute slightly to system overhead, the featuretypically comes with the system in its off the shelf configuration. Ininstances where the system does not measure itself in term of CPU and I/0utilization, the percent utilization must be measured using appropriateinstrumentation or test hooks; it is recognized that these tools may add tosystem overhead.
19

For memory/storage resources, the percent utilization must be computed.For memory, the resource is random access memory (RAM), and usage must bemeasured with dynamic analysis tools. For storage, the resources include diskspace and other mass storage. For those elements of the software that do notchange (e.g., the source code in terms of CSUs, CSCs), measurement can beeasily done with straightforward operating system commands that measure theamount of used and free space on a device. For those elements of the softwarethat change (e.g., temporary and permanent date files), these resources mustbe measured on the fly with dynamic analysis tools or with the periodic,interrupt-driven use of static tools. Again, the percent utilization shouldbe computed with respect to the devices, and not the components that happen tobe stored on those devices.
Local Area Networks (LANs) and data buses should also be considered asresources; data should be recorded and reported separately as with any otherresource.
As software development proceeds, the measured values for each categoryshould be projected out to the "full" system. For example, if half of the"size" of the software is built and measured, the projected alue for utiiza-tion would be the actual for the portion built and measured a date plus thebudgeted portion yet to be added.
In Figure 7.3-1, target upper bound utilization is shown as a straightline. In reality, the target upper bound utilization can change over time.The sample shown represents the utilization of a single CPU resource; similargraphs or tables should be constructed for the utilization of all other CPUsplus each I/O and memory resource.
20

Computer Resource Utilization% utilization CPU1
100
80
60
40
20
0 I I
0 2 4 a 8 10 12 14Program Month
Projected -1- Actual - Target Upper Bound
Figj~re 7.3-1
Data Reauirements:
(Notes:
I. Usage should be measured during peak operational loading periods andshould include the operating system and non-developer supplied software aswell as the development software.
2. Where "target" is used in these data elements, it is actually meantto construe the target upper bound.)
date of reportfor each CPU:
unique identifierinitial target CPU usage (percent of capacity)present target CPU usage (percent of capacity)actual CPU usage (percent of capacity)projected CPU usage (percent of capacity)
for each I/0 channel (and LAN or data bus as appropriate):unique identifierinitial target I/O usage (percent of capacity)present target I/O usage (percent of capacity)
21

actual 1/0 usage (percent of capacity)projected I/0 usage (percent of capacity)
for each RAM memory resource:unique identifiercapacity of resource (in bytes)initial target upper bound (in bytes)present target upper bound (in bytes)actual usage (in bytes)projected usage (in bytes)
for each mass storage device:unique identifiercapacity of device (in bytes)initial target upper bound (in bytes)present target upper bound (in bytes)actual usage (in bytes)projected usage (in bytes)
Freauencv of Reeorting:
initial targets : monthly starting with SSRall other values : monthly starting with CDR
Use/Interpretation:
Resource utilization tends to increase over the development of aproject. Therefore, adequate planning must be done up front to ensure thatthe software's operation does not put undue demands on the target hardware'scapabilities. This measure allows one to track utilization over time to makesure that target upper bound utilization is not exceeded and that sufficientexcess capacity remains for future growth and for periods of high stressloading.
In multiprocessor environments, each processor should be targeted andtracked separately.
Tailoring may be appropriate for situations when dynamic allocation,virtual memory, parallel processing, multitasking or multi user-based featuresare employed.
In instances where the development and target environments differ intypes and/or capacities, caution must be taken in computing and analyzing themeasures. Translations are acceptable up to a certain point, but testing onthe target hardware must take place as early as possible.
Initial estimates should be retained for comparison with what is finallyachieved in order to aid in scoping future programs.
In addition to collecting utilization data throughout the build up ofcontractor testing (including single thread to multiple thread), measurementsshould also be taken during system level stress testing.
22

During development, it is important to look at both actual and projectedvalues in relation to the target upper bound values. If either exceeds thetarget values, extra attention should be paid to assure that the projectionsdecay to below the target upper bound value by project completion. If it isapparent from the projections that the target upper bound limits will beexceeded, action must be taken to either optimize the software or upgrade thecapability of the target configuration.
It should be noted that sudden drops in utilization may reflect eithernew system capacity or new software that embodies more efficient programming.
Computer resource utilization metrics should be used in conjunction withthe test coverage/success metrics (breadth and depth of testing) to ensurethat measures of the actual usage are representative and portray the entiresystem under realistic stress loads. If the optional development progressmetric is available, computer resource utilization metrics should be used inconjunction with development progress to ensure remaining development can beaccommodated without exceeding planned utilization.
Computer resource utilization provides the link to total system perfor-mance. As mentioned previously, on many computer platforms, the data arerelatively easy to collect (indeed, often self-measured), and are often builtin to the overhead of the system. On other platforms, however, the data mayhave to be collected, which will contribute some small amount to systemoverhead.
Rules of Thumb:
For embedded/tactical systems, design for no more than 50 percentutilization for memory/storage, CPU, and I/0 resources. For information areasystems, a higher target upper bound value may be allowable, but should bespecified in the requirements documents. Performance may deteriorate whenutilization exceeds 70 percent for time critical applications. Schedule andcost can be severely impacted as utilization exceeds 90 percent.
For systems employing virtual memory architectures, usage of RAN is notas important as measuring the amount of swapping that occurs during peak loadperiods.
If, at any time during development, actual or projected computerresource utilization exceeds target upper bound utilization, an Immediatereview must be held. Corrective action (e.g., software redesign, hardwareupgrades, etc.) must be taken before proceeding to the next stage of develop-ment.
References:
"Software Reporting Metrics", The Mitre Corporation, ESD-TR-85-145,November 1985.
"Software Management Indicators", Air Force Systems Command, AFSCP 800-43, January 31, 1986.
23

7.4 Metric: Software Enaineering Environment.
(Note: Much of the information below has been extracted directly fromthe referenced SE! report).
PurooseiDescriotion:
The software engineering environment rating is used to provide anindication of the developer's typical use of modern, accepted softwareengineering principles (e.g., the use of structured design techniques, theextent of tool usage, the use of program design languages (PDL), etc.) in thedevelopment of software. If practical, aspects of the methodology could alsobe applied to materiel developer personnel or the program manager's matrixsupport staff for the purpose of assessing capabilities with respect tosoftware development.
SE! has defined four types of evaluations/assessments; self, government,SEI-assisted, and commercial. The most rigorous, and therefore the mostdesired, are either the government or SEI-assisted evaluations. However, theyare also the most costly, and may not be practical for small programs.Therefore, any of the four are acceptable, but should be performed for eachsubdeveloper working on the project.
Life Cycle ADnlication:
At each major milestone where developers will be selected or assigned.
Alaorithm/Graohical Disolav:
Follow SE! methodology, which includes the following:Collect questionnaire data from developer.Conduct follow up visit (assessment team) to answer further
questions, observe tools, etc.Perform assessment.Calculate process maturity levels, which are broadly defined
as possessing the following characteristics :
1. Initial -ill-defined procedures and controlsno consistent application of software engineering management to the pro-
cessno use of modern tools and technology
2. Repeatable -
management of costs and schedulesuse of standard methods and practices for managing some softwaredevelopment activities
3. Defined -
software development process well-defined in terms of software engineer-ing standards and methods
increased organizational focus on software engineering
24

use of design and code reviewsinternal training programsestablishment of software engineering process group
4. Managed -software development process is quantified, measured, and
well-controlleddecisions are based on quantitative process datause of tools to manage design processuse of tools to support data collection and analysisaccurate projection of expected errors
5. Optimizing-major focus on improving and optimizing processsophisticated analysis of error and cost dataemployment of error cause analysis and prevention studiesiterative improvement of process
Data Reauirements:
Name of (sub)developer.Type of assessment/evaluation.Results of SEI rating (numerical rating and list of key process areas).
Freauencv of Reportina:
Once for each developer selection process. If desired, within a longdevelopment phase, additional ratings can be performed if desired (e.g., if aphase of Engineering & Manufacturing Development has been ongoing for 5 years,and will be continuing for several more years, perhaps another evaluation orassessment of the developer(s) should be performed).
Use/Interpretation:
The software engineering environment rating provides a consistentmeasure of the capability of a developer to use modern software engineeringtechniques in his development process, and therefore his capability to instillsuch principles and characteristics in the product. Obviously, it can be seenfrom the definition of each rating level that higher is better. The basicassumption to this approach is that a quality process results in a qualityproduct. The other eleven metrics, as well as other evaluation techniques,should be used to examine the quality of the product.
The primary use of the software engineering environment rating is duringthe source selection process. However, besides the use as a tool with whichto relatively compare the ability of developers, the use of the softwareengineering environment rating may encourage contractors to improve theirsoftware development process in order to increase their rating. A higherrating will increase the developer's chance of being selected for futuresoftware development projects.
25

In addition to the numerical rating which summarizes the developer'ssoftware process maturity, the subelements which comprise the rating, calledkey process areas, can be examined to determine relative strengths andweaknesses within a rating band. Additionally, the developer may havedemonstrated capability on certain individual process areas that are indica-tive of a higher rating level. The weaker process areas are those whichshould be targeted for improvement in order to move forward to a higherrating.
It is commonly believed that a metrics program will be cheaper toimplement for developers who possess a high SEE rating.
Rules of Thumb:
On a relative basis, the process maturity levels of various contractorscan be compared. The SEI reports that currently, only a very small percentage(i.e., 2 or 3 %) of companies have achieved ratings of level 3, 4, or 5. Mostcompanies are rated at level 1 or 2.
References:
"A Method for Assessing the Software Engineering Capability of Contrac-torso, Carnegie-Mellon University Software Engineering Institute TechnicalReport CMU/SEI-87-TR-23, September 1987.
26

7.5 Metric: Reouirements Traceability.
Puroose/Descri Dton:
The requirements traceability metrics are used to measure the adherenceof the software products (including design and code) to their requirements atvarious levels. It also aids the combat developer, materiel developer, andevaluators in determining the operational impact of software problems.
Life Cycle AoDlication:
Begin tracing during user requirements definition phase, in support ofrequirements reviews, PDR, CDR, milestones, and major releases.
AlgorithwdGraohical DiOslav:
This metric is a series of percentages, which can be calculated from thematrix described below.
Trace all Operational Requirements Document (ORD) requirements forautomated capabilities to the Users' Functional Description (UFD). Identifyany ORD requirements for automated capabilities not found in the UFD. Calcu-late the percentage of ORD requirements for automated capabilities in the UFD.
Trace all UFO requirements by priority to the system specification (SS)(either a SSS, Prime Item Development Specification, or Critical Item Develop-ment Specification). Identify omissions. Calculate the percentage of UFDrequirements that are in the SS.
Trace all software-related SS requirements to the SRS(s) and IRS(s).Identify omissions.
The software requirements as specified in the SRS(s) and IRS(s) mustthen be traced into the software design, code, and test cases. The otherpercentages that must be calculated are:
% software requirements in the CSCI design% software requirements in the CSC design% software requirements in the CSU design% software requirements in the code% software requirements which have test cases identified
27

The technique to be used in performing this analysis is the developmentof a software requirements traceability matrix (SRTh). The SRTN is theproduct of a structured, top-down hierarchical analysis that traces thesoftware requirements through the design to the code and test documentation.The SRTM should contain information similar to Table 7.5-1. A dendriticnumbering is shown for some columns. The software specifications and require-ments should be listed in groups which represent higher order system require-ments. In this manner, the grouping of CSUs which represent a required systemfunction can be readily seen. Also, it is good practice to trace the require-ments at additional levels between design and code. For example, they can betraced to functional decomposition documents, flow diagrams, data dictionar-ies, etc.
28

~00- -- - - -cc
a.S
U, U-
I I
de
I-V-
- - -- -W16 -----
U ~ w 529

The SRTM will be completed to various degrees depending upon the currentstage of the software life cycle and should be part of the Technical DataPackage. From the SRTM, statistics can be calculated indicating percentage oftracing to various levels.
In some instances, it might be interesting to perform a backwards trace(e.g., from code to requirements). In lieu of creating another matrix, onecan simply make a list of the distinct entries and compare with a total countof the entries for the column of interest. To carry the example of doing abackwards trace from code to requirements further, one would make a list ofall the distinct CSUs which appear in the "code* column of the SRTh. Thislist should then be compared with the total list of CSUs for the system. AnyCSU which does not appear in the 'code* column may not support any require-ment. These CSUs should be investigated.
Data Reauirements:
list of requirements and design specifications(ORD, UFD, SS, SRS, IRS, SDD)
completed SRTMsoftware test description in accordance with DOD-STD-2167Anumber of ORD requirements for automated capabilities:
totaltraceable to UFDnot traceable to UFD
number of UFD requirements:totaltraceable to SSnot traceable to SS
number of SS software requirements:totaltraceable to SRS/IRSnot traceable to SRS/IRS
for each CSCI, number of SRS requirements:totaltraceable to CSCI designtraceable to CSC designtraceable to CSU designtraceable to codehaving test cases for all of its CSUs
number of SRS requirements not traceable to UFD
Freouencv of Reoorting:
update periodically in support of requirements reviews, milestones andmajor releases.
Use/InterDretation:
As can be seen in the algorithm above, the tracing of requirements mustoccur at several levels. This tracing should be a key government tool at allsystem requirement and design reviews. It can serve to indicate those areas
30

of requirements or software design that have not been sufficiently thoughtout. The trend of the SRTM should be monitored over time for closure.
By the nature of the software development process, especially inconjunction with an evolutionary development strategy, the tracing of require-ments will be an iterative process. That is, as new software releases addmore functionality to the system, the trace of requirements will have tobe revisited and augmented.
Although not portrayed graphically above, trends of requirementstraceability can be shown over time. For example, during the requirementsphase, the percent of UFD requirements traced into the SRS can be depictedover time.
One of the important new characteristics that will be embodied in theUFD is a grouping of requirements by four priority levels. Such a prioritiza-tion should be used with the SRTH to highlight certain key user functions. Incases where there are vast numbers of requirements, a common sense approachwould be to attack the UFD priority one requirements first.
Another benefit of requirements traceability is that those modules whichappear most often in the matrix (thus representing the ones that are mostcrucial in the respect that they are required for multiple functions orrequirements) can be highlighted for earlier development and increased testscrutiny.
The requirements traceability metrics should be used in conjunction withthe test coverage metrics (depth and breadth of testing). It is important tonote that tracing to a test case passes no judgement on the sufficiency of thetest case(s). Rather, an entry in the SRTM only indicates that at least onetest case exists. Further, the SRTM does not address the conduct or outcomeof any testing. Breadth and depth of testing must be used to glean testcoverage and success for particular requirements. The requirements traceabil-ity metrics should also be used with the (optional) development progressmetric to verify if sufficient functionality has been demonstrated to warrantproceeding to the next stage of development or testing. They should also beused in conjunction with the design stability and requirements stabilitymetrics.
Due to the detailed nature of these requirements traceability metrics,they should be a normal product of the V&V effort. The SRTM may be generatedby the developer, but it must be verified by an independent agent such as theIV&V contractor, with coordination from the Test Integration Working Group(TIWG) and Computer Resources Working Group (CRWG).
During PDSS, if a function is modified, the SRTN can be used to focusregression testing on a particular CSCI/CSC/CSU.
Finally, it should be noted that some software requirements that arequalitative in nature (e.g., user friendliness) cannot be traced to specificdesign and code. It remains paramount, however, that these requirements beevaluated by other means.
31

Rules of Thumb:
Do not approve UFD until all ORD requirements for automated capabilitieshave been traced into it.
Do not proceed beyond SSR until all UFD requirements have been tracedinto the SS.
Do not proceed beyond CDR until a high trace percentage exists from theORD to the design at CSCI, CSC, and CSU level.
Do not proceed to formal government testing until, at a minimum, all "'
priority one requirements have been traced into the code and have test caset-,identified.
References:
Operational Requirements for Automated Capabilities, Draft DA PamphletXX-XX, 2 January 1992.
32

7.6 Metric: Reauirements Stability.
PurDose/DescriDtion:
The metrics on requirements stability indicate the degree to whichchanges in the software requirements or changes in the developer's understand-ing of the requirements affect the software development effort. It alsoallows for determining the cause of requirements changes.
Life Cycle AD~lication:
Begin collecting during user requirements definition phase. Measurerequirements with respect to the UFD before Milestone (MS) II. Measurerequirements with respect to the SRS/IRS after MS II.
33

Alaorithu/Graohical DisRlav:
Requirements Stability70eqts Dlseopancles
0 .. . . . . . . . . . . .....°o ° ° ° ° ° ° ° °. ° °. o °... . . . . . . . . . . . . .... ..o .°° o ° ° ° ° ° . . . . . .° o •. . . . . .. ° °.. .. . . . . . . .. . . . .
50 1 °°°°°°°'°°°°'°°'°° ............................................. ..................... ..............
40 ......................... ........................°'°".... °°°...... °°°°°° .... °°°° ....................
30 . .................. ......... .................. ........... ....................................... .
0 . ..... ......... ............
010 2 4 6 a 10 12 1
Program Month
cumulative -4- cumulative closed
Figure 7.6-1
34

Requirements StabilityPercent LOCe Changoed, CSCI2
16
14-
12-
10-
8-
8-
4-
2-
0-1 2 3 4 6 6 7 8 9 10 11 12
Program Month
Figure 7.6-2
Figure 7.6-1 shows cumulative requirements discrepancies (number ofrequirements added + number of requirements deleted + number of requirementschanged) over time versus closure on those discrepancies. Figure 7.6-2 is arepresentation of the effect of requirements discrepancies on the code(percent of lines of code (LOC) changed by month). In actuality, one wants todevelop several versions of the second chart. One version should show thenumber of user-initiated requirements discrepancies and the number of develop-er-initiated requirements discrepancies. The second version should show thepercent LOC affected by user-initiated discrepancies and the percent LOCaffected by developer-initiated discrepancies. Additionally, one might wantto look at the number of modules affected by both types of requirementsdiscrepancies.
Data Reauirements:
number of requirements discrepanciesnumber of software requirements added by usernumber of software requirements deleted by usernumber of software requirements modified by user
35

number of software requirements added by developernumber of software requirements deleted by developernumber of software requirements modified by developer
monthly status (cumulative total and total number resolved) ofabove discrepancies
number of modules affected by user-initiated requirementsdiscrepancies
number of modules affected by developer-initiated requirementsdiscrepancies
total number of LOCsfor each CSCI
number of LOC affected by approved Engineering ChangeProposals - Software (ECPs-S) due to user-initiated requirementsdiscrepancies
number of LOC affected by approved ECPs-S due to developer-initiated requirements discrepancies
Note: For definition of LOC see Complexity metric.
Freouencv of Reportina:
monthly and at major reviews
Use/Interpretation:
When a program is begun, the details of its operation and design arerarely complete, so it is normal to experience changes in the specificationsas the requirements become better defined over time. (Note: it is believedthat rapid prototyping can help to alleviate this problem, or at least tocause the refinement to happen early in development). When design reviewsreveal problems or inconsistencies, a discrepancy report is generated.Closure is accomplished by modifying the design or the requirements. When achange is required that increases the scope of the project, an ECP-S issubmitted.
The plot of open discrepancies can be expected to spike upward at eachreview and to diminish thereafter as the discrepancies are closed out. Foreach engineering change, the amount of software affected should be reported inorder to track the degree to which ECPs-S increase the difficulty of thedevelopment effort. Only those ECPs-S approved by the configuration controlboard should be counted. Good requirements stability is indicated by aleveling off of the cumulative discrepancies curve with most discrepancieshaving reached closure.
The later in development a requirements discrepancy occurs, the moreimpact it has on the program. Those discrepancies which occur before designand coding don't affect nearly as much as those which occur after design hasstarted. Those discrepancies which occur during design can impact previousdesign work. The worst case is when both design and code are affected. Theimpact of the changes can be seen by looking at the number of LOCs changed.The cause of these changes can be evaluated by examining both RequirementsStability and Design Stability together. If design stability is low and
36

requirements stability is high, the designer/coder interface is suspect. Ifdesign stability is high and requirements stability is low, the interfacebetween the user and the design activity is suspect. If both design stabilityand requirements stability are low, both the interfaces between the designactivity and the code activity and between the user and the design activityare suspect.
The metrics for requirements stability should also be used in conjunc-tion with those for requirements traceability, fault profiles, and the(optional) development progress.
Allowances should be made for higher instability in the case where rapidprototyping is utilized. At some point in the development effort, therequirements should be firm so that only design and implementation issues willcause further changes to the specification.
As mentioned previously, it is recognized that LOC is somewhat dependenton.both the application language as well as the style of the programmer. Thekey is to watch for significant changes to the measure over time, given thatconsistent definitions are used.
Rules of Thumb:
No formal values are given, but a high level of instability at the CDRstage indicates serious problems that must be addressed prior to proceeding tocoding. For MSCR systems, requirements stability should be high by MS II.
References:
"Software Reporting Metrics", The Mitre Corporation, November 1985.
37

7.7 Metric: Desian Stability.
PurDose/Descriotion:
Design stability is used to indicate the amount of change being made tothe design of the software. The design progress ratio shows how the complete-ness of the design is progressing over time and helps give an indication ofhow to view the stability in relation to the total projected design.
Life Cycle ADplication:
Begin tracking at PDR and continue for each version until completion.
Algorithm/Graphical Displav:
A design related change is defined as a modification to the softwarethat involves a change in one or more of the following:
1) algorithm2) "units" (i.e., kilometers, miles)3) interpretation (definition) of a parameter4) the domain of a variable (i.e., range of acceptable values)5) interaction among CSUs6) more than one CSU
M - number of modules in current delivery/designFe - number of modules in current delivery/design that include
design related changes from previous deliveryFS - number of modules in current delivery/design that are
additions to previous deliveryFd - # modules in previous delivery/design that have been
deletedT - total modules projected for project
S (sta'!ility) = [M - (Fa + Fc + Fd)] / M
DP (design progress ratio) - M/T
Notes:
1. Although not indicated in Figure 7.7-1, it is possible for stability(S) to be a negative value. This may indicate that everything previouslydelivered has been changed and more modules have been added or deleted.
2. If some modules in the current delivery are to be deleted from thefinal delivery, it is possible for design progress (DP) to be greater thanone.
38

Design Stability /Progressa1.2
0 .8 ....................................................... ........................... ÷ .............
0 .6 . ................ .............. ..................................
0 .4 ... ................... ... .................................................
0 .2 .. .. ... ............................................................................
0 2 4 8 8 10 12 U4Program Month
-'-Stabllity --- Design Progress
71g9LlX4 7.7-1
Data Regutrements:
For each version number:date of completion
fi:Freauency of Reoortina:
monthly or at each delivery
"." Use/Interpretation:
Design stability should bemonitored to determine the number andpotential impact of design changes, additions, and deletions on the softwareconfiguration. The trend of design stability over time and releases providesan indication of whether the software design is approaching a stable state,that is, a leveling off of the curve at a value close to or equal to one. In
39

addition to a high value and level curve the following other characteristicsof the software should be exhibited:
- requirements stability is high- depth of testing is high- the fault profile curve has leveled off and most Software
Trouble Reports (STRs) have been closed- the (optional) development progress metric is high
Caution must be exercised, however, due to the fact that this metric does notmeasure the extent or magnitude of the change within a module.
The higher the stability, the better the chances of a stable softwareconfiguration. However, a value close to one is not necessarily good unless Nis close to the total number of modules required in the system (DP approaching1), and the magnitude of the changes being counted are relatively small anddiminishing over time; without so doing, periods of inactivity could bemistaken for stability.
When changes are being made to the software, the impact on previouslycompleted testing must be assessed.
Allowances for exceptional behavior of this metric should be made forthe use of rapid prototyping. It is thought that rapid prototyping, whilepossibly causing lower stability numbers (i.e., higher instability) early inthe program, will positively affect the stability metric during later stagesof development.
It should be noted that not all changes made to the software are designrelated. For example, the insertion of additional comments within the codedoes not change the design of the software.
The design stability metric can be used in conjunction with the complex-ity metric to highlight changes to the most complex modules. It can also beused with the requirements metrics to highlight changes to modules whichsupport the most critical user requirements.
Finally, it must be pointed out that the design stability metric doesnot assess the quality of the design. Other metrics (e.g., complexity) cancontribute to such an evaluation.
Rules of Thumb:
No hard and fast values are known at this time. However, allowancesshould be made for lower stability in the case of rapid prototyping or otherdevelopment techniques that do not follow the standard waterfall model forsoftware development. In either case, an upward trend with a high value forboth stability and design progress is recommended before acceptance forgovernment testing. A downward trend should be cause for concern.
40

Experiences with similar projects should be used as a basis for compari-son. Over time, potential thresholds may be developed for similar types ofprojects.
References:
"Draft Guide for the Use of Standard Dictionary of Measures to ProduceReliable Software', IEEE Computer Society, May 1988.
41

7.8 Metric: Com2lexity.
PurRose/Descriotion:
Complexity measures give an indication of the structure of the softwareand provide a means to measure, quantify and/or evaluate the structure ofsoftware modules. It also indicates the degree of unit testing which needs tobe performed. It is commonly believed that the more complex a piece ofsoftware is, the harder it is to test and maintain. Additionally, it iswidely felt that a highly complex module is more likely to contain embeddederrors than a module of lower complexity. Accordingly, lower complexityratings reflect software that is easier to test and maintain, thus logicallyresulting in fewer errors and lower life cycle costs.
McCabe's cyclomatic complexity metric measures the internal structure ofa piece of software.
Halstead's metrics estimate a program's length and volume based on itsvocabulary (operators and operands).
Other simpler complexity metrics are control flow, the number ofexecutable lines of code per module (relates to the ease of understanding andmaintaining the module), and the percent comment lines.
Life Cycle Application:
Begin collecting McCabe's cyclomatic complexity metric at PDR stage.Begin collecting other complexity metrics at CDR, as the modules are placedunder developer configuration control. Revisit during PDSS activities.
Alaorithm/GraDhical Displav:
(Note: As used below, the term "module" is meant to be equivalent to CSU.)
McCabe cyclomatic complexity metricLet E - # of edges (program flows between nodes; i.e., branches)
N - # of nodes (groups of sequential program statements)P - # of connected components (on a flow graph, it is the
number of disconnected parts)
Compute:Cyclomatic Complexity : C - E - N + 2P
The quickest way to gain a basic understanding of the cyclomaticcomplexity metric is to graphically portray the structure of a module. Figure7.8-1 depicts a flow graph of a module, along with its associated complexitycalculations.
There are additional ways of calculating cyclomatic complexity. One suchway is to calculate the number of control tokens + 1. Control tokens areprogramming language statements which in some way provide decision pointswhich modify the top-down flow of the program. In other words, statements
42

such as IF, GOTO, CASE, etc., are considered to be control tokens since theybase program flow upon a logical decision thereby creating alternative pathswhich program execution may follow. A CASE statement would contribute (N - 1)to complexity, where N is the number of cond'tions or cases associated withthe statement.
Figure 7.8-2 portrays a histogram of a CSCI's modules by compleytty.
Halstead metricLet n1 - # distinct operators
n - # distinct operandsN1 - total # occurrences of the operatorsN2 - total # occurrences of the operands
Compute:Vocabulary : v - n, + n.Program Length : L -N + NVolume : (lg 2v)
Control flow metric :Count the number of times in each module where control paths
cross ('knots"). (For example, a GOTO statement would cause a knotto occur in the module's flow graph).
Non-comment, non-blank, executable and data statements (herein referred to asLOC) per module metric :
count the number of non-comment, non-blank executable and data state-ments in each module.
Percent comment lines metric :Let C - # comment lines in module
T - total # non-blank lines in moduleCompute :
Percent comment lines (C / T) * 100
43

Table 7.8-1 summarizes the various subelements of the complexity metric:
Table 7.8-1
Metric Measure
Cyclomatic Complexity f independent paths
Halstead volume (operators/operands)
Control Flow # times paths cross
LOC size
% comment lines degree of self-documentation
Flow Graph
0 - node (N)
o - decilele PointDI 4 - edge, (E)
P - connected components
D3 C E -N *(2 *P)
10 - 8 " '(2 *"1)
.4
Figure 7.8-1
44

McCabe CyI~omatie CnMplexltv
0 Modules
100'
40"
20"
00-6 410- 10-M 1-20 W0-25 :2-80 80-36 86-40
Complexity
- 08013 (200 modules)
Figure 7.8-2
Data Reouirements:
for each module1 anguageversion number of languagesource codenumber of nodesnumber of edgesnumber of connected componentsnumber of distinct operatorsnumber of distinct operandstotal number of occurrences of the operatorstotal number of occurrences of the operandsnumber of times in each module where control paths crossnumber of LOCs per modulepercent comment linesall complexity input data and results of calculations listed aboveeach of the above complexity values
Freauencv of ReRorttna:
monthly, for any module that has changed.
45

Use/InterDretation:
Automated tools are available and should be used to assist in thecomputation of the complexity measures. There are tools to construct the flowgraph depicted in Figure 7.8-1; other tools are available to compute thevarious complexity metrics.
This metric is used throughout the software life cycle. Requiring thecomplexity limit as a contractual requirement will stimulate structuredprogramming techniques, thereby impacting design by limiting the number of"Obasis" paths in a program at the design and coding stages. It is used duringsoftware testing to identify basis paths (i.e., critical paths), to define andprioritize the testing effort, and to assess the completeness of CSU testing.During the maintenance phase, a proposed change should not be allowed tosubstantially increase the complexity, thereby increasing the testing effortand decreasing maintainability.
The complexity metrics should be generated for each module in thesystem. The metrics can be partitioned in several ways (e.g., by CSCI). Inthese partitionings, one can see indications of potential problem areas.These indications can be used to give guidance to the developer on areas whereadditional concentration is needed, as well as areas where government testefforts should be focused, such as code walkthroughs, more comprehensive unitlevel testing, or stress testing. Figure 7.8-2 portrays a snapshot in time ofthe complexity values for all the modules in a given CSCI. While the majorityof them are within the range of the rules of thumb, it can be seen thatseveral of them have well exceeded them and should be further scrutinizedthrough testing and analysis.
Examination of complexity trends over time can also provide usefulinsights, especially when combined with other metrics such as design stabili-ty, the (optional) development progress, etc. For example, late software code"patches" may cause the complexity of the patched module to exceed an accept-able limit, indicating that the design rather than the code should have beenchanged. It is noted that test resources are better expended on modules thathave a relatively high structural complexity rather than on software that willreflect a high number of lines of code tested.
Wherever possible, the cyclomatic complexity metric should be computedfor the PDL. The section on rules of thumb describes special interpretationcriteria for the complexity of PDL.
There are several embedded assumptions and known weaknesses in thecomplexity metrics. For example, in the computation of McCabe's cyclomaticcomplexity, there is no differentiation between the various types of controlflows. A CASE statement (which is easier to use and understand than thecorresponding series of conditional statements) makes a high contribution tocomplexity, which is somewhat counterintuitive when one considers that thecorresponding series of IF..THEN..ELSE statements would probably be moretroublesome from the standpoint of testing, modification, and maintenance.Further, a million straight line instructions are judged to be as complex as a
46

single instruction. Additionally, the interpretation of cyclomatic complexitywill be different for different higher order languages.
There are innumerable ways of defining and counting lines of code. Thesomewhat simple definition given in the algorithm above is intended to applysomewhat equally across the spectrum of procedural languages. It should benoted that much research is ongoing into methods and tools for counting linesof code for each language. For example, the Software Engineering Institute isin the midst of such a research effort. The definition given here should atleast allow historical comparisons to be done on similar implementations.
It is also recognized that percent comment lines is a very languagedependent measure. Additionally, the metric does not address the usefulnessor completeness of the comments. Some self-documenting languages require fewercomments than an assembly language or a language like FORTRAN. Modernprogramming practices (e.g,. the use of meaningful variable names, indenting,etc.) are often more helpful than archaic programming practices with manycomment lines. Additiot,al complexity metrics for languages like Ada (e.g., tomeasure the degree of encapsulation) can lend additional insights into thesoftware structure.
It is recognized that the complexity metrics are highly oriented towardsprocedural languages. When applied to things like artificial intelligencelanguages and pure object oriented languages, care must be taken in interpret-ing the results.
For the preceding reasons and others, the complexity metrics should beused as a group. They also should be used in conjunction with the metrics forfault profiles and depth of testing.
Research is being pursued on ways of assessing the complexity of adesign before any code is built. As these metrics evolve, their use should bepursued, as it is highly desirable to limit the inherent complexity of thesoftware while in the design phase.
It is also recognized that this metric is often not applied until latein the life cycle. It is recommended that this metric should be used as soonas practical (e.g., as code is being developed). Also, it must not be reliedupon as the sole metric to judge quality of the implementation of the design.
In cases of high module cyclomatic complexity, various means exist tohelp identify how it may be reduced. These techniques include calculation ofactual complexity and essential complexity. For further details see referenc-es.
Rules of Thumb:
The criteria presented in Table 7.8-2, which should be applied at themodule level, are widely accepted as industry standards. Any value notmeeting these criteria should cause concern about potential problems in thespecific metric area.
47

Table 7.8-2Metric Criteria (per module)
cyclomatic complexity <- 10
control flow -0
volume <- 3200
LOC <- 200
% comment lines >- 60 %.
For cyclomatic complexity, the suggested limit is 10 for any module. Thereferences noted show that the error rate and number of bugs observed formodules having complexities of less than 10 is substantially lower than thosewith complexities greater than 10. A module with complexity greater khan 10may need to be restructured (if feasible) into several less complex ones. Ifthe complexity is due to structures like CASE statements, the complexity canbe accommodated. HoweVer, if the high complexity is due to structures like DOloops and other raw logic, serious attempts should be made to redesign orsubdivide the module.
A more recent approach varies the criteria for cyclomatic complexityaccording to life cycle phase. During the design phase it is suggested thatthe value not exceed 7 for program design language to allow for expectedgrowth to a value of 10 during implementation to code.
References:
Software System Testing and Quality Assurance, Beizer, Van NostrandReinhold, 1984.
"Draft Guide for the Use of Standard Dictionary of Measures to ProduceReliable Software", IEEE Computer Society P982.2/D6, May 1988.
"Structured Testing: A Software Testing Methodology Using the CyclomaticComplexity Metric", Thomas J. McCabe, U.S. Department of Commerce, NationalBureau of Standards, NBS Special Publication 500-99, December 1982.
"Design Complexity Metrics", T.J. McCabe & Associates, Inc., May 1988."A Software Reliability Study Using A Complexity Measure", Walsh, 1982."Measuring Effectiveness and Adequacy of System Testing", Craig,
Conference Proceedings, Software Test and Validation, National Institute forSoftware Quality and Productivity, Inc., Sept 87.
"The Complexity Analysis Tool", ARPAD-TR-88005, Oct 88.
48

7.9 Metric: Breadth of Testing.
Purpose/Descrintoon:
Breadth of testing addresses the degree to which required functionalityhas been successfully demonstrated as well as the amount of testing that hasbeen performed. This testing can be called "black box" testing, since one isonly concerned with obtaining correct outputs as a result of prescribedinputs.
Life Cycle ADDlication:
Begin at end of unit testing.
Algorithm/Graphical Display:
Breadth of testing consists of three different measures, each of whichshould be applied against the set of SRS requ .:%?.1ts, the set of IRS require-ments, and the set of UFD requirements. One measure deals with coverage andtwo measures deal with success. These three subelements are portrayed in thefollowing equation:
# reqts tested # reqts passed # reqts passed--------- x---------- X-------------- M --------------total # reqts # reqts tested total # reqts
"test coverage" "test success" "overall success"
Breadth of testing "coverage" is computed by dividing the number ofrequirements (either SRS, IRS, or UFD) that have been tested (with allapplicable test cases under both representative and maximum stress loads) bythe total number of requirements.
Breadth of testing "test success" can be computed by dividing the numberof requirements (either SRS, IRS, or UFD) that have been successfully demon-strated through testing by the number of requirements that have been tested.
Breadth of testing "overall success" is computed by dividing the numberof requirements (either SRS, IRS, or UFD) that have been successfully demon-strated through testing by the total number of requirements.
All three measures of breadth of testing should be tracked throughoutthe development process if possible; in actuality, functional testing per CSCIis normally only done as part of FQT and system level testing. The results ofeach must be reported and can be simultaneously displayed either over time(similar to Figure 7.10-1 in the section on depth of testing) or over key testevents (see Figure 7.9-1) with the use of stacked vertical bar graphs. Inpractice, given the typical duration of test events such as FQT, it is usefulto portray breadth of testing over time within the test so that growth ofdemonstrated functionality can be assessed. Figure 7.9-1 summarizes breadth
49

of testing over two typical test periods; in actuality, the monthly growthportrayal should also be generated for each test. It should be pointed outthat test success, as defined in the algorithm above, is not computed againstthe same population of requirements as test coverage and overall success.
Breadth of TestingGraphical Display
Percent of RsQt. CCSCI2)
40 .. . .... . . . . . . . . . .. . .. . . . . . .
20
FOT T1 OT
COVerage Test Success Overe I SUCCOSS
Figure 7.9-1
It should be noted that any time there is a change in requirements,breadth of testing must be revisited. A new requirements baseline willrequire a recomputation of the breadth of testing metrics.
Data Reauire;,,eits:
number of SRS requirementsnumber of SRS requirements tested with all planned test casesnumber of SRS requirements successfully demonstrated through
testingnumber of IRS requirementsnumber of IRS requirements tested with all planned test casesnumber of IRS requirements successfully demonstrated through
testingfor each of four UFD priority levels:
number of UFD requirements
so

number of UFD requirements tested with all planned testcases
number of UFD requirements successfully demonstrated throughtesting
test identification (e.g., FQT, TT, OT)
Freauencv of Reoortina:
monthly throughout functionality and system level testing
Use/InterDrttation:
The coverage portion of breadth of testing provides indications of theamount of testing performed without regard to success. By observing the trendof coverage over time, one gets an idea of the extent of full testing that hasbeen performed.
The success portions of breadth of testing provide indications aboutrequirements that have been successfully demonstrated. The test successmeasure will indicate the relative success based only on the requirements thathave been tested. By observing the trend of the overall success portion ofbreadth of testing, one can easily see the growth in successfully demonstratedfunctionality.
One of the most innovative aspects of the UFD is the categorization ofrequirements in terms of four criticality levels. This approach to userrequirements provides a cornerstone on which to implement the important TQMtenet of addressing customer satisfaction, and will foster a useful dialoguebetween the user and developer as the test process is progressing. With thisapproach, the most important requirements can be highlighted. Using thisprioritization scheme, one should partition the breadth of testing metric toaddress each criticality level. At various points along the development path,the pivotal requirements for that phase can be addressed in terms of tracing,test coverage, and test success.
The test cases to be used for evaluating the success of a requirementshould be developed through the TIWG process in order that sufficient testcases are generated to adequately demonstrate the requirements. This high-lights the importance of the concurrent participation of the user, developer,tester, and evaluator in requirements analysis and test planning. A strongTIWG process and a healthy amount of user and tester involvement in testplanning will serve to mitigate the subjectivity in assessing whether therequirements have been satisfied.
It is recognized that under the above method, failing only one test caseresults in a requirement not being successfully demonstrated. If sufficientresources exist, an additional, optional way to address breadth of testingconsists of examining each requirement in terms of the percent of test casesthat have been performed and passed. In this way, partial credit for testinga requirement can be shown (assuming multiple test cases exist for a require-ment), as opposed to the all or nothing approach. This method, which is not
51

mandated here due to cost and reporting considerations, may be useful inproviding additional granularity into breadth of testing.
The breadth of testing metrics for coverage and overall success shouldbe used together and in conjunction with the requirements traceability metrics(to trace unsuccessfully demonstrated UFD requirements to the appro, rlateCSCI, and to see the test coverage on successfully traced requirements), the(optional) development progress metrics, and fault profiles so that problemareas can be isolated. The breadth of testing metric should also be used inconjunction with the metrics for depth of testing, requirements stability, anddesign stability.
During post deployment software support, this metric should be used withthe requirements traceability metrics to indicate areas which need regressiontesting.
It should be noted that some requirements may not be testable until verylate in the testing *process (if at all). For example, a requirement that isallocated to multiple CSCIs may not be proven out until the final system leveltesting.
Rules of Thumb:
The government should clearly specify what functionality should be inplace at each phase of development. This process is obviously system depen-dent. At each stage of testing (unit through system level stress testing),emphasis should be placed on demonstrating that a high percentage of thefunctionality needed for that stage of testing is achieved. Prior to theformal government operational test, most functions should be demonstratedunder stress loading conditions.
References:
"Standard Set of Useful Software Metrics Is Urgently Needed, FletGherJ. Buckley, Computer, July 1989.
52

7.10 Metric: DeDth of Testing.
PurDose/DescriDtion: -
The depth of testing metrics provide indications of the extent andsuccess of testing from the point of view of coverage of possiblepaths/conditions within the software. The testing can be called "white box'testing, since there is visibility into the paths/conditions within thesoftware.
Life Cycle ADolication:
Begin at CDR. Continue through development as changes occur in eitherdesign, implementation, or testing. Revisit as necessary during POSS.
Alaorithm/Graohical Displav:
Depth of testing consists of three separate measures, each of which iscomprised of one coverage and two success subelements (similar to breadth oftesting).
The path metric for each module is defined as the number of unique pathsin the module that have been successfully executed at least once, divided bythe total number of paths in the module. A path is defined as a logicaltraversal of a module, from an entry point to an exit point. If one refersback to the discussion of the complexity metric, a path is actually a combina-tion of edges and nodes.
The statement metric for each module is the number of executablestatements in the module that have been successfully exercised at least once,divided by the total number of executable statements in the module.
The domain metric for each module is the number of input instances thathave been successfully tested with at least one legal entry and one illegalentry in every field of every input parameter, divided by the total number ofinput instances in the module.
The optional decision point metric for each module is the number ofdecision points in the module that have been successfully exercised with allclasses of legal conditions as well as one illegal condition (if any exist) atleast once, divided by the total number of decision points. Each decisionpoint containing an "or* should be tested at least once for each of thecondition's logical predicates.
Figure 7.10-1 portrays test coverage and overall success for the pathswithin a CSCI, which is computed as a composite of its module level pathmetrics. The graph is somewhat similar to the graph portrayed for breadth oftesting, although the depth of testing metric will typically progress suchquicker than the breadth of testing metric.
53

Depth of TestingPercent of Paths - C8CIS
100-
80-
60-
40-
20-
0 '1 2 8 4 6 6 7 8 9 10 1112
Program Month
ooveraoe 9 overall success
rigure 7.10-1
Data Reauirements:
for each module:CSCI identifierCSC identifierCSU identifiernumber of paths which have been successfully executed at
least oncenumber of inputs which have been successfully tested with
one legal entry and one illegal entrynumber of statements that have been successfully exercisednumber of pathsnumber of statementsnumber of input instancesnumber of decision points (optional)
Freauency of Reoortino:
monthly (if a CSU has been modified or further tested)
Note: In recognition of the effort required to collect and report thedepth of testing metric, the following rules are offered for data collection
54

and reporting. Compute the domain metric always (it is relatively straight-forward). For the path and statement metrics, if automated tools exist,compute the metrics. If no automated tools exist, compute the metrics if themodule implements a UFD priority one requirement, or if the complexity rulesof thumb are exceeded for that module.
Use/Interoretation:
The depth of testing metric attacks the issue of test coverage, testsuccess, and overall success by considering the paths, statements, and inputsto the software. The elements of test coverage, test success, and overallsuccess should be used and interpreted in a similar fashion to that describedin the use/interpretation section of the breadth of testing metric. Thetrends of these depth of testing metrics over time provide indications of theprogress of successful testing, and also of the sufficiency of the testing.
The metrics are collected at the module or CSU level, but they can beeasily extended to the CSC, CSCI, or system level by simply replacing the term"module" in the algorithm definition above with the term "CSC, or "CSCI," or"system." Early in the contractor testing process, it makes more sense toassess depth of testing at the module or CSU level, but later it makes moresense to consider CSCs and CSCIs.
The depth of testing metrics are typically collected using a combinationof static and dynamic analysis techniques. Static analysis deals withexaminations of the software and related documentation; an example of such atool would be a complexity analysis tool used to compute the possible pathsthrough the software. Dynamic analysis deals with actually executing thesoftware; an example would be a profiler that tracks the execution of variouspaths within the software. Test case generators can be used to aid in thedevelopment of appropriate test cases. Tools are available to help in thedata collection effort; they serve to greatly ease the dynamic analysiseffort.
The depth of testing metrics can be used to focus discussion on thosemodules which implement high priority UFD requirements. Ideally, the testprocess should initially focus on those modules which incorporate highpriority UFD requirements. One would like to see these modules, as well ascommon or shared modules, 'wrung out" early in the test program via the depthof testing metric.
In addition to addressing test coverage and test success, the domainmetric and the (optional) decision point metric serve to partially address therobustness of the software. That is, these metrics serve to indicate the"extent to which the software can withstand the entry of illegal input values.
The depth of testing metrics should be used in conjunction with require-ments traceability, fault profiles, complexity, and the (optional) developmentprogress. For example, with complexity, the modules of highest complexitycould be highlighted for testing (e.g., one might want to test those modulesfirst). Also, the cyclomatic complexity value gives the required number oftest cases needed to exercise all the paths in the software. They must also
55

be used with the breadth of testing metrics to insure that all aspects of
testing are approaching an acceptable state for the government.
Rules of Thumb:
None.
References:
"Standard Set of Useful Software Metrics Is Urgently Neededo, FletcherJ. Buckley, Computer, July 1989.
56

7.11 Metric: Fault Profiles.
Puroose/Descriotion:
Fault profiles provide insight into the quality of the software, as wellas the developer's ability to fix known faults. It is interesting to notethat these insights actually come from measuring the lack of quality("faults") in the software. Early in the development process, fault profilescan be used to measure the quality of the translation of the software require-ments into the design. Later in the development process, they can be used tomeasure the quality of the implementation of the software requirements anddesign into code.
Life Cycle Aoolication:
Begin after completion of unit testing (when software has been broughtunder developer's configuration control) and continue through POSS.
Alaorithm/Graphical DisDlay:
Plot cumulative number of detected software faults and cumulative numberof closed software faults as a function of time, as shown in Figure 7.11-1.One plot should be developed for each CSCI and for each priority level, asdefined in the data requirements section below.
One should Rlso plot, on a month by month basis, the number of softwarefaults that were detected and closed during the month, as shown in Figure7.11-2.
Calculate average age of closed faults as follows: For all closed STRs,sum the days between when the STR was opened and the STR was closed. Dividethis sum by the total number of closed STRs.
Calculate average age of STRs as follows: For all STRs, sum the daysbetween when the fault was opened and either when it was closed or the currentdate (if still open). Divide this sum by the total number of STRs.
Relative CSCI status with respect to open faults can be shown as inFigure 7.11-3. Histograms of open faults by CSCI and priority can be por-trayed as in Figure 7.11-4.
Finally, another useful display is the average age of STRs over time, asshown in Figure 7.11-5.
An attempt should be made to screen out duplicate software problemsbefore formally entering an STR. In cases where it is determined, subsequentto the formal entry, that an STR is a duplicate, its status should be changedto duplicate, even though the original problem may not be resolved. Whenchanging an STR from an open status to a duplicate status, the cumulativenumber opened should be decremented for the next reporting period. Theoriginal STR remains open until a fix is developed and verified. It should berecognized that an extensive number of open STRs that will turn out to beduplicate may skew the parameters computed above.
57

FaultPrfiles#Faults
300
00 2 4 a S 0 12 14
Program Month
Cumulative Detected -+- Cumulative Closed
Figur~e 7.11-1
S-TRs By -MonthCSCl2, Priority One
Number of STRe
40
20-
10-
0-
Program Month
FigUre 7.11-2

OCI Op' %*A en Age%(faults still open)
STime Open (week.)
.... ... .... ....... * *' ' ' * ' '°....... . . . ................*' °°' °°".... ...........*
S ...... . °.... ..... . ..... . ..... ..... ..... *.......... ... •. o ...... ° .
4 ... °,.... °. .. .o. . o.. , o.. ......... -...... ... •.. . .
m Priority I • Priority 2 Priority aSPriority 4 I Priority 5
Fi]gue 7.11-3
Open Age Histogram(faults still open)
Number of Faulta
100soo
so ........ ... ... ............................................4 O " ......... ....................................
20 -. ... . . . . . . . . . . . . . . . . . .
0"0-2 2-4 4-6 6- S-10 1012 12-14
"Time Open (weeks)
M cem Priority One
NOWs &I a" of owe" Emits * 6 wee"k
FiguWe 7.11-4
59

Average Age of STis(open and closed)
Average o. of 81TR (weeks)10
8"
4-
2.
1 4 5 6 7 8 10 o 12
Program Month
"- Average Age of STRe
Figure 7.11-5
Data ReQuirements:
The following raw data should be derived from all software troublereports. These data will be used to calculate higher level statistics(described later in this section), as well as to support queries generated asa result of the graphical portrayals.
unique iddate writtendescriptive title of problemdetailed description of problem (optional)priority :
1 - causes mission essential function (or operator'saccomplishment thereof) to be disabled or jeopardizes personnelsafety
2 - causes mission essential function (or operator'saccomplishment thereof) for which there is no work around to bedegraded
3 - causes mission essential function (or operator'saccomplishment thereof) for which there is a reasonable workaround to be degraded
4 - causes operator inconvenience but doesn't affect amission essential function
5 - all other errors
60

category :requirementsdesigncodedocumentationother
when discovered :requirements analysisdesign reviewcode and unit testintegration and testoperation/maintenance
status :openduplicateclosedinvalid
date detecteddate closedsoftware moduleCSCIsoftware versioneffort to fix (man-hours)
The following rolled up statistics are the building blocks for the graphicalportrayals of fault profiles.
For each priority, for each CSCIcumulative number of STRscumulative number of closed STRsaverage age of closed STRsaverage age of STRstotal number for each category (described above)
Freauencv of Reoortina:
monthly
There are various aspects of fault profiles that can be examined forinsights into quality problems. The most popular type of graphical represen-tation, portrayed above In Figure 7.11-1, displays detected faults and closed
* (corrected and verified) faults on the same scale. These types of graphsshould be examined for each priority level, and for each major module or CSCI.Applled during the early stages of development, fault profiles measure thequality of the translation of the software requirements into the design. STRsopened during this phase suggest that requirements are not being defined orinterpreted correctly. Applied later in the development process, assumingadequate testing, fault profiles measure the implementation of the require-ments and design into code. STRs opened during this stage could be the resultof having an inadequate design to implement the requirements, or a poor
61

implementation of the design into code. An examination of the fault categoryshould provide indications of these causal relationships; these examinationsshould be performed as a matter of course in any analysis of fault profiles.One should continuously observe the gap between open and closed faults; if aconstant gap or a continuing divergence is observed, especially as a key testor milestone is being approached, appropriate action should be taken. Theonly time the open curve should decrease is when duplicate STRs have beendiscovered subsequent to entry, and the number open has been decremented asdescribed in the algorithm above.
Another use of fault profiles consists of monthly non-cumulative totalsfor each CSCI and priority (Figure 7.11-2). This can be compared to theamount of testing done in those months to provide insights into the adequacyof the test program.
Open age histograms (Figure 7.11-3 and Figure 7.11-4) can be used toindicate which CSCIs, which priorities, and which faults are the most trouble-some. This may serve to indicate that the developing group for that CSCI mayneed assistance, whether due to a difficult set of requirements or for someother cause.
Average open age graphs (Figure 7.11-5) can track whether the open ageof faults is increasing with time, which may be an indication that thedeveloper is becoming saturated or that some faults are exceedingly difficultto fix.
Caution must be used in interpreting the fault profiles, as the detec-tion of errors is closely tied to the quality of the development and testingprocess. That is, a low number of detected faults could IndicaLe a goodproduct from a good process or simply a bad process to start with (e.g., onewith inadequate testing). Conversely, a large number of faults early on in aprogram may not be bad (e.g., the developer may have an aggressive testprogram, or may be using techniques such as rapid prototyping with heavy userinvolvement to wring out the requirements early). A large number of Siks openin a particular month may be the result of errors detected during a specifica-tion review, audit, test, or from use of the software in the field. Thus, themeasures cannot be assessed without also considering the measures on breadthand depth of testing. The fault profiles should also be used in conjunctionwith the metrics for complexity, design stability, and requirements stability.
If the cumulative number of closed STRs remains constant over time and anumber of STRs remain open, this may indicate a lack of problem resolution.The age of the open STRs should be checked to see if they have been open foran unreasonable period of time. If so, these STRs represent areas of in-creased risk. The cause for lack of resolution needs to be identified andcorrective action taken.
Once an average STR age has been established, large individual deviationsshould be investigated. There are several reasons why STRs may remain openfor a lengthy period of time. One could be that the STR is a result ofidentification of an inadequate requirement which needs to be refined and isundergoing review. An ECP-S may have been written for a problem noted and is
62

waiting resolution. It could also mean that the developer has failed to takecorrective action on the problem. Again, the reasons for lack of problemresolution need to be identified and corrective action taken. The averageopen age of high priority faults should also be examined with respect to thetime remaining to the next major test or milestone. If the average open ageof high priority faults exceeds the time remaining, consideration should begiven to delaying the test or milestone until the problems are resolved.
As an option the following method of assessing test adequacy can be used.Rome Air Development Center (RADC) conducted wide research on several softwareprojects and identified the characteristics which have direct impact on systemreliability. RADC-TR-87-171 Volumes I and II, "Methodology for SoftwareReliability Prediction" can be used to predict the number of faults expectedto be present per configuration item. Using this information as a guideline,fault profiles can be compared to these estimates to determine if the "peaklevel" of opened STRs is being approached and that the software developmentprocess has matured. As an example, suppose the predicted number of faults ismuch higher than the actual number of faults reported. If the test coveragemetrics are low, this suggests that testing is not complete and the remainingfaults are yet to be found. If the test coverage is high this could mean thatthe software was well written to start with, or that the test cases used werenot thorough enough. If the prediction is much less than the actual number offaults, this may indicate a number of problems. The software developer mayhave an inadequate development effort, may have encountered unexpected designdifficulties, faulty coding or an especially troublesome module(s). Therequirements stability metric should be checked; if it is high, this mayindicate an immature baseline.
Rules of Thumb:
The government should not accept software for any formal system levelgovernment testing until, at a minimum, all priority one and two faults havebeen closed. Furthermore, a large number of lower priority faults should beexamined for a possible cumulative effect on successful test conduct.
If tracking the fault profiles starts early in software development, anaverage STR open age of less than three months may be experienced. Afterfielding this value can rise, primarily due to the necessary delays typicallyexperienced in the PDSS process.
References:
AMC Pamphlet 70-14, "Software Quality Indicators", 20 Jan 87.SEI Quality Subgroup Working Papers, untitled, Nov 1989.IEEE Standard 982.1-1988, IEEE Standard Dictionary of Measures to Produce
Reliable Software.IEEE Standard 982.2-1988, IEEE Guide for the Use of IEEE Standard Dictionary
of Measures to Produce Reliable Software.
63

7.12 Metric: Reliability.
PurDose/Description:
The reliability metric is an indicator of how many faults there are inthe software as well as the number of faults expected when the software isused in its intended environment. An additional measure, Time To Restore,augments reliability by measuring the impact of unexpected outages.
Life Cycle Apolication:
Begin at CDR.
Algorithm/Graohical Disolay:
Use fault profile metrics throughout development. After turnover to thegovernment for TT and OT, calculate the system Mean Time Between Hardware/Software Mission Failure (MTB HW/SW MF) and Mean Time Between Software MissionFailure (MTB SW MF) of the latest configuration directly only when thesoftware is being used and stressed in accordance with its Operational ModeSummary/Mission Profile (OMS/MP). The nature of TT sometimes dictates thatthe OMS/MP can not be adhered to. In these cases there are frequentlysufficient data available on each of the system mission essential functionswhich comprise the OMS/MP to normalize the observed function failure rates tothe usage proportions described in the OMS/MP to predict how often thesoftware will fail in the field application. Progress can be tracked usingvarious reliability growth techniques. Note that unlike fault profiles,wherein duplicate occurrences of the same software fault are not counted, whencalculating the various MTBF parameters, every occurrence of repeat failuresmust be included. "Time" in this application is system operating hours, notCPU time. A useful supplementary display consists of a Pareto distribution ofeach software fault type showing its frequency of occurrence; Figure 7.12-1portrays a sample Pareto plot.
Time To Restore consists of various measures of the time it takes anoperator to restore mission essential automated capabilities due to failure ofthe software. This time includes recovery of lost data and any systemreinitialization that is required to return the system to full functionality..
Due to the specialized nature of some of the above techniques, it isrecommended that the values be provided by either an independent evaluator ora PM matrix support reliability analyst.
64

Fault Pareto DistributionNumber of Occurrence*
403 5 -° ' ' ' • . . . . . . ... o... . . . . . . . ... . . . . . . . . . . . . . . . . . . ..o . . ..o . . ..o . . . ., . . . . . . . . . . . . . . .o . . . .° . . . . . . . •. . . ,
80
2 5 -° ° '' ' ................. , ......... , o.....°.......oo..o............o.............o......... . . . . . .. . . . . .
2 0 - .°..... °.................... °............. ".......... °....... "........... °...........
1 0 .... .... ..................... • .......................... o....o.. o...... ,......
10 ... . . ..................... ............
0F8 F2 F4 F5 F1 F3 F7 F8
Fault Name
CSCI3, Priority 1
Figure 7.12-1
Data ReQuirements:
All data requirements from the fault profile metrics.All reliability, availability, and maintainability incident
data from testTest identification (e.g. Pre-Production Qualification Test
(PPQT), Reliability Growth Test, Independent Operational Test &Evaluation (IOTE))
System Mean Time Between Operational Mission Failure (MTBOMF)requirement
System MTB HW/SW MF requirementSystem Mean Time To Repair requirementDemonstrated point estimate and 80% lower confidence bound on MIB HW/SW
MFDemonstrated point estimate and 80% lower confidence bound on MTB SW MFNumber of software failure modes and number occurrences of eachTime To Restore (mean, median, and maximum 95th percentile)
Freguency of ReDorting:
Fault profile information - monthly.
65

Contractor TT or Government TT/OT - gather data in real time as inci-
dents occur.
Use/Interoretation:
Use of the fault profile metrics provides indications of the rate atwhich faults are being reduced and thus reliability increased. Of course, onealso needs to simultaneously consider the test coverage metrics. The faultprofile information, however, says nothing about how often the faults remain-ing in the software will be encountered by the user. While many arguments canbe made that Mean Time Between Failure (MTBF) is an inappropriate measure, itis more than adequate for estimating how often one can expect the software to"fail" in a field environment as long as inputs are of the type and inrelative proportion to what will be encountered in field use, and modules areexercised with the relative frequency expected in a tactical environment.Measuring MTBF only when the system and software are being used in accordancewith the OMS/NP or normalizing mission essential function test data to theOMS/HP insures the above conditions.
The calculated 80% lower confidence bound on MTB HW/SW HF should becompared to its requirement. In cases where the demonstrated is belowrequired, MTB SW MF allows one to determine the contributions of both hardwareand software to system unreliability.
A Pareto distribution will enable the developer to focus correctiveactions on faults which contribute most to software unreliability (i.e., focuson the significant few (with a high frequency of occurrence) as opposed to thetrivial many).
The calculated mean and median Times To Restore should be compared tothe system Mean Time To Repair requirement. Excessive mean, median, orindividual times can indicate poor design or human factors problems. Thethree measures together give an indication of the dispersion of the individualrestoration times.
Rules of Thumb:
No formal criteria are given. However, the government should not acceptthe software until the fault profile open anomaly curve flattens out, closureof anomalies approaches the open anomalies, and a high degree of breadth anddepth of testing have been demonstrated. Do not go to OT until system levelMTB HW/SW HF has either been demonstrated with high confidence in TT or isprojected to exceed the requirement based on late occurring correctiveactions.
References:
AR 702-3, "Army Materiel Systems Reliability, Availability and Maintain-ability"
TRADOC/AMC Pamphlet 70-11, "Reliability, Availability, and Maintainabili-ty (RAN) Rationale Report Handbook'
66

8. IMPLEMENTATION CONSIDERATIONS
8.1 Oualifvina Rules.
The suite of metrics must be used on all systems that meet all three ofthe following criteria:
1) the system contains computer hardware and software developed andmanaged under the auspices of either of the following regulations:
a) AR 70-1, "System Acquisition Policy and Procedures'; orb) AR 25-3, "Army Life Cycle Management of Information Systems'
2) the system is either :a) an MSCR acquisition category (ACAT) I, 1I, or III; or"b) an AIS Class 1, 2, 3, or 4.
3) the system either :a) supports decision making; orb) receives or senses analog or digital data, processes it and uses it
to influence external system behavior, including input from soldiers such ascrew controls; or
c) exchanges data with other systems; ord) stores information for access by soldiers (e.g., target priorities,
digitized maps)
8.2 Grandfathering.
Headquarters, Department of the Army has directed that, beginning on IJune 1992, unless the decision body (ASARC or MAISRC) directs otherwise, thefollowing grandfathering rules are to be used to decide if an existing programmust implement the metrics set:
1) for qualifying (see above) NSCR systems, the full set of metrics isrequired for all systems which are not past MS II.
2) for qualifying (see above) AIS systems, the full set of metrics isrequired for all systems which are not past MS III.C (certified effective andsuitable for full fielding).
Note: major product improvement activities (in the post-deploymentphase for MSCR systems, or in the operations phase for AIS systems) which meetthe criteria above will be required to implement the full set of metrics.
8.3 Data Collection.
For most metrics, the data should continue to be collected afterfielding of the system. In particular, software updates developed through aLife Cycle Software Support Center (LCSSC) must be measured in a similarfashion as a developmental system. The general rule is to collect the samebasic data that were collected in similar activities prior to Milestone III.
When scanning across all metric data elements, one can observe that somesubelements are identical for different metrics. When reporting the metricsto the data base (described in Section 12), a smart interface will insulatethe data entry person from having to enter the same information more thanonce.
67

The Program Manager has responsibility for seeing that the metric dataelements are collected. In reality, the actual collection will most probablybe done by the developer or IV&V agent. In those cases where the developer isdoing the collection, it is recommended that the IV&V agent should at leastsample some of the more crucial metric data elements for consistency andcorrectness.
As the metrics are reported on the periodic basis described herein(monthly for many metrics), it is entirely possible that certain data elementsmay not have changed from the previous reporting period. In these cases, itwill be acceptable for the data entry person to simply report 'no change* forthe particular data element.
To facilitate the collection of the basic data elements, data itemdescriptions (DIDs) are being developed. The master set of DIDs will be basedupon the data requirements prescribed for each metric in Section 7. Addition-ally, a subset of these data requirements will comprise a second set of DIDs,which will support collection for the metrics data base described in Section12.
68

8.4 Life Cycle AoDlication.
Figure 8-1 portrays a graphical depiction of the applicability ofmetrics throughout the life cycle. Both HSCR and AIS milestones are listed inthe top portion of the chart. Although a waterfall model is portrayed in theactivities line at the top of the chart, the chart can also be applied toother life cycle models (e.g., the spiral model) by using the specificactivities Identified at the top of the chart as cues to the use of a specificmetric. As is indicated on the chart, development activities during the post-deployment software support phase require the collection of similar metrics aswould be collected on the same activities during a pre-deployment phase.
Metrics Durina the Life Cycle
Activities Requirements Analysis ;olperDevelo perDoti lo do Dogaesl end Govt Tetine
Milestones Isa • lAeRmJ II PD AiS US IIS M_11MS sn~ I"S M 1 CDR
MetricsManagement Metrics
Cost pSchedule iComp Resource Utilll81W Eng Environment
Reqts MetricsRoqto Traceability a , "Reqto Stability p .
Quality MetricsDesign StabilityComplexityBreadth of TestingDepth of TestingFault ProfilesReliability , i
* During PD8S, continue to apply the same metrics aswere applied during similar activities pro-MS III
* Report at Milestone ReviewSApply If prototype software will be used In later phases
Figure 8-1
69

The twelve chosen metrics are felt to provide valuable insight into aprogram, especially with regard to demonstrated results and readiness fortest. As such, all should be reported at Program Reviews, In Process Reviews,and Test Readiness Reviews (both Technical and Operational). Some of the moredetailed metrics and many subelements of the major ones however, are notsuitable for presentation at high level decision reviews such as ASARCs,MAISRCs, and Defense Acquisition Boards (DABs). Within Figure 8-1, thediamonds indicate the major decision milestones at which the given metricsshould be reported. In addition to the metrics considered mandatory for agiven milestone, any other metric which indicates the potential for seriousproblems should be reported.
70

9. TAILORING
The subject of tailoring of the metric set was exhaustively discussedduring the proceedings of the Measures Subgroup. While there is a school ofthought that believes that the program manager should be allowed to tailor themetric set to the program under consideration, the vast majority of STEPparticipants believe that the only way to implement a metrics program through-out the Army is to require the collection of a common set of metric dataelements.
Tailoring above and beyond the core set of twelve metrics is certainlyencouraged. For example, the appendices describe two optional metrics thatsome groups have found beneficial to use in the past. For a particularprogram, the use of any other measure deemed appropriate by the materieldeveloper (or by the test and evaluation community as negotiated through theTIWG) is also encouraged. For example, a particular functional area withinthe Army may believe that function points as a metric makes sense for theirapplications. Another way of tailoring would be to take the basic dataelements contained in this report and put them together in different ways.These new ways of combining existing data elements might be useful as anadjunct to the required methods described herein.
There are also three ways to tailor metrics within the core set. First,one could report the metrics more frequently than is called for in thisdocument. For example, if a metric is experiencing turbulence, it may bedesirable to obtain more frequent measurements of progress. The second way totailor within the metric set is from the standpoint of depth. It is certainlyallowable to go down to further levels of depth, in addition to the leveldescribed for each metric. For example, in the cost metric, it may bebeneficial to go down deeper in the wcrk breakdown structure, to gain addi-tional visibility into cost considerations. The third way to tailor withinthe metric set is from the standpoint of level of resolution. It is allowableto go down to a finer resolution, in addition to what is described herein.For example, where we track a metric by CSCI, it may be desirable in certaininstances to also track the metric by that CSCI's constituent parts.
10. JUSTIFICATION FOR METRIC SET
The Measures Subgroup feels that all the metrics specified in the metricset meet the criteria set forth in Section 5. In addition, they are consis-tent with the tenets of total quality management in that they represent bothprocess and product measures. They also address the areas most commonlyagreed to as needing attention in order to develop *good" software: require-ments, resources, development process, quality/maturity, and test cover-age/sufficiency. Table 12-1 illustrates the support that the metrics lend tothe overall software quality program described in DOD-STD-2167A.
The challenge in software development is to make informed, fact-basedmanagement decisions. The metrics serve to act as an early warning system,highlighting small problems early so that they may be resolved before theygrow into larger, more costly problems.
71
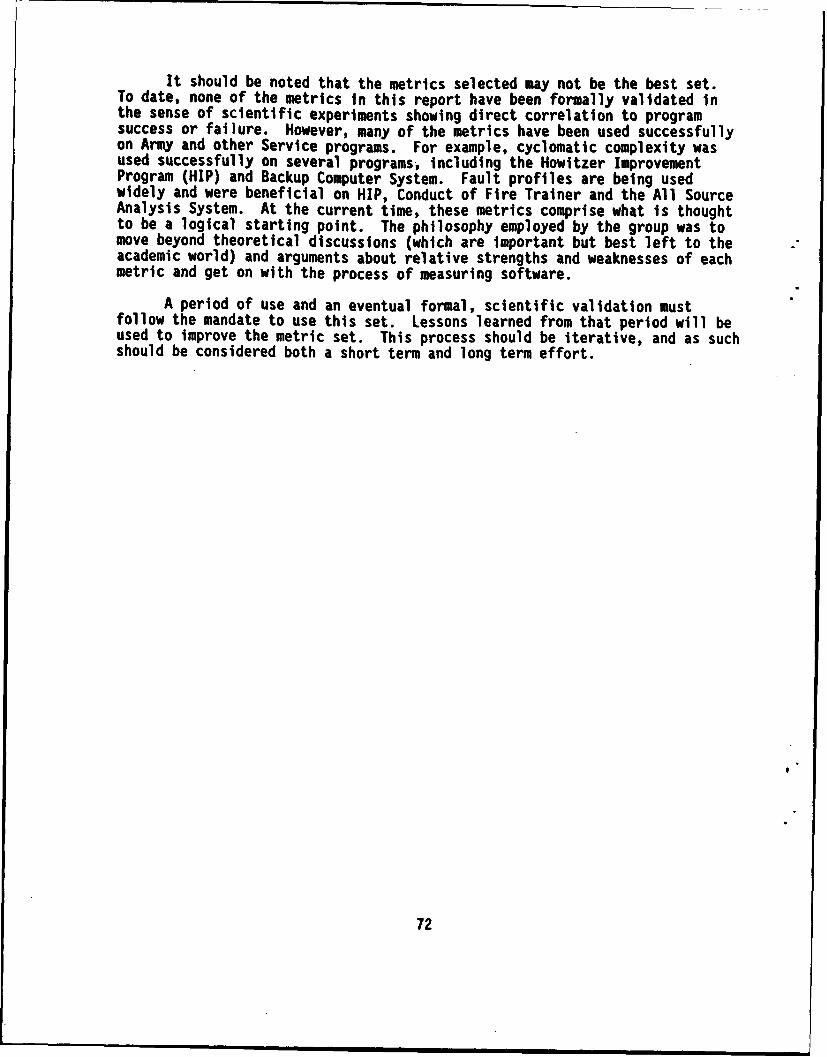
It should be noted that the metrics selected may not be the best set.To date, none of the metrics in this report have been formally validated inthe sense of scientific experiments showing direct correlation to programsuccess or failure. However, many of the metrics have been used successfullyon Army and other Service programs. For example, cyclomatic complexity wasused successfully on several programs, including the Howitzer ImprovementProgram (HIP) and Backup Computer System. Fault profiles are being usedwidely and were beneficial on HIP, Conduct of Fire Trainer and the All SourceAnalysis System. At the current time, these metrics comprise what is thoughtto be a logical starting point. The philosophy employed by the group was tomove beyond theoretical discussions (which are important but best left to theacademic world) and arguments about relative strengths and weaknesses of eachmetric and get on with the process of measuring software.
A period of use and an eventual formal, scientific validation mustfollow the mandate to use this set. Lessons learned from that period will beused to improve the metric set. This process should be iterative, and as suchshould be considered both a short term and long term effort.
72

-~4 -m -0 -- m 6 - -
400
.43
041
to.
* -
r4
E-4 04 4a
ot
004 U) A. a.U) U
'44
4-0 C
0& 44)6
W ) to ag. a. a. 0igU a
73C

11. COSTS AND BENEFITS
Implementation of a structured approach to collect metric data mayincrease the cost of software development, although as the process maturity ofvarious developers Increases, the cost of a metrics program will decrease. Itmight also be argued (by someone with avery narrow perspective) that theactivity of measurement will reduce productivity on a project. However, whileit is true that implementation of a metrics program will add some cost to aprogram, given the amount of money the Army spends on software development andthe fact that there seems to be a systemic problem in the timely delivery ofquality software, there is certainly a potential for cost benefit or costavoidance (although not measurable at the current time), especially in thelong run.
Experience on the cost of collecting metric data is sketchy. The mostdefinitive information obtained came from NASA's Software Engineering Labora-tory, While this is a somewhat different environment for software developmentfrom that of the Army, NASA has over fifteen years of experience in thecollection and analysis of metric data. Their experience suggests that datacollection costs about 2 to 3 percent of the cost of software development.Data entry and quality control comprises another 6 to 8 percent of the cost,and analysis adds another 10 to 15 percent to the cost. It is felt that thelast category (analysis) would not be an added burden to Army softwaredevelopment costs, since the evaluation agencies would absorb this burden.
Also, it cannot be stated that there is evidence that metrics "pay off,"at least in the monetary sense but it makes logical sense that they would. Itis felt at this point that measurement of software is not only good to do butin fact necessary. It enables management and decision makers to understandand gain visibility into the software development process. Also, these samepeople need basic data to manage and predict future projects. The state ofthe art cannot be advanced without measurement, applied research, and analy-sis.
12. METRICS DATA BASE
During the recommendations phase of the STEP, the Measures Subgroupproposed that a centralized database be created to store the data for theminimum set of metrics to be collected throughout the Army. There were tworeasons for creating the database. First, it would enable decision makers andevaluators to easily monitor a program's progress at any point in time withoutputting an extra burden on a PM during a time when the PM's staff might bevery busy (e.g., in preparing for a milestone review). Second, and mostimportantly, it would greatly facilitate the stepwise refinement, formalvalidation, and cost benefit analyses of the metrics as data from numerousprojects would be available from one source. The proposal was endorsed by theVice Chief of Staff of the Army.
TECOM has volunteered to develop, house, and administer the database. ATECOM-led contractual effort is ongoing to finalize the metrics databaserequirements specification and design document, and to develop the database(including a prototype for proof of concept).
74

The data are to be collected by the contractor and/or IV&V agent andinput into the database by the PM's Office. In cases where the developer doesthe collection, it is recommended that the IMvv agent should at least samplesome of the more crucial metric data elements for consistency and correctness.The PM would only have access to their project. Program Executive Officers(PEOs) would only have access to data on the programs under their purview.Decision makers, testers, assessors, and evaluators would have access to dataon all projects.
13. RECOMMENDATIONS
In addition to the many recommendations specified in the description ofeach metric's use, interpretation, and rules of thumb, the following recommen-dations are made in order to improve the state of the Army in softwaredevelopment, test, and evaluation.
The metrics must be implemented by force. That is, there must be aregulatory requirement throughout the Army, and must be used for all systems(both information systems and tactical/embedded systems) undergoing develop-ment or a major post-deployment upgrade. The most important requirement,however, is that the data to be collected must be specified in the RFP andscope of work (SOW). The contractual language required to obtain these dataneeds to be developed.
The Army should continue to monitor (and increase its participation in)the efforts of the various metric-related working groups being sponsored bythe SEI. These groups consist of nationally recognized experts, and includemany of the key researchers. it is hoped that their efforts, as they nearfruition, can be used to improve the Army's recommended set of metricscontained in this report.
The Army should make sure this metric definition effort dovetails withthe developing DOD Software Action Plan. The efforts of the Software ActionPlan and the STEP should be complimentary efforts, especially in the criticalarea of metric development. To date, there has been some initial coordinationbetween the two groups.
The Army should avail itself of any opportunities for tri-servicecoordination on metrics. It is recognized that the Air Force has been aleader in many aspects of software evaluation. It is also known that the AirForce Systems Command is leading an effort to develop a similar set of metricsas is specified in this report. The Army should monitor this effort. One ofthe most important reasons to consider trn-service coordination is that if allthe services were to collect the same data elements, then the validationprocess and stepwise refinement of the metric set could be accomplished muchsooner.
The Army-wide data base described in Section 12 should be completed totrack the use of metrics. Such a data base would serve as a repository of theuse of metrics (including cost data), and would be the focal point for effortsto refine and formally validate the metric set. Also, the existence of such a
75

data base would provide the opportunity for the conduct of cost benefitanalyses.
Finally, the metrics must be used as an entire set. Within the use andinterpretation description of each metric, we have proposed specific ways inwhich to look at several metrics together, so as to get a more completepicture of the state of the software. Also, several metrics have somewhatlimited life cycle applicability, and various metrics are more meaningful atcertain times in the life cycle. Many individuals might also express reserva-tions about the possible "gaming" of metric data by the developer or contrac-tor. Using the metrics as an entire set can serve to mitigate these concernsand risks.
14. CONCERNS
Any serious known limitations for a particular metric were described inthe use and interpretation section for that particular metric. Additionalconcerns are specified in the following paragraphs.
One of the primary concerns of the group is that software engineering asnot a mature process. It is widely recognized that the discipline of softwareengineering is still evolving, as evidenced by the continual introduction ofnew technologies and software development techniques. Within private indus-try, there is inconsistent application of recognized software developmentmethodologies and requisite metrics to measure those processes and products.Within the Army, there does not seem to be discipline with either the use ofsoftware engineering principles or the collection or evaluation of metricdata. The hope of the authors is that the process of measuring software canhelp to bring the disciplines of engineering to the process, so that theprocess can indeed be referred to as "software engineering."
The concern about the immaturity of software engineering leads to thenext concern. The SEI, which is recognized and chartered as the DOD's leaderto advance the state of software engineering and transition key softwaretechnologies to the DOD, feels that it is too early to definitize "the" set ofmetrics. SEI's planned experimentation is aimed at studying the motivation ofthe software practitioner, so that the most important factors to measure canbe identified. We are concerned about recommending a set of metrics in thEface of SEI's concern. However, we recognize the need for continued study andan iterative process of metric refinement and eventual validation. Thestepwise refinement process should include any findings of the SEL. We feelstrongly that it is important to start measuring the software developmentprocess and associated products. Just to measure by itself should add valuebecause people will know that they are being monitored. Process improvementscannot come about until measurements are made of that process and its prod-ucts.
Several metrics are closely tied to the current generation of languages(third generation, procedurally-oriented languages) and environments typicallyemployed by the Army. As mentioned earlier, while some language in thedescription of the metrics is tied to the current life cycle, the so-called"waterfall" model specified in DOD-STD-2167A, the Measures Subgroup holds the
76

firm belief that the metrics can and should be applied to systems using otherlife cycle models, including the spiral model, and non-traditional developmenttechniques such as rapid prototyping and evolutionary development. As we movitoward applications which use fifth generation languages, computer aidedsoftware engineering (CASE), object-oriented programming, and a wide range ofother techniquas, the current set of metrics will have to be improved.
It must be pointed out that this recommended, minimum set of metrics majnot be "the set." However, as we have hopefully pointed out throughout thisreport, we feel that it represents a logical and good starting point fordeparture on a software measurement effort within the Army.
Finally, even if the validation process proves out the metric set as atruly predictive and valuable tool for program success, many other keyactivities beyond the implementation of a metrics program still have to beperformed to guarantee the success of a development effort. Besides the factthat the metric set is not a silver bullet, it is also recognized that, inaccordance with the spirit of TQM, other process improvements need to becontinuously pursued. As can be readily seen in Table 12-1, while the metric!do provide considerable support for some quality factors, they are notsufficient by themselves to ensure a quality program and product.
77

78

APPENDIX A - OPTIONAL METRICS
79

80

APPENDIX A - OPTIONAL METRICS
A.1 Metric: Manpower
PurDose/Description:
This measure provides an indication of the developer's application ofhuman resources to the developmental program and to maintain sufficientstaffing for completion of the project. It can also provide indications of
• possible problems with meeting schedule and budget. It is used to examine thevarious elements involved in staffing a software project. These elementsinclude the planned level of effort, the actual level of effort, and thelosses in the software staff measured per labor category. Planned manpower
• profiles are derived from the appropriate planning documents submitted to thegovernment. These are usually provided in the developer's proposal or theSoftware Development Plan. The planned level of effort is the number of laborhours that are scheduled to be worked on a CSCI each month. The plannedlevels are compared with the actual over a given time period to give thegovernment insight into the deviations between them. These deviations can bemonitored to ensure that the developer is meeting the necessary staffingcriteria.
Life Cycle Aoplication:
Track for entire length of development (including PDSS).
81

Al orl thm/Granh ical Di spl ay:
M-anpow-erLabor Hours of Effort (10000)
1400_ Plamned
1200 m" Atual
1000. ...... ......
800o .... ...
600-
400"
000 2 4 6 8 10 12 14
Program Month
Figure A.1-1
Data Reaulrements:
Notes:1. Special skills personnel are those individuals who possess specialized
software-related abilities defined as crucial to the success of the particularsystem. For example, Ada programmers or artificial intelligence experts mightbe considered special skills personnel for one project, but not necessarilyfor another prcJect.
2. Experienced personnel are defined as those individuals with a minimum ofthree years experience in software development for similar applications.
3. Total personnel are the sum of experienced and inexperienced personnel.Special skills personnel are counted within the broad categories of experi-enced and inexperienced, but are also tracked separately.
4. Other categories can certainly be created for aspects of a program whichare deemed worthy of special attention. For many projects, software qualityassurance people might be tracked as a separate category.
82

for each personnel type (total, experienced, special)labor hours expended each monthnumber people lostnumber people gainedlabor hours planned each of month
Freouencv of ReDortina:
monthly
Use/Internretation:
"* The software staff includes, as a minimum, those engineering and* management personnel directly involved with software system planning, require-
ments definition, design, coding, integration, test, documentation, configura-tion management, and quality assurance. Losses and gains for each categoryspecified above should be tracked monthly to indicate potential problem areas.Personnel who have been replaced are still counted as a loss. High turnover ofexperienced personnel can adversely affect project success. Also, for example,adding many personnel (beyond those numbers planned) late in the developmentprocess may provide an indication of impending problems. Turnover of keypeople must also be watched closely.
Significant deviations from planned levels can be used as an indicatorof potential problems with staffing the various software development activi-ties. Deviations between actual levels and planned can be detected, explainedand corrected before they negatively impact the development schedule. Thelosses in the staff can be monitored to detect a growing trend or significantloss of experienced staff. This indicator assists the government in determin-ing if the developer has scheduled a sufficient number of employees to producethe product in the time allotted.
The shape of the staff profile trend curve tends to start at a moderatelevel at the beginning of the contract, grow through design, peak at cod-ing/testing and diminish near the completion of integration testing. Individu-al labor categories, however, are likely to peak at different points in thelife cycle. The optimum result would show little deviation between theplanned and actual levels for each category with losses kept to a minimum.Specific attention should be paid to any case where there is a significantdeviation (+/- 10%) between actual and planned. In the case where actual ismore than planned, this may suggest that the developer:
"- underestimated the work involved"- found out that the task was more complicated than expected- did not perform the work efficiently- is ahead of schedule- is behind schedule and is adding manpower to catch up- is adding people to make up for a lack of experienced ones
83

If the actual levels are less than planned, this may suggest that thedeveloper:
- overestimated the work involved- did not perform the task completely- the effort was not as complex as expected- performed the work efficiently- did not assign adequate manpower to the task- misinterpreted the task or requirements- is ahead of schedule
In cases of large deviation the developer should be required to determinethe cause and report any corrective actions necessary.
The manpower metrics are used primarily for project management and do notnecessarily have a direct relationship with other technical and maturitymetrics. For example, manpower levels are usually higher during testingactivities. This does not necessarily reflect an increase in the qualitylevels of the product or suggest that the depth of testing metrics will behigher.
The manpower metrics should be used in conjunction with the developmentprogress and test coverage metrics.
The value of this metric is somewhat tied to the accuracy of thedevelopment and staffing plan, as well as to the accuracy of the laborreporting system.
Rules of Thumb:
A high ratio of total to experienced personnel is undesirable. A ratioof 3:1 is typical.
Significant deviations from the planned staffing profile, as well as ahigh turnover rate in any category, should be investigated so as to minimizerisk to the government.
When the developer has expended 80% of their planned or budgeted resourc-es, it shall be identified and highlighted to the government and be documentedin the monthly reports. Closer attention should then be paid to the remainingresources.
References:
"Software Reporting Metrics', The Mitre Corporation, ESO-TR-85-145, MTR9650 Revision 2, November 1985.
"Software Management Indicators, Air Force Systems Coumand, AFSCP 800-43, January 31, 1986.
"Software Management Indicators, Management Insight',AMC-P 70-13, 31January 1987.
"Revised Implementation Guidelines for Software Management and QualityIndicators for Advanced Field Artillery Tactical Data System", 30 Jul 89.
84

A.2 Metric: Development Progress
Puroose/Descri Dt ion:
The development progress metrics provide Indications of the degree ofcompleteness of the software development effort, and hence can be used tojudge readiness to proceed to the next stage of software development.
Life Cycle AoDlication:
Begin collecting -t PDR and continue for the entire software developmentphase.
* Algorithm/Graphical DisDlav:
(Note: the following calculations can be performed at either the CSC, CSCI, orsystem level.)
Compute percent of CSUs 100% designed.Compute percent of CSUs 100% coded and successfully unit
tested.Compute percent of CSUs 100% integrated.
DEVELOPMENT PROGRESS% CSUO
100
Plannd X-, Aetuel
80 *'.•
so D•-ed.*
40" Iiters
20- .. , • .*
1 2 3 4 6 a 7 a 0 10 11 12Program Month
Figure A.2-1
85

Additionally, by use of the requirements traceability matrix, one canplot functionality (which has been developed and verified) versus time as ameasure of development progress.
Data Reouirements:
CSCI/CSC/CSU development, test and integration schedulesnumber of CSUs per CSCInumber of CSUs 100% designed and reviewed by governmentnumber of CSUs 100% coded and successfully unit testednumber of CSUs 100% integrated into a CSC or CSCI
NOTE: NSuccessfully" tested is defined as completing all test cases (requiredtest coverage or depth) with no defects. *Integrated* is defined as beingactually and logically connected (in a static sense) with all requiredmodules. (Dynamic tasking is not considered here).
Freguency of Reporting:
monthly
Use/Interpretation:
The design, coding, unit testing, and integration of CSUs shouldprogress at a reasonable rate. Plotting the progress in these three catego-ries versus what was originally planned can give indications of potentialproblems with schedule and cost. In certain instances, consideration must begiven to a possible re-baselining of the software (e.g., in an evolutionaryapproach) or if one simply must add modules due to changes in the require-ments.
The development progress metrics should be used with the test coveragemetrics (breadth and depth of testing) to assess the readiness to proceed to aformal government test. They should also be used with the requirementstraceability metrics so that progress can be tracked in consonance with thetracing of requirements. Additionally, it can be used with the schedulemetric to help evaluate schedule risk.
The development progress metrics should be used with the manpowermetrics to identify areas where the developer is experiencing problems. Also,using these metrics with the computer resource utilization metrics can ensurethat the actual utilization is representative of a complete system. Finally,special attention should be given to the development progress of high complex-ity CSUs.
These metrics pass no judgement on the achievability of the contractor'sdevelopment plan.
Rules of Thumb
One hundred percent (100%) of all CSUs should be designed prior to
proceeding beyond CDR for the appropriate CSCI.
86

One hundred percent (100%) of all CSUs should be coded, successfullytested, and integrated before proceeding to a formal system level governmenttest.
References:
"Software Reporting Metrics', The Mitre Corporation, ESD-TR-85-145, MTR9650 Revision 2, November 1985.
"Software Management Indicators', Air Force Systems Command, AFSCP 800-43, January 31, 1986.
I
87

88

Acronym Definition
ACAT Acquisition CategoryACWP Actual Cost of Work PerformedAFOTEC Air Force Operational Test and Evaluation CenterAIS Automated Information SystemAMC Army Materiel CommandAMCCOM Armament, Munitions, and Chemical CommandAMSAA Army Materiel Systems Analysis ActivityASAP Army Streamlined Acquisition ProgramASARC Army Systems Acquisition Review CouncilATCCS Army Tactical Command and Control SystemBCWP Budgeted Cost of Work PerformedBCWS Budgeted Cost of Work Scheduled
CASE Computer Aided Software EngineeringCDR Critical Design ReviewCECOM Communications and Electronics CommandCFSR Contract Funds Status ReportCPU Central Processing UnitCRU Computer Resource UtilizationCRWG Computer Resource Working GroupCSC Computer Software ComponentC/SCSC Cost/Schedule Control System CriteriaCSCI Computer Software Configuration ItemC/SSR Cost/Schedule Status ReportCSU Computer Software UnitCWBS Contract Work Breakdown Structure
DA Department of the ArmyDAB Defense Acquisition BoardDID Data Item DescriptionDOD Department of DefePseDP Design Progress
EAC Estimated Cost At CompletionECP-S Engineering Change Proposal - Software
FCA Functional Configuration AuditFQT Formal Qualification Test
HDBK HandbookHW Hardware
"I/O Input / OutputIOTE Independent Operational Test and EvaluationIPR In Process ReviewIRS Interface Requirements SpecificationISEC Information Systems Engineering CommandISSC Information Systems Support Command
89

Acronym Definition
LAN Local Area NetworkLCSSC Life Cycle Software Support CenterLOC Line of Code
MAISRC Major Automated Information Systems Review CouncilMCCR Mission Critical Computer ResourcesMR Management ReserveMS MilestoneMSCR Materiel Systems Computer ResourcesMTB SW MF Mean Time Between Software Mission FailureMTB HW/SW MF Mean Time Between Hardware/Software Mission F. oureMTBF Mean Time Between FailureMTBOMF Mean Time Between Operational Mission Failure
OMS/MP Operational Mode Summary / Mission ProfileOPTEC Operation Test and Evaluation CommandORD Operational Requirements DocumentOT Operational Test
PCA Physical Configuration AuditPDL Program Design LanguagePDR Preliminary Design ReviewPDSS Post Deployment Software SupportPEO Program Executive OfficerPM Program ManagerPPQT Pre-Production Qualification Test
RADC Rome Air Development CenterRAM Random Access MemoryREQTS RequirementsRFP Request For Proposal
SDD Software Design DocumentSDP Software Development PlanSDR System Design ReviewSEI Software Engineering InstituteSOW Scope Of WorkSPS Software Product SpecificationSRR System Requirements ReviewSRS Software Requirements SpecificationSRTM Software Requirements Traceability MatrixSS System SpecificationSSR Software Specification ReviewSSS System / Segment SpecificationSTEP Software Test and Evaluation PanelSTD Software Test DescriptionSTP Software Test PlanSTR Software Trouble ReportSW or S/W Software
90

Ws onyllm
TECOM Test and Evaluation CommandTIWG Test Integration Working GroupTQN Total Quality ManagementTT Technical Test
UFD Users' Functional Description
VOD Version Description Document"VS VersusWBS Work Breakdown Structure
91

DISTRIBUTION LIST
No. of Copies Organization
I CommanderU.S. Army Materiel CommandATTN: AMCCE-QE5001 Eisenhower AvenueAlexandria, VA 22302
2 CommanderU.S. Army Operational Evaluation CommandATTN: CSTE-ZT, CSTE-ESE-SPark Center IV4501 Ford AvenueAlexandria, VA 22302-1458
Office of'the Deputy Under Secretary of theArmy for Operations Research
ATTN: SAUS-ORThe PentagonWashington, DC 20310-0102
2 Software Engineering InstituteCarnegie Mellon UniversityATTN: Anita Carleton, Robert ParkPittsburgh, PA 15213
DirectorU.S. Army Test and Evaluation Management AgencyATTN: DACS-TE (Dr. Foulkes)The PentagonWashington, DC 20310-0102
Director of Information Systems for Command, Control,Communications, and Computers
Headquarters, Department of the ArmyATTN: SAIS-ADWThe PentagonWashington, DC 20310-0107
9
93

DISTRIBUTION LIST
No. of Copies Organization
Aberdeen Proving Ground
2 CommanderU.S. Army Test and Evaluation CommandATTN: ANSTE-TA, AMSTE-IS-PAberdeen Proving Ground, HO 21005
45 DirectorU.S. Army Materiel Systems Analysis ActivityATTN: AMXSY-A (5 cys)
AMXSY-G (5 cys)AMXSY-C (7 cys)AMXSY-CA (12 cys)ANXSY-R (6 cys)ANXSY-RE (2 cys)ANXSY-L (6 cys)AMXSY-DA (2 cys)
Aberdeen Proving Ground, NO 21005-5071
94
A=llY-CA
Subject : AMSAA Technical Report Number TR-532, "Army Software Testand Evaluation Panel (STEP) Software Metrics InitiativesReport"
* Principal Findings : The primary finding is a set of twelve softwaremetrics for use in measuring and evaluating the stateof software in Army development programs. The setincludes metrics covering quality, requirements, andmanagement. Each metric is described in terms of apurpose / description, algorithm, data requirements,frequency of reporting, use / interpretation, andrules of thumb. Recommendations are also madeconcerning use of the metrics in various phases of thesoftware and system life cycle.
Main Assumptions : More discipline is needed in managing Armysoftware development. These metrics provide insightinto the process and product in such a way thatprogress is demonstrated before proceeding to the nextphase of development or testing.
Principal Limitations : The twelve metrics have not been formallyvalidated, although each metric has been usedsuccessfully by some segments of the military softwaredevelopment community. Further, the set of metricsrepresents a logical starting point for the Armymetrics program.
Slope of the Effort : The study involved a group of Army softwareexperts, including developers, testers, andevaluators. The effort spanned about two years frominitial meetings to creation of the final report.
Objective : The objective was to develop a minimum set of softwaremetrics, spanning process and product measures, formandatory use on all Army software development programs.
V
B Dasic Approach : Government, industry, and academic experts wereconsulted. Also, a literature review was conducted for
* software metrics research and applications. Finally,sample Army development programs were reviewed formetrics usage.
Reason f^r Performing the Study or Analysis s The reason for thestudy was to support the Army Software Test andEvaluation Panel (STEP) attempt to bring morediscipline to Army software development efforts.

Impact of the Study : The recommended set of twelve software metricshas been incorporated into DA Pamphlet 73-1, Part 7,"Software Test and Evaluation Guidelines."
Sponsor : The Deputy Under Secretary of The Army for Operations
Research (DUSA-OR).
Principal Investigators : Patrick J. O'Neill and Henry P. Betz
Nane/Address/Phone Number Where Comments & Questions Can Be SentU.S. Army Materiel Systems Analysis ActivityATTN: AMXSY-CA (Mr. O'Neill)Aberdeen Proving Ground, MD 21005-5071(410) 278-6429
Defense Technical Information Center (DTIC) Accession Number of FinalReport :
Other Than Sponsor, Who Could Benefit From This Study/Information :Anyone interested in bring more discipline to thesoftware development, test, and evaluation process.