
VGW HOLDINGS LIMITED AND CONTROLLED ENTITIES | ABN 36 … · Kenneth Alexander – Non-executive...
38
VGW HOLDINGS LIMITED AND CONTROLLED ENTITIES | ABN 36 147 193 511 VGW ANNUAL REPORT 2019
Transcript of VGW HOLDINGS LIMITED AND CONTROLLED ENTITIES | ABN 36 … · Kenneth Alexander – Non-executive...

V G W H O L D I N G S L I M IT E D A N D C O NT R O L L E D E NT IT I E S | A B N 3 6 1 4 7 1 9 3 5 1 1
VGWANNUAL REPORT2019

V G W H O L D I N G S L I M IT E D A N D C O NT R O L L E D E NT IT I E S 1
Corporate Directory ...................................................................................................................................................................................2
Directors’ Report ........................................................................................................................................................................................3
Auditors Independence Declaration ...................................................................................................................................................10
Financial reportConsolidated Statement of profit and loss and other comprehensive income ....................................................................11Consolidated Statement of financial position ..............................................................................................................................12Consolidated Statement of changes in equity .............................................................................................................................13Consolidated Statement of cash flows .........................................................................................................................................14Notes to the consolidated financial statements ..........................................................................................................................15Directors’ declaration ........................................................................................................................................................................35
Independent Auditor’s Report ...............................................................................................................................................................36
C O NT E NT S

V G W H O L D I N G S L I M IT E D A N D C O NT R O L L E D E NT IT I E S 2
DirectorsLaurence Escalante – Executive Chairman & Chief Executive OfficerMats Johnson – Executive Director & Chief Marketing OfficerLorenzo Escalante – Non-executive DirectorPaul Manalac – Alternate Director to Lorenzo Escalante, appointed on 28 August 2019, ceased to hold office on 5 September 2019Kenneth Alexander – Non-executive Director, resigned on 31 July 2018Mark Potts – Non-executive Director, resigned on 19 March 2019Nigel Blythe-Tinker – Executive Chairman, ceased to hold office on 5 August 2019
Company secretariesRointon NugaraMichael Thunder
Registered office & principal place of business
Level 11Australia Place15 - 17 William StreetPerth, WA 6000Telephone: +61 2 8599 2507
Share registry
Advanced Share Registry Services110 Stirling Hwy, Nedlands WA 6009
Auditor
Grant Thornton Audit Pty LtdLevel 17, 383 Kent Street, Sydney, NSW 2000
Website
https://vgw.co
C O R P O R AT E D I R E CT O RY

V G W H O L D I N G S L I M IT E D A N D C O NT R O L L E D E NT IT I E S 3
The Directors of VGW Holdings Limited present their report together with the financial statements of the consolidated entity, (referred to hereafter as the “consolidated entity” or “Group”) for the year ended 30 June 2019.
Principal activities
During the year, the principal activities of the entities within the Group were development and distribution of social casino games offering virtual currency gaming and sweepstakes cash prize contests. There have been no significant changes in the nature of these activities during the year.
The majority of the Group’s customers are based in North America.
Review of operations and financial results
Revenue from operations totalled $349.5 million, down 8% as VGW focused on margin growth and strengthening operating profit. Marketing spend was $51.3 million (2018: $68.9m), and while down on prior year, was effective and targeted.
Sweepstakes prizes of $182.2 million (2018: $238.7m) decreased 24%.
Operating expenditure increased to support growth, as well as costs of compliance. Continued growth in headcount across the Group underpinned the significant increase in Employee costs. Other key areas of growth included legal and professional fees, technology and property and occupancy costs.
The consolidated profit after tax of the Group amounted to $26.1 million (2018: $5.0m).
As of 30 June 2019, the Group is in a net asset surplus position of $11.7 million (2018: deficit of $8.9 million).
The Group generated a net operating cash inflow of $33.7 million. A net investing outflow of $4.3 million reflected the on-going development of new products and infrastructure to expand the Group’s product offering. A net financing cash outflow of $8.2 million included the payment of two unfranked dividends during the year, totalling $8.4 million.
The Directors believe the Group remains in a strong position to finance the expected expansion of its operations. Revenue and margin growth, together with a measured growth in operating costs, are in line with the Group’s strategic goals and deliverables.
D I R E CT O R S’ R E P O RT
V G W H O L D I N G S L I M IT E D A N D C O NT R O L L E D E NT IT I E S 4
Significant Changes in State of Affairs
During the year, the following changes occurred within the Group:
• On 21 January 2019, the Group launched a third product vertical called Luckyland, based on the historical acquisition of Openwager.
• In March 2019, the software development operation that had been established in the Republic of Korea was closed down and the function relocated to Perth.
Events after the Reporting Period
On 29 August 2019, the Company resolved to provide a short term loan facility to the Managing Director at better than arm’s length commercial terms in accordance with the Corporations Act. The facility involves a loan of up to $2.0 million at an interest rate of 14% per annum. The loan is to be repaid in full on or before 30 December 2019. Security of the loan consists of the Managing Director’s assets, excluding equity holdings in the Company.
Likely Future Developments
The Group’s strategic focus is to further expand its product offerings in its key North American market, as well as to new geographic locations.
Environmental Legislation
The Group’s operations are not regulated by any significant environmental regulation under a law of the Commonwealth or of a State or Territory in Australia.
D I R E CT O R S’ R E P O RT

V G W H O L D I N G S L I M IT E D A N D C O NT R O L L E D E NT IT I E S 5
Experience, special responsibilities and other directorships
• Laurence is the Founder of VGW and has been the Managing Director since the Company’s
founding in 2010.• Laurence has 14 years’ experience as an executive, founder and investor in the game indu-
stry, founding VGW Holdings Limited, Anino Mobile and White Knight Games.• He studied Economics and Actuarial Studies at Macquarie University in Sydney and has 10
years financial planning experience as a technical and investment specialist, working as an advisor with AMP, ANZ and boutique financial advisory firms.
• Director from 4 November 2010.
• Mats is a senior technology and online gaming executive with significant experience in esta-blishing and growing both public and private online business globally.
• He has previously held roles as a Director at Coral Eurobet, General Manager at Centrebet and CEO at Playsafe.
• He has led large teams and formulated global expansion strategies and operational plans delivering significant and profitable growth in both new and established markets.
• Mats has 18 years of digital and gaming sector expertise, alongside comprehensive M&A experience, having been actively involved in several successful exits of online gaming com-panies, including the £2.18Bn sale of Coral Eurobet to Gala Group.
• Director from 1 November 2015.
• Lorenzo is an IT Business Intelligence specialist, with over 30 years’ experience in the corpo-rate IT sector.
• He has specialised in business intelligence tools in BusinessObjects and Tableau, having worked with BHP, AAPT, ING Australia, ANZ Wealth and LandCorp in their BI systems both in Sydney and in Perth.
• He is a member of the Australian Institute of Company Directors.• Director from 5 August 2014.
• Paul was the Alternate Director to Lorenzo Escalante, appointed on 28 August 2019 (to 5 September 2019).
• Kenneth has extensive experience in the online real money gam-ing sector having served as Chief Executive of GVC Holdings PLC, a FTSE 100 and London Stock Exchange listed entity, since March 2007
• He holds a bachelor’s degree in accountancy from Glasgow Uni-versity and is a Chartered Accountant with the Institute Chartered Accountants of Scotland.
• Director from 18 January 2017 to 31 July 2018.
Directors
The directors of the Company at any time during or since the end of the financial year are:
Name, qualifications & independence status
Laurence ESCALANTEExecutive Chairman & Executive Director
Mats JOHNSONExecutive Director
Lorenzo ESCALANTENon-executive Director
Paul MANALACAlternate Director to Lorenzo Escalante
Kenneth ALEXANDERNon-executive Director
D I R E CT O R S’ R E P O RT

V G W H O L D I N G S L I M IT E D A N D C O NT R O L L E D E NT IT I E S 6
DIRECTORS (Continued)
Name, qualifications & independence status
Mark POTTSNon-executive Director VGW Holdings Limited
Nigel BLYTHE-TINKERExecutive Chairman
Company SecretaryMr Rointon Nugara Mr Michael Thunder
Meetings of Directors Full Board Attended Held Nigel Blythe-Tinker 9 9Laurence Escalante 9 9Mats Johnson 9 9Lorenzo Escalante 9 9Mark Potts 7 7Kenneth Alexander – 1
Held represents the number of meetings held during the time the director held office or was a member of the relevant committee.
DividendsAn unfranked half-cent dividend per ordinary share was paid on 30 November 2018. A further unfranked one cent dividend per ordinary share was paid on 18 April 2019. The total amount distributed was $8.4 million (2018: NIL).
Experience, special responsibilities and other directorships
• Mark is an experienced and leading global technology executive with more than 30 years’ expe-rience in large corporations and start-ups.
• Most recently Mark was the world-wide CTO and VP for Corporate Strategy at Hewlett-Packard Enterprise in the US.
• Mark currently holds numerous board positions including Resolute Mining, Decimal Software Ltd and iCetana.
• Director from 19 July 2017 to 19 March 2019.
• Nigel holds a Bachelor of Laws degree (LL.B) and is a Fellow of the Institute of Chartered Secre-taries and Administrators (FCIS) of the United Kingdom. He is also a member of the Governance Institute of Australia.
• He has extensive UK and international corporate experience over thirty years covering M&A, corporate finance, restructuring, AIM and FTSE 100 flotations, and corporate governance.
• Nigel has held senior executive/legal and board positions within companies in the financial ser-vices, insurance, industrial and lei-sure and gaming sectors in mainly public listed companies. He was Group Company Secretary & Head of Legal at William Hill PLC. He was also Non-exe-cutive Chairman of Gaming VC Plc, a FTSE 100 listed company.
• Prior to joining VGW, Nigel held the role of Chairman of Pentasia Limited, an i-Gaming recruit-ment business.
• Director from 15 August 2015 to 5 August 2019
D I R E CT O R S’ R E P O RT

V G W H O L D I N G S L I M IT E D A N D C O NT R O L L E D E NT IT I E S 7
Unissued shares under option
Unissued ordinary shares of VGW Holdings Limited at the date of this report are:
Options issued under Grant Date Number of Options Expiry Date Exercise PriceLTIP Tranche 1 (a) 1 Jan 2017 333,333 1 Jan 2022 0.20LTIP Tranche 1 (b) 31 Jan 2017 11,595,170 31 Jan 2020 0.20LTIP Tranche 1 (c) 31 Jan 2017 29,456,088 31 Jan 2020 0.20LTIP Tranche 1 (d) 3 Apr 2017 166,666 3 Apr 2020 0.20LTIP Tranche 2 (a) 27 Nov 2017 9,135,488 31 Jan 2020 0.20LTIP Tranche 2 (b) 27 Nov 2017 333,333 1 Jan 2022 0.20LTIP Tranche 2 (c) 27 Nov 2017 533,333 11 Apr 2021 0.20LTIP Tranche 3 (a) 27 Nov 2017 5,307,548 31 Jan 2020 0.20STI for Executives 29 Jan 2018 1,082,500 31 Jan 2021 0.20LTIP FY2019 1 Jul 2018 2,250,000 1 Jul 2021 0.20TOTAL 60,193,461
The above options were issued in accordance with below:
1. Long-term Incentive Plan (LTIP) and Short-term Incentive Plan (STI)
In January 2017, VGW established a Long-Term Incentive Plan (LTIP) which is part of VGW’s reward strategy in support of the achievement of the Company’s business strategy. On 1 July 2018, the Company issued a further tranche of options under the terms of the LTIP.
D I R E CT O R S’ R E P O RT

V G W H O L D I N G S L I M IT E D A N D C O NT R O L L E D E NT IT I E S 8
Shares issued during or since the end of the year as a result of exercise
During or since the end of the financial year, VGW Holdings Limited issued ordinary shares as a result of the exercise of options as follows:
Date options granted Issue price of shares Number of shares issued30 December 2016 $0.20 830,76131 January 2017 $0.20 1,504,602TOTAL 2,335,363
Insurance of officers
During the year, the Company paid a premium to insure officers of the Group. The officers of the Group covered by the insurance policy include all Directors.
The liabilities insured are legal costs that may be incurred in defending civil or criminal proceedings that may be brought against the officers in their capacity as officers of the Group, and any other payments arising from liabilities incurred by the officers in connection with such proceedings, other than where such liabilities arise out of conduct involving a wilful breach of duty by the officers or the improper use by the officers of their position or of information to gain advantage for themselves or someone else to cause detriment to the Group.
Details of the amount of the premium paid in respect of insurance policies are not disclosed as such disclosure is prohibited under the terms of the contract.
The Group has not otherwise, during or since the end of the financial year, except to the extent permitted by law, indemnified or agreed to indemnify any current or former officer of the Group against a liability incurred as such by an officer.
Indemnity of auditors
The Group has agreed to indemnify its auditors, Grant Thornton, to the extent permitted by law, against any claim by a third party arising from the Group’s breach of its agreement. The indemnity requires the Group to meet the full amount of any such liabilities including a reasonable amount of legal costs.
Auditor’s Independence Declaration
The lead auditor’s independence declaration for the year ended 30 June 2019 has been received and can be found on page 10 of the financial report.
D I R E CT O R S’ R E P O RT

V G W H O L D I N G S L I M IT E D A N D C O NT R O L L E D E NT IT I E S 9
Proceedings on behalf of the Company
No person has applied to the Court under section 237 of the Corporations Act 2001 for leave to bring proceedings on behalf of the Company, or to intervene in any proceedings to which the Company is a party, for the purpose of taking responsibility on behalf of the Company for all or part of those proceedings.
Rounding of Amounts
The Company is a type of Company referred to in ASIC Corporations (Rounding in Financial/Directors’ Reports) Instrument 2016/191 and therefore the amounts contained in this report and in the financial report have been rounded to the nearest $1,000, or in certain cases, to the nearest dollar.
Signed in accordance with a resolution of the Directors:
Laurence ESCALANTEDirector 28 October 2019
D I R E CT O R S’ R E P O RT
1 0
Grant Thornton Audit Pty Ltd ACN 130 913 594a subsidiary or related entity of Grant Thornton Australia Ltd ABN 41 127 556 389
‘Grant Thornton’ refers to the brand under which the Grant Thornton member firms provide assurance, tax and advisory services to their clients and/or refers to one or more member firms, as the context requires. Grant Thornton Australia Ltd is a member firm of Grant Thornton InternationalLtd (GTIL). GTIL and the member firms are not a worldwide partnership. GTIL and each member firm is a separate legal entity. Services are delivered by the member firms. GTIL does not provide services to clients. GTIL and its member firms are not agents of, and do not obligate one another and are not liable for one another’s acts or omissions. In the Australian context only, the use of the term ‘Grant Thornton’ may refer to Grant Thornton Australia Limited ABN 41 127 556 389 and its Australian subsidiaries and related entities. GTIL is not an Australian related entity to Grant Thornton Australia Limited.
Liability limited by a scheme approved under Professional Standards Legislation.
www.grantthornton.com.au
10
Level 17, 383 Kent StreetSydney NSW 2000
Correspondence to:Locked Bag Q800QVB Post OfficeSydney NSW 1230
T +61 2 8297 2400F +61 2 9299 4445E [email protected] www.grantthornton.com.au
Auditor’s Independence Declaration To the Directors of VGW Holdings Limited
In accordance with the requirements of section 307C of the Corporations Act 2001, as lead auditor for the audit of VGW Holdings Limited for the year ended 30 June 2019, I declare that, to the best of my knowledge and belief, there have been:
a no contraventions of the auditor independence requirements of the Corporations Act 2001 in relation to the audit; and
b no contraventions of any applicable code of professional conduct in relation to the audit.
Grant Thornton Audit Pty LtdChartered Accountants
R J Isbell Partner – Audit & Assurance
Sydney, 28 October 2019

V G W H O L D I N G S L I M IT E D A N D C O NT R O L L E D E NT IT I E S 1 1
Consolidated entity 2019 2018From continuing operations Note $’000 $’000 Revenue 4 349,456 379,582 Sweepstakes prizes (182,155) (238,679)Merchant fees (19,702) (17,882)Revenue share (262) (939)Finance income 5 195 182Finance costs 5 (110) (431)Finance costs – interest expense on lease liability (624) (112)Other financial items 5 (2,261) (3,008)Other income 5 1,296 7Marketing and advertising fees 5 (51,285) (68,887)Legal and professional fees (13,856) (9,237)Employee benefits expense 7 (35,621) (17,551)Share-based payments expense (299) (1,091)Depreciation and amortisation expense (5,613) (2,198)Technology and other communication expense (8,263) (3,554)Property and occupancy expense (2,347) (1,283)General and administration expense (5,753) (2,290) (326,660) (366,953) Income before income tax 22,796 12,629
Income tax benefit / (expense) 6 3,274 (7,622)
Income for the year attributable to members of the Group 26,070 5,007 Other comprehensive income, net of income tax 908 105 Total comprehensive income for the year attributable to the owners of VGW Holdings Limited 26,978 5,112
Earnings per share Cents CentsFrom continuing operations: • Basic earnings per share 22 4.66 0.90• Diluted earnings per share 22 4.55 0.90 This Consolidated Statement of Profit or Loss and Other Comprehensive Income is to be read in conjunction with the accom-panying notes to the financial statements.
C O N S O L I D AT E D S TAT E M E NT O F P R O F IT O R LO S S A N D O T H E R C O M P R E H E N S I V E I N C O M EF O R T H E Y E A R E N D E D 3 0 J U N E 2 0 1 9

V G W H O L D I N G S L I M IT E D A N D C O NT R O L L E D E NT IT I E S 1 2
Consolidated entity 2019 2018 Note $’000 $’000
Assets Current assets Cash and cash equivalents 8 39,211 18,051 Trade and other receivables 9 2,819 1,990 Prepayments and other short-term assets 10 5,631 25,419Total current assets 47,661 45,460Non-current assets Property, plant and equipment 12 3,143 925 Right-of-use assets 13 6,185 5,614 Intangible assets 14 9,420 10,970 Deferred tax assets 6 3,374 189Total non-current assets 22,122 17,698
Total assets 69,783 63,158 Liabilities Current liabilities Trade and other payables 15 11,598 12,089 Contract Liability 16 26,697 37,561 Provisions 17 10,447 9,208 Current tax liabilities 2,234 7,812 Lease liability 13 2,300 416Total current liabilities 53,276 67,086 Non-current liabilities Lease liability 13 4,536 4,927 Provisions 17 265 -Total non-current liabilities 4,801 4,927 Total liabilities 58,077 72,013 NET ASSETS 11,706 (8,855) Equity Share capital 19 24,191 22,244 Convertible notes 19 - 250 Reserves 5,329 4,120 Accumulated losses (17,814) (35,469)TOTAL EQUITY 11,706 (8,855)
This Consolidated Statement of Financial Position is to be read in conjunction with the accompanying notes to the financial statements.
C O N S O L I D AT E D S TAT E M E NT O F F I N A N C I A L P O S IT I O N A S O F 3 0 J U N E 2 0 1 9

V G W H O L D I N G S L I M IT E D A N D C O NT R O L L E D E NT IT I E S 1 3
Share Foreign Share Convertible Option Currency Accumulated Total Capital Notes Reserve Reserve Losses EquityConsolidated entity $’000 $’000 $’000 $’000 $’000 $’000
Balance at 1 July 2017 (restated) 19,314 250 4,152 - (41,400) (17,684)Issue of share capital 1,730 - (304) - - 1,426Reclassification of options which have lapsed - - (924) - 924 -Employees’ long-term incentive plan share options - - 1,091 - - 1,091 Settlement of loan funded shares 1,200 - - - - 1,200Other comprehensive income - - - 105 - 105Profit for the year - - - - 5,007 5,007Balance as at 30 June 2018 22,244 250 4,015 105 (35,469) (8,855)
Balance at 1 July 2018 22,244 250 4,015 105 (35,469) (8,855)Issue of share capital 467 - - - - 467Reclassification of options which have lapsed - - (107) - - (107)Employees’ long-term incentive plan share options - - 408 - - 408Dividend payment - - - - (8,415) (8,415)Convertible note conversion 250 (250) - - - -Settlement of loan funded shares 1,230 - - - - 1,230Other comprehensive income - - - 908 - 908Profit for the year - - - - 26,070 26,070Balance as at 30 June 2019 24,191 - 4,316 1,013 (17,814) 11,706
The Consolidated Statement of Changes in Equity is to be read in conjunction with the accompanying notes to the financial statements.
CONSOLIDATED STATEMENT OF CH ANGES IN EQUIT Y FOR THE YEAR ENDED 30 JUNE 2019

V G W H O L D I N G S L I M IT E D A N D C O NT R O L L E D E NT IT I E S 1 4
Consolidated entity Note 2019 2018Cash flows from operating activities $’000 $’000Receipts from customers 340,143 396,780Payment to suppliers and employees (303,047) (380,504)Income tax paid (3,689) -Interest received 5 195 182Government grants received 5 73 7Net cash from operating activities 24 33,675 16,465 Cash flows from investing activities Payments for property, plant and equipment (3,017) (825)Payment for intangibles and development expenditure (1,284) (7,410)Net cash from investing activities (4,301) (8,235) Cash flows from financing activities Settlement of loan funded shares 1,230 1,200Proceeds from issue of shares 467 1,248Dividend payments (8,415) -Repayment of borrowings and lease liabilities (1,496) (60)Net cash from financing activities (8,214) 2,388 Net increase in cash and cash equivalents 21,160 10,618Cash and cash equivalents at beginning of year 18,051 7,433Cash and cash equivalents at end of year 8 39,211 18,051
The Consolidated Statements of Cash Flows are to be read in conjunction with the notes to the financial statements.
C O N S O L I D AT E D S TAT E M E NT O F C A S H F LO W S F O R T H E Y E A R E N D E D 3 0 J U N E 2 0 1 9

V G W H O L D I N G S L I M IT E D A N D C O NT R O L L E D E NT IT I E S 1 5
1. GENERAL INFORMATION AND STATEMENT OF COMPLIANCE
The financial report includes the consolidated financial statements and notes of VGW Holdings Limited and controlled entities (“Group”).
The Group has elected to adopt the Australian Accounting Standards – Reduced Disclosure Requirements (established by AASB 1053 Application of Tiers of Australian Accounting Standards and AASB 2010-2 Amendments to Australian Accounting arising from Reduced Disclosure Requirements).
These financial statements are general purpose financial statements that have been prepared in accordance with Australian Accounting Standards – Reduced Disclosure Requirements and the Corporations Act 2001. VGW Holdings Limited is a for-profit entity for the purpose of preparing financial statements.
The consolidated financial statements for the year ended 30 June 2019 were approved and authorised for issue by the Board of Directors on 28 October 2019.
2. NEW AND REVISED STANDARDS
AASB 9 Financial Instruments
The Group adopted AASB9 from 1 July 2018 using the modified retrospective approach. Under this method, the cumulative effect of initial application is recognised as an adjustment to the opening retained earnings at 1 July 2018 and comparatives are not restated. The effect of adoption has not impacted the classification of the Group’s financial assets and recognition of expected credit losses. The impairment for allowance was not changed as a result of adoption.
3. SUMMARY OF ACCOUNTING POLICIES
Overall considerations
The consolidated financial statements have been prepared using the significant accounting policies and measurement ba-ses summarised below.
a. Principles of Consolidation
The consolidated financial statements incorporate all of the assets, liabilities and results of the Parent and its subsidiaries as at 30 June 2019. Subsidiaries are entities the parent controls. The parent controls an entity when it is exposed to, or has right to, variable returns from its involvement with the entity and has the ability to affect those returns through its power over the entity. Details for the subsidiaries are provided in Note 11: Controlled Entities.
The assets, liabilities and results of all subsidiaries are fully consolidated into the financial statements of the Group from the date on which control is obtained by the Group. The consolidation of a subsidiary is discontinued from the date that control ceases. Intercompany transactions, balances, unrealised gains or losses on transactions between the group entities are fully eliminated on consolidation. Accounting policies of subsidiaries have been changed and adjustments made where necessary to ensure uniformity of the accounting policies adopted by the Group. All subsidiaries have a reporting date of 30 June.
b. Income Tax
The income tax expense/(benefit) for the year comprises current and deferred income tax expense/(benefit).
Current income tax expense charged to profit or loss is the tax payable on taxable income. Current tax liabilities/(assets) are therefore measured at the amounts expected to be paid to/(received from) the relevant taxation authority, using tax rates enacted or substantively enacted at the reporting date.
N O T E S T O T H E C O N S O L I D AT E D F I N A N C I A L S TAT E M E NT S A S AT 3 0 J U N E 2 0 1 9

V G W H O L D I N G S L I M IT E D A N D C O NT R O L L E D E NT IT I E S 1 6
3 SUMMARY OF ACCOUNTING POLICIES (Continued)
Deferred income tax expense reflects movements in deferred tax asset and deferred tax liability balances during the year. Current and deferred income tax expense/(benefit) is charged or credited outside profit or loss when the tax relates to items that are recognised outside profit or loss. Except for business combinations, no deferred income tax is recognised from the initial recognition of an asset or liability where there is no effect on accounting or taxable profit or loss.
Deferred tax assets and liabilities are calculated at the tax rates that are expected to apply to the period when the asset is realised or the liability is settled, and their measurement also reflects the manner in which management expects to recover or settle the carrying amount of the realised asset or liability.
Deferred tax assets relating to temporary differences and unused tax losses are recognised only to the extent that it is probable that future taxable profit will be available against which the benefits of the deferred tax asset can be utilised.
VGW Holdings Limited and its wholly-owned Australian-controlled entity have elected to implement tax consolidation legis-lation FY 2020 onward.
c. Property, Plant and Equipment
Plant and equipment are measured on the cost basis and are therefore carried at cost less accumulated depreciation and any accumulated impairment losses. In the event the carrying amount of plant and equipment is greater than its estimated recoverable amount, the carrying amount is written down immediately to its estimated recoverable amount and impairment losses are recognised in profit or loss. A formal assessment of recoverable amount is made when impairment indicators are present (refer to note 3(f) for details of impairment).
The cost of fixed assets includes the expenditure that is directly attributable to the acquisition of the items.
Subsequent costs are included in the asset’s carrying amount or recognised as a separate asset, as appropriate, only when it is probable that future economic benefits associated with the item will flow to the Group and the cost of the item can be measured reliably. All other repairs and maintenance are recognised as expenses in profit or loss during the financial period in which they are incurred.
The depreciable amount of all fixed assets is depreciated on a straight-line basis over the assets useful life to the Group commencing from the time the asset is held ready for use. Depreciation is recognised in profit or loss.
The depreciation rate used for the class of depreciable assets are:• Furniture and Fittings 1 - 5 years• Office and Computer Equipment 3 years• Software 3 years
The assets’ residual values and useful lives are reviewed, and adjusted if appropriate, at the end of each reporting period.
d. Leases
The Group recognises a right-of-use asset and a lease liability at the lease commencement date. The right-of-use asset is initially measured at cost, which comprises the initial amount of the lease liability adjusted for any lease payments made at or before the commencement date, plus any initial direct costs incurred and an estimate of costs to dismantle and remove the underlying asset or to restore the underlying asset or the site on which it is located, less any lease incentives received.
The right-of-use asset is subsequently depreciated using the straight-line method from the commencement date to the earlier of the end of the useful life of the right-of-use assets or the end of the lease term. The estimated useful lives of right-of-use assets are determined on the same basis as those of property and equipment. In addition, the right-of-use asset is periodically reduced by impairment losses, if any, and adjusted for certain remeasurements of the lease liability.
N O T E S T O T H E C O N S O L I D AT E D F I N A N C I A L S TAT E M E NT S A S AT 3 0 J U N E 2 0 1 9

V G W H O L D I N G S L I M IT E D A N D C O NT R O L L E D E NT IT I E S 1 7
3 SUMMARY OF ACCOUNTING POLICIES (Continued)
d. Leases (continued)
The lease liability is initially measured at the present value of the lease payments that are not paid at the commencement date discounted using the effective interest rate implicit in the lease or, if that rate cannot be readily determined, the group’s incremental borrowing rate. The Group uses its incremental borrowing rate as the discount rate.
Lease payments included in the measurement of the lease liability include: (i) fixed payments; (ii) variable lease payments that depend on an index or a rate, amounts; (iii) amounts expected to be payable under a residual value guarantee; and (iv) the exercise price under a purchase option or renewal option that the Group is reasonably certain to exercise, and penalties for early termination of a lease unless the Group is reasonably certain of not terminating early.
The lease liability is measured at the amortised cost using the effective interest method. It is re-measured when there is a change in future lease payments arising from a change in an index or rate, if there is a change in the Group’s estimate of the amount expected to be payable under a residual value guarantee, or if the Group changes its assessment of whether it will exercise a purchase, extension or termination option.
When the lease liability is remeasured in this way, a corresponding adjustment is made to the carrying amount of the right-of-use asset or is recorded in the consolidated profit or loss if the carrying amount of the right-of-use asset has been reduced to zero.
Where the Group is a lessee for short-term leases and leases for which the underlying asset is of low value, payments on these lease agreements are recognised as an expense on a straight-line basis over the lease term. Associated costs, such as maintenance and insurance, are expensed as incurred.
e. Financial Instruments
Recognition and derecognitionFinancial assets and financial liabilities are recognised when the Group becomes a party to the contractual provisions of the financial instrument and are measured initially at fair value adjusted by transactions costs, except for those carried at fair value through profit or loss, which are measured initially at fair value. Subsequent measurement of financial assets and financial liabilities are described below.
Financial assets are derecognised when the contractual rights to the cash flows from the financial asset expire, or when the financial asset and substantially all the risks and rewards are transferred. A financial liability is derecognised when it is extinguished, discharged, cancelled or expires.
Classification and initial measurement of financial assetsExcept for those trade receivables that do not contain a significant financing component and are measured at the transaction price in accordance with AASB 15, all financial assets are initially measured at fair value adjusted for transaction costs (where applicable).
Subsequent measurement of financial assetsFor the purpose of subsequent measurement, financial assets, other than those designated and effective as hedging instru-ments, are classified into the following categories upon initial recognition:
• financial assets at amortised cost• financial assets at fair value through profit or loss (FVPL)• debt instruments at fair value through other comprehensive income (FVOCI)• equity instruments at fair value through other comprehensive income (FVOCI)
Classifications are determined by both:
• The entity’s business model for managing the financial asset• The contractual cash flow characteristics of the financial assets
N O T E S T O T H E C O N S O L I D AT E D F I N A N C I A L S TAT E M E NT S A S AT 3 0 J U N E 2 0 1 9
V G W H O L D I N G S L I M IT E D A N D C O NT R O L L E D E NT IT I E S 1 8
3. SUMMARY OF ACCOUNTING POLICIES (Continued)
All income and expenses relating to financial assets that are recognised in profit or loss are presented within finance costs, finance income or other financial items, except for impairment of trade receivables which is presented within other expenses.
Financial assets at amortised costFinancial assets are measured at amortised cost if the assets meet the following conditions (and are not designated as FVPL):
• they are held within a business model whose objective is to hold the financial assets and collect its contractual cash flows• the contractual terms of the financial assets give rise to cash flows that are solely payments of principal and interest
on the principal amount outstanding
After initial recognition, these are measured at amortised cost using the effective interest method. Discounting is omitted where the effect of discounting is immaterial. The Group’s cash and cash equivalents, trade and most other receivables fall into this category of financial instruments.
Classification and measurement of financial liabilities As the accounting for financial liabilities remains largely unchanged from AASB 139, the Group’s financial liabilities were not impacted by the adoption of AASB 9. The Group’s financial liabilities include borrowings and trade and other payables.
Financial liabilities are initially measured at fair value, and, where applicable, adjusted for the transaction costs. Subsequently, financial liabilities are measured at amortised cost using the effective interest method. All interest-related charges and, if applicable, changes in an instrument’s fair value that are reported in profit or loss are included within finance costs or finance income.
f. Impairment
All impairment losses are recognised in the consolidated statement of profit or loss and other comprehensive income. Any cumulative loss in respect of an available-for-sale financial asset recognised previously in equity is transferred to the state-ment of comprehensive income.
The Company makes use of a simplified approach in accounting for trade receivables as well as contract assets and records the loss allowance at the amount equal to the expected lifetime credit losses. In using this practical expedient, the Company uses its historical experience, external indicators and forward-looking information to calculate the expected credit losses using a provision matrix.
The Company assesses impairment of trade receivables on a collective basis as they possess credit risk characteristics based on days past due. The Company has not experienced credit losses historically and therefore has made no allowance for trade receivables.
g. Intangibles other than Goodwill
Software and website development costsSoftware and website development costs are capitalised only when the company identifies that the project will deliver future economic benefits and these benefits can be measured reliably.
Software development costs have a finite life and are initially recorded at cost and amortised on a systematic basis over five to eight years matched to the future economic benefits over the useful life of the asset.
h. Employee Benefits
Short-term employee benefitsProvision is made for the Group’s obligation for short-term employee benefits. Short-term employee benefits are benefits (other than termination benefits) that are expected to be settled wholly within 12 months after the end of the annual reporting period in which the employees render the related service, including wages, salaries and annual leave. Short-term employee benefits are measured at the (undiscounted) amounts expected to be paid when the obligation is settled.
N O T E S T O T H E C O N S O L I D AT E D F I N A N C I A L S TAT E M E NT S A S AT 3 0 J U N E 2 0 1 9

V G W H O L D I N G S L I M IT E D A N D C O NT R O L L E D E NT IT I E S 1 9
3. SUMMARY OF ACCOUNTING POLICIES (Continued)
The Group’s obligations for short-term employee benefits such as wages, salaries and annual leave are recognised as part of current trade and other payables in the statement of financial position.
Long-term employee benefitsGroup’s obligation in respect of long-term employee benefits is the amount of future benefit that employees have earned in return for their service in the current and prior periods. That benefit is discounted to determine its present value, and recognised in profit or loss In the period in which they arise.
Equity-settled compensationThe Group operates an employee share and option plan. Share-based payments are amortised over the vesting periods. The corresponding amount is recorded in the share-based payment reserve.
i. Provisions, Contingent Liabilities and Contingent Assets
Provisions are recognised when the Group has a legal or constructive obligation, as a result of past events, for which it is probable that an outflow of economic benefits will result, and that outflow can be reliably measured.
Provisions are measured at the estimated expenditure required to settle the present obligation, based on the most reliable evidence available at the reporting date, including the risks and uncertainties associated with the present obligation. Where there are a number of similar obligations, the likelihood that an outflow will be required in settlement is determined by consi-dering the class of obligations as a whole. Provisions are discounted to their present values, where the time value of money is material.
Any reimbursement that the Group can be virtually certain to collect from a third party with respect to the obligation is recognised as a separate asset. However, this asset may not exceed the amount of the related provision.
No liability is recognised if an outflow of economic resources as a result of present obligation is not probable. Such situations are disclosed as contingent liabilities, unless the outflow of resources is remote in which case no liability is recognised.
The Group has adopted a policy of recognising a liability for cashable sweepstakes.
j. Cash and Cash Equivalents
Cash and cash equivalents comprise cash on hand and demand deposits held at call with banks and payment platforms, together with other short term, highly liquid investments that are readily convertible into known amounts of cash and which are subject to an insignificant risk of changes in value.
k. Revenue
Chumba, Global Poker and Luckyland Sweeps Websites RevenueRevenues from player purchases on the Chumba, Global Poker and Luckyland websites are recognised gross of merchant fees. The risks and rewards of the revenue earned lie with the Company and not with payment platform providers. Merchant fees are recognised as an expense in the period they are incurred.
In accordance with AASB 15 Revenue from Contracts with Customers, player purchases of gold coins are recognised over time as revenue based on the player retention period and amortised accordingly.
Chumba Facebook RevenueRevenue from player purchases via Facebook is recognised on a gross basis before taking into account the service fee on revenue charged by Facebook.
l.Interest Income
Interest income is reported on an accrual basis using the effective interest method.
N O T E S T O T H E C O N S O L I D AT E D F I N A N C I A L S TAT E M E NT S A S AT 3 0 J U N E 2 0 1 9

V G W H O L D I N G S L I M IT E D A N D C O NT R O L L E D E NT IT I E S 2 0
3. SUMMARY OF ACCOUNTING POLICIES (Continued)
m. Grants
Grants are recognised as income when the right to receive them has been established.
n. Goods and Services Tax
Revenue, expenses and assets are recognised net of the amount of goods and services tax (GST), except where the amount of GST incurred is not recoverable from the taxation authority.
Receivables and payables are stated with the amount of GST included. The net amount of GST recoverable from, or payable to, the tax authorities is included as a current asset or liability in the statement of financial position.
Cash flows are included in the consolidated statement of cash flows on a gross basis. The GST components of cash flows arising from investing or financing activities which are recoverable from the tax authorities are presented as operating cash flows included in payment to suppliers.
o. Critical Accounting Estimates and Judgements
The preparation of the financial statement requires management to make judgements, estimates and assumptions that affect the reported amounts in the financial statements. Management continually evaluates its judgements and estimates in relation to assets, liabilities, contingent liabilities, revenue and expenses. Management bases its judgements, estimates and assump tions on historical experience and on other various factors, including expectations of future events, management believes to be reasonable under the circumstances. The resulting accounting judgements and estimates may differ to actual results.
(i) Capitalisation of Software Development Costs
Distinguishing the research and development phases of a new customised software project and determining whether the recognition requirements for the capitalisation of development costs are met requires judgement. After capitalisation, management monitors whether the recognition requirements continue to be met and whether there are any indicators that capitalised costs may be impaired.
(ii) Business combinations
Management uses valuation techniques in determining the fair values of the various elements of a business combination. Particularly, the fair value of contingent consideration is dependent on the outcome of many variables that affect future profitability.
(iii) Useful lives of depreciable assets
Management reviews its estimate of the useful lives of depreciable assets at each reporting date, based on the expected utility of the assets. Uncertainties in these estimates relate to technical obsolescence that may change the utility of certain software and IT equipment.
(iv) Provisioning of Cashable Sweeps
Management estimates the provision for cashable sweepstakes, considering the most reliable evidence available at each reporting period.
Based on Global Poker Players’ cash-out historical behaviour observed over a period of time, the Group determined that it is more appropriate to provision 60% of the period end balance of cashable sweeps. The Group will continue to monitor whether there are any indicators that the provision percentage should be revised.
For Chumba Casino and Luckyland, the Group uses the whole amount of the period end balance for the provision.
N O T E S T O T H E C O N S O L I D AT E D F I N A N C I A L S TAT E M E NT S A S AT 3 0 J U N E 2 0 1 9
V G W H O L D I N G S L I M IT E D A N D C O NT R O L L E D E NT IT I E S 2 1
3. SUMMARY OF ACCOUNTING POLICIES (Continued)
(v) Revenue recognition
Revenue is recognised over the retention period of the players, which will be re-evaluated from time to time to consider changes in player behaviour. For the Financial Year 2019, the Group determined a blended player retention period of 2.75 months, and revenue deferred accordingly. Contract Liabilities are treated as current liability.
p. Going Concern
The consolidated financial statements have been prepared on a going concern basis, notwithstanding the negative net working capital position at 30 June 2019. The following matters have been considered by the Directors in determining the appropriateness of the going concern basis of preparation of the financial statements.
• $26.7m relates to Contract Liabilities• Net profit for the period ended 30 June 2019 of $26.1 million; and• The Group generated a net operating cash inflow of $33.7 million for the financial year ended 30 June 2019.
The Directors believe that the Group will be able to continue as a going concern and accordingly, the financial statements have been prepared on a going concern basis.
q. Foreign Currency Transactions and Balances
Functional and presentation currencyThe consolidated financial statements are presented in Australian dollars (AUD), which is also the functional currency of the Group.
Functional currency transactions and balances Foreign currency transactions are translated into functional currency of the respective Group entity, using the exchange rates prevailing at the dates of the transactions (spot exchange rate). Foreign exchange gains and losses resulting from the settle-ment of such transactions and from the re-measurement of monetary items at year end exchange rates are recognised in profit or loss.
Non-monetary items are not re-translated at year-end and are measured at historical cost (translated using the exchange rates at the date of transaction), except for non-monetary items measured at fair value which are translated using the exchange rates at the date when fair value was determined.
Foreign operations In the Group’s financial statements, all assets, liabilities and transactions of Group entities with a functional currency other than the Australian Dollar (AUD) are translated into AUD upon consolidation. The functional currency of VGW Malta Holding Limited and its subsidiaries changed from USD to EUR at the beginning of the period to better reflect the nature of operations of the geographical location of the entities.
The functional currency of the other entities in the Group has remained unchanged during the reporting period.
On consolidation, assets and liabilities have been translated into AUD at the closing rate at the reporting date. Goodwill and fair value adjustments arising on the acquisition of a foreign entity have been treated as assets and liabilities of the foreign entity and translated into AUD at the closing rate. Income and expenses have been translated into AUD at the average rate over the reporting period. Exchange differences are charged and/or credited to other comprehensive income and recognised in the currency translation reserve in equity. On disposal of a foreign operation the cumulative translation differences reco-gnised in equity are reclassified to profit or loss and recognised as part of the gain or loss on disposal.
r. Rounding of Amounts
The Company is a type of Company referred to in ASIC Corporations (Rounding in Financial/Directors’ Reports) Instrument 2016/191 and therefore the amounts contained in this report and in the financial report have been rounded to the nearest $1,000, or in certain cases, to the nearest dollar.
N O T E S T O T H E C O N S O L I D AT E D F I N A N C I A L S TAT E M E NT S A S AT 3 0 J U N E 2 0 1 9

V G W H O L D I N G S L I M IT E D A N D C O NT R O L L E D E NT IT I E S 2 2
4. REVENUE
The Group’s revenue may be analysed as follows for each of the major products: 2019 2018 $’000 $’000Revenue from Continuing Operations
From Chumba website 207,341 204,398From Global Poker website 136,369 172,864From Luckyland 4,879 264From Facebook 867 2,056
Total revenue 349,456 379,582
5. OTHER INCOME (COSTS) AND EXPENSES 2019 2018 $’000 $’000Finance income
Interest income 195 182 195 182
Finance costs Interest expense (624) (112)Bank and other financial intermediary charges (110) (431)
(734) (543)
Other financial items Foreign currency realised (loss)/gains 146 (3,485)Foreign currency unrealised gains/(loss) (2,407) 477
(2,261) (3,008)
Other income Tax refund from dividend income 1,223 -Job Action Plan 73 7
1,296 7 Marketing and advertisements
Marketing Facebook (36,775) (65,729)Marketing Non-Facebook (14,510) (3,158)
(51,285) (68,887)
N O T E S T O T H E C O N S O L I D AT E D F I N A N C I A L S TAT E M E NT S A S AT 3 0 J U N E 2 0 1 9

V G W H O L D I N G S L I M IT E D A N D C O NT R O L L E D E NT IT I E S 2 3
6. INCOME TAX EXPENSE 2019 2018 $’000 $’000 Current tax expense/(benefit) Current year 3,897 7,811Adjustments for current tax of prior periods (3,986) -Deferred tax expense/(benefit) Current year including deferred tax expense/(benefit) on losses 5,148 (56)Expected income tax expense/(benefit) 5,059 7,755Income tax benefit not brought into account (including unused tax losses for which no DTA has been recognised) - 6,706Adjustments for current and deferred tax of prior periods (8,333) (6,839)Actual tax expense (3,274) 7,622 Numerical reconciliation between tax expense to prima facie tax payable Profit/(loss) before tax 22,796 12,629Income tax calculated at 30% (2018: 30%) 6,839 3,789Increase/(decrease) in income tax expense/(benefit) due to: Difference in overseas tax rates 3,183 1,512Non-allowable items (permanent differences) (977) 2,454Subtotal 9,045 7,755Deferred tax asset not brought to account - -Subtotal 9,045 7,755Adjustments for current and deferred tax of prior periods (12,319) (6,839)Income tax benefit not brought into account (including unused tax losses for which no DTA has been recognised) - 6,706Actual tax expense (3,274) 7,622
The franking account balance at the end of the year was 3,689,235 (2018: NIL). Unused tax losses were incurred by Australian entities and overseas subsidiaries.
Net deferred tax assets have been brought to account as it is probable within the immediate future that tax profits will be available against which deductible temporary differences can be utilised.
Deferred tax assets on losses have been recognised.
Movements in deferred tax assets/(liabilities) balances ($’000)
Opening balance Recognised in profit or loss Closing balanceTemporary differences Deferred Tax Assets (DTA)
Unused tax losses - 1,991 1,991Accruals 568 276 844Provisions - - -Other 442 1,063 1,503
Total DTA 1,010 3,330 4,338Deferred Tax Liabilities (DTL)
Intangibles, prepayments and other (821) (145) (964)Total DTL (821) (145) (964)Net, DTA 189 3,185 3,374
N O T E S T O T H E C O N S O L I D AT E D F I N A N C I A L S TAT E M E NT S A S AT 3 0 J U N E 2 0 1 9

V G W H O L D I N G S L I M IT E D A N D C O NT R O L L E D E NT IT I E S 2 4
7. EMPLOYEE BENEFITS EXPENSE
Expenses recognised for employee benefits are analysed below: 2019 2018 $’000 $’000Wages and salaries (28,788) (14,178)Social security payments (2,567) (1,458)Termination payments (1,319) -Other employee related benefits (2,947) (1,915) (35,621) (17,551)
8. CASH AND CASH EQUIVALENTS 2019 2018 $’000 $’000Cash at bank 19,714 11,432Funds with payment service providers 19,497 6,619 39,211 18,051
The funds with payment service providers included above are immediately accessible and has the same liquidity as cash, therefore classified as cash and cash equivalents.
9. TRADE AND OTHER RECEIVABLES 2019 2018CURRENT $’000 $’000Trade receivables 290 237Other receivables
GST/VAT receivable 2,466 1,692Other 63 61
2,819 1,990
The trade receivables are current and have been fully paid or settled after balance sheet date. The Other is a receivable of $62,900 from Facebook. Comparative period’s Other receivables was from Lance East Corporation, a related party. The amount was fully received as at the reporting date.
10. PREPAYMENTS AND OTHER SHORT-TERM ASSETS 2019 2018 $’000 $’000Prepayments 3,238 2,597Restricted funds, bank guarantee and reserves 2,270 22,642Deposits and bonds 123 180 5,631 25,419
As of 30 June 2019, $1.8m are bank guarantees for leased premises. In the prior year, $20.8m were restricted funds required from VGW’s payment platform service provider which have been fully released.
N O T E S T O T H E C O N S O L I D AT E D F I N A N C I A L S TAT E M E NT S A S AT 3 0 J U N E 2 0 1 9

V G W H O L D I N G S L I M IT E D A N D C O NT R O L L E D E NT IT I E S 2 5
11. CONTROLLED ENTITIES
The subsidiaries listed below have share capital consisting solely of ordinary shares which are held directly by the parent entity. The assets of the subsidiaries have been consolidated on a line-by-line basis in the consolidated financial statements of the Group.
The proportion of ownership interests held equals the voting rights held by the Group.
Ownership Interest Incorporation/ Country of Name Registration Date Incorporation 2019 2018VGW Malta Holding Limited ^ 19 Apr 2016 Malta 99.93% 99.93%VGW Holdings US Inc. 29 Dec 2017 United States 100.00% 100.00%VGW Corporation Pty Ltd 4 Jan 2018 Australia 100.00% 100.00%Fendoff Pty Limited 17 Dec 2018 Australia 100.00% -VGW Korea Co. Limited^^ 20 Oct 2018 Republic of Korea 100.00% -
Wholly owned subsidiaries of VGW Malta Holding Limited:VGW Malta Limited ^ 9 Mar 2016 Malta 99.93% 99.93%VGW RMG Limited ** 10 Aug 2016 Malta 100% 100%VGW Sports Limited ^* 5 Oct 2016 Malta 99.93% 99.93%VGW Administration Malta Limited ^ 7 Oct 2016 Malta 99.93% 99.93%VGW GP Limited ^ 23 Nov 2016 Malta 99.93% 99.93%
Wholly owned subsidiaries of VGW Holdings US Inc.VGW US, Inc. 28 Aug 2017 United States 100.00% 100.00%VGW Luckyland, Inc. 29 Dec 2017 United States 100.00% 100.00%
^ VGW Corporation Pty Ltd holds the remaining 0.07% ^^ VGW Korea Co. Limited is in the process of being deregistered* VGW Sports Limited has been renamed to Agence V Limited on 2 September 2019** VGW RMG Limited has been renamed to VGW Games Limited on 2 September 2019
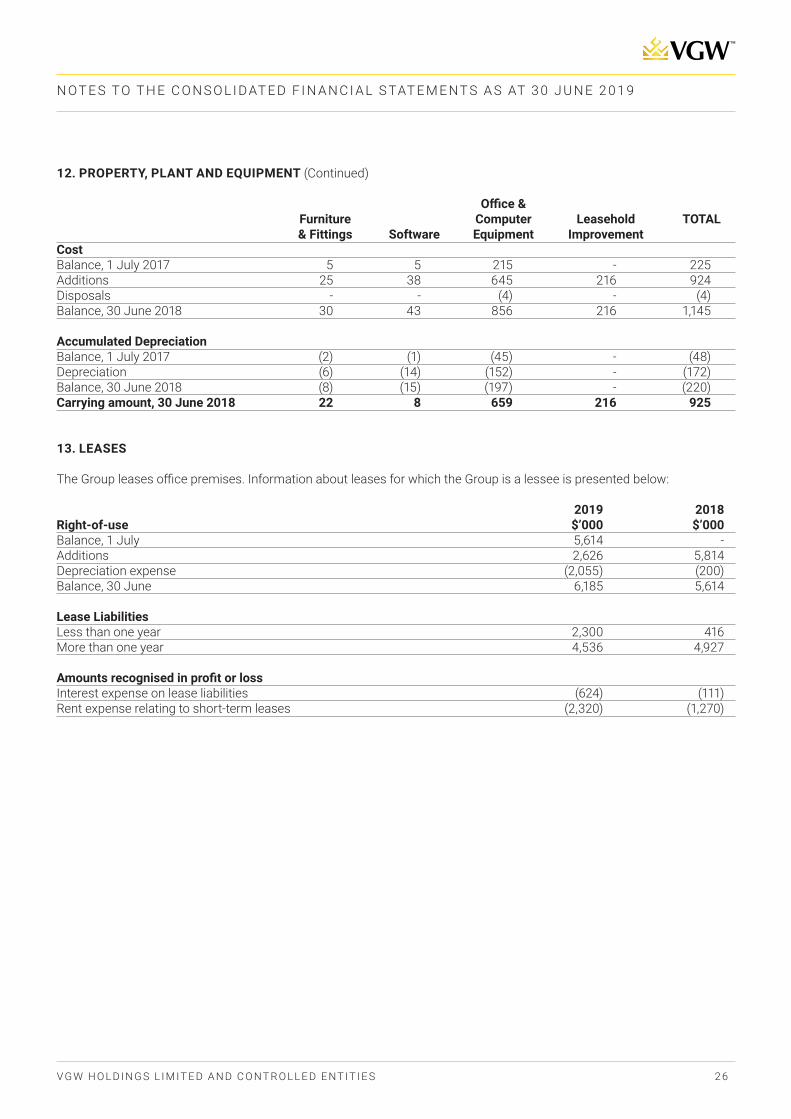
12. PROPERTY, PLANT AND EQUIPMENT
Details of the Group’s property, plant and equipment and their carrying amount are as follows:
Office & Furniture Computer Leasehold TOTAL & Fittings Software Equipment Improvement CostBalance, 1 July 2018 30 43 856 216 1,145Additions 13 - 730 2,274 3,017Disposals - - (42) - (42)Balance, 30 June 2019 43 43 1,544 2,490 4,120
Accumulated DepreciationBalance, 1 July 2018 (8) (15) (197) - (220)Depreciation (7) (13) (423) (314) (757)Balance, 30 June 2019 (15) (28) (620) (314) (977)Carrying amount, 30 June 2019 28 15 924 2,176 3,143
N O T E S T O T H E C O N S O L I D AT E D F I N A N C I A L S TAT E M E NT S A S AT 3 0 J U N E 2 0 1 9
V G W H O L D I N G S L I M IT E D A N D C O NT R O L L E D E NT IT I E S 2 6
12. PROPERTY, PLANT AND EQUIPMENT (Continued)
Office & Furniture Computer Leasehold TOTAL & Fittings Software Equipment Improvement CostBalance, 1 July 2017 5 5 215 - 225Additions 25 38 645 216 924Disposals - - (4) - (4)Balance, 30 June 2018 30 43 856 216 1,145
Accumulated DepreciationBalance, 1 July 2017 (2) (1) (45) - (48)Depreciation (6) (14) (152) - (172)Balance, 30 June 2018 (8) (15) (197) - (220)Carrying amount, 30 June 2018 22 8 659 216 925
13. LEASES
The Group leases office premises. Information about leases for which the Group is a lessee is presented below:
2019 2018Right-of-use $’000 $’000Balance, 1 July 5,614 -Additions 2,626 5,814Depreciation expense (2,055) (200)Balance, 30 June 6,185 5,614
Lease LiabilitiesLess than one year 2,300 416More than one year 4,536 4,927
Amounts recognised in profit or lossInterest expense on lease liabilities (624) (111)Rent expense relating to short-term leases (2,320) (1,270)
N O T E S T O T H E C O N S O L I D AT E D F I N A N C I A L S TAT E M E NT S A S AT 3 0 J U N E 2 0 1 9

V G W H O L D I N G S L I M IT E D A N D C O NT R O L L E D E NT IT I E S 2 7
14. INTANGIBLE ASSETS
Summary of license capitalisation and software development costs 2019 2018 $‘000 $‘000Cost Balance, 1 July 16,508 8,952Additions 1,284 7,556Balance, 30 June 17,792 16,508
Accumulated AmortisationBalance, 1 July (5,538) (3,705)Amortisation (2,834) (1,824)Foreign currency adjustment - (9)Balance, 30 June (8,372) (5,538)Net book value, 30 June 9,420 10,970
15. TRADE AND OTHER PAYABLES 2019 2018CURRENT $’000 $’000Trade payables 9,186 9,087Other payables and accruals 2,412 3,002 11,598 12,089
All amounts are short term. The carrying value of trade payables, other payables and accruals are considered to be a reasonable approximation of fair value.
16. CONTRACT LIABILITY
The Group adopted AASB 15: Revenue from Contracts with Customers, effective 1 July 2017. Consequently, revenue from player purchases are deferred over the player’s retention period. The Contract Liability represents player purchases that are yet to be recognised as revenue over the remaining retention life of the players. The balances as of 30 June 2019 is $26.7 million (FY 2018: $37.6 million).
17. PROVISIONS
Sweepstakes Leave Entitlements Make Good TOTALBalance, 1 July 2018 7,622 1,017 569 9,208Amounts charged as expenses 880 601 23 1,504Amounts recognised as an asset - - - -Balance, 30 June 2019 8,502 1,618 592 10,712
The provision for Sweepstakes Liability represents cashable sweepstakes of players that are active within sixty days. Under the Sweepstakes rules, the cashable sweepstakes of players not active within sixty days expire. The cancellation of sweepstakes of players not active within sixty days was adopted from 1 July 2015 for Chumba. However, the cancellation of sweepstakes of players not active within sixty days for Global Player has not been applied.
Provisioning for Global Poker cashable sweeps is at 60% of period end balance which amounts to $5.7 million. The Group deems that a 60% provision for Global Poker is more appropriate based on historical behaviour of players.
$265 thousand of the leave entitlements are due to the long service leave accrual and is non-current. All other provisions are current.
N O T E S T O T H E C O N S O L I D AT E D F I N A N C I A L S TAT E M E NT S A S AT 3 0 J U N E 2 0 1 9

V G W H O L D I N G S L I M IT E D A N D C O NT R O L L E D E NT IT I E S 2 8
18. FAIR VALUE MEASUREMENT OF FINANCIAL INSTRUMENTS
Fair value measurement of financial instruments
The following table shows the carrying amount and fair values of financial assets and financial liabilities, including their levels in the fair value hierarchy. It does not include fair value information for financial assets and financial liabilities not measured at fair value if the carrying amount is a reasonable approximation of fair value.
Carrying amount Other Financial30 June 2019 Note Fair Value Amortised Cost Liabilities
Financial assets not measured at fair value Cash and cash equivalents 8 39,211Trade and other receivables 9 2,819 42,030Financial liabilities not measured at fair value Trade and other payables 15 11,598 11,598 Carrying amount Other Financial30 June 2018 Note Fair Value Amortised Cost Liabilities Financial assets not measured at fair value Cash and cash equivalents 8 18,051Trade and other receivables 9 1,990 20,041Financial liabilities not measured at fair value Trade and other payables 15 12,089 12,089 There were no transfers between Level 1 and level 2 during the period. There were also no changes during the period in the valuation techniques used by the Group to determine Level 2 fair values.
N O T E S T O T H E C O N S O L I D AT E D F I N A N C I A L S TAT E M E NT S A S AT 3 0 J U N E 2 0 1 9

V G W H O L D I N G S L I M IT E D A N D C O NT R O L L E D E NT IT I E S 2 9
19. ISSUED CAPITAL Consolidated entity 2019 2018 2019 2018 Shares Shares $’000 $’000 Fully paid ordinary shares, net of share issue cost 563,227,015 556,358,317 24,191 22,244 Number Restated Value ($’000)Movements in ordinary share capital Opening balance, 1 July 2017, net of share issue cost 450,331,892 19,314Conversion of performance shares (a) 96,666,666 -Issuance of shares to Cubeia (b) 849,571 137Conversion options into ordinary share (c) 8,310,188 1,553Issuance of shares as payment of services 200,000 40Settlement of loan funded shares (Note 21 a) - 1,200Closing balance, 30 June 2018 556,358,317 22,244 Opening balance, 1 July 2018, net of share issue cost 556,358,317 22,244Conversion options into ordinary share (c) 2,335,363 467Conversion of convertible notes (d) 4,166,666 250Issuance of Shares 366,669 -Settlement of loan funded shares (Note 21 a) - 1,230Closing balance, 30 June 2019 563,227,015 24,191
a) In October 2017, 290 million or 96.7 million (post 1:3 consolidation) performance shares were converted to ordinary shares as performance milestones for Class D, E and F were achieved.
b) During the comparative year, the Company issued 849,571 ordinary shares valued at $137,000 to Cubeia Sweden AB, in accordance with the Poker Software License Agreement signed in August 2016.
c) As part of the Company’s capital raise in December 2016 and January 2017, 2,757,152 free-attaching options were issued on a 3-for-1 basis with an exercise price of $0.20. In FY 2019, 2,335,363 options were converted to fully paid ordinary shares prior to the expiry dates. All unexercised options were cancelled. In an earlier capital raise in the period between June and August 2015, the Company issued a total of 97,362,112 free-attaching options over issued shares or interest in the Company. The options were standard call options exercisable at $0.05 (pre-consolidation) per share over a two-year period. Post the 1-for-3 consolidation, the number of options was 32,453,990, with an exercise price of $0.15, and which expired on 23 June 2017 and 24 August 2017. Approximately 8.3 million options had been exercised, with the remainder cancelled at the expiry dates.
d) The three outstanding convertible notes issued in November 2010, with a face value of $250,000 were converted in February 2019 into 4,166,667 ordinary shares, at a conversion price of 6 cents each.
N O T E S T O T H E C O N S O L I D AT E D F I N A N C I A L S TAT E M E NT S A S AT 3 0 J U N E 2 0 1 9

V G W H O L D I N G S L I M IT E D A N D C O NT R O L L E D E NT IT I E S 3 0
20. RELATED PARTY TRANSACTIONS
The Group’s main related parties are as follows:
a. Parent entity and controlled entities
VGW Holdings Limited (“the parent”) exercises control over its subsidiaries: VGW Malta Holding Ltd., VGW Malta Ltd., VGW Administration Malta Ltd., VGW RMG Ltd., VGW Sports Ltd., VGW GP Ltd., VGW Holdings US Inc., VGW US, Inc., VGW Luckyland Inc., and Fendoff Pty Ltd. The parent and the subsidiaries are collectively referred to as the “consolidated entity” and are constituent parts of these consolidated financial statements. Accordingly, the subsidiaries are considered as re-lated parties in the separate financial statements of the parent entity rather than in the consolidated financial statements.
b. Key management personnel
Any person(s) having authority and responsibility for planning, directing and controlling the activities of the entity, directly or indirectly, including any director (whether executive or otherwise) of that entity is considered key management personnel.
Key management personnel remuneration includes the following
2019 2018 $’000 $’000Total key management personnel remuneration 2,826 2,781
FY 2019 key management personnel included $0.2 million in options expense (FY 2018: $0.1 million).
In FY 2019, dividends of $5.4 million were paid to key management personnel (FY 2018: nil).
c. Other related parties
Other related parties include close family members of key management personnel and entities that are controlled or jointly controlled by those key management personnel individually or collectively with their close family members. Refer to Note 9.
N O T E S T O T H E C O N S O L I D AT E D F I N A N C I A L S TAT E M E NT S A S AT 3 0 J U N E 2 0 1 9

V G W H O L D I N G S L I M IT E D A N D C O NT R O L L E D E NT IT I E S 3 1
21. SHARE-BASED PAYMENTS
a. Loan Funded Share arrangements
The shares are exercised upon vesting date and are paid for via non-recourse loans. The loans will be repaid to the Company when the shares are sold. The shares have voting and dividend rights but are not transferable. Unvested shares are forfeited if the employee is no longer employed by the Company. The loan funded share was accounted for as a share-based payment by recognising an expense and a credit to equity. Loan repayments are recorded as a credit in equity.
$1.2 million worth of loan funded shares were settled during the year. VGW Holdings Limited received $0.2 million and $1.0 million respectively as settlement of loan funded shares by two holders of such shares. This has been recognised directly in equity.
b. Share Options
In January 2017, VGW established a Long-Term Incentive Plan (LTIP) which is part of VGW’s reward strategy in support of the achievement of the Company’s business strategy. Tranche 1 options were granted in January and April 2017. These options vests immediately, therefore, there were no vesting conditions. Tranche 2 and 3 options were approved on by VGW’s share-holders in its annual meeting on 27 November 2017. The key terms and conditions related to the options issued are disclosed below. The fair value of the share options has been measured using the Black-Scholes method. The inputs used in the mea-surement of the fair values at grant date of the options were as follows:
LTIP Grant Number of Contractual Fair Share Exercise Date Options life of option value Price PriceTranche 1 (a) 1 Jan 2017 333,333 5 years .0613 0.146 0.20Tranche 1 (b) 31 Jan 2017 11,595,170 5 years .0813 0.146 0.20Tranche 1 (c) 31 Jan 2017 29,456,088 3 years .0613 0.146 0.20Tranche 1 (d) 3 Apr 2017 166,666 3 years .0613 0.146 0.20Tranche 2 (a) 27 Nov 2017 9,135,488 2 years .0800 0.20 0.20Tranche 2 (b) 27 Nov 2017 333,333 4 years .0613 0.20 0.20Tranche 2 (c) 27 Nov 2017 533,333 2 years .0800 0.20 0.20Tranche 3 (a) 27 Nov 2017 4,974,217 2 years .0600 0.146 0.20Tranche 3 (b) 27 Nov 2017 333,333 3 years .0613 0.146 0.20
On 28 January 2018, 1,082,500 options were granted to executives as short-term incentive. These options vested immediately:
STI Grant Number of Contractual Fair Share Exercise Date Options life of option value Price PriceExecutives 29 Jan 2018 1,082,500 3 years 0.100 0.200 0.20
On 1 July 2018, 2,250,000 options were granted to employees. These options vested immediately:
LTIP Grant Number of Contractual Fair Share Exercise Date Options life of option value Price PriceTranche Jul 2018 1 Jul 2018 2,250,000 3 years 0.080 0.200 0.20
N O T E S T O T H E C O N S O L I D AT E D F I N A N C I A L S TAT E M E NT S A S AT 3 0 J U N E 2 0 1 9

V G W H O L D I N G S L I M IT E D A N D C O NT R O L L E D E NT IT I E S 3 2
22. EARNINGS PER SHARE 2019 2018 $’000 $’000Income (loss) after income tax attributable to the owners of VGW Holdings Limited 26,070 5,007
Number of Shares Number of SharesWeighted average number of shares used in calculatingbasic earnings per share 559,132,181 555,898,617
Weighted average number of shares used in calculatingdiluted earnings per share 573,055,996 555,898,617
Cents CentsBasic income per share 4.66 0.90Diluted income per share 4.55 0.90
23. PARENT ENTITY INFORMATION 2019 2018Statement of profit or loss and other comprehensive income $’000 $’000 Income/(loss) for the year 38,506 (20,290)Other comprehensive income - 3,913Total comprehensive income 38,506 (16,377)
Statement of financial position Total current assets 18,040 41,173Total assets 21,410 55,156Total current liabilities 16,248 80,572Total liabilities 19,666 85,499Equity 1,744 (30,343)
The accounting policies of the parent entity are consistent with those of the consolidated entity, as disclosed in Note 1.
N O T E S T O T H E C O N S O L I D AT E D F I N A N C I A L S TAT E M E NT S A S AT 3 0 J U N E 2 0 1 9
V G W H O L D I N G S L I M IT E D A N D C O NT R O L L E D E NT IT I E S 3 3
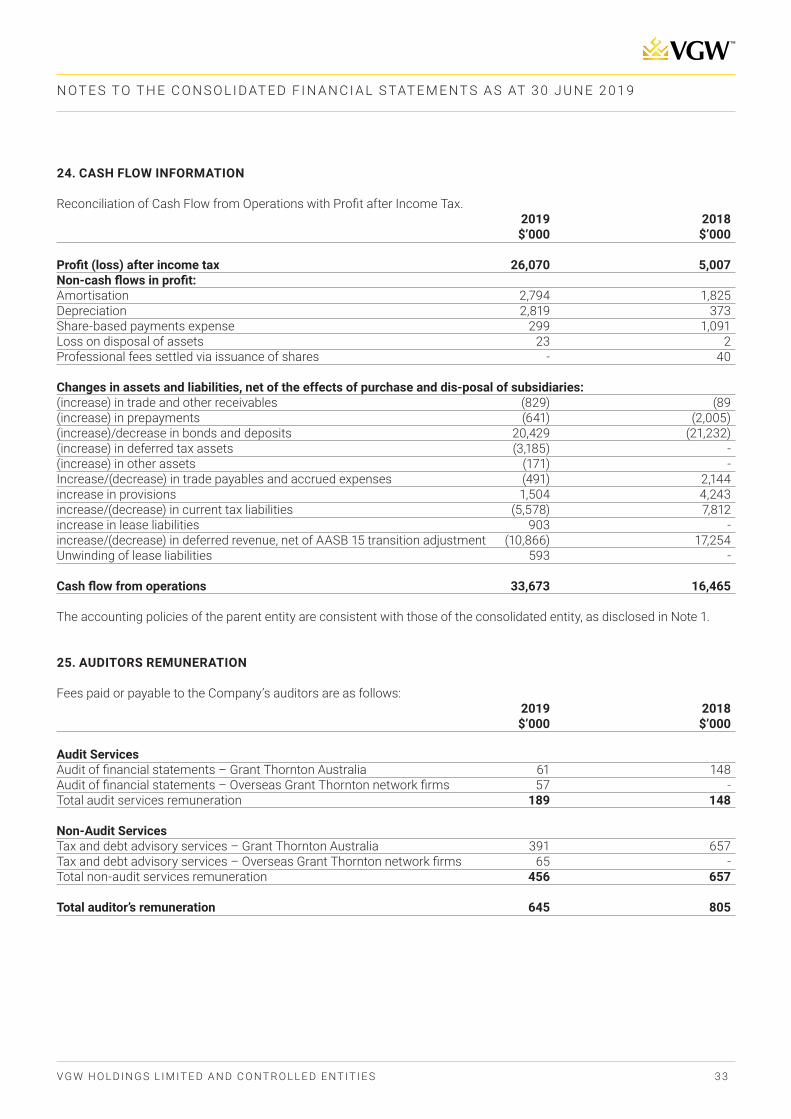
24. CASH FLOW INFORMATION
Reconciliation of Cash Flow from Operations with Profit after Income Tax. 2019 2018 $’000 $’000
Profit (loss) after income tax 26,070 5,007Non-cash flows in profit: Amortisation 2,794 1,825Depreciation 2,819 373Share-based payments expense 299 1,091Loss on disposal of assets 23 2Professional fees settled via issuance of shares - 40
Changes in assets and liabilities, net of the effects of purchase and dis-posal of subsidiaries:(increase) in trade and other receivables (829) (89(increase) in prepayments (641) (2,005)(increase)/decrease in bonds and deposits 20,429 (21,232)(increase) in deferred tax assets (3,185) -(increase) in other assets (171) -Increase/(decrease) in trade payables and accrued expenses (491) 2,144increase in provisions 1,504 4,243increase/(decrease) in current tax liabilities (5,578) 7,812increase in lease liabilities 903 -increase/(decrease) in deferred revenue, net of AASB 15 transition adjustment (10,866) 17,254Unwinding of lease liabilities 593 -
Cash flow from operations 33,673 16,465
The accounting policies of the parent entity are consistent with those of the consolidated entity, as disclosed in Note 1.
25. AUDITORS REMUNERATION
Fees paid or payable to the Company’s auditors are as follows: 2019 2018 $’000 $’000
Audit ServicesAudit of financial statements – Grant Thornton Australia 61 148Audit of financial statements – Overseas Grant Thornton network firms 57 -Total audit services remuneration 189 148
Non-Audit Services Tax and debt advisory services – Grant Thornton Australia 391 657Tax and debt advisory services – Overseas Grant Thornton network firms 65 -Total non-audit services remuneration 456 657
Total auditor’s remuneration 645 805
N O T E S T O T H E C O N S O L I D AT E D F I N A N C I A L S TAT E M E NT S A S AT 3 0 J U N E 2 0 1 9
V G W H O L D I N G S L I M IT E D A N D C O NT R O L L E D E NT IT I E S 3 4
26. EVENTS AFTER THE REPORTING PERIOD
On 29 August 2019, the Company resolved to provide a short term loan facility to the Managing Director at better than arm’s length commercial terms in accordance with the Corporations Act. The facility involves a loan of up to $2.0 million at an in-terest rate of 14% per annum. The loan is to be repaid in full on or before 30 December 2019. Security of the loan consists of the Managing Director’s assets, excluding equity holdings in the Company.
27. CONTINGENT LIABILITIES
There are no contingent liabilities or assets that have been incurred by the Group in relation to 2019.
28. DIVIDENDS
An unfranked half-cent dividend per ordinary share was paid on 30 November 2018. A further unfranked one cent dividend per ordinary share was paid on 18 April 2019. The total amounts distributed was $8.4 million (2018: NIL).
N O T E S T O T H E C O N S O L I D AT E D F I N A N C I A L S TAT E M E NT S A S AT 3 0 J U N E 2 0 1 9

V G W H O L D I N G S L I M IT E D A N D C O NT R O L L E D E NT IT I E S 3 5
DIRECTORS’ DECLARATION
In the directors’ opinion:
(a) the financial statements and Notes set out on pages 11 to 34, are in accordance with the Corporations Act 2001, including:
(i) giving a true and fair view of the financial position of the Company’s and the Group’s financial position as at 30 June 2019 and of their performance for the financial year ended on that date;
(ii) complying with Australian Accounting Standards and Reduced Disclosure Re-quirements (including the Australian Accounting Interpretations) and the Corpo-rations Regulations 2001; and
(b) there are reasonable grounds to believe that the Company and the Group Entities identified in Note 11 will be able to pay its debts as and when they become due and payable.
Signed in accordance with a resolution of the directors:
Laurence ESCALANTEDirector 28 October 2019
N O T E S T O T H E C O N S O L I D AT E D F I N A N C I A L S TAT E M E NT S A S AT 3 0 J U N E 2 0 1 9

3 6
36
Grant Thornton Audit Pty Ltd ACN 130 913 594 a subsidiary or related entity of Grant Thornton Australia Ltd ABN 41 127 556 389 ‘Grant Thornton’ refers to the brand under which the Grant Thornton member firms provide assurance, tax and advisory services to their clients and/or refers to one or more member firms, as the context requires. Grant Thornton Australia Ltd is a member firm of Grant Thornton International Ltd (GTIL). GTIL and the member firms are not a worldwide partnership. GTIL and each member firm is a separate legal entity. Services are delivered by the member firms. GTIL does not provide services to clients. GTIL and its member firms are not agents of, and do not obligate one another and are not liable for one another’s acts or omissions. In the Australian context only, the use of the term ‘Grant Thornton’ may refer to Grant Thornton Australia Limited ABN 41 127 556 389 and its Australian subsidiaries and related entities. GTIL is not an Australian related entity to Grant Thornton Australia Limited. Liability limited by a scheme approved under Professional Standards Legislation.
www.grantthornton.com.au
Level 17, 383 Kent Street Sydney NSW 2000 Correspondence to: Locked Bag Q800 QVB Post Office Sydney NSW 1230 T +61 2 8297 2400 F +61 2 9299 4445 E [email protected] W www.grantthornton.com.au
Independent Auditor’s Report To the Members of VGW Holdings Limited
Report on the audit of the financial report
Opinion
We have audited the financial report of VGW Holdings Limited (the Company) and its subsidiaries (the Group), which comprises the consolidated statement of financial position as at 30 June 2019, the consolidated statement of profit or loss and other comprehensive income, consolidated statement of changes in equity and consolidated statement of cash flows for the year then ended, and notes to the consolidated financial statements, including a summary of significant accounting policies, and the Directors’ declaration.
In our opinion, the accompanying financial report of the Group is in accordance with the Corporations Act 2001, including:
a giving a true and fair view of the Group’s financial position as at 30 June 2019 and of its performance for the year ended on that date; and
b complying with Australian Accounting Standards – Reduced Disclosure Requirements and the Corporations Regulations 2001.
Basis for opinion
We conducted our audit in accordance with Australian Auditing Standards. Our responsibilities under those standards are further described in the Auditor’s Responsibilities for the Audit of the Financial Report section of our report. We are independent of the Group in accordance with the Corporations Act 2001 and the ethical requirements of the Accounting Professional and Ethical Standards Board’s APES 110 Code of Ethics for Professional Accountants (the Code) that are relevant to our audit of the financial report in Australia. We have also fulfilled our other ethical responsibilities in accordance with the Code.
We believe that the audit evidence we have obtained is sufficient and appropriate to provide a basis for our opinion.

3 737
Information other than the financial report and auditor’s report thereon
The Directors are responsible for the other information. The other information comprises the information included in the Group’s Annual report for the year ended 30 June 2019, but does not include the financial report and our auditor’s report thereon.
Our opinion on the financial report does not cover the other information and accordingly we do not express any form of assurance conclusion thereon.
In connection with our audit of the financial report, our responsibility is to read the other information and, in doing so, consider whether the other information is materially inconsistent with the financial report or our knowledge obtained in the audit or otherwise appears to be materially misstated.
If, based on the work we have performed, we conclude that there is a material misstatement of this other information, we are required to report that fact. We have nothing to report in this regard.
Responsibilities of the Directors’ for the financial report
The Directors of the Company are responsible for the preparation of the financial report that gives a true and fair view inaccordance with Australian Accounting Standards – Reduced Disclosure Requirements and the Corporations Act 2001. The Directors’ responsibility also includes such internal control as the Directors determine is necessary to enable the preparation of the financial report that gives a true and fair view and is free from material misstatement, whether due to fraud or error.
In preparing the financial report, the Directors are responsible for assessing the Group’s ability to continue as a going concern, disclosing, as applicable, matters related to going concern and using the going concern basis of accounting unless the Directors either intend to liquidate the Group or to cease operations, or have no realistic alternative but to do so.
Auditor’s responsibilities for the audit of the financial report
Our objectives are to obtain reasonable assurance about whether the financial report as a whole is free from material misstatement, whether due to fraud or error, and to issue an auditor’s report that includes our opinion. Reasonable assurance is a high level of assurance, but is not a guarantee that an audit conducted in accordance with the Australian Auditing Standards will always detect a material misstatement when it exists. Misstatements can arise from fraud or error and are considered material if, individually or in the aggregate, they could reasonably be expected to influence the economic decisions of users taken on the basis of this financial report.
A further description of our responsibilities for the audit of the financial report is located at the Auditing and Assurance Standards Board website at: http://www.auasb.gov.au/auditors_responsibilities/ar3.pdf. This description forms part of our auditor’s report.
Grant Thornton Audit Pty LtdChartered Accountants
R J Isbell Partner – Audit & Assurance
Sydney, 2� October 2019


