vFinal Sarah Dewilde Cold chain distribution network design Management... · Cold chain...
66
Cold chain distribution network design in developing countries A robust and resilient vaccine distribution network in Madagascar FACULTY OF ECONOMICS AND BUSINESS Sarah Dewilde r0681489 Thesis submitted to obtain the degree of Major Production and Logistics Promoter: Prof. Dr. Nico Vandaele Assistant: Catherine Decouttere Academic year 2017-2018 Master of Business Engineering
Transcript of vFinal Sarah Dewilde Cold chain distribution network design Management... · Cold chain...

Cold chain distribution network design in developing countries A robust and resilient vaccine distribution network in Madagascar
FACULTY OF ECONOMICS AND BUSINESS
Sarah Dewilde
r0681489
Thesis submitted to obtain the degree of
Major Production and Logistics
Promoter: Prof. Dr. Nico Vandaele Assistant: Catherine Decouttere
Academic year 2017-2018
Master of Business Engineering

Sarah Dewilde Cold chain distribution network design in developing countries Promoter: Prof. Dr. Nico Vandaele
List of abbreviations
BHC Basic health center
CCE Cold chain equipment
DRSP Direction Régionale de la Santé Publique – Regional warehouse
EPI Expanded program on immunization
EVM Effective vaccine management
GAVI Global Alliance for Vaccines and Immunization
IC Immunized children
LMIS Logistics management and information system
SC Supply chain
SS Sub Saharan
UNICEF United Nations Children’s Fund
WHO World Health Organization

1 Sarah Dewilde Cold chain distribution network design in developing countries Promoter: Prof. Dr. Nico Vandaele
Cold chain distribution network design in developing countries
A robust and resilient vaccine distribution network in Madagascar
Sarah Dewilde Master of Business Engineering
Faculty of economics and business, KU Leuven
This dissertation evaluates an immunization supply chain, its challenges and some strategies to
reduce the impact of these challenges. Key concepts from state-of-the-art literature on supply
chain disruption and mitigation strategies are applied on a vaccine supply chain and are used in
a case study in which Madagascar’s vaccine distribution network was simulated using the
Anylogic software. The goal was to identify design changes to reduce the burden of the rainy
season. The simulation of the current situation suggests an immunization coverage of 64%, with
a gap of 22% between the rainy-season affected areas and the non-rainy-season affected areas,
which provides the means to immunize 530.000 children on an annual basis. This research
points out that by (1) anticipating the missed resupply moments during the rainy season by
implementing a buffer, which increases the requested order sizes of the rainy-season affected
areas by 100% during the dry season, and (2) shifting to a bimonthly supply system, an overall
improvement of 8% in immunization coverage can be obtained. More important improvements
are found when also the cold chain equipment is partially renewed, resulting in approximately
120.000 extra immunized children, an immunization coverage of 76% and a gap of only 7%.
This solution, however, comes at a cost estimated at 36 eurocents per immunized child. Yet,
the macro-economic benefits of immunizing extra children are far-reaching.
Keywords: simulation, immunization supply chain, vaccines, Madagascar, resilience, Anylogic
1. Introduction Although more than 5 million deaths were averted annually between 2010 and 2015, thanks to
vaccines delivered around the world, one out of ten children have remained unreached by immunization
programs in 2015 (Path & WHO, 2015). As long as immunization supply chains cannot safely and
reliably manage, store, transport and deliver vaccines to all people under all circumstances,
immunization and child and maternal health services will fall short of their full potential. With vaccines
being one of the most important means to enhance the wellbeing of the population, it is hard to
overestimate the importance of a properly functioning cold chain network.
2 Sarah Dewilde Cold chain distribution network design in developing countries Promoter: Prof. Dr. Nico Vandaele
Globally, many countries are facing a broad range of humanitarian incidents resulting from various
hazards which differ in scale, complexity and scope. This complex setting does not facilitate the process
of getting the right vaccine, in the right quantities, at the right time, in the right condition, to the right
place, at the right cost. Incidents have extensive political, economic, social, and public health impact
through disruption of the health systems and basic infrastructure (Path & WHO, 2015).
This dissertation evaluates an immunization supply chain (further referred to as SC) and highlights
potential challenges. Next, plausible strategies are put forward to lessen their impact. The ultimate
deliverable is the case study of Madagascar, in which a thorough analysis of the country's context
indicates potential challenges, e.g. seasonal geographical isolation due to the rainy season. A simulation
study allows to determine strategies to strengthen the immunization service delivery and improve the
availability of vaccines in the affected regions.
2. Problem statement and literature review “The best vaccine imaginable is only valuable to the extent we get it to everyone who needs it”
– Seth Berkley, CEO GAVI Alliance
2.1. Problem statement
If vaccines are the solution, then why aren’t children receiving them? The answer to this question
lays within the journey any vaccine follows from manufacturer to final destination. A journey in which
they are exposed to extreme heat, inappropriate cold chain equipment, long distances between facilities
without adequate infrastructure and many more challenges that can disrupt the supply chain. Without
an adequate immunization supply chain, children cannot be vaccinated against life-threatening diseases.
Numerous researchers have acknowledged the importance of the SC in the challenge to increase
the immunization coverage. In 2011, Kauffman et al. declared that SC considerations should become
an integral part of vaccine development and production research. This was followed by a statement by
Zaffran et al. in 2013, that stronger vaccine supply and logistics systems are needed in order to cope
with the introduction of new vaccines. Zaffran et al. claim that by adopting commercial best practice,
the transparency and efficiency of supply chains and potency of vaccines can be improved. This
approach was used to evaluate and strengthen the immunization SC in Nigeria (Sarley et al., 2017).
In addition to this, in 2009, the HERMES simulation software was developed by John Hopkins
University and the Pittsburgh Supercomputing Center. HERMES generates detailed discrete-event
simulation models that include virtual representations of all vaccine vials, storage and immunization
locations, storage and transportation devices, ordering and shipping policies, and logistics costs
associated with SC operations. A HERMES-generated model tracks each vial as it moves through the
system to be shipped, stored, and ultimately used or wasted.

3 Sarah Dewilde Cold chain distribution network design in developing countries Promoter: Prof. Dr. Nico Vandaele
Hereafter, a whole range of case studies were published assessing the possibilities to enhance the
immunization SC using this software. Assi et al (Assi et al., 2011, 2013) and Lee et al. (Lee, Assi, et
al., 2012) evaluated the situation in Niger. Brown et al. (Brown et al., 2014) analysed Benin and Lee et
al. (Lee et al., 2016) assessed Mozambique. Parallel to this, Chen et al. (Chen et al., 2014) constructed
a mathematical model which allows to assess the impact of removing a layer in the supply chain,
changing the vial size of the vaccines, introducing a new vaccine or expanding capacity on the
immunization rates. It can be used to better understand resource constraints in existing networks so as
to improve vaccine delivery and coverage.
Despite all the knowledge on the optimal setup of immunization supply chains, no studies have
been found in which challenges of SC disruptions are taken into account when designing the network.
SC disruptions, such as inaccessibility due to rainy season, floods, hurricanes, epidemics or pandemics,
etc. can have a substantial influence on key SC parameters such as demand, supply, delivery time of
products, and costs. They may also result in reducing capacity of SC facilities and transportation links
or even eliminating them (Govindan, Fattahi, & Keyvanshokooh, 2017). It is clear that this leads to
interrupted vaccine availability, which leads to missed opportunities to vaccinate and to populations
running the risk of not being protected against deadly preventable diseases.
Leading authorities in immunization advocate the need of more resilient health systems. Unicef’s
vision for the future of immunization SC clearly illustrates this. It states that “strong health systems
should be flexible, resilient to shocks and emergencies, and adaptable to new or unanticipated
developments” (WHO/UNICEF, 2016). This dissertation aims to assess which elements may break the
cold chain, how they disrupt the SC and what strategies should be considered to adapt the design of the
network to prevent or avoid the disastrous effects a shock or an emergency could have. This includes a
thorough analysis of the parameters that influence demand, the factors that hinder the distribution of
the vaccines and the broader context of the developing. It can be considered as obvious that this specific
context brings along several challenges such as a complex stakeholder structure, the occurrence of
armed conflicts and natural disasters which all add uncertainty to the distribution process.
This dissertation is structured as follows: first a literature review (Section 2.2) answers the
question: “Which elements may break a cold chain; how do they disrupt the SC and what strategies
should be considered to adapt the design of the network to prevent or avoid the disastrous effects a
shock or emergency could have?” Next, the frequently used research techniques in literature and the
reasoning for opting for a simulation study are discussed in Chapter 3. Finally, the case study on
Madagascar provides an answer to an adjusted version of the research question, being: “What strategies
can be considered to adapt the immunization distribution network in Madagascar to limit the impact of
the five months of isolation caused by the rainy season?” in Chapter 0.

4 Sarah Dewilde Cold chain distribution network design in developing countries Promoter: Prof. Dr. Nico Vandaele
2.2. Literature review
Plentiful research has been conducted regarding the design of a resilient SC network. Although the
literature covers a wide variety of application areas, no authors have discussed how the theory applies
to an immunization distribution network. A schematic representation of the chapter can be found in
Appendix I. Firstly, it provides the key concepts of a SC network (see Section 2.2.1) and dives deeper
into the vaccine SC characteristics (see Section 2.2.2). Next, the challenges to which a SC network is
exposed are described (see Section 2.2.3), and an analysis of how to strengthen a network is given (see
Section 2.2.4). Ultimately, the goal of Chapter 2.2 is to determine the challenges that affect the
performance of immunization distribution networks and identify strategies that are applicable to
construct networks that perform well under major disruptions and challenges.
2.2.1. Supply chain network
A SC consists of four levels, i.e. suppliers, plants, distribution centers and customer markets. The
design of such a network involves multiple irreversible, long-term, strategic decisions (Lemmens,
Decouttere, Vandaele, & Bernuzzi, 2014). A SC network consists of all the operations to provide goods
and services through to the end consumer (Slack, Chambers, Johnston, & Betts, 2009).
Lemmens et al. (Lemmens et al., 2014) states that a main difficulty for designing a SC is the
incorporation of uncertainty. A SC network is exposed to risks from multiple hazards, ranging from
natural events and technological failures to intentional malicious acts. Moreover, disruptions in the
operation of these systems can have cascading impacts within the system. In addition to the effects of
direct damage to the physical transportation infrastructure, indirect damage to, for example the economy
and social systems may result (Faturechi & Miller-Hooks, 2014). The importance of thoroughly
assessing these disruptions is stressed by Klibi et al. (Klibi & Martel, 2013) who assert that, since
networks are designed to last for several years, they should be robust enough to cope with all the random
environmental factors affecting normal operations of a company as well as sustain their performance in
case of major disruptions.
2.2.2. Vaccine supply chain network
Lee et al define a country's vaccine SC as the complex system of locations, storage equipment,
vehicles, transportation routes and personnel that bring vaccines from a central location to the people
in need (Lee et al., 2016). UNICEF adds to this definition the importance of the cold chain and defines
the immunization cold chain as a series of storage and transportation links, all of which are designed to
keep the vaccine at the recommended temperature from the point of manufacturing until it reaches the
target beneficiary (Appendix II) (Government of India Ministry of Health & Family Welfare, 2016). A

5 Sarah Dewilde Cold chain distribution network design in developing countries Promoter: Prof. Dr. Nico Vandaele
typical immunization SC in a GAVI-eligible1 Sub Saharan (SS) country is set up in four levels. That is
national, regional, district and county levels and follow the administrative boundaries (Lee et al., 2015).
Unlike a commercial supply chain, the vaccine SC is not profit driven and all areas must be served,
despite limitations in infrastructure and resources (Yadav, Stapleton, & Wassenhove, 2013).
An efficient SC is essential to guarantee consistent availability of affordable, high quality vaccines
at all health service delivery points (Foster, Laing, Melgaard, & Zaffran, 2006; Tangcharoensathien et
al., 2008; Yadav, 2015). Unfortunately, inefficiencies remain ubiquitous and are stalling new vaccine
introductions (GAVI Alliance, 2016c), contributing to prolonged vaccine stock outs due to forecasting
errors (Lydon et al., 2017), wasting vaccines by accidentally exposing them to freezing or too warm
temperatures (Hanson, George, Sawadogo, & Schreiber, 2017), and constraining coverage by vaccines
not being available when and where they are needed (Lee, Assi, et al., 2012; Van Den Ent et al., 2017).
These inefficiencies occur due to the previously described complex nature of a vaccine SC as well as
to additional challenges specific to the design of an immunization distribution network, e.g. temperature
instability, unreliable power supply, lack of refrigerated trucks, unpredictable travel time, etc.
In order to help countries increase the effectiveness and efficiency of immunization delivery, strong
supply chains are key (GAVI Alliance, 2016a). GAVI has defined a strategy to strengthen immunization
supply chains and consists of five fundamentals (GAVI Alliance, 2016c), i.e. SC leadership, continuous
monitoring and improvement, reliable data, well-maintained and cost-effective cold chain equipment
(further referred to as CCE) and implementing SC redesign projects. In addition to the focus points of
GAVI, Yadav et al. (Yadav, Lydon, Oswald, Dicko, & Zaffran, 2014) advocate the importance of SC
integration between vaccines and other public health products. The most significant integration
opportunities can be found within storage and distribution through the bundling of assets and the
creation of economies of scale.
2.2.3. Supply chain challenges
It is clear that given the complexity and dynamic nature of supply chains, the potential sources of
challenges are manifold. Challenges are defined, following Wagner and Bode (Wagner & Bode, 2008)
as “the combination of an unintended, anomalous triggering event that materialises somewhere in the
SC or its environment, and a consequential situation which significantly threatens normal business
operations of the firms in the supply chain.” To obtain a clear overview of the challenges and where in
the SC they occur, a categorisation based on the source of the challenges is put forward. This
categorisation is, first, set out as applied to a general supply chain. Hereafter, vaccine SC challenges
are categorized accordingly.
1 Gavi is an international organization that was created to improve access to new and underused vaccines for children living in the world’s poorest country.

6 Sarah Dewilde Cold chain distribution network design in developing countries Promoter: Prof. Dr. Nico Vandaele
2.2.3.1. Categorization of challenges based on their source
Many scholars have proposed typologies and/or taxonomies of risks (Chopra & Sodhi, 2004;
Christopher & Peck, 2004; Hallikas, Karvonen, Pulkkinen, Virolainen, & Tuominen, 2004; Jüttner,
2005; Jüttner, Peck, & Christopher, 2003; Norrman & Lindroth, 2004; Spekman & Davis, 2004;
Svensson, 2000). This study divides the SC risk sources into two distinct classes: endogenous and
exogenous challenges. This is proposed by, among others, Trkmand & McCormack (Trkman &
McCormack, 2009) and Christopher & Peck (Christopher & Peck, 2004). It has been applied in the
context of a developing country by Tukamuhabwa (Tukamuhabwa Rwakira, 2015).
Both categories can be further subdivided. The endogenous challenges consist of three sub-
categories: supply-side, firm-level and demand-side challenges, which is in line with the categorisation
as proposed by Christopher & Peck (Christopher & Peck, 2004). In contrast to firm-level challenges,
supply and demand side challenges can be seen as internal to the SC network but external to the firm.
A schematic representation of this structure can be found in Figure 1.
The first originates from suppliers that are unable to deliver the materials that the company needs
to meet its production requirements and/or demand forecasts (Vereecke, Pandelaere, & Boeykens,
2011), e.g. inability to handle volume demand changes, failures to make delivery requirements, inability
to meet quality requirements, single supply sourcing, high capacity utilisation at any supply source,
leadtimes, etc (Ho, Zheng, Yildiz, & Talluri, 2015). The latter is the risk that the company will
experience demand that is not anticipated, and provisioned for, in the chain (Vereecke et al., 2011). In
particular, it relates to the processes, controls, assets and infrastructure dependencies of the
organizations downstream and adjacent to the focal firm (Christopher & Peck, 2004). Examples of
demand side challenges are, inaccurate demand forecasts, sudden shoot-up demand, high level of
service required by customers, and inadequate lead-times (Ho et al., 2015).
Demand challengesSupply challenges
Control challenges
Process challenges
Environmental challenges (geopolitical and economic)
Figure 1 - Schematic representation of SC risk sources

7 Sarah Dewilde Cold chain distribution network design in developing countries Promoter: Prof. Dr. Nico Vandaele
The firm level challenges include process challenges and control challenges. Process challenges
are associated with the variability of a company's operational processes, such as variations in production
cost, quality problems or the possibility of a product recall (Vereecke et al., 2011). Examples of process
challenges are operator absence, lack of experience or training, warehouse and production disruption,
insufficient maintenance, centralized storage of finished products, transportation breakdowns, capacity
etc. Controls are the assumptions, rules, systems and procedures that govern how an organization exerts
control over the processes. In terms of the SC they may be order quantities, batch sizes, safety stock
policies etc. plus the policies and procedures that govern asset and transportation management.
Examples of control challenges are e.g. unreliable planning and control systems, the impact of
introducing a new product and a lack of skilled employees (Vereecke et al., 2011).
In addition to challenges internal to the network, there are also challenges external to the network,
i.e. geopolitical challenges and economic challenges. The first category is best described as potential
governmental, natural and societal disruptions of SC operations across different geographical locations,
e.g. war, terrorism, natural disasters and data security (O’Marah, 2017). The latter category
encompasses challenges such as informal sectors, unfair competition, poor transportation infrastructure,
unstable taxation, exchange rate fluctuations and power shortages (Tukamuhabwa Rwakira, 2015).
2.2.3.2. Categorization of challenges specific to a vaccine supply chain
Weak health-care systems fail to reach children due to insufficient funds, limited human resources
and/or the inability to operate in certain areas (UNICEF, 2014). In what follows, each paragraph, first,
sets the boundaries of the challenge and provides examples mentioned during expert interviews.
Supply challenges
Supply risks include all challenges linked to the availability of vaccines at national level. 38 percent
of the 47 countries in SS Africa have reported at least one national-level stock out event for at least one
vaccine and for at least one month during 2015 (Lydon et al., 2017). A further analysis of these results
has indicated that in nine percent of cases, the stock-outs were due to a global supply shortage. Whereas
this master dissertation studies the in-country distribution of vaccines, a multitude of supply challenges
are found during the transportation to the country in question, e.g. tarmac time where vaccines are in
stored in non-cold chain environments waiting for the customs processes to be finished, long lead times
with ocean freight, stock in transit and the impact of the number of different parties involved
(Molenaers, 2017).
It is important to note that decisions taken at this stage in the SC can have a major impact further
downstream. Examples of such decisions are packaging, which changes how much storage is needed;
the use and size of various pallets and containers, which affects the equipment needed to move the
vaccines; and shipment timing, which can affect getting the vaccine to the point of delivery in time
(Kaufmann, Miller, & Cheyne, 2011).

8 Sarah Dewilde Cold chain distribution network design in developing countries Promoter: Prof. Dr. Nico Vandaele
Demand challenges
Demand challenges are primarily related to the sources of uncertainty linked to forecasting the
demand. The main challenge in terms of demand for vaccines is the large number of dispersed people
with different cultural backgrounds and beliefs. Furthermore, the strive for equity implies that also the
people in the most geographically isolated areas should have access to vaccines.
The lack of information throughout the system troubles the decision makers to properly forecast
the need for vaccines. Many countries do not have reliable data about past vaccine usage or accurate
projections of target populations and their locations. National vaccine forecasting is done using
population estimates, birth rates, infant mortality rates, vaccine waste rates, and prior-year estimates of
usage (Kaufmann et al., 2011). All of these estimates are inaccurate to some degree, because census
data are typically only brought up to date every ten years. The combination of inaccurate estimates
means that incorrect vaccine forecasts are replicated year after year (Kaufmann et al., 2011). Besides,
in the context of a developing country, additional difficulties to properly estimate the geographical
spread of demand are faced due to for example seasonally migrating populations and internally
displaced people due to conflict or disasters.
Process challenges
Process challenges cover all risks related to the physical flow of the vaccines from the national
warehouse to the final consignee. The challenges in this category are manifold. Firstly, cold chain
capacity is insufficient, and equipment is of poor in quality. In 2014, only 2 percent of the facilities
possessed optimal equipment and 34 percent of the facilities had none or only non-functional equipment
(Path & WHO, 2015). Related challenges include substandard installation, inconsistent preventive
maintenance and inadequate supplies of parts for repairs (Lennon et al., 2017). The lack of a stable
power supply is mostly countered through the utilisation of generator-driven or solar-driven fridges.
Generators are fuel driven, hence, need a timely supply of fuel. Moreover, they, too, can break down
and thus, timely maintenance, spare-parts and, ideally, back-up generators are required (Vleugels &
Van Roey, 2017). Inadequate transportation modes, absence of fuel, infrequent maintenance and the
lack of spare parts prevent vaccines to get to their destination. Furthermore, no warehouse or
transportation mode can be operated without people. The absence of skilled staff and geographical and
professional isolation in rural and remote environments are only two aspects mentioned that can pose a
threat to the SC (Vleugels & Van Roey, 2017).
Most systems are set up following a standard four-tier design template, without adjusting it for
country specific circumstances. This may cause excess of storage locations and transportation routes
(Lee et al., 2015). Additionally, risks can be related to the fact that delivery routes often follow
administrative levels rather than the shortest distance (Zaffran et al., 2013). Furthermore, information
systems are often non-existent (Zaffran et al., 2013) delivery frequencies are often not adapted to the
countries and large inventories are stored at multiple levels (Kaufmann et al., 2011).

9 Sarah Dewilde Cold chain distribution network design in developing countries Promoter: Prof. Dr. Nico Vandaele
Control challenges
Control challenges include those elements that pose a risk to the quality of the process. The lack of
data and information systems throughout the SC limits the potential of the supply chain. Inventory
management systems remain predominantly manual systems, especially further downstream in the SC
(Dowling, 2011). The shortfall of data visibility induces a lack of coordination on many levels, which
can cause high quantities of vaccines to be ordered, resulting in improper storage and ultimately waste
(Kaufmann et al., 2011).
A reliable SC requires a reliable workforce. Yet, the staff in immunization supply chains in
developing countries are often unqualified, poorly trained, un-empowered and poorly managed
(Vleugels & Van Roey, 2017). Besides training, other elements such as a lack of supervision or contact
with supervisors, absence of a trust relationship between the employee and the supervisor, inadequate
professional and personal facilities, misaligned pay and conditions and workload affect staff
satisfaction, turnover, and the ability of staff to complete their job satisfactorily (Dowling, 2011;
Hawthorne & Anderson, 2009; WHO, 2010).
Another point of misalignment originates from the way the distribution is organized. Demand in
the SC is typically based on pull mechanisms. That is, health centres determine their own requirements
and place orders themselves. In practice this has a number of drawbacks. Medical professionals are not
logisticians and often cannot forecast effectively. This can cause over-ordering or emergency ordering
to occur, resulting in dramatic fluctuations in stock levels. Arranging dedicated transport can also be
problematic (GAVI Alliance, 2016b).
Environmental challenges
Although significant strides on the social, political and economic fronts are made since the turn of
the 21st century, contextual challenges remain ubiquitous in SS Africa (UNDP, 2017). Sub-Saharan
Africa is made up of 48 extremely diverse countries, differing in size of their economies, level of
development, dependency on exports of commodities and the effectiveness of state institutions and
domestic political arrangements. Despite all the differences some generally present challenges can be
observed.
Geopolitical challenges
Conflicts remain pervasive throughout the continent and have major consequences to successfully
deliver vaccines to the people in need. Civil wars fought along ethnic and political lines result in, among
others, killed and displaced people, unavailable health workers, broken infrastructure, lack of funds,
increased insecurity and demolished health facilities. Islamist extremist groups, e.g. Boko Haram, are
likely to target Western interests putting people related to Western organisations at risk (Cummings,
2016). Furthermore, coups and corruption undermine the attractiveness of the region for international
funding and private investments that could enhance the availability of vaccines.

10 Sarah Dewilde Cold chain distribution network design in developing countries Promoter: Prof. Dr. Nico Vandaele
Above all, the unstable political climate limits the development of the region, resulting in
inadequate economic and social infrastructure such as transport, energy, health and education.
Underdeveloped road and transportation infrastructure might as well be one of the major challenges for
the immunization supply chain. It prolongs the time in transport, it can impede the quality and safety of
the vaccines and it curbs the accessibility of certain areas either seasonally or all-year round (Vleugels
& Van Roey, 2017). The inaccessibility puts stress on the equitable coverage of the immunization
supply chain. Furthermore, the absence of reliable power supply in numerous countries in SS Africa
makes cold chain maintenance difficult. The health facilities and intermediate depots must rely on costly
generators, frozen icepacks, cold boxes and consistent transportation to remote health facilities (Li,
2011). Certain countries in the region face difficulties with regards to mobile connectivity, limiting data
visibility and information sharing throughout the supply chain.
One cannot deny the importance of climate change anymore. Its repercussions will be felt in various
ways throughout both natural and human systems in Sub-Saharan Africa (Serdeczny et al., 2017). With
rainy seasons occurring every year and weather models doing a good job at predicting tropical storms
these challenges are rather easy to predict, and thus should be included in the design of the supply chain.
Economic challenges
The economic environment challenges many markets in SS Africa. Dramatic currency fluctuations,
depressed prices on commodities such as oil and copper, and sluggish demand from China and Europe
(Africa's largest trade partners) have put pressure on the region's economies (Rosenberg, 2015). Even
in the regions where growth remains strong, in many cases it continues to rely on public sector spending,
often at the cost of rising debt and crowding out of the private sector (IMF, 2017). The severity of this
threat can be illustrated by the fact that, in 2015, 39 percent of the national level vaccine stock-outs
were caused by funding delays2.
Additionally, financial constraints lead to an insufficient level of resources allocated to health care.
One of many examples that illustrate the impact of the lack of funding at peripheral level is the
unavailability of funds to buy fuel for transportation or generators, or the delayed payment of wages.
2.2.4. Distribution network resilience – How to cope with the challenges?
Analysing and classifying the challenges is only the tip of the iceberg. The essence evolves around
adapting the design of the network accordingly, i.e. creating resilient networks (Besiou, Pedraza-
Martinez, & Van Wassenhove, 2014). In 2017, a review of resilience in transportation was conducted
and a scheme linking all concepts related to resilience in current literature was developed (Figure 2)
(Abubakar, Mahfouz, & Arisha, 2017; Sheffi & Rice Jr, 2005; Wan, Yang, Zhang, Yan, & Fan, 2017).
2UNICEF is unable to ship vaccines to a country unless payment is received upfront, the common delays in government releasing funds to pay UNCEF for the purchasing of vaccines invariably leads to a stockout (Lydon et al., 2017).

11 Sarah Dewilde Cold chain distribution network design in developing countries Promoter: Prof. Dr. Nico Vandaele
2.2.4.1. A resilient system
A network is characterised as resilient when it performs well and delivers products and services
under challenges such as discussed in Section 2.2.3. This is defined as the ability to resist, absorb and
adapt to challenges (Bruneau et al., 2003) and return to normal functionality (Faturechi & Miller-Hooks,
2014). In general, a resilient system can be summarised into five capabilities: the ability to anticipate,
adapt, respond, recover and learn (Abubakar et al., 2017). A definition of each capability can be found
in Appendix III. The five relate to the full range of SC risk management strategies and thus provide a
mechanism to cope with risks and changes from varied sources (Abubakar et al., 2017). The abundance
of challenges and the widespread impact underscores the importance of creating resilient systems.
Figure 2 provides an overview of all concepts related to a resilient system, based on the disruption
profile created by Yossi Sheffi (Sheffi & Rice Jr, 2005). Firstly, it can be seen that the resilience of a
system is summarized in four concepts: reliability, redundancy, robustness and recoverability of the
system. Redundancy refers to the existence of alternatives to mitigate adverse impacts of challenges.
Robustness can be understood as the extent to which the network is able to create value for any plausible
future scenario (Klibi & Martel, 2013). It serves as a buffer to remain stable when exposed to a
disruption (Faturechi & Miller-Hooks, 2014) and entails proactive anticipation of change before it
occurs (Wieland & Marcus Wallenburg, 2013). Recoverability includes flexibility and adaptability.
Flexibility designates the ability to respond to a changing environment in a timely matter. Adaptability
can be understood as the ability to develop different responses to match the nature of the challenges it
faces. These characteristics determine the overall performance of a distribution system on how long it
can perform without failing, what actions it will take in the face of a disruptive event, how performant
the system will be after being disrupted and how it reaches a new equilibrium (Wan et al., 2017).
The framework in Figure 2 is especially useful since it demonstrates the important distinction
between pre-disruption elements and during disruption elements. It can be seen that the notions of
Figure 2 - A resilient system

12 Sarah Dewilde Cold chain distribution network design in developing countries Promoter: Prof. Dr. Nico Vandaele
redundancy and robustness, relate mainly to actions taken before a disruption occurs, whereas,
flexibility can be associated with actions occurring after a disruptive event. Sheffi stresses that there is
significantly more leverage in making supply chain flexible than there is in adding redundancy (Sheffi
& Rice Jr, 2005). In literature discussing mitigation strategies, a similar classification is put forward,
using the ideas of proactive, concurrent and reactive strategies (Abubakar et al., 2017).
2.2.4.2. Mitigation strategies
The aim of mitigation strategies is to prepare for, respond to and recover from SC disruptions,
which can be linked to the disaster management cycle often referred to in humanitarian logistics
literature. This cycle, Figure 3, contains four stages: preparedness, response, reconstruction, and
mitigation (Tomasini & Van Wassenhove, 2009). The first two stages, preparedness and response,
mitigate the effect of crises (Besiou et al., 2014). These strategies can be categorised depending on the
moment of implementation, i.e. proactive, concurrent and reactive (Abubakar et al., 2017).
Proactive strategies, on the one hand, refer to competencies needed in the pre-disruption phase.
Concurrent strategies, on the other hand, relate to quick reactive thinking and first-response abilities to
cope with disturbances in the during-disruptions phase (Hollnagel, Pariès, Woods, & Wreathall, 2010;
Sheffi & Rice Jr, 2005). Finally, reactive strategies refer to what is required in the post-disruption phase
so as to recover (Abubakar et al., 2017). The aforementioned categories can be related to the capabilities
of the system, as illustrated in Figure 2.
The complex nature of a distribution network implies that these strategies can influence one
another, which can be both beneficial, creating synergies, as well as harmful, provoking trade-offs to
be made. This can be illustrated with the complex interplay between transportation and storage.
Increasing storage, for example, implies a decrease in supply frequency, however it can cause
transportation bottlenecks to worsen (Trkman & McCormack, 2009). Implementing a particular
resilience strategy can produce another threat, either at the same or at a different point in the supply
network. In order to maximise the effectiveness of the earlier described strategies, continuous
adaptation and a holistic approach are essential.
B
C
D MITIGATION
Part of the humanitarian logistics stream
RECONSTRUCTIONConsists of an immediate response and restore phase
Part of the humanitarian logistics stream.
RESPONSE
Part of the humanitarian logistics stream
PREPAREDNESS
A DISASTER MANAGEMENT
CYCLE
Figure 3 - The humanitarian logistics stream cycle

13 Sarah Dewilde Cold chain distribution network design in developing countries Promoter: Prof. Dr. Nico Vandaele
2.2.4.3. Mitigation strategies in a vaccine supply chain
UNICEF's vision states: “A world where no child dies from a preventable cause, and all children
reach their full potential in health and well-being”. A key action to achieve this is increasing the
resilience of both delivery systems and communities in absorbing and recovering from external shocks,
including from public health emergencies and outbreaks (UNICEF, 2009). In what follows, a more
thorough analysis of strategies is provided categorised by moment of occurrence.
Proactive strategies
Ideally, the design of a resilient network starts at the very beginning in the contingency planning
process, when the focus should be on identifying ways to strengthen the resilience of the health care
facility in terms of its functioning and physical structure (ICRC, 2015). At warehouse level this, among
other, concerns the presence of a skilled and adequate workforce that is able to perform frequent
maintenance works (Vleugels & Van Roey, 2017). Extensive training and follow-up of the health
workers decreases the likelihood of man-made mistakes. As to equipment, the procurement of off-grid
fridges, which can be generator or solar driven, eliminates the impact of an unreliable power grid.
Furthermore, a well-established inventory system ensures that stocks have the longest possible
remaining shelf life allowing to bridge a maximum of time in case of an emergency (ICRC, 2015).
Next, focus should be on strengthening the coordination and cooperation with other health-care
providers. In this context, data visibility is key. The implementation of Electronic Vaccine Intelligence
Networks (eVIN), for example, enables immunization managers to see when to buy more vaccines, how
much to order, and even which fridge needs maintenance. The data visibility by eVIN reduces vaccine
stock-outs (Levine, 2017). However, basic telecommunication networks need to be in place.
Finally, advances in the development of vaccines can significantly reduce the impact of possible
challenges. Smart vaccines, for example, could be a game-changer in resource-poor countries. Their
production is rapid and low-cost, and they remain stable, safe and effective without refrigeration which
has a major beneficial impact on the complexity of the distribution network (Levine, 2017).
Concurrent strategies
Concurrent strategies are all about managing and adjusting resources, as well as maintaining
control in the event of a SC disruption. Here, the trade-off is often between speed and inventory, or,
respectively, between a “fast” or a “slow” cold chain. A fast cold chain’s supplies cover less than a
month, whereas a slow cold chain’s supplies cover over a month or more (WHO, 2008). A fast cold
chain may mean higher distribution costs, but the costs are compensated for in part by placing smaller
quantities of vaccines in circulation. A slow cold chain reduces the costs of vaccines distribution but
increases the quantity of supplies in circulation. This trade off clearly denotes the choice between
flexibility and redundancy (Sheffi & Rice Jr, 2005). In cases where health facilities are inaccessible
during several months of the rainy season, WHO recommends a slow cold chain. These facilities would
then receive enough vaccines and supplies to cover the entire period of inaccessibility (WHO, 2008).
14 Sarah Dewilde Cold chain distribution network design in developing countries Promoter: Prof. Dr. Nico Vandaele
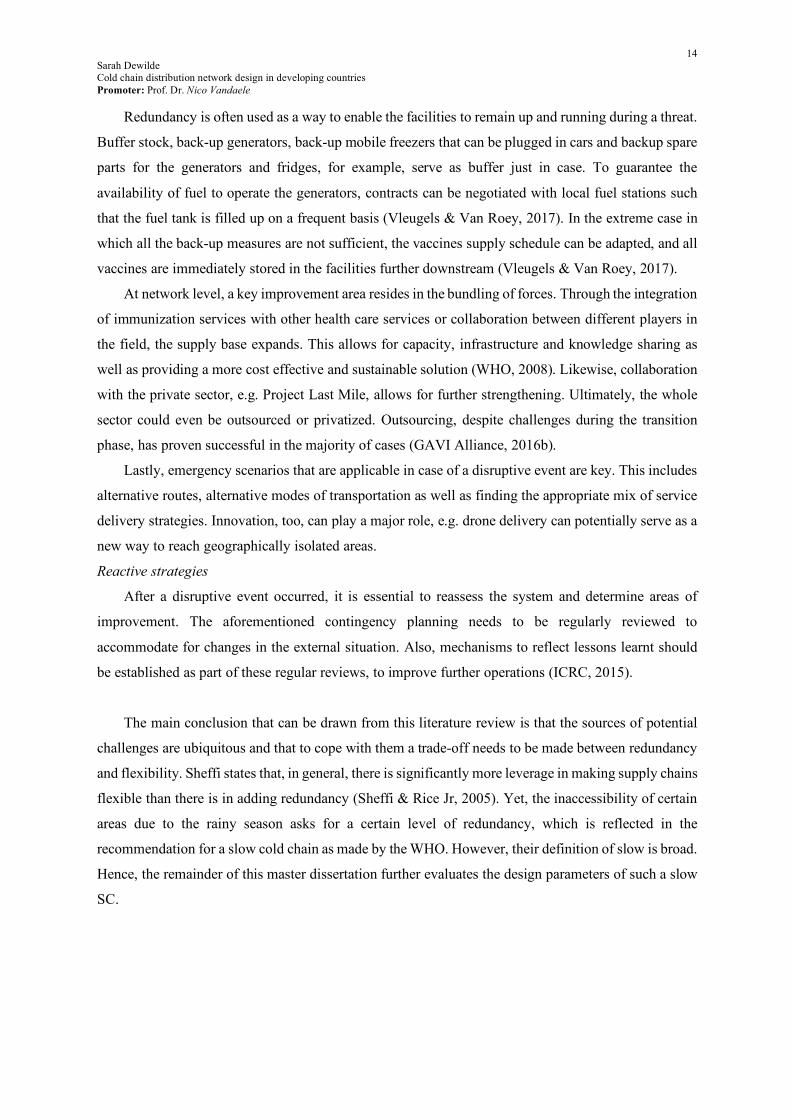
Redundancy is often used as a way to enable the facilities to remain up and running during a threat.
Buffer stock, back-up generators, back-up mobile freezers that can be plugged in cars and backup spare
parts for the generators and fridges, for example, serve as buffer just in case. To guarantee the
availability of fuel to operate the generators, contracts can be negotiated with local fuel stations such
that the fuel tank is filled up on a frequent basis (Vleugels & Van Roey, 2017). In the extreme case in
which all the back-up measures are not sufficient, the vaccines supply schedule can be adapted, and all
vaccines are immediately stored in the facilities further downstream (Vleugels & Van Roey, 2017).
At network level, a key improvement area resides in the bundling of forces. Through the integration
of immunization services with other health care services or collaboration between different players in
the field, the supply base expands. This allows for capacity, infrastructure and knowledge sharing as
well as providing a more cost effective and sustainable solution (WHO, 2008). Likewise, collaboration
with the private sector, e.g. Project Last Mile, allows for further strengthening. Ultimately, the whole
sector could even be outsourced or privatized. Outsourcing, despite challenges during the transition
phase, has proven successful in the majority of cases (GAVI Alliance, 2016b).
Lastly, emergency scenarios that are applicable in case of a disruptive event are key. This includes
alternative routes, alternative modes of transportation as well as finding the appropriate mix of service
delivery strategies. Innovation, too, can play a major role, e.g. drone delivery can potentially serve as a
new way to reach geographically isolated areas.
Reactive strategies
After a disruptive event occurred, it is essential to reassess the system and determine areas of
improvement. The aforementioned contingency planning needs to be regularly reviewed to
accommodate for changes in the external situation. Also, mechanisms to reflect lessons learnt should
be established as part of these regular reviews, to improve further operations (ICRC, 2015).
The main conclusion that can be drawn from this literature review is that the sources of potential
challenges are ubiquitous and that to cope with them a trade-off needs to be made between redundancy
and flexibility. Sheffi states that, in general, there is significantly more leverage in making supply chains
flexible than there is in adding redundancy (Sheffi & Rice Jr, 2005). Yet, the inaccessibility of certain
areas due to the rainy season asks for a certain level of redundancy, which is reflected in the
recommendation for a slow cold chain as made by the WHO. However, their definition of slow is broad.
Hence, the remainder of this master dissertation further evaluates the design parameters of such a slow
SC.

15 Sarah Dewilde Cold chain distribution network design in developing countries Promoter: Prof. Dr. Nico Vandaele
3. Methodology 3.1. Methodology
Over the course of the last years numerous papers have discussed the design of supply chains under
uncertainty and disruptions. Whereas mathematical models are often adopted, this dissertation will
make use of the simulation technique. This allows to assess the impact of mitigation strategies
throughout the whole network without neglecting the interrelatedness of strategies and challenges. First,
this section discusses the main methods that are used in the state-of-the-art literature. Hereafter, the
choice for the simulation technique is clarified, then a brief description of the required data is given.
3.1.1. Common methods in literature
The two main streams in Operations Research literature regarding resilience are the papers
conducting research through mathematical modelling versus those applying the simulation technique.
The first stream approaches the SC network design problem as an optimization problem and often
involves mixed-integer programming or stochastic programming. Traditionally, the mathematical
formulation of the SC design has been based on the facility location problem (Geoffrion & Graves,
1974). Related to SC resilience, the problem involves selecting locations, establishing their storage
capacity, and determining a distribution strategy that anticipates potential disruptions at distribution
centres (Garcia-Herreros, Wassick, & Grossmann, 2014). The main challenge when considering SCs of
significant size is given by the number of scenarios. In addition to the NP-hardness nature of the SC
network design problem under uncertainty, mathematical models may not capture all of the complex
interactions and uncertainty of the entire system (Brown & Lee, 2011; Lemmens et al., 2014) and is
therefore not desirable in the context of this master dissertation.
A second stream of literature approaches the design problem from a simulation point of view.
Simulation is a powerful tool to validate obtained policies in uncertain decision-making environments
(Govindan et al., 2017). It allows decision-makers to simulate operational, structural, policy,
procurement, technological, and managerial changes to the SC and to visualize the impact on cost and
various operational measures (Path & WHO, 2011). Simulation models are virtual representations of
the entire system and therefore serve as a ‘virtual real world’ to test and assess new configurations or
technologies (Brown & Lee, 2011). In the context of vaccine distribution, various research has been
conducted using the simulation method. The existing research considers the introduction of new
vaccines and technology (Lee, Assi, et al., 2012; Norman et al., 2013), altering characteristics of
vaccines and other technologies (Lee et al., 2011; Lee, Cakouros, et al., 2012), changing configuration
and operations of the SC (Assi et al., 2013), investing or allocating resources (Haidari et al., 2013) and
optimizing vaccine delivery (Brown et al., 2014).
Simulation makes it relatively easy to look at different scenarios for the vaccine SC, including
those radical ideas that would not be possible to test in real life, and create SC blueprints. Since, it is

16 Sarah Dewilde Cold chain distribution network design in developing countries Promoter: Prof. Dr. Nico Vandaele
essential to consider the overall picture, simulation seems a more suitable method for the context of this
master dissertation. Nevertheless, one needs to remember that models are simplified representations of
reality and cannot capture every factor that could affect the delivery of vaccines (Lee et al., 2016).
3.1.2. The simulation method as applied in this dissertation
Setting up a successful and trustworthy simulation study involves numerous steps. In the first phase
a conceptual model, e.g. under the form of a flow-chart, is created. The objective of this step is to
capture the system logic and data necessary for the simulation modelling activity (Persson & Olhager,
2002). Secondly, the ‘as-is’ SC is evaluated, i.e. a critical assessment of the current locations is
conducted with corresponding capacities, routes, transportation modes and their respective capacities,
etc. and also an exhaustive analysis of the operating context. In this step it is essential to obtain high
quality data from partners involved in the distribution of vaccines in the chosen region as well as to
obtain a deeper understanding of key issues, insights and contextual concerns. This can be obtained
through a so-called STEEP (Social, Technological, Economic, Environmental, and Political) analysis.
The outcome is a model of the current situation and an evaluation of what the future may look like.
A computer simulation model is constructed using the Anylogic simulation software, then, verified
and finally validated. Verification means testing the model against the conceptual model and making
sure all elements behave as they should. In the validation step, the model is tested against itself (Persson
& Olhager, 2002). The simulation encompasses five years.
In first instance, a base case analysis will be performed that allows to determine bottlenecks.
Hereafter, scenarios are constructed to overcome potential challenges to the system, these are based on
the mitigation strategies as discussed in the Section 2.2.4.3. Ultimately, the results will be used to
formulate recommendations for policy-makers.
3.1.3. Required data
First of all, a suitable country needed to be chosen. It was essential for our study that the country’s
vaccine SC was affected by a recurring threat. Therefore, it was chosen to evaluate Madagascar’s
current situation and the influence of the rainy season (see Section 0). Data were collected from a wide
variety of sources, i.e. online sources such as the WHO website, GAVI online resources, TechNet 21,
etc. as well as personal sources, mainly via Andry Fidele Ravalitera, from UNICEF Madagascar.
The data needed are three dimensional. Firstly, supply side data are needed. This includes the
geographical location of health facilities and warehouses, their respective capacities, the transportation
modes with corresponding capacities and the operating methods (delivery strategies, push or pull
strategies, etc). This information can be gathered through organisations such as UNICEF, Logistics
Cluster, etc. Secondly, demand side data are essential. This corresponds to the population dispersion
and the number of people in need related to each health facility as well as the ease of reaching the

17 Sarah Dewilde Cold chain distribution network design in developing countries Promoter: Prof. Dr. Nico Vandaele
population. Thirdly, information is needed to gain a deeper understanding on the context, its issues and
possible solutions. Thorough web research, interviews with people familiar with the geographic area as
well the distribution of vaccines in challenging contexts give an idea of the contextual barriers.
Andry Fidele Ravalitera, from UNICEF, provided an EVM3 analysis conducted in 2014, a Health
System Strengthening Cash Support proposal form conducted in 2014, the Health Sector Development
plan for the period of 2015 to 2019 proposed in 2015, and an application for support from the cold chain
optimisation platform from September 2016. In addition to this, raw data was obtained providing
insights in the trimestral needs per district per vaccine for the routine immunization delivery, as well as
the needs for the immunization campaigns conducted in August and September of 2015. Lastly, an excel
file combining 114 other files from 2017 was obtained containing population data, health facility
location and capacity data and resources per district.
The aforementioned files provided insights in the CCE inventory, transportation resources, target
population and target basic health centers from 2017. The data with regards to transportation axes and
routine trimestral needs are from 2015. Information on the needs at central level as well as the vaccines
included in the program and the central level capacity were only available from 2014. Even though
more data than expected was made available, numerous assumptions were required. The different years
of creation of the source documents caused deviations that were to be corrected for. Additionally,
elements such as vehicle capacity, fridge capacity, transportation waste percentages, failure rates, vial
size, transportation schedule and personnel per site were unavailable, hence, assumptions were made.
Finally, it is important to note that due to the challenging context of a developing country and the non-
commercial character of the supply chain, the data needs to be used with care. The practices as they
appear on paper often deviate from what actually happens in real life.
3 An analysis that helps to uncover important shortcomings in the performance of many countries’ immunization supply chains.

18 Sarah Dewilde Cold chain distribution network design in developing countries Promoter: Prof. Dr. Nico Vandaele
4. Case study: Madagascar This chapter provides an answer to an adjusted version of the research question being: “What
strategies can be considered to adapt the immunization distribution network of Madagascar so as to
limit the impact of the five months of isolation due to the rainy season?”. After an introduction to
Madagascar (Section 4.1) and an introduction to the current vaccine SC in Madagascar (Section 4.2),
the challenges to the system are categorized according to the taxonomy of Tukamuhabwa
(Tukamuhabwa Rwakira, 2015) as discussed in Section 2.2.3.1. A discrete-event simulation model
(Section 4.3) allows to assess the current situation (Section 4.5), based on certain performance
indicators (Section 4.4), and compare it to different scenarios to enhance the situation (Section 4.6).
Finally, a critical assessment of the results is provided (Section 4.7) and discussed (Section 4.8).
4.1. Madagascar in a nutshell
Madagascar is the fifth largest island in the world and located in the Indian Ocean (Worldbank,
2017). What could have been a flourishing paradisiac island ranks among the ten poorest countries in
the world. The extreme poverty - the average Malagasy is 42% poorer today than in 1960, the year of
independence - creates challenges for the health care system in terms of affordability and accessibility.
88% of the people live in rural areas which causes 50% of them to live beyond five kilometers from a
health facility, with some villages located 100 kilometers from the nearest health facility (Van Den Ent
et al., 2017). This refrains Madagascar from providing equitable access to immunization.
In 2017, the total population amounted to 25.612.861 and an annual birth cohort of 865.588 infants
(Gavi Alliance, 2017). Madagascar is a young country that is expanding quickly, at a growth rate of
2,7%, which will put additional stress on the already limited capacity to deliver basic services across
the country and on its natural resources. Clearly, this will result in an increase in vaccines needed.
After a coup in 2009, the country became ineligible to receive international aid during a period of
unprecedented international investment in global health (Bonds et al., 2017). Additionally, political
crises have had a significant influence on the economy in Madagascar. It brought along uncertainty for
the investors with many private firms reducing their operations or halting activities altogether
(Worldbank, 2017). Since the democratic elections in January 2014, Madagascar's newly recognized
government has become eligible for official aid from foreign governments, creating a singular
opportunity for transforming the national health system (Bonds et al., 2017).
The unfavorable investment climate has caused Madagascar to lag behind in terms of technology
and infrastructure. When comparing the statistics of Madagascar with the average statistics for the SS
countries a significant gap is noticeable. The rate of access to electricity was merely 17% in 2014
whereas the SS average is at 37%. In Madagascar on average 42% of the people have a mobile cellular
subscription, albeit a 74% for SS Africa. Furthermore, only 5% of the population uses internet, whereas
20% of the SS population does (Worldbank, 2017). The current state of the Malagasy infrastructure,
too, scores below average. In the latest global competitiveness index report from the World Economic

19 Sarah Dewilde Cold chain distribution network design in developing countries Promoter: Prof. Dr. Nico Vandaele
Forum, Madagascar ranks 133rd out of 139 concerning infrastructures. The state of the existing road
network is the 5th worst in the world as well as the electricity and telephony infrastructure being the
4th worst in the list. This puts a burden on communication and data sharing, key elements of a properly
functioning SC (World Economic Forum, 2017) and limits the implementation of new data solutions
such as mHealth or Logistimo, as these rely on mobile connectivity.
Madagascar is one of the most exposed countries to climate-related disasters. Recurring cyclones,
floods, droughts and locust invasions have affected the lives of more than half the population (USAID,
2017) and coping with them is constrained due to the weakness of the public infrastructure and services.
These cause roads to be blocked, bridges to collapse, areas to be unreachable, power to be unstable, etc.
Climate change threatens the wellbeing of both the country’s biodiversity and its people. It is predicted
that the number and severity of cyclones will increase. Finally, sea level will rise around Madagascar
endangering the numerous communities and ecosystem at its endless coastline (USAID, 2017). The
impact of the aforementioned events can be enormous. The most recent cyclone, Enawo in 2017,
affected over 430.000 people with an estimated economic loss equivalent to four % of the gross
domestic product. The three consecutive years of severe drought caused massive crop failure in 2016,
putting some 850.000 people, more than half of the population of the south of the island, in the
emergency or crisis phases of food insecurity (USAID, 2017). Appendix IV provides an overview of
the areas that are affected by recurring environmental challenges (FEWS NET, 2013).
The status of Madagascar’s immunization program reflects the challenging environment of the
country (Van Den Ent et al., 2017). The political crisis and international boycott led to a decrease of the
available budget by 65 %. In 2016, an average immunization coverage of 74 % was found. An overview
of the immunization coverage over time can be observed in Appendix V. At the same time, the article
by Van Den Ent et al. states that immunization inequities are apparent. The aforementioned article (Van
Den Ent et al., 2017) sets forth that in Madagascar “A child living in a family from the wealthiest Figure 4 - Immunization supply chain in Madagascar

20 Sarah Dewilde Cold chain distribution network design in developing countries Promoter: Prof. Dr. Nico Vandaele
quintile is 1.5 times more likely to be vaccinated than a child living in a family from the poorest quintile.
Children living in the Itasy region, a more affluent region, are 3.4 times more likely to be vaccinated
than children living in the Menabe region, a poorer region characterized by remote areas with difficult
access to care. A child with an educated mother is 1.7 times more likely to be vaccinated than a child
whose mother is not formally educated”.
4.2. Malagasy vaccine supply chain
Figure 4 depicts the structure of the entire Madagascar vaccine supply chain. It consists of four
levels, whose functional units include one central depot in Antananarivo, 22 regional depots, 112 district
depots and 3011 basic health centers (BHC). As can be observed in Figure 4, the central depot receives
vaccines from the manufacturers via UNICEF on a trimestral basis, which is slow according to WHO
norms. From the central warehouse the vaccines are transported to the regional level. The shipments
are conducted four times a year and are fulfilled either by cold trucks, normal trucks or planes.
Subsequently, the regional level resupplies the districts by means of motorcycles or pick-ups. A
different path is followed for the supply of 38 districts that are either close to an existing transportation
axis or that suffer from geographical isolation. These districts are supplied immediately from the central
level. Vaccine administration occurs daily at BHC level, and the number of BHCs per district ranges
from 6 to 90. An overview of the transportation routes is displayed at the right-hand side of Figure 4.
Lastly, vaccines are provided to the BHCs every month, either by the BHCs picking them up, or
by the districts delivering to them, or on the basis of an agreement between districts and BHCs. When
the BHCs are not equipped to store a month’s supply, they can pick up vaccines on a more regular basis.
Figure 5 - overview of CCE
The ratio indicates the number of times the demanded order size can be stored in respectively all the fridges, 20% of the fridges, or when only using the solar fridges. The red tinted areas indicate that the CCE is insufficient to store all vaccines demanded in a trimester, the dark blue areas imply a significant excess of CCE in the districts.

21 Sarah Dewilde Cold chain distribution network design in developing countries Promoter: Prof. Dr. Nico Vandaele
One week before transportation occurs a phone call is made to the involved warehouses, presumably to
obtain insights on current stock levels and desired order size.
Each vaccine storage location needs to be equipped with CCE in order to provide the right
circumstances to store the vaccines. Walk-in refrigerators and freezers are utilized at the central level.
The cold chain storage at central level is recorded in the official documents and amounts to 38.571,00
liters. At central level, 45% of all CCE is obsolete, at BHCs level this increases to 53%. Approximately
18% of the BHCs possess no or unrepairable CCE which puts a burden on the quality of the vaccines.
In order to enhance its CCE situation, Madagascar applied for CCE support from GAVI.
A summary of storage and transportation devices in Madagascar and their assumed net capacity
can be found in Appendix VI. Figure 5 provides an overview of the distribution of CCE in the country
relative to the CCE needs. It can be seen that, even in the case where 80% of the fridges is obsolete or
when only solar refrigerators are operational, a significant amount of excess CCE is present in numerous
districts. Nevertheless, multiple areas are identified in which the CCE is not sufficient to safely store
the vaccines needed. This indicates that little to no equipment is repaired or disposed of, and that the
data are not corrected for these events. Additionally, the uneven distribution of the equipment
throughout the country restrains the system from providing equitable access to vaccines.
There are important bottlenecks in the supply of immunization services. These include the shortage
of qualified immunization personnel, geographic inaccessibility, outages in the supply of vaccines and
the absence or non-functionality of the cold chain for the storage of vaccines, as well as the shortage of
replacement parts or the scarcity of kerosene. The operational status of the fuel powered equipment
varies from 40% to 80%. To overcome the problem of replacement parts and energy source, i.e. poor
quality of kerosene and unreliable energy grid, solar refrigerators are being introduced gradually.
Central warehouse
Regional warehouse*
District warehouse
District warehouse
District warehouse
Regional warehouse
Supply scheme does not change throughout the year. The regional and district transportation routes are not
impacted by the rain season.
Case A – all year round supply
Supply scheme is interrupted
throughout the rainy season from the
central warehouse onwards.
Case D – interrupted rain season supply
*5 regional warehouses inaccessible: Farafangana DRSP, Fenerive Est DRSP,Maintirano DRSP, Sambava DRSP,Moramanga
Stream of vaccines
Cancelled stream during rainy season
District warehouse
Direct resupply from central warehouse
cancelled throughout rainy season.
Case B - interrupted rain season supply
Regional warehouse
District warehouse
Supply scheme is interrupted
throughout the rainy season from the
regional warehouse onwards.
Case C – interrupted rain season supply
Figure 6 - Resupply cases during rainy season

22 Sarah Dewilde Cold chain distribution network design in developing countries Promoter: Prof. Dr. Nico Vandaele
A major burden for the system is the periodical inaccessibility due to the rainy season. The
geographical dispersion of the affected areas can be assessed in Appendix VII. From November to April
685 BHCs spread over 30 districts are impossible to reach, affecting approximately 6 million people.
Based on the above, four scenarios to resupply the sites were constructed (see Figure 6). Case A, in
which the routes remain unchanged is the most common scenario. Case B occurs when the direct
resupply from the central warehouse to the district level can no longer take place. This impacts 7
districts. Case C, where the regional warehouse can still be supplied, however, no further distribution
to district level is possible, affecting 11 districts. Finally, case D where even distribution to the regional
level is hindered, hits four regional warehouses and 13 districts. This study aims to identify distribution
network design changes that reduce the impact of these five months of isolation.
The challenges that have been identified throughout this section and the previous section (Section
4.1) are categorized according to the taxonomy of Tukamuhabwa (Tukamuhabwa Rwakira, 2015) as
discussed in section 2.2.3.1. An overview can be found in Table 1.
Table 1 - Categorization of identified challenges to the immunization SC in Madagascar
Threat category Examples from the immunization supply chain in Madagascar
Supply challenges Shortages on the global vaccine market causing insufficient vaccines to be distributed
to the country
Demand challenges Rurality and geographical spread of the population, rapidly growing population, poor
forecasting due to lack of data
Process challenges Obsolete CCE, shortages of replacement parts for both refrigerators and vehicles,
scarcity of kerosene
Control challenges Shortage of qualified personnel, lack of data sharing and information systems, no
adjustment for actual demand
Exogenous
challenges
Geopolitical challenges: political instability causing decreased international aid,
unfavorable investment climate leading to decreased investments in infrastructure and
industry and challenges caused by climate change and Madagascar’s geographical
situation
Economic challenges: decrease in private sector activity
4.3. Model description
A discrete-event simulation model representing the vaccine SC in Madagascar was constructed
using AnyLogic. This multimethod simulation software, developed by the AnyLogic Company, was
chosen because of its high flexibility and unlimited expansion possibilities thanks to its Java context.
The intuitive interface, clear visualization and click-and-play implementation of GIS, geographical
information systems, allowed to reduce the needed development time and technical troubles.
Nonetheless, Java knowledge was an indispensable asset throughout this research.

23 Sarah Dewilde Cold chain distribution network design in developing countries Promoter: Prof. Dr. Nico Vandaele
The model simulates the operational policies, storage facilities, transportation procedures and
resources in the Madagascar vaccine supply chain. It represents the flow of vaccines from arrival at the
central storage facility in Antananarivo, Madagascar, through each subsequent level of the supply chain,
to the district level where the basic health centers pick up their vaccines. Official documents state that
22 regional warehouses are present in the country. The model, however, only considers regional
warehouses as such when they resupply district sites. Data regarding the routine immunization planning
include 16 regional depots that match the definition. The warehouse that is assigned as regional
warehouse in the six other regions, actually functions as a district warehouse and is hence considered
as a district warehouse. An overview of the regional warehouses can be found in Appendix VIII. For
example, Miarinarivo is indicated as being a regional warehouse, however, it serves its purpose as a last
level warehouse. It does not resupply any other district; hence it is seen as a warehouse at district level.
The demanded vaccines and the target population have been adjusted to 2017 to account for an
annual 2,7% population growth rate. From the target population per district, the newborns are derived
based on an annual birth cohort of 3,38%. These are assumed to be equally spread over the BHCs and
are used as a proxy for the demand at BHC level. Throughout the simulation the supply from UNICEF,
the demand at district level and the demand from BHCs grow with the population growth rate. The used
vaccine schedule was discussed in the EVM analysis of 2014 and can be found in 0. In total 21 vaccines,
with a weighted average of 5,33 cm3 per vaccine, rounded to 5 cm3, are needed to immunize a child.
This study uses a representative vaccine instead of modelling every vaccine separately to limit the
complexity of the model. This implies that they are distributed in perfect correspondence to the ratio
required to immunize one child. Additionally, this entails that no drill down is possible on the
availability of the different vaccines in the system and that no supply shortage on the global market of
one specific vaccine can be simulated. Furthermore, when the vial sizes of the included vaccines change,
or new vaccines are introduced, the parameters of the representative vaccine should be adapted.
The representative vaccines are shipped in boxes of 100 vaccines each.
Since a box is the smallest entity in the simulation, sites can be oversupplied
by maximum 99 vaccines. Additionally, BHCs that need less than a box a
month are thus supplied one box a month. Hence, at BHC level, the
oversupply can amount to, in some cases, nearly 100%. This means that
BHCs arriving soon after a warehouse refill may end up with an oversupply,
taking away the vaccines of the BHCs that arrive later in time. An overview
of the estimated demands per BHC can be observed in Figure 7. The boxplot
indicates that for 75% of the districts the BHC demand exceeds 387
vaccines per month. That means that, in 75% of the districts, the maximum
oversupply that can occur per BHC is approximately 20%. The model does
not include corrective measures at a following resupply moment.
Figure 7 - Demand per BHC

24 Sarah Dewilde Cold chain distribution network design in developing countries Promoter: Prof. Dr. Nico Vandaele
Every storage location, fridge, and vehicle in the Madagascar vaccine SC is represented in the
model. Three types of loss are accounted for in the simulation:
• Shipping loss: vaccines wasted during transportation due to e.g. breakage on bumpy roads,
2% of all vaccines transported
• Inventory loss: loss due to insufficient CCE capacity, depends on the CCE available
• CCE breakdown loss: loss due to a CCE breakdown and insufficient back up capacity
The model includes three reasons why no full resupply occurs:
• Insufficient inventory: the site from which the resupply departs has insufficient inventory
to meet the demand
• Insufficient vehicle capacity: the vehicle that is designated to transport the vaccines does
not provide enough storage space to meet the demand
• Missing vehicle: no vehicle available to perform the required transportation
The model includes four types of transportation:
• Planes: 200 km/h, moves in straight lines
• Truck: 50km/h in dry season, 30km/h in rainy season, moves along the road network
• Pick up: 50km/h in dry season, 20km/h in rainy season, moves along the road network
• Moto: 50km/h in dry season, 20km/h in rainy season, moves along the road network
The recent implementation of a logistics management and information system (LMIS)4 as well as
the fact that a phone call is conducted a week before each shipment allow us to assume that districts are
resupplied up to a certain level. That means that if e.g. Ambalavao, that has a quota of 52.170 vaccines
per trimester, has an inventory of 42.000 vaccines at the moment that they receive the phone call, they
will receive at most 10.170 vaccines through that shipment.
Furthermore, it is assumed that when insufficient vaccines are available to meet the full shipment
needs, the available vaccines are spread relative to the individual needs of the districts served during
that shipment. The transportation route that serves Ambalavao and Ihosy DRSP is considered as
example. In line with what is agreed during the phone call, Ambalavao should receive 10.170 vaccines
and Ihosy DRSP 30.510 vaccines. This results in a total of 40.680 vaccines that are to be shipped. Let’s
assume that due to unforeseen circumstances, e.g. a canceled resupply from UNICEF, only 10.000
vaccines are left in the central warehouse in Antananarivo. This is clearly insufficient to meet the needs
of both sites; thus, the available vaccines will be assigned proportionally. That is Ambalavao will
receive 25% or, 2.500 vaccines and Ihosy DRSP the remaining 75%.
4 In 2017 the MOH introduced a Logistics Management Information System (LMIS), Malagasy Channel, an automated order tracker that enables users to send reports and requisition orders to the central warehouse. In the meantime, all regions and districts have received training and by the end of July 2017 a significant increase in data reporting has been witnessed.
25 Sarah Dewilde Cold chain distribution network design in developing countries Promoter: Prof. Dr. Nico Vandaele
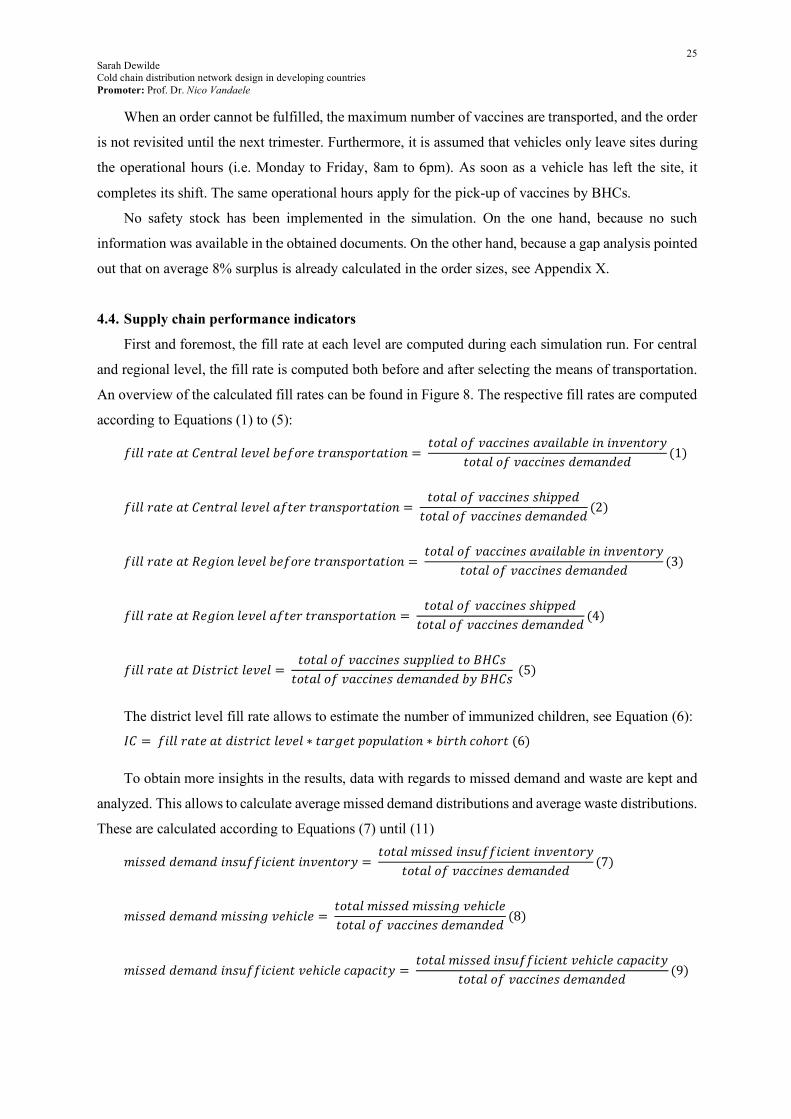
When an order cannot be fulfilled, the maximum number of vaccines are transported, and the order
is not revisited until the next trimester. Furthermore, it is assumed that vehicles only leave sites during
the operational hours (i.e. Monday to Friday, 8am to 6pm). As soon as a vehicle has left the site, it
completes its shift. The same operational hours apply for the pick-up of vaccines by BHCs.
No safety stock has been implemented in the simulation. On the one hand, because no such
information was available in the obtained documents. On the other hand, because a gap analysis pointed
out that on average 8% surplus is already calculated in the order sizes, see Appendix X.
4.4. Supply chain performance indicators
First and foremost, the fill rate at each level are computed during each simulation run. For central
and regional level, the fill rate is computed both before and after selecting the means of transportation.
An overview of the calculated fill rates can be found in Figure 8. The respective fill rates are computed
according to Equations (1) to (5):
!"##%&'(&')(*'%&##(+(#,(!-%('%&*./-%'&'"-* = '-'&#-!+&11"*(.&+&"#&,#("*"*+(*'-%2
'-'&#-!+&11"*(.3(4&*3(3(1)
!"##%&'(&')(*'%&##(+(#&!'(%'%&*./-%'&'"-* = '-'&#-!+&11"*(..ℎ"//(3'-'&#-!+&11"*(.3(4&*3(3
(2)
!"##%&'(&':(;"-*#(+(#,(!-%('%&*./-%'&'"-* = '-'&#-!+&11"*(.&+&"#&,#("*"*+(*'-%2
'-'&#-!+&11"*(.3(4&*3(3(3)
!"##%&'(&':(;"-*#(+(#&!'(%'%&*./-%'&'"-* = '-'&#-!+&11"*(..ℎ"//(3'-'&#-!+&11"*(.3(4&*3(3
(4)
!"##%&'(&'>".'%"1'#(+(# = '-'&#-!+&11"*(..?//#"(3'-@A).'-'&#-!+&11"*(.3(4&*3(3,2@A).
(5)
The district level fill rate allows to estimate the number of immunized children, see Equation (6):
C) = !"##%&'(&'3".'%"1'#(+(# ∗ '&%;('/-/?#&'"-* ∗ ,"%'ℎ1-ℎ-%'(6)
To obtain more insights in the results, data with regards to missed demand and waste are kept and
analyzed. This allows to calculate average missed demand distributions and average waste distributions.
These are calculated according to Equations (7) until (11)
4"..(33(4&*3"*.?!!"1"(*'"*+(*'-%2 = '-'"..(3"*.?!!"1"(*'"*+(*'-%2
'-'&#-!+&11"*(.3(4&*3(3(7)
4"..(33(4&*34".."*;+(ℎ"1#( = '-'"..(34".."*;+(ℎ"1#('-'&#-!+&11"*(.3(4&*3(3
(8)
4"..(33(4&*3"*.?!!"1"(*'+(ℎ"1#(1&/&1"'2 = '-'"..(3"*.?!!"1"(*'+(ℎ"1#(1&/&1"'2
'-'&#-!+&11"*(.3(4&*3(3(9)

26 Sarah Dewilde Cold chain distribution network design in developing countries Promoter: Prof. Dr. Nico Vandaele
I&.'("*.?!!"1"(*'.'-%&;(1&/&1"'2 = '-'&#I&.'("*.?!!"1"(*'1&/&1"'2'-'&#-!+&11"*(.3(4&*3(3
(10)
I&.'())K,%(&L3-I* = '-'&#I&.'())K,%(&L3-I*'-'&#%(1("+(3+&11"*(.
(11)
It is obvious that there is a direct relation between the fill rate level before transportation and the
missed demand due to insufficient inventory (Equation (12)). Additionally, the difference between fill
rate before transportation and the fill rate after transportation is directly linked with sum of missed
demand due to insufficient vehicle capacity and missed demand due to missing vehicle (Equation (13)):
1 − !"##%&'(,(!-%('%&*./-%'&'"-* = 4"..(33(4&*3"*.?!!"1"(*'"*+(*'-%2(12)
!"##%&'(,(!-%('%&*./-%'&'"-* − !"##%&'(&!'(%'%&*./-%'&'"-*
= 4"..(33(4&*3"*.?!!"1"(*'+(ℎ"1#(1&/&1"'2
+ 4"..(33(4&*34".."*;+(ℎ"1#((13)
Storage and vehicle utilization are calculated per node. This allows to assess the efficiency and
bottlenecks of the model. They are calculated according to Equations (14) and (15):
.'-%&;(?'"#"O&'"-*-+(%'"4( = '-'&#*?4,(%-!+&11"*(."*"*+(*'-%2
P/(%&'"-*&#))K1&/&1"'2(14)
+(ℎ"1#(?'"#"O&'"-*/(%-%3(% = '-'&#*?4,(%-!+&11"*(..ℎ"//(3
)&/&1"'2-!1ℎ-.(*'%&*./-%'&'"-*4('ℎ-3(15)
Finally, some cost elements are calculated during the full duration of the simulation (Equations
(16) and (17)). The transportation cost uses the traveled distance, the fuel price5, consumption rate per
vehicle and an extra 15% maintenance cost as a percentage of the fuel cost (WHO, 2014). The cost of
all wasted vaccines is calculated based on a weighted average cost per vaccine based on the cost price
as provided by UNICEF (UNICEF, 2016). This resulted in a cost per vaccine of € 2,37. Since no data
was available on personnel, no HR costs have been taken into account. The other cost elements such as
personnel, depreciations, etc. are assumed to remain constant, hence no further calculations are required.
'%&*./-%'&'"-*1-.'
= Q 3".'&*1('%&+(#(3RSTUVWS ∗ 1-*.?4/'"-*RSTUVWS ∗ !?(#/%"1(RSTUVWSX
∗ (1 + 4&"*'(*&*1(%)(16)
I&.'&;(1-.' = Q #-!I&.'(3+&11"*(. ∗ I(";ℎ'(3&+(%&;(-!+&11"*(1-.'XU[SX
(17)
5 Diesel price of € 0,85, as retrieved from https://www.globalpetrolprices.com/diesel_prices/#hl80, consulted on April 9, 2018

27 Sarah Dewilde Cold chain distribution network design in developing countries Promoter: Prof. Dr. Nico Vandaele
Not included in model
Used as a proxy for immunization
coverage
Missed demand due to limited vehicle capacity or missing vehicle at central
level
Missed demand due to limited vehicle capacity or missing vehicle at regional
level
Service level beforetransportation
Depends on inventory at central levelMissed demand due to insufficient
inventory
Central level storageService level before
transportationDepends on inventory at regional level
Missed demand due to insufficient inventory
Regional level storageImmunization coverage
BHC levelService level BHC
Depends on inventory at district level
District level storage
Central level metrics Regional level metrics District level metrics
Service level aftertransportation
Depends on vehicles capacity/availability
Level 1 transportationService level after
transportationDepends on vehicle capacity/availability
Level 2 transportation
Gap due to outgoing transportation constraints
Gap due to outgoing transportation constraints
BHC level
Vaccines lost during transport (2%)
Vaccines lost during transport (2%)
Vaccines lost due to insufficient capacity or
CCE breakdown
Vaccines lost due to insufficient capacity or
CCE breakdown
Vaccines lost due to insufficient capacity or
CCE breakdown
Figure 8 - Overview of fill rates

28 Sarah Dewilde Cold chain distribution network design in developing countries Promoter: Prof. Dr. Nico Vandaele
4.5. Base case analysis
The current situation in Madagascar is simulated in the base case. It is assumed that vaccines are
distributed in boxes containing 100 vaccines each, and that UNICEF supplies 3.844.625 vaccines each
trimester, corrected on an annual basis with a population growth rate of 2,7%. All types of fridges are
included (solar, electrical, and fuel refrigerators). Due to the poor operational status of the CCE as
discussed in the EVM Analysis of 2014, 80% of the fridges are assumed to be obsolete. Each fridge has
a capacity of 156 liters. Level one transportation (i.e. planes and trucks) can each carry 54 cold boxes
(one cold box equals 20,7 liters) and level two transportation, i.e. pickups and moto’s, can carry 12 cold
boxes and one cold box respectively.
In the following paragraphs the fill rate at district level is discussed first. Next, the central and
regional level are further assessed by comparing their fill rate before transportation and the fill rate
after. Thirdly, more insights are given in the reasons why demand is missed, followed by an assessment
of the main causes of waste throughout the system and an overview of the storage utilization at the
warehouses. Finally, a more thorough stock out assessment is provided which clearly illustrates the
impact of the rainy season on the availability of vaccines.
Firstly, the simulation of the base case suggests a fill rate of 64% at district level (Figure 9). This
means that they can immunize 530.000 children (immunized children is further referred to as IC) on an
annual basis. There is, however, a significant deviation between the fill rate of the districts that are
affected by the rainy season and those that are not, which is
further referred to as the equity gap. For those affected by the
rainy season the fill rate is as low as 49%, whereas for the other
districts it amounts to 71% (that is, an equity gap of 22%)
(Figure 9).
Since the model does not include the storage at BHC level
neither the immunization of people itself, no real immunization
coverage can be obtained. As a consequence, the fill rate at
district level is used as a proxy for the immunization coverage.
This choice implies that the numerous steps that are required to
finally reach the person in need (e.g. storage at BHC level,
transportation to BHC level, reaching the population and
creating awareness, the availability of personnel, …) are
ignored. Hence, one expects this proxy to be an overestimation
of the actual immunization coverage. The obtained fill rate is
lower than the immunization coverage reported in official WHO
data, that is a national immunization coverage of 65% in 2015
and 74% in 2016 (WHO, 2017a). However, it is important to
Figure 9 – Performance at district level Left: fill rate - Right: number of IC

29 Sarah Dewilde Cold chain distribution network design in developing countries Promoter: Prof. Dr. Nico Vandaele
note that these data are questionable since they are challenged by other sources (WHO, 2017a). A model
rerun where the share of obsolete fridges only amounts to 50% resulted in a fill rate at district level of
72% which is closer to what can be found in the official sources (see Appendix XI). Nevertheless, it
was opted for to continue with the worst-case scenario due to the specific country information. This
choice is backed up by the fact that the model only includes routine immunization and no immunization
campaigns, hence, a part of the administered vaccines is not captured.
In Section 4.1, it was described that “Children living in the Itasy region, a more affluent region, are
3.4 times more likely to be vaccinated than children living in the Menabe region” (Van Den Ent et al.,
2017). The simulation confirms this gap. On average 10% of all vaccines demanded by the BHCs in the
Itasy region is missed, while a depressing 54% for the Menabe region (Figure 16).
Secondly, at central as well as at regional level, two fill rates are computed (Figure 10). The first
fill rate, “fill rate before”, indicates the demand that can be met from inventory. A deviation from 100%
indicates insufficient inventory at the resupply site. The second fill rate, “fill rate after”, indicates how
many vaccines are actually shipped from the resupply site. The difference between the two denotes the
missed demand due to transportation problems, i.e. missing vehicles or insufficient vehicle capacity
(see Figure 8). At central level, this gap is 25%, whereas, at regional level it is resp. 5 and 14%.
The second part of Figure 10 discusses the reasons why demand is not met. This differs relative to
the level in the SC and has already been hinted at when considering the difference between the two
calculated fill rates. At central level, the simulation suggests that the main reason why demand is not
fulfilled is insufficient vehicle capacity. At regional level, however, it is mainly due to insufficient
inventory, resp. 30% and 28%, and in lesser extent due to insufficient vehicle capacity, resp. 5 and 11%.
It is remarkable that missing vehicles do not stress the system whatsoever. Only at rain-impacted
regional level an impact of 3% is observed. A possible explanation can be that in the obtained data an
abundance of vehicles was available, and no vehicle breakdown was included in the model.
Additionally, at regional level, when no pick up is available, but a motorcycle is used instead, this
missed demand is considered as insufficient vehicle capacity.
The observable issue with vehicle capacity is also reflected in vehicle utilization numbers (Figure
11). The utilization of plane storage capacity is on average 96%, with a median of 100%6. A similar
result is seen for truck transportation with an average of 81% and a median of 88%. The motorcycles’
capacities, too, are well used with an average capacity utilization rate of 82% and a median of 95%.
Pick up transportation is less congested with an average capacity utilization of 59 and a median of 57%.
The estimated total transportation costs in the system augment to approximately € 0.43 Million every
year which is in line with what was calculated for a GAVI eligible sample country (Lee et al., 2015).
6 This model only includes one route that is conducted by planes, i.e. from the central warehouse to Sambava DRSP. The vaccines demanded by Sambava DRSP exceed the plane capacity, which explains the high utilization rate numbers.

30 Sarah Dewilde Cold chain distribution network design in developing countries Promoter: Prof. Dr. Nico Vandaele
The histograms in Figure 12 provide a rough sense of the distribution of the average fill rates. At
district level, 79% of the sites that are not affected by the rainy season score above 50% fill rate, whereas
for the districts that are affected by the rainy season this is merely 48%. It is interesting to see that at
regional level; no such deviation is present. The distribution of fill rates is relatively similar between
the two zones, with the bulk of districts, respectively 83% and 75%, with a fill rate of 50% or above.
Next, vaccines are also wasted throughout their journey. This loss is mainly due to the breakdown
of cold chain equipment, and to a lesser extent due to insufficient cold chain capacity (Figure 13). It is
apparent that the impact of failing CCE is significantly higher when insufficient cold chain capacity is
available in the system. Hence, it is important to consider the two metrics as a whole. At central level,
2% of all vaccines are lost due to storage related issues. At regional level this amounts to a total of 15%
for the non-affected sites and 23% for the rainy-season affected sites, and at district level respectively
10% and 9%. In total 172 thousand boxes out of 811 thousand boxes are wasted throughout the
simulation, i.e. 21%, which is significantly lower than the 50% loss that is reported in some countries
(Sabot, Yadav, & Zaffran, 2010). This can partially be due to the fact that no vehicle breakdowns were
modelled. Additionally, the crucial and often challenging parts related to the last mile delivery were
excluded from the model. Furthermore, the communication between the sites prior to delivery, reduces
waste due to insufficient capacity, since no orders exceeding the available CCE capacity are accepted.
Another discussion element in the analysis of the base case is the storage utilization, see Figure 14.
At central level, an average of 67% can be observed. This indicates that the warehouse has excess
capacity that allows them to cope with the foreseen population growth. The utilization rate drops further
downstream the supply chain. The histograms in Figure 14 provide insights in the variation between
the unique data points. At regional level, the bulk of the sites, 56%, have an average storage utilization
between 25% and 50%. At district level, storage utilization is even lower, 88 of the 112 districts, or
78%, have a utilization rate lower than 25%. This is significantly lower than the 67% utilization rate
recommended by the WHO (WHO, 2017b). This indicates that either they are oversized, or the vaccines
do not reach the facilities.
Lastly, the impact of the rainy season on the system as a whole is further assessed. This has already
been partially discussed by comparing the rainy-season affected sites with those that are not affected.
The simulation assumes that the districts that are inaccessible during the rainy season are not resupplied
whatsoever in this period of time. The base simulation does not include any adaptive measures to
overcome the stress this causes to the system since no indications for such measures were found in the
data. However, demand from BHCs is not canceled in this period of time. This assumption was made
since children are still born in this period, hence immunization should still take place at BHC level.
A stock out assessment (Figure 17, Figure 18 and Table 2) provides an overview of the moments
at which stock outs occur. The assessment contains the last 1000 days of the simulation of which 356
rainy days and 644 dry days. All 16 regional warehouses and 97 of the 112 districts suffer occasional

31 Sarah Dewilde Cold chain distribution network design in developing countries Promoter: Prof. Dr. Nico Vandaele
stock outs. At regional level, stock outs are perceived during 25% of the days during the dry season and
throughout 24% of the days during the rainy season. In the dry season, the regional warehouses in rainy-
season affected areas experience considerably fewer days with stock outs. This can be explained by the
fact that they are well equipped to store their requested vaccines. In the rainy season, the regional
warehouses that are not affected experience less stock outs than during the dry season, since there are
more vaccines available for their resupply. At district level, sites suffer stock outs on average 30% of
the time during the dry season and 39% during the rainy season. There is, however, a big difference
between the sites that are affected by the rainy season and those that are not. Whereas, the latter ones
run out of stock only in 26% of the days throughout the rainy season, this is 71% for the affected sites.
Moreover, throughout the dry season the affected sites have an increased share in days with stock out.
The results clearly indicate that the rainy season puts stress on the system. At district level, a
significant gap in fill rate can be observed between the rainy-season affected sites and those that are
not. This gap is caused by the fact that there is a significant increase in stock out days because vaccines
are blocked either at central or at regional level and cannot reach their destination. Additional challenges
the system has to cope with are CCE breakdown and limited vehicle capacity. To improve the current,
slow, cold chain the trade-off between adding redundancy and adding flexibility, as stated in Section
2.2.4.3, is evaluated by means of a scenario analysis. The following sections consist of discussing and
assessing scenarios which potentially could alleviate the burden of the rainy season on the distribution
of vaccines in Madagascar.
Figure 10 - Fill rate at central and regional level
5%
3%

32 Sarah Dewilde Cold chain distribution network design in developing countries Promoter: Prof. Dr. Nico Vandaele
Figure 11 - Vehicle utilization
Figure 12 - Histograms average fill rate

33 Sarah Dewilde Cold chain distribution network design in developing countries Promoter: Prof. Dr. Nico Vandaele
Figure 13 - Sources of waste in the system
Figure 14 - Storage utilization

34 Sarah Dewilde Cold chain distribution network design in developing countries Promoter: Prof. Dr. Nico Vandaele
Figure 15 - Stock out assessment geographical overview
Figure 16 - Stock out assessment geographical overview - Itasy and Menabe region

35 Sarah Dewilde Cold chain distribution network design in developing countries Promoter: Prof. Dr. Nico Vandaele
Table 2 - stock out assessment
AVERAGE % OF STOCK OUT DAYS DURING DRY SEASON
AVERAGE % OF STOCK OUT DAYS DURING RAINY SEASON
Central 0% 0%
Not affected 0% 0%
Region 25% 24%
Not affected 31% 24%
Affected 7% 24%
District 30% 39%
Not affected 27% 26%
Affected 38% 71%
Figure 17 - Stock out assessment – Regional Left: stock out pattern – Right: number of days with stock out

36 Sarah Dewilde Cold chain distribution network design in developing countries Promoter: Prof. Dr. Nico Vandaele
Figure 18 - Stock out assessment - Districts

37 Sarah Dewilde Cold chain distribution network design in developing countries Promoter: Prof. Dr. Nico Vandaele
4.6. Studied scenarios
The constructed simulation model is used to evaluate different scenarios for dealing with the burden
of the rainy season. The strategies chosen, and their respective effects are analyzed over a limited time
horizon of five years in order to remain as close as possible to reality. This limits the impact of wild
assumptions and predictions about the future. A short time horizon allows to assume (1) no major
infrastructure changes will occur (e.g. electricity grid, road infrastructure, mobile interconnectedness);
(2) no major population displacements; (3) no major changes in vaccine delivery technologies; (4) no
changes in the immunization package. Additionally, these constraints limit the changes that are possible,
justifying scenarios that remain close to the situation as is today. The scenarios use existing locations
and transport routes and do not have the luxury to choose any location to build a new warehouse or
establish a new transport route.
As discussed in Section 2.2.4.3, a tradeoff exists between a flexible and a rigid SC when designing
a distribution network. It was stated that in cases where health facilities are inaccessible during several
months of the rainy season, a rigid, or a “slow cold chain” (i.e. a SC relying on cold generating
equipment and storage rather than speed and transportation capacity) is preferable. These facilities
would then receive enough vaccines and supplies to cover the entire period of inaccessibility (WHO,
2008). Sheffi stresses that flexibility is more important than redundancy in order to obtain a resilient
supply chain. This simulation is used to test possible definitions of a rigid SC and aims to determine
which rigid regime is flexible enough to cope with the inaccessibility.
The base case is compared to scenarios that differ in three possible ways as can be observed in
Figure 19. Firstly, redundancy is added by means of a buffer in rainy-season affected areas that builds
up throughout the year in order to bridge the supply/demand gap during the rainy season. The impact
of this buffer is tested by increasing the requested number of vaccines in those areas by resp. 50 % and
100 %. Since this is purely an administrative change and holding costs are assumed to be equal at each
level of the supply chain, no extra costs are expected. Secondly, flexibility is introduced by resupplying
the warehouses at resp. a bimonthly and monthly pace rather than at a trimestral pace. It is clear that
100 % Buffer:
100 % Buffer:
Bimonthly0 % Buffer: 50 % Buffer:
Monthly0 % Buffer:. 50 % Buffer:
Increased buffer
1 - Increased buffer
2 -I
ncre
ased
freq
uenc
y
Base case
C D E
F G
A B
No extra cost
Renewal costs
3 - Improved CCE in rainy season affected areas
H
Increased transportation costs
100 % Buffer:
100 % Buffer:
Base RSCCE
Bimonthly0 % Buffer: 50 % Buffer:
Monthly0 % Buffer:. 50 % Buffer:
Increased buffer
I J K
L M N
O P Q
No extra cost
Increased transportation costs
Increased transportation costs
Figure 19 - Design of tested scenarios

38 Sarah Dewilde Cold chain distribution network design in developing countries Promoter: Prof. Dr. Nico Vandaele
this will increase the cost of transportation significantly since respectively 1,5 times and three times
more trips are planned. The model made abstraction of any personnel costs and fuel is assumed to be
available at all time. Thirdly, another redundancy measure is evaluated, i.e. the influence of an improved
CCE base in rainy-season affected areas. In this scenario it is assumed that only 50% of their CCE is
obsolete. To achieve this, 30% of the current CCE needs to be repaired or replaced, which is 193 fridges.
Due to the lack of information with regards to the presence of maintenance teams for repair, it is
assumed that new CCE needs to be bought. This results in an extra investment of approximately 1
Million euros7. According to the WHO guidelines this investment is depreciated linearly over the CCE’s
useful life years, i.e. 5 years (WHO, 2004). This results in an annual cost of 200.000 euros.
The complex interplay of vaccine storage and supply frequency is further assessed by combining
the different scenarios with each other. In total 17 scenarios are tested against the base case. Their
performance is compared on three levels. First and foremost, the scenario should improve the situation
in all areas of the country in terms of immunization coverage, i.e. fill rate at district level. This means
that no improvement in the rainy-season affected areas can be realized at the expense of the other areas.
Secondly, the chosen scenario should ensure a more equitable distribution. Thirdly, the additional waste
and transportation costs are calculated and compared. Finally, the scenarios that are considered as
‘interesting’ based on the aforementioned waterfall, are further evaluated by means of a stock out
analysis. Figure 20 summarizes the key metrics for the preferred scenarios.
4.7. Results
This section follows the structure as set out in Section 4.6. Firstly, the fill rates at district level and
equity gaps are evaluated. Next, a cost analysis of the preferred scenarios is carried out. Hereafter, a
stock out assessment is conducted of the best performing scenarios.
The base case suggested a fill rate at district level of 64%, with an equity gap of 22% between the
rainy-season affected areas (with a fill rate of 49%) and the rest (with a fill rate of 71%). This provides
the means to immunize 530.000 children on an annual basis (see Figure 21). The total waste at central
level is 3%, at regional level 19% and at district level 10% (see Figure 22). At central level, the dominant
reason for missed demand is insufficient vehicle capacity, i.e. 25%, and at regional level, it is primarily
due to insufficient inventory, i.e. 29% (see Figure 23). The total estimated annual cost of the base case
augments to 449.000 euros (see Figure 24).
When keeping the current CCE, the simulation suggests that at a trimestral resupply pace, the two
alternative buffer scenarios, i.e. A and B, improve the rainy-season affected areas at the expense of the
7 In total there are 644 fridges in rainy-season affected areas, of which only 20% or 128 are operational. In order to improve to a 50% operational level, 193 fridges need to be bought or renewed. It is assumed that these are of the type TCW 3000 SDD with a unit price of 5167,00 € (Unicef, 2017). This results in a total cost of € 997 231,00.

39 Sarah Dewilde Cold chain distribution network design in developing countries Promoter: Prof. Dr. Nico Vandaele
other areas (Figure 21). Furthermore, the buffer implies that vaccines are kept at lower levels of the
cold chain. This jeopardizes the vaccine supply chain’s ability to cope with events such as refrigerator break
down, resulting in an increase in vaccines wasted in rainy-season affected areas by approximately 10% in
both scenarios (Figure 22, from 24% to 33% in both cases). Additionally, transportation bottlenecks
due to insufficient vehicle capacity are more pronounced, increasing from 25% in the base case to resp.
27% and 33% in the 50% buffer scenario and the 100% buffer scenario (Figure 23). Due to the poor
performance of the scenarios A and B, they are eliminated for further investigation.
If the decision-makers in Madagascar would decide to switch to a bimonthly resupply system,
considerable improvements can be observed. The scenario in which a 100% buffer is incorporated, i.e.
E, has the biggest improvement with regards to the district fill rate. It increases the overall fill rate by
8% and the equity gap decreases to 14%. In this scenario, 607.400 children can be immunized, that is
77.400 extra (Figure 21). The increased frequency reduces the number of vaccines transported per trip,
which alleviates the transportation bottlenecks caused by insufficient vehicle capacity. For the 100%
buffer case, for example, a decrease in demand missed due to insufficient vehicle capacity from 33% to
10% can be observed (Figure 23). Additionally, vaccines move faster through the chain, which means
they spend less time in storage, resulting in decreasing waste (Figure 22). Since scenarios without a
buffer or with a 50% buffer, i.e. C and D, do not perform considerably better, they are eliminated for
further investigation.
The Malagasy authorities could also opt to resupply each month. Here the simulation suggests that
the scenario without a buffer, i.e. F, is noticeably better than both the base case and the scenarios with
buffer, i.e. G and H. Hence, scenario G and H are eliminated for further investigation. Scenario F
enables 156.900 additional children to be immunized resulting from a 13,2% increase in district fill rate.
However, the equity gap also increases significantly and equals 32%, i.e. 10% more than in the base
case (Figure 21). For that reason, scenario F, too, is eliminated for further investigation.
The second half of Figure 21 shows the results of the scenarios in which the CCE in the rainy-
season affected areas is renewed, i.e. only 50% is obsolete (in the figures referred to as renewed CCE).
As discussed in Section 4.6, this comes at an extra investment of approximately 1 Million euros. Similar
to when no investments were made, the trimestral scenarios do not manage to simultaneously improve
both the affected and non-affected areas. So, scenarios I, J and K, are excluded too. In the bimonthly
case important improvements of the fill rates can be appraised. The case in which a buffer of 100%, i.e.
N, is applied beats the others, i.e. scenario L and M, with an increase in fill rate of 11.7%, a decrease in
equity gap to merely 7% and reaching an extra 121.500 children (Figure 21). The waste rates at all three
levels are brought down (Figure 22). Strikingly, at regional level the transportation bottlenecks are
slightly more pronounced than in the same case without additional CCE, i.e. from 15% to 22%. This
can be explained by looking at the ordering policy. Sites can never order more than their CCE allows.
Hence when increasing CCE, order sizes increase, which can lead to transportation bottlenecks.

40 Sarah Dewilde Cold chain distribution network design in developing countries Promoter: Prof. Dr. Nico Vandaele
Finally, when choosing for a monthly resupply pace, the case with 100% buffer, i.e. Q, outperforms
the other two, i.e. scenarios O and P. The overall fill rate increases to 80% with an equity gap of 17%
and 171.400 additional children can be immunized. No significant waste is present and missed demand
due to insufficient vehicle capacity is reduced to 0% at central level and to 7% at regional level.
Overall the simulation suggests that increasing frequency results in better vaccine availability.
Figure 20 restates the scenarios that perform best. It is important to match these with the additional
costs they provoke (see Figure 24). The cost per IC is calculated, as well as, a cost per immunized child
adjusted for the decrease in equity gap, i.e. that is giving more weight to children vaccinated in rainy-
season affected areas, see Table 3. It indicates that no investment in CCE is seen as efficient when
looking at the total increase in reached children only8. However, the focus of this master dissertation is
to overcome the burden of the rainy season. Hence it is important to adjust for a decrease in equity gap.
Since 1,32 euros and 1,60 euros are smaller than 1,92 euros, a bimonthly scenario with 100% buffer is
preferred over a monthly, i.e. E and N (Figure 20). These are further assessed in a stock out analysis to
see the effect on the vaccine availability throughout the year.
The output of the stock out analysis, see Table 4, confirms that the introduction of the buffer and a
bimonthly resupply system improves the availability of vaccines at district level. Whereas at central
level, a considerable increase in stock out days can be appraised. An overall decrease is suggested at
district level from 30% to resp. 27% and 24% in days with stock outs during the dry season and from
39% to resp. 35% and 32% during the rainy season. Furthermore, a significant enhancement can be
observed for the rainy season affected districts. These were the troublemakers in the base case with on
average 38% of the days during the dry season and 71% of the days during the rainy season on which
no vaccines were available at the site. The alternative scenarios have improved this to 29% during the
dry season and 59% during the rainy season, or even 22% and 53% when also investing in CCE.
8 The cost per IC is larger for the improved CCE scenarios than for the non-improved scenarios.
Figure 20 - Comparison table preferred scenarios

41 Sarah Dewilde Cold chain distribution network design in developing countries Promoter: Prof. Dr. Nico Vandaele
4.8. Discussion
The findings of this research confirm Sheffi’s theory that to obtain a resilient supply chain
redundancy measures and, even more important, flexibility should be implemented. Additionally, they
are also in line with the WHO recommendations to implement a slow, rather than a fast, cold chain. The
simulation suggests that opting for a bimonthly resupply pace combined with a buffer build-up in the
rainy season impacted areas reduces the impact of the rainy season on the availability of vaccines.
In the first place, Sheffi (Sheffi & Rice Jr, 2005) stressed the importance of introducing redundancy
to create a resilient supply chain network. Such as, keeping some reserve stock to be used in case of a
disruption. Our research shows indeed that the implementation of the buffer decreases the equity gap
significantly. However, the increased vehicle capacity requirements and storage requirements further
downstream associated with increase in order sizes limit the potential of this approach. They result in
more missed demand due to limited vehicle capacity and increased waste at intermediary levels in the
supply chain. As a consequence, the overall improvement of this redundancy is rather small.
Secondly, redundancy can also be achieved by expanding storage capacity. The simulation suggests
that relieving storage constraints does not guarantee an improved fill rate at district level. The results
indicate that enhanced CCE in the rainy-season affected areas lessens the waste caused by storage issues
significantly while increasing the missed demand due to insufficient vehicle capacity.
Haidari et al., too, reported on this important tradeoff between storage capacity and transportation.
They state that relieving storage constraints exacerbates existing transportation bottlenecks (Haidari et
al., 2013).
Thirdly, Sheffi stated that there is significantly more leverage in making supply chains flexible
than there is in adding redundancy (Sheffi & Rice Jr, 2005). Haidari et al confirms this by declaring
that increasing transportation frequency, and thus increasing flexibility, alleviates capacity constraints
both in transportation and storage. This was also observed in this research. Flexibility implies that fewer
vaccines need to be transported at once and fewer vaccines need to be stored at the locations. This
induces decreased waste in storage at regional level and decreased missed demand due to insufficient
vehicle capacity. The fewer vaccines that need to be transported at once, open up room in the vehicles
to implement the buffer policy. This way also the equity gap is reduced.
Fourthly, resilience comes with additional effort and costs. The costs related to each scenario turn
out to be higher per immunized child than the base case. Although the monthly resupply pace is very
attractive, the higher costs associated with it cannot be justified. Even more so because the costs
estimated in our model are an underestimation of the total cost, given that some flexibility aspects of
the monthly resupply are beyond the scope of our model. That is, each resupply trip carries a risk of
vaccine breakage, mishandling, or temperature exposure. Additionally, more frequent trips result in an
increase in total distance traveled and time spent on the road for the drivers and ultimately transportation
costs. Furthermore, the managerial implications of getting the right vehicle in the right condition at right

42 Sarah Dewilde Cold chain distribution network design in developing countries Promoter: Prof. Dr. Nico Vandaele
time at right place with a certified driver as well as the availability of fuel and spare parts are key. A
bimonthly pace, on the other hand, is only 7% more expensive9, it reaches 15% more children, and by
implementing the buffer policy the equity gap is reduced significantly. This alone enables the system
to be more adaptable towards potential future increase in volume that will flow through the system.
As described in Section 2.2.2, a vaccine SC is not profit driven and the objective is to serve all
areas, despite limitations in infrastructure and resources. In our opinion, the bimonthly case with a 100%
buffer and an investment in CCE is the preferred scenario. This scenario allows for 23% more children
to be immunized, a reduction in equity gap to only 7% and a reduction in days with stock out in both
seasons. Admittedly, the total cost is 71% higher than the base case. However, one has to realize that
this is only 36 eurocents per immunized child. The macro-economic benefits of immunizing more
children are wide-ranging and are difficult to overestimate.
The WHO stated that in cases where health facilities are inaccessible during several months of the
rainy season, a more rigid cold chain is preferable over a fast supply chain (WHO, 2008). Sheffi stresses
the importance of flexibility and to a lesser extent redundancy. This simulation considered three
possible definitions of a rigid SC and aimed to determine which rigid regime is flexible enough to cope
with the inaccessibility. It was found that a resupply period of only two months increases the fill rate at
district level by 12% while decreasing the equity gap by 15% for 36 eurocents more per child. It can
thus be seen that the current SC in Madagascar is too rigid, and some degree of flexible system yields
significant improvements.
4.9. Contribution and limitations of this research
The insights of this research contribute to both literature and practice. Firstly, the findings confirm
Haidari et al. who studied the Niger vaccine SC by the means of a HERMES simulation model. They
stated that relieving storage constraints exacerbates existing transportation bottlenecks and that
increasing transportation frequency alleviates capacity constraints. This is also what is suggested by the
results of this research. Secondly, the results are in line with Sheffi who states that there is significantly
more leverage in making supply chains flexible than there is in adding redundancy and it adds to the
WHO advice that “slow” cold chains are preferred in rainy-season affected areas. This research
investigates several options of “slow” supply chains and as such provides more detailed insights into
the degree of flexibility and redundancy that is required in the design of the SC for vaccines in
Madagascar. Thirdly, this research provides insights for the practitioners (managers in NGOs and policy
makers) helping them to improve the vaccine SC and as such reach more children in need of
vaccinations. Fourthly, the dataset constructed from several different sources, as discussed in Section
9 The adjusted cost per IC is used to compare the scenarios. Hence, 1,32 euros is 6,6% more than 1,24 euros.

43 Sarah Dewilde Cold chain distribution network design in developing countries Promoter: Prof. Dr. Nico Vandaele
3.1.3, allows to simulate the vaccine SC in Madagascar, which had not been done before. It is also
available now for further research.
Models, by definition, are simplifications of real life and cannot capture every possible factor,
relationship, or outcome. Constructing the model involved substantial data collection from a wide
variety of sources. Some data (e.g. CCE and available transportation modes per site, vehicle capacities,
transportation costs, travel speed, etc.) may be less reliable because reporting does not always match
reality. Moreover, the simulation model did not account for random events such as vehicle breakdown,
unavailable personnel and warehouse demolition. The model did not consider additional resources
needed with new vaccine introduction such as personnel, vaccine accessories (e.g. safety equipment),
and potential changes in the network. Furthermore, the estimate of population demand for vaccines was
based on birth-rate data. The actual demand at each BHC was unknown. Finally, due to limited
knowledge of GIS implementation in Anylogic it can be that the followed routes deviate from the
existing routes. When a route cannot be found, a straight path is followed from origin to destination.
Even though the findings are in line with what Haidari et al concluded, future investigations are
necessary to validate the conclusions that can be drawn from this research. Firstly, while this study
examined the effects of augmenting only in-country transport, increasing the frequency of shipments to
the country might also have positive implications for vaccine availability. Secondly, field research can
allow to refine the parameters used in the simulation model, decreasing the number of assumptions
required. Moreover, locally obtained information would allow enhanced costs estimations. Thirdly,
numerous extensions are possible to the simulation model, ranging from further GIS implementation
and adapting the model for dynamic disruptions and rerouting, to including personnel requirements and
vehicle breakdowns. Additionally, it might prove interesting to include the last mile steps in the
simulation such that the whole journey from manufacturer to the people in need is captured. Finally,
more scenarios can be tested including alternative means of transportation and the impact of innovations
such as drones on the distribution of vaccines in Madagascar.

44 Sarah Dewilde Cold chain distribution network design in developing countries Promoter: Prof. Dr. Nico Vandaele
Table 3 – Cost per IC
BASE 3M BUFFER 100 2M
(E)
BUFFER 100 2M CCE (N)
BUFFER 100 1M CCE (Q)
Total IC 530.000
607.400 +15%10
651.500 +23%
701.300 +32%
Not affected 431.400 479.400 497.600 551.300
Affected 98.500 128.000 153.900 150.100
Total cost 449.000 €
569.000 €
+27%
767.000 €
+71%
961.000 €
+114%
Cost per IC 0,85 € 0,94 € 1,18 € 1,37 €
Adj. cost per IC11 1,24 €
1,32 € +7%12
1,60 € +29%
1,92 € +55%
Table 4 - Stock out assessment of chosen scenarios
BASE 3M BASE 3M
BUFFER 100 2M
(E)
BUFFER 100 2M
(E)
BUFFER 100 2M
CCE (N)
BUFFER 100 2M
CCE (N)
Avg Dry % Avg Rainy % Avg Dry % Avg Rainy % Avg Dry % Avg Rainy %
Central 0% 0% 24% 11% 13% 6%
Not affected 0% 0% 24% 11% 13% 6%
Region 25% 24% 27% 15% 26% 17%
Not affected 31% 24% 30% 16% 33% 22%
Affected 7% 24% 18% 13% 3% 0%
District 30% 39% 27% 35% 24% 32%
Not affected 27% 26% 27% 25% 24% 23%
Affected 38% 71% 29% 59% 22% 53%
Grand Total 29% 37% 27% 32% 24% 30%
10 % increase in total immunized children relative to the base scenario
11 Cost per IC is calculated giving each immunized child the same weight, i.e. 50%. For example, for the bimonthly 100% buffer case, €0,94 = €()*.,,,
-∗(,,(∗01*.0,,2,,(∗3-4.,,,). The adjusted cost per immunized child is calculated by giving the additional immunized children in the rainy-season affected areas a weight of 75% and those in non-affected areas a weight of 25%. The same example is used to illustrate the calculations, €1,32 = €()*.,,,
-∗(,,-(∗01*.0,,2,,1(∗3-4.,,,).
12 % increase in adjusted cost per IC relative to the base scenario

45 Sarah Dewilde Cold chain distribution network design in developing countries Promoter: Prof. Dr. Nico Vandaele
22%
+ € 120k
+ € 317k
+ € 512k
F
A B
EDC
HG
KJI
NML
QPO
A B
EDC
HGF
KJI
NML
QPO
14%
BASE BASE
Figure 21 - Overview of population reached and fill rate at district level for the different scenario’s
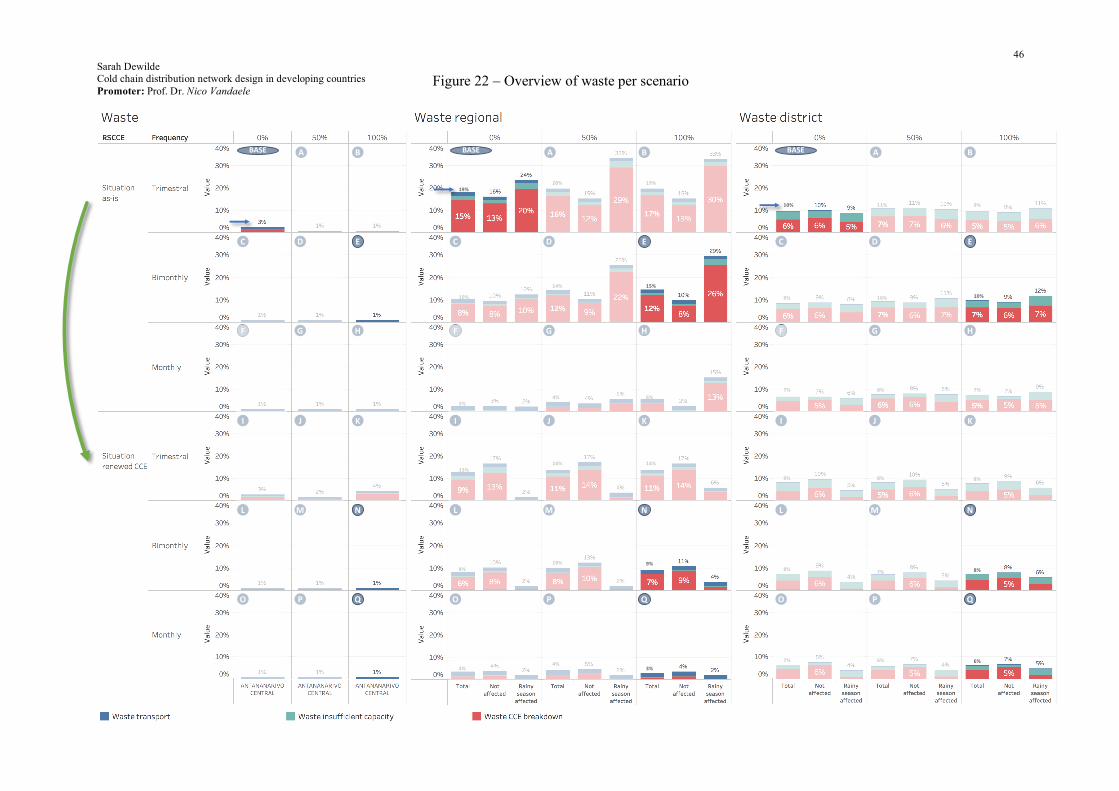
46 Sarah Dewilde Cold chain distribution network design in developing countries Promoter: Prof. Dr. Nico Vandaele
Figure 22 – Overview of waste per scenario
FFF
19%
10%
2%
13%
8%
4%
20%
14%
4%
14%
10%
4%
19%
15%
6%
14%
9%
3%
10%
9%
7%
9%
8%
7%
11%
10%
8%
8%
7%
6%
9%
7%
8%
8%
6%
10%
A B
EDC
HG
KJI
NML
QPO
A B
EDC
HG
KJI
NML
QPO
A B
EDC
HG
KJI
NML
QPO
BASE BASE BASE

47 Sarah Dewilde Cold chain distribution network design in developing countries Promoter: Prof. Dr. Nico Vandaele
Figure 23 – Overview of fill rates and missed demand per scenario
25%
F
A B
EDC
HG
KJI
NML
QPO
A B
EDC
HGF
KJI
NML
QPO
A B
EDC
HGF
KJI
NML
QPO
A B
EDC
HGF
KJI
NML
QPO
10%
BASE
BASE
BASE
BASE

48 Sarah Dewilde Cold chain distribution network design in developing countries Promoter: Prof. Dr. Nico Vandaele
A B
EDC
HGF
KJI
NML
QPO
BASE
Figure 24 – Overview of transportation, wastage and improved CCE costs per scenario

49 Sarah Dewilde Cold chain distribution network design in developing countries Promoter: Prof. Dr. Nico Vandaele
5. Conclusions and insights “If vaccines are the solution, then why aren’t children receiving them?” a thought provoking
question to which this master dissertation tried to formulate an answer and - more importantly - a
solution in the case of Madagascar. Vaccines can get stuck somewhere along their journey for numerous
reasons, one of which the periodical inaccessibility due to the rainy season. This leads to stock outs at
lower levels of the supply chain. Due to the relatively slow pace of the current supply chain in
Madagascar substantial numbers of vaccines per resupply trip are required which clearly congests the
system. The limited vehicle capacity as well as the low number of operational CCE create bottlenecks
and prevent vaccines from flowing smoothly from manufacturer to the people in need.
This thesis had the aim to explore the challenges to immunization supply chains and strategies to
relieve the congested system. After exploring the state of the art literature, two seemingly opposite
recommendations were found. The WHO, on the one hand, advocates for a more rigid cold chain, that
is, a cold chain in which supplies cover more than a month. Sheffi, on the other hand, stresses the
importance of flexibility. Hence, the question was raised how slow the cold chain could be to remain
flexible enough.
The research points out that a shift towards a bimonthly resupply pace, together with the
implementation of a buffer policy, which anticipates missed resupply moments due to isolation,
alleviates the stress on the system. The combination of the two policies improves the immunization
coverage substantially and reduces the equity gap with regards to vaccine availability between the rainy-
season affected areas and the rest. More important improvements are found when also the CCE is
partially renewed. This main finding is in line with the conclusions Haidari et al made for the Niger
vaccine supply chain. This solution, however, comes at a cost estimated at 36 eurocents per immunized
child. Yet, the macro-economic benefits of immunizing approximately 120.000 extra children are far-
reaching. Even though, this is more expensive than the base case, decision-makers in Madagascar
should further investigate the feasibility of increasing the flexibility of their current immunization
distribution network.
This research contributes to both literature as well as practice. It provides more insights in the
impact of recurring disruptive events on an immunization supply chain, along with strategies to improve
the situation. Moreover, it can help policy-makers in Madagascar to reassess and improve the current
immunization SC to reach more children and reduce the equity gap between the different districts. As
such, this research contributes to the philosophy of Seth Berkley, CEO of GAVI, the best vaccine
imaginable is only valuable to the extent we get it to everyone who needs it.

50 Sarah Dewilde Cold chain distribution network design in developing countries Promoter: Prof. Dr. Nico Vandaele
Acknowledgement
After an intensive period of learning, not only on an academic level but also on a personal level,
the moment has come to finish up my dissertation and to write this note of gratitude. First of all, I would
like to thank my supervisor, Catherine Decouttere, for the guidance, encouragement, advice and
knowledge sharing. I have been extremely lucky to have a supervisor who was so engaged and who
responded to my questions so promptly. I would also like to thank my promotor, Professor dr. Vandaele,
for the excellent cooperation and for the opportunities I was given to conduct my research.
Secondly, I would like to thank Andry Fidele Ravalitera, my contact at UNICEF Madagascar, for
providing me with the essential data to successfully conduct this research. I want to thank Jo Tierens
and Gino Vleugels from The Janssen Pharmaceutical Companies of Johnson & Johnson for providing
me with their insights regarding immunization supply chains. Karel Van Roey from Goal, responsible
for Janssen’s Ebola vaccine trial in Sierra Leone for discussing the differences between a public and a
private immunization supply chain, as well as, providing me with insights on how the situation is in the
field. In addition, I would like to thank Jef Molenaers, sales manager for pharma transportation at H.
Essers, for explaining the ins and outs of cold chain transportation.
Thirdly, a special appreciation goes to my parents. My mom, Ann Vereecke, who gave me
constructive feedback, crash courses in SC management, plentiful insights in correct academic writing
and the patience of dealing with me throughout this process. My dad, Patrick Dewilde, who was always
willing to remove and insert comma’s, correct my typos and entertain me with typical dad jokes.
Finally, I would like to thank my fellow students, my friends and my family for their patience, wise
counsel, feedback, sympathetic ear and the much-needed occasional escapes from my research.

51 Sarah Dewilde Cold chain distribution network design in developing countries Promoter: Prof. Dr. Nico Vandaele
Appendix I. Structure of literature review
Appendix II. A cold chain as defined by UNICEF

52 Sarah Dewilde Cold chain distribution network design in developing countries Promoter: Prof. Dr. Nico Vandaele
Appendix III. Five capabilities of a resilient system
DESCRIPTION THEMES IN SUPPLY CHAIN RESILIENCE
Ability to anticipate Proactive capabilities necessary to
identify and monitor potential events,
changing environments, and performance
before the ability of the supply chain to
function is affected
Proactively plan, anticipate risk, prepare,
resist, avoid and be alert
Ability to adapt Concurrent capabilities required to
manage and adjust critical supply chain
resources continually during disruptions
and/or normal business activities
Cope with unexpected disturbance or
change, absorb/withstand/reduce impact,
tolerate, adapt
Ability to respond Concurrent capabilities needed to react to
supply chain events on time and
efficiently, to lessen the impact of
disruptions or change the effects to ensure
a desirable outcome
Maintain control, retain structure and
function, react, change rapidly and
respond
Ability to recover Reactive capabilities essential in the
aftershock of a supply chain event, so as to
restore or return to normal operations
Survive, maintain continuity, bounce
back, return to original/normal state, move
to new/desirable state, recover, restore
quickly, in timely fashion, and cost-
effectively and resume operations
Ability to learn Reactive capabilities required after a
supply chain event to understand what has
happened and improve future performance
based on the experience
Sustain, growth, thrive, evolve, future
adjustments and profitability

53 Sarah Dewilde Cold chain distribution network design in developing countries Promoter: Prof. Dr. Nico Vandaele
Appendix IV. Overview of areas affected by recurring environmental challenges
Appendix V. Overview of immunization coverage over time

54 Sarah Dewilde Cold chain distribution network design in developing countries Promoter: Prof. Dr. Nico Vandaele
Appendix VI. CCE equipment per supply chain level
Supply chain
level
Stationary storage Equipment
Quantity Avg net volume
Transportation Equipment
Quantity Avg net volume
Central Cold room (5)
Refrigerator (12)
Total of 38.571,00
litres
Refrigerated trucks (2)
Depi trucks (3)
Rental planes or trucks
1.118 liters
1.118 liters
1.118 liters
Regional Solar fridges (134)
Electrical fridges (72)
Fuel fridges (235)
Vaccine carrier (3.983)
156 liters
156 liters
156 liters
[0,8; 3,6] liters
Pick-ups (42)
Moto (70)
Boat (2)
248 liters
21 liters
/
District Solar fridges (134)
Electrical fridges (72)
Fuel fridges (235)
Vaccine carrier (3.983)
156 liters
156 liters
156 liters
[0,8; 3,6] liters
Pick-ups (337)
Moto (448)
Boat (14)
248 liters
21 liters
/
Appendix VII. Accessibility during the rainy season
April
Jan May June
Feb Mar Aug Sep Oct July Nov Dec April
Jan Feb Mar

55 Sarah Dewilde Cold chain distribution network design in developing countries Promoter: Prof. Dr. Nico Vandaele
Appendix VIII. Overview of regional warehouses
Appendix IX. Malagasy immunization schedule Vaccine Quantity Volume Vaccine Quantity Volume
HPV13 1 12 cm3 BCG14 1 1 cm3
IPV15 1 2 cm3 PCV-1016 3 12 cm3
VAR17 1 3 cm3 DTC-HepB-Hib18 3 3 cm3
ROTA19 2 16 cm3 VPO20 4 1 cm3
VAT21 5 3 cm3 TOTAL 21 5 cm3
13 Human Papillomavirus vaccine
14 Tuberculosis vaccine
15 Inactivated Poliovirus vaccine
16 Pneumococcal Conjugate vaccine
17 Measles vaccine
18 Diphtheria and tetanus toxoids and whole-cell pertussis, Hepatitis B, Haemophilus influenza type b vaccine
19 Rotavirus vaccine
20 Oral Polio vaccine
21 Tetanus vaccine

56 Sarah Dewilde Cold chain distribution network design in developing countries Promoter: Prof. Dr. Nico Vandaele
Appendix X. Order size analysis

57 Sarah Dewilde Cold chain distribution network design in developing countries Promoter: Prof. Dr. Nico Vandaele
Appendix XI. Results of simulation run with 50% obsolete fridges
Performance at district level Left: fill rate – Right: number of IC
Fill rate at central and regional level
Sources of waste in the system

58 Sarah Dewilde Cold chain distribution network design in developing countries Promoter: Prof. Dr. Nico Vandaele
Bibliography Abubakar, A., Mahfouz, A., & Arisha, A. (2017). Analysing supply chain resilience: integrating the
constructs in a concept mapping framework via a systematic literature review. Supply Chain Management: An International Journal, 22(1), 16–39. https://doi.org/10.1108/SCM-06-2016-0197
Assi, T. M., Brown, S. T., Djibo, A., Norman, B. A., Rajgopal, J., Welling, J. S., … Lee, B. Y. (2011). Impact of changing the measles vaccine vial size on Niger’s vaccine supply chain: a computational model. BMC Public Health, 11(1), 425. https://doi.org/10.1186/1471-2458-11-425
Assi, T. M., Brown, S. T., Kone, S., Norman, B. A., Djibo, A., Connor, D. L., … Lee, B. Y. (2013). Removing the regional level from the Niger vaccine supply chain. Vaccine, 31(26), 2828–2834. https://doi.org/10.1016/j.vaccine.2013.04.011
Besiou, M., Pedraza-Martinez, A. J., & Van Wassenhove, L. (2014). Vehicle supply chains in humanitarian operations: Decentralization, operational mix, and earmarked funding. Production and Operations Management, 23(11), 1950–1965. https://doi.org/10.1111/poms.12215
Bonds, M. H., Garchitorena, A., Cordier, L. F., Miller, A. C., McCarty, M., Andriamihaja, B., … Rich, M. L. (2017). Advancing A Science For Sustaining Health: Establishing A Model Health District in Madagascar. bioRxiv, 1–7. Retrieved from http://biorxiv.org/content/early/2017/05/30/141549.abstract
Brown, S. T., & Lee, B. Y. (2011). Vaccine Supply Chain Modeling : The HERMES Project HERMES vision. Hermes.
Brown, S. T., Schreiber, B., Cakouros, B. E., Wateska, A. R., Dicko, H. M., Connor, D. L., … Lee, B. Y. (2014). The benefits of redesigning Benin’s vaccine supply chain. Vaccine, 32(32), 4097–4103. https://doi.org/10.1016/j.vaccine.2014.04.090
Bruneau, M., Chang, S. E., Eguchi, R. T., Lee, G. C., O’Rourke, T. D., Reinhorn, A. M., … Von Winterfeldt, D. (2003). A Framework to Quantitatively Assess and Enhance the Seismic Resilience of Communities. Earthquake Spectra. https://doi.org/10.1193/1.1623497
Chen, S. I., Norman, B. A., Rajgopal, J., Assi, T. M., Lee, B. Y., & Brown, S. T. (2014). A planning model for the WHO-EPI vaccine distribution network in developing countries. IIE Transactions (Institute of Industrial Engineers), 46(8), 853–865. https://doi.org/10.1080/0740817X.2013.813094
Chopra, S., & Sodhi, M. S. (2004). Managing risk to avoid supply-chain breakdown. MIT Sloan Management Review, 46, 53–61. https://doi.org/10.1108/IJOPM-10-2012-0449
Christopher, M., & Peck, H. (2004). Building the Resilient Supply Chain. The International Journal of Logistics Management, 15(2), 1–14. https://doi.org/10.1108/09574090410700275
Cummings, R. (2016, January). What Challenges Does 2016 Hold for Sub-Saharan Africa? IPI Global Observatory. Retrieved from theglobalobservatory.org/2016/01/africa-nigeria-ebola-isis-boko-haram/
Dowling, P. (2011). Healthcare Supply Chains in Developing Countries: Situational Analysis. Usaid | Deliver Project, 1. Retrieved from http://peoplethatdeliver.org/sites/peoplethatdeliver.org/files/dominique/files/Healthcare Supply Chains - Situation Analysis EN.pdf
Faturechi, R., & Miller-Hooks, E. (2014). Measuring the performance of transportation infrastructure systems in disasters: A comprehensive review. ASCE Journal of Infrastructure Systems, 21(1), 1–15. https://doi.org/10.1061/(ASCE)IS.1943-555X.0000212.
FEWS NET. (2013). Annual Livelihoods Vulnerability forecast report. Washington D.C. Retrieved from http://www.fews.net/sites/default/files/documents/reports/MG_LHZdescription_Final_EN_0.pdf

59 Sarah Dewilde Cold chain distribution network design in developing countries Promoter: Prof. Dr. Nico Vandaele
Foster, S., Laing, R., Melgaard, B., & Zaffran, M. (2006). Ensuring supplies of appropriate drugs and vaccines. Disease Control Priorities in Developing Countries, 1323–1338. https://doi.org/21250304
Garcia-Herreros, P., Wassick, J. M., & Grossmann, I. E. (2014). Design of resilient supply chains with risk of facility disruptions. Industrial and Engineering Chemistry Research, 53(44), 17240–17251. https://doi.org/10.1021/ie5004174
Gavi Alliance. (2017). Gavi country factsheet : Bangladesh. Retrieved December 18, 2017, from http://www.gavi.org/country/madagascar/
GAVI Alliance. (2016a). Gavi, the vaccine alliance 2016-2020 strategy. Gavi website. Retrieved from http://www.gavi.org/
GAVI Alliance. (2016b). Outsourcing the Distribution Component of Vaccine and Medicine Supply Chains. Retrieved from http://www.gavi.org/library/gavi-documents/white-papers/outsourcing-the-distribution-component-of-vaccine-and-medicine-supply-chains/
GAVI Alliance. (2016c). Strengthening the immunisation supply chain. https://doi.org/10.1177/109467050032001
Geoffrion, A. M., & Graves, G. W. (1974, January 1). Multicommodity Distribution System Design by Benders Decomposition: Part II. Management Science. INFORMS. https://doi.org/10.1287/mnsc.20.5.822
Government of India Ministry of Health & Family Welfare. (2016). Handbook for Vaccine & Cold Chain Handlers. Retrieved from http://www.unicef.org/india/Cold_chain_book_Final_(Corrected19-04-10).pdf
Govindan, K., Fattahi, M., & Keyvanshokooh, E. (2017). Supply chain network design under uncertainty: A comprehensive review and future research directions. European Journal of Operational Research, 263(1), 108–141. https://doi.org/10.1016/j.ejor.2017.04.009
Haidari, L. A., Connor, D. L., Wateska, A. R., Brown, S. T., Mueller, L. E., Norman, B. A., … Lee, B. Y. (2013). Only Adding Stationary Storage to Vaccine Supply Chains May Create and Worsen Transport Bottlenecks. Journal of Public Health Management and Practice, 19(6224), S65–S67. https://doi.org/10.1097/PHH.0b013e31828a83fe
Hallikas, J., Karvonen, I., Pulkkinen, U., Virolainen, V.-M., & Tuominen, M. (2004). Risk management processes in supplier networks. International Journal of Production Economics, 90(1), 47–58. https://doi.org/10.1016/j.ijpe.2004.02.007
Hanson, C. M., George, A. M., Sawadogo, A., & Schreiber, B. (2017). Is freezing in the vaccine cold chain an ongoing issue? A literature review. Vaccine. The Authors. https://doi.org/10.1016/j.vaccine.2016.09.070
Hawthorne, N., & Anderson, C. (2009). The global pharmacy workforce: a systematic review of the literature. Human Resources for Health, 7(1), 48. https://doi.org/10.1186/1478-4491-7-48
Ho, W., Zheng, T., Yildiz, H., & Talluri, S. (2015). Supply chain risk management: A literature review. International Journal of Production Research, 53(16), 5031–5069. https://doi.org/10.1080/00207543.2015.1030467
Hollnagel, E., Pariès, J., Woods, D., & Wreathall, J. (2010). Resilience Engineering in Practice - A Guidebook. Ashgate.
ICRC. (2015). Ensuring the Preparedness and Security of Health-Care Facilities in Armed Conflict. Retrieved from www.icrc.org
IMF. (2017). Regional Economic Outlook 2017 - Sub-Saharan Africa: fiscal adjustment and economic diversification. Washington D.C.: International Monetary Fund.
Jüttner, U. (2005). Supply chain risk management. The International Journal of Logistics Management,

60 Sarah Dewilde Cold chain distribution network design in developing countries Promoter: Prof. Dr. Nico Vandaele
16(1), 120–141. https://doi.org/10.1108/09574090510617385
Jüttner, U., Peck, H., & Christopher, M. (2003). Supply chain risk management: outlining an agenda for future research. International Journal of Logistics Research and Applications, 6(4), 197–210. https://doi.org/10.1080/13675560310001627016
Kaufmann, J. R., Miller, R., & Cheyne, J. (2011). Vaccine supply chains need to be better funded and strengthened, or lives will be at risk. Health Affairs, 30(6), 1113–1121. https://doi.org/10.1377/hlthaff.2011.0368
Klibi, W., & Martel, A. (2013). The design of robust value-creating supply chain networks. OR Spectrum, 35(4), 867–903. https://doi.org/10.1007/s00291-013-0327-6
Lee, B. Y., Assi, T. M., Rajgopal, J., Norman, B. A., Chen, S. I., Brown, S. T., … Burke, D. S. (2012). Impact of introducing the pneumococcal and rotavirus vaccines into the routine immunization program in Niger. American Journal of Public Health, 102(2), 269–276. https://doi.org/10.2105/AJPH.2011.300218
Lee, B. Y., Assi, T. M., Rookkapan, K., Connor, D. L., Rajgopal, J., Sornsrivichai, V., … Burke, D. S. (2011). Replacing the measles ten-dose vaccine presentation with the single-dose presentation in Thailand. Vaccine, 29(21), 3811–7. https://doi.org/10.1016/j.vaccine.2011.03.013
Lee, B. Y., Cakouros, B. E., Assi, T. M., Connor, D. L., Welling, J. S., Kone, S., … Brown, S. T. (2012). The impact of making vaccines thermostable in Niger’s vaccine supply chain. Vaccine, 30(38), 5637–5643. https://doi.org/10.1016/j.vaccine.2012.06.087
Lee, B. Y., Connor, D. L., Wateska, A. R., Norman, B. A., Rajgopal, J., Cakouros, B. E., … Brown, S. T. (2015). Landscaping the structures of GAVI country vaccine supply chains and testing the effects of radical redesign. Vaccine, 33(36), 4451–4458. https://doi.org/10.1016/j.vaccine.2015.07.033
Lee, B. Y., Haidari, L. A., Prosser, W., Connor, D. L., Bechtel, R., Dipuve, A., … Brown, S. T. (2016). Re-designing the Mozambique vaccine supply chain to improve access to vaccines. Vaccine, 34(41), 4998–5004. https://doi.org/10.1016/j.vaccine.2016.08.036
Lemmens, S., Decouttere, C., Vandaele, N., & Bernuzzi, M. (2014). Integrated supply chain network design models for vaccines: a literature review. Retrieved from https://lirias.kuleuven.be/bitstream/123456789/457366/1/KBI_1414.pdf
Lennon, P., Atuhaire, B., Yavari, S., Sampath, V., Mvundura, M., Ramanathan, N., & Robertson, J. (2017). Root cause analysis underscores the importance of understanding, addressing, and communicating cold chain equipment failures to improve equipment performance. Vaccine, 35(17), 2198–2202. https://doi.org/10.1016/j.vaccine.2016.09.068
Levine, O. (2017). The Immunization “Innovations Of Tomorrow” Are Here Today | HuffPost. Retrieved December 18, 2017, from https://www.huffingtonpost.com/entry/the-immunization-innovations-of-tomorrow-are-here_us_58fa7ef9e4b0f02c3870ea02
Li, V. (2011). Immunization Activities in Post-Conflict Settings: Field Notes from Southern Sudan. The Journal of Global Health. Retrieved from http://www.ghjournal.org/immunization-activities-in-post-conflict-settings-field-notes-from-southern-sudan/
Lydon, P., Schreiber, B., Gasca, A., Dumolard, L., Urfer, D., & Senouci, K. (2017). Vaccine stockouts around the world: Are essential vaccines always available when needed? Vaccine, 35(17), 2121–2126. https://doi.org/10.1016/j.vaccine.2016.12.071
Norman, B. A., Nourollahi, S., Chen, S. I., Brown, S. T., Claypool, E. G., Connor, D. L., … Lee, B. Y. (2013). A passive cold storage device economic model to evaluate selected immunization location scenarios. Vaccine, 31(45), 5232–5238. https://doi.org/10.1016/j.vaccine.2013.08.079
Norrman, A., & Lindroth, R. (2004). Categorization of Supply Chain Risk and Risk Management. In C. Brindley (Ed.), Supply Chain Risk (pp. 14–27). Hampshire, UK: Ashgate.

61 Sarah Dewilde Cold chain distribution network design in developing countries Promoter: Prof. Dr. Nico Vandaele
O’Marah, K. (2017, October 6). Supply Chain Risk 2020: New Worries. Forbes. Retrieved from https://www.forbes.com/sites/kevinomarah/2017/10/06/supply-chain-risk-2020-new-worries/#5751a79e7127
Path, & WHO. (2011). Optimize - Building next generation vaccine supply systems. Project Optimize. Retrieved from https://www.path.org/publications/files/TS_opt_evm_hermes_fs.pdf
Path, & WHO. (2015). Next-generation immunization supply chains are needed to improve health outcomes. Retrieved from https://www.path.org/publications/files/APP_isc_key_messages_rptv2.pdf
Persson, F., & Olhager, J. (2002). Performance simulation of supply chain designs. International Journal of Production Economics, 77(3), 231–245. https://doi.org/10.1016/S0925-5273(00)00088-8
Rosenberg, A. (2015). Sub-Saharan Africa’s most and least resilient economies. Havard Business Review, 1. Retrieved from https://hbr.org/2016/02/sub-saharan-africas-most-and-least-resilient-economies
Sabot, O., Yadav, P., & Zaffran, M. (2010). Maximizing Every Dose and Dollar : The Imperative of Efficiency in Vaccine Delivery, i, 2–4. Retrieved from http://pdf.usaid.gov/pdf_docs/PNADI194.pdf
Sarley, D., Mahmud, M., Idris, J., Osunkiyesi, M., Dibosa-Osadolor, O., Okebukola, P., & Wiwa, O. (2017). Transforming vaccines supply chains in Nigeria. Vaccine, 35(17), 2167–2174. https://doi.org/10.1016/j.vaccine.2016.11.068
Serdeczny, O., Adams, S., Baarsch, F., Coumou, D., Robinson, A., Hare, W., … Reinhardt, J. (2017). Climate change impacts in Sub-Saharan Africa: from physical changes to their social repercussions. Regional Environmental Change, 17(6), 1585–1600. https://doi.org/10.1007/s10113-015-0910-2
Sheffi, Y., & Rice Jr, J. B. (2005). A Supply Chain View of the Resilient Enterprise. MIT Sloan Management Review, 47(1), 41–48. https://doi.org/10.1007/978-0-387-79933-9
Slack, N., Chambers, S., Johnston, R., & Betts, A. (2009). Operations and process management: principles and practice for strategic impact (2nd ed.). Pearson Education.
Spekman, R. E., & Davis, E. W. (2004). Risky business: expanding the discussion on risk and the extended enterprise. International Journal of Physical Distribution & Logistics Management, 34(5), 414–433. https://doi.org/10.1108/09600030410545454
Svensson, G. (2000). A conceptual framework for the analysis of vulnerability in supply chains. International Journal of Physical Distribution & Logistics Management, 30(9), 731–750. https://doi.org/10.1108/09600030010351444
Tangcharoensathien, V., Limwattananon, S., Patcharanarumol, W., Vasavid, C., Prakongsai, P., & Pongutta, S. (2008). Private Sector Role in Health Supply Chains: Review of the Role and Potential for Private Sector Engagement in Developing Country Health Supply Chains. Health Policy, 38(2), 1–60. Retrieved from http://apps.who.int/medicinedocs/documents/s16323e/s16323e.pdf
Tomasini, R., & Van Wassenhove, L. (2009). Humanitarian Logistics (Vol. 20). Palgrave Macmillan UK. https://doi.org/10.1080/09614520903564322
Trkman, P., & McCormack, K. (2009). Supply chain risk in turbulent environments-A conceptual model for managing supply chain network risk. International Journal of Production Economics, 119(2), 247–258. https://doi.org/10.1016/j.ijpe.2009.03.002
Tukamuhabwa Rwakira, B. (2015). Supply chain resilience: a case study analysis of a supply network in a developing country context. PQDT - UK & Ireland.

62 Sarah Dewilde Cold chain distribution network design in developing countries Promoter: Prof. Dr. Nico Vandaele
UNDP. (2017). About Africa | UNDP in Africa. Retrieved December 17, 2017, from http://www.africa.undp.org/content/rba/en/home/regioninfo.html
Unicef. (2017). Solar Direct Drive Refrigeration Systems - LTA pricing for complete systems including solar system. Retrieved from https://www.unicef.org/supply/files/Solar_Direct_Drive_Price_Overview.pdf
UNICEF. (2009). UNICEF Strategy for Health 2016-2030. United Nations Children’s Fund. Retrieved from http://www.exed.hbs.edu/programs/hcs/Pages/default.aspx
UNICEF. (2014). Immunization Keeping Children Alive and Healthy. Retrieved from https://www.unicef.org/immunization/files/Immunization_brochure.pdf
UNICEF. (2016). Vaccine Price Data | Supplies and Logistics. Retrieved May 14, 2018, from https://www.unicef.org/supply/index_57476.html
USAID. (2017). Madagascar | U.S. Agency for International Development. Retrieved December 18, 2017, from https://www.usaid.gov/madagascar
Van Den Ent, M. M. V. X., Yameogo, A., Ribaira, E., Hanson, C. M., Ratoto, R., Rasolomanana, S., … Gasse, F. (2017). Equity and immunization supply chain in Madagascar. Vaccine, 35(17), 2148–2154. https://doi.org/10.1016/j.vaccine.2016.11.099
Vereecke, A., Pandelaere, E., & Boeykens, D. (2011). Supply Chain Risk Management, still in its infancy. Retrieved from https://www.vlerick.com/~/media/Corporate/Pdf-knowledge/knowledge Items/supply-chain-infancy.pdf
Wagner, S. M., & Bode, C. (2008). an Empirical Examination of Supply Chain Performance Along Several Dimensions of Risk. Journal of Business Logistics, 29(1), 307–325. https://doi.org/10.1002/j.2158-1592.2008.tb00081.x
Wan, C., Yang, Z., Zhang, D., Yan, X., & Fan, S. (2017). Resilience in transportation systems: a systematic review and future directions. Transport Reviews, 1647(November), 1–20. https://doi.org/10.1080/01441647.2017.1383532
WHO. (2004). NIP Costing , Financing and Gap Analysis Tool A Guide on how to prepare Sections 3 & 4 of a Financial Sustainability Plan. Analysis, 1–52. Retrieved from http://www.who.int/immunization/programmes_systems/financing/tools/en/fsp_annex1_en.pdf
WHO. (2008). Implementing the Reaching Every District Approach (RED): A guide for District Health Management Teams. Retrieved from http://www.mchip.net/sites/default/files/AFRO-RED_Aug2008.pdf
WHO. (2010). Increasing access to health workers in remote and rural areas through improved retention. SciencesNew York (Vol. 23). Retrieved from http://www.who.int/entity/hrh/migration/hmr_expert_meeting_dolea.pdf
WHO. (2014). comprehensive Multi-Year Planning (cMYP) A Tool and User Guide for cMYP Costing and Financing. World Health Organization. https://doi.org/WHO/IVB/06.15
WHO. (2017a). WHO and UNICEF estimates of immunization coverage : 2016 Madagascar, 1–20. Retrieved from https://data.unicef.org/wp-content/uploads/country_profiles/Madagascar/immunization_country_profiles/immunization_mdg.pdf
WHO. (2017b). WHO Vaccine Management Handbook Module: How to calculate vaccine volumes and cold chain capacity requirements, VMH-E3-01. Retrieved from http://apps.who.int/iris/bitstream/handle/10665/255749/WHO-IVB-17.06-eng.pdf;jsessionid=A35DC1FBD4434F5ADF377E248814A59A?sequence=1
WHO/UNICEF. (2016). Achieving immunization targets with the comprehensive effective vaccine management ( EVM ) framework. WHO/UNICEF Joint statement. Retrieved from

63 Sarah Dewilde Cold chain distribution network design in developing countries Promoter: Prof. Dr. Nico Vandaele
http://www.who.int/immunization/programmes_systems/supply_chain/EVM-JS_final.pdf
Wieland, A., & Marcus Wallenburg, C. (2013). The influence of relational competencies on supply chain resilience: a relational view. International Journal of Physical Distribution & Logistics Management, 43(4), 300–320. https://doi.org/10.1108/IJPDLM-08-2012-0243
World Economic Forum. (2017). Global competitiveness report 2017-2018 - Madagascar. Retrieved from http://reports.weforum.org/pdf/gci-2017-2018/WEF_GCI_2017_2018_Profile_MDG.pdf
Worldbank. (2017). Madagascar. Retrieved December 18, 2017, from http://www.worldbank.org/en/country/madagascar
Yadav, P. (2015). Health Product Supply Chains in Developing Countries: Diagnosis of the Root Causes of Underperformance and an Agenda for Reform. Health Systems & Reform, 1(2), 142–154. https://doi.org/10.4161/23288604.2014.968005
Yadav, P., Lydon, P., Oswald, J., Dicko, M., & Zaffran, M. (2014). Integration of vaccine supply chains with other health commodity supply chains: A framework for decision making. Vaccine, 32(50), 6725–6732. https://doi.org/10.1016/j.vaccine.2014.10.001
Yadav, P., Stapleton, O., & Wassenhove, L. Van. (2013). Learning from Coca-Cola | Stanford Social Innovation Review. Stanford Social Innovation Review. Retrieved from http://iaphl.org/wp-content/uploads/2016/05/SSIR-Winter_2013_Learning_From_Coca_Cola-1.pdf
Zaffran, M., Vandelaer, J., Kristensen, D., Melgaard, B., Yadav, P., Antwi-Agyei, K. O., & Lasher, H. (2013). The imperative for stronger vaccine supply and logistics systems. Vaccine, 31(SUPPL2), B73–B80. https://doi.org/10.1016/j.vaccine.2012.11.036
Interviews
Vleugels, G. & Van Roey, K. (2017, November 29). Personal Interview
Molenaers, J. (2017, November 24). Personal Interview

FACULTY OF BUSINESS AND ECONOMICS
Naamsestraat 69 bus 3500 3000 LEUVEN, Belgium
tel. + 32 16 32 66 12 fax + 32 16 32 67 91
[email protected] www.econ.kuleuven.be