VeryPDF Software Demo Version …online.verypdf.com/u/66734/api/20150719-135900-1203107884.pdf ·...
14
W14241 CANADIAN PACIFIC LTD: UNLOCKING SHAREHOLDER VALUE IN A CONGLOMERATE Michael Zawalsky wrote this case under the supervision of Professor Michael R. King solely to provide material for class discussion. The authors do not intend to illustrate either effective or ineffective handling of a managerial situation. The authors may have disguised certain names and other identifying information to protect confidentiality. This publication may not be transmitted, photocopied, digitized or otherwise reproduced in any form or by any means without the permission of the copyright holder. Reproduction of this material is not covered under authorization by any reproduction rights organization. To order copies or request permission to reproduce materials, contact Ivey Publishing, Ivey Business School, Western University, London, Ontario, Canada, N6G 0N1; (t) 519.661.3208; (e) [email protected]; www.iveycases.com. Copyright © 2014, Richard Ivey School of Business Foundation Version: 2014-10-03 It was mid-January 2001, and David O’Brien, chief executive officer (CEO) of Canadian Pacific Limited (CPL), was contemplating the future of his firm. CPL was one of Canada’s oldest conglomerates with operations in railways, shipping, natural resources and hotels. Like many CEOs, O’Brien faced pressure from shareholders to continuously improve the company’s stock performance. Unlike other pure-play companies, however, CPL’s stock market capitalization of $13.2 billion reflected a conglomerate discount, estimated at 12 per cent to 35 per cent of the value if each business were a standalone entity. 1 Since taking charge, O’Brien had narrowed CPL’s focus by divesting non-core assets while improving the profitability of the remaining businesses. This strategy had delivered results, with CPL’s stock price increasing by nearly 50 per cent to $41.60 during O’Brien’s tenure. Still, CPL’s shares had underperformed the Canadian stock market by 19 per cent (see Exhibit 1). O’Brien wondered how best to eliminate this conglomerate discount. Recently, other Canadian conglomerates such as Imasco, Noranda and Nova Corp had divested or spun off parts of their businesses. A divestiture involved the sale of a business with tax implications for shareholders of the selling company. A spinoff involved separately listing part of the company and issuing new shares to existing shareholders. If structured appropriately, a spinoff could be a tax-free transaction. Either option raised numerous operational and legal considerations. As he deliberated over CPL’s conglomerate discount, O’Brien wondered which of its five businesses to divest or spin off. He also wondered whether it would make sense to keep some of the related businesses together to preserve economies of scale and/or scope and maintain synergies. As he gazed out at the Calgary skyline, O’Brien wondered which option would unlock the most value for CPL’s shareholders. 1 All figures are Canadian dollars unless otherwise noted. For CPL’s estimated discount, see: Carlton Osakwe and Peggy Hedges, 2002, “The Diversification Discount: The Case of Canadian Pacific Limited,” Haskayne School of Business, Working Paper No. 2002-17. For exclusive use Xavier Labour Relations Institute (XLRI), 2015 This document is authorized for use only in Business Analysis and Valuation, Term - VIII, BME - 2013-16 by A. Kanagaraj, Xavier Labour Relations Institute (XLRI) from May 2015 to November 2015. VeryPDF Software Demo Version (http://www.verypdf.com) VeryPDF Software Demo Version (http://www.verypdf.com)
Transcript of VeryPDF Software Demo Version …online.verypdf.com/u/66734/api/20150719-135900-1203107884.pdf ·...

W14241
CANADIAN PACIFIC LTD: UNLOCKING SHAREHOLDER VALUE IN A CONGLOMERATE Michael Zawalsky wrote this case under the supervision of Professor Michael R. King solely to provide material for class discussion. The authors do not intend to illustrate either effective or ineffective handling of a managerial situation. The authors may have disguised certain names and other identifying information to protect confidentiality. This publication may not be transmitted, photocopied, digitized or otherwise reproduced in any form or by any means without the permission of the copyright holder. Reproduction of this material is not covered under authorization by any reproduction rights organization. To order copies or request permission to reproduce materials, contact Ivey Publishing, Ivey Business School, Western University, London, Ontario, Canada, N6G 0N1; (t) 519.661.3208; (e) [email protected]; www.iveycases.com. Copyright © 2014, Richard Ivey School of Business Foundation Version: 2014-10-03
It was mid-January 2001, and David O’Brien, chief executive officer (CEO) of Canadian Pacific Limited (CPL), was contemplating the future of his firm. CPL was one of Canada’s oldest conglomerates with operations in railways, shipping, natural resources and hotels. Like many CEOs, O’Brien faced pressure from shareholders to continuously improve the company’s stock performance. Unlike other pure-play companies, however, CPL’s stock market capitalization of $13.2 billion reflected a conglomerate discount, estimated at 12 per cent to 35 per cent of the value if each business were a standalone entity.1 Since taking charge, O’Brien had narrowed CPL’s focus by divesting non-core assets while improving the profitability of the remaining businesses. This strategy had delivered results, with CPL’s stock price increasing by nearly 50 per cent to $41.60 during O’Brien’s tenure. Still, CPL’s shares had underperformed the Canadian stock market by 19 per cent (see Exhibit 1). O’Brien wondered how best to eliminate this conglomerate discount. Recently, other Canadian conglomerates such as Imasco, Noranda and Nova Corp had divested or spun off parts of their businesses. A divestiture involved the sale of a business with tax implications for shareholders of the selling company. A spinoff involved separately listing part of the company and issuing new shares to existing shareholders. If structured appropriately, a spinoff could be a tax-free transaction. Either option raised numerous operational and legal considerations. As he deliberated over CPL’s conglomerate discount, O’Brien wondered which of its five businesses to divest or spin off. He also wondered whether it would make sense to keep some of the related businesses together to preserve economies of scale and/or scope and maintain synergies. As he gazed out at the Calgary skyline, O’Brien wondered which option would unlock the most value for CPL’s shareholders.
1 All figures are Canadian dollars unless otherwise noted. For CPL’s estimated discount, see: Carlton Osakwe and Peggy Hedges, 2002, “The Diversification Discount: The Case of Canadian Pacific Limited,” Haskayne School of Business, Working Paper No. 2002-17.
For exclusive use Xavier Labour Relations Institute (XLRI), 2015
This document is authorized for use only in Business Analysis and Valuation, Term - VIII, BME - 2013-16 by A. Kanagaraj, Xavier Labour Relations Institute (XLRI) from May 2015 to November 2015.
VeryPDF Software Demo Version (http://www.verypdf.com)
VeryPDF Software Demo Version (http://www.verypdf.com)
VeryPDF.com Inc. (http://www.verypdf.com)
Demo Version
This is the demo version of VeryPDF Software, please purchase the full version of VeryPDF Software from http://www.verypdf.com/ site to remove this watermark.

Page 2 9B14N017 COMPANY HISTORY AND OVERVIEW Canadian Pacific was a true national champion and an iconic Canadian company. It was incorporated by an act of parliament on February 15, 1881 as the Canadian Pacific Railway (CPR) with the goal of completing a transcontinental railway to connect Canada from coast to coast (see Exhibit 2). CPR was granted $25 million in cash (equivalent to nearly $2.5 billion in 2000 dollars), 25 million acres of land and associate mineral rights, over 1,000 km of completed rail, and a 20-year rail monopoly to the west of Lake Superior.2 In 1883, CPR listed on the New York Stock Exchange – one of the first foreign companies to achieve this feat. As the railway business expanded westward, CPR found it efficient to enter new lines of business that complemented its rail operations. It expanded into shipping in the late 1880s, and then built hotels for its passengers in major Canadian cities and tourist destinations. After discovering energy resources on its land, CPR moved into oil and gas production and coal mining. By 1971, the company restructured, creating a holding company — Canadian Pacific Limited — with CPR as a wholly-owned subsidiary known as CP Rail. This restructuring allowed CPL’s other businesses to avoid operating as part of the heavily regulated rail company. CPL continued acquiring businesses through the 1970s. By 1981, it owned over 160 businesses with an additional 100 minority investments. CPL was a sprawling entity with business lines as diverse as china and crockery, forestry, insurance, milling, pulp and paper and radio broadcasting, among others. It was Canada’s seventh largest company by assets and Canada’s largest private-sector employer, with over 127,000 employees.3 By the early 1990s, CPL’s financial performance deteriorated, ultimately forcing a change in leadership. O’Brien, previously the CEO of PanCanadian Energy, was promoted to president of CPL in January 1995, then named CEO in May 1996. It soon became apparent that O’Brien had no intention of being a “caretaker CEO.” One of his first steps was to relocate CPL’s headquarters from its historic base in Montreal to Calgary, closer to its operations in Western Canada. O’Brien’s first order of business was to divest non-core assets and improve operating performance. In September 1996, he sold Marathon Realty for $952 million, followed by the sale in June 1997 of CPL’s minority stake in Laidlaw, a bus transportation company, for $1 billion. These divestitures narrowed the focus to five core businesses. By 1998, O’Brien had reduced assets by $3 billion, cut the debt load, tripled revenues and turned a net loss in 1995 into a profit by 2000 (see Exhibits 3 & 4). Despite these impressive results, CPL’s conglomerate discount persisted. In May 1998, an equity analyst for Salomon Smith Barney estimated the discount at around 21 per cent (see Exhibit 5).4 With CPL’s share price currently trading at $41.60, O’Brien was not sure what the current discount was but he was determined to address it. OVERVIEW OF CPL BUSINESSES CPL operated five businesses: PanCanadian Petroleum, CP Rail, CP Ships, Canadian Pacific Hotels & Resorts, and Fording Coal. Exhibit 6 provides financial information on each business.
2 www.thecanadianencyclopedia.com/en/article/canadian-pacific-railway/, accessed April 9, 2014. 3 Osakwe and Hedges, op. cit. 4 Andrew Bary, “From Sleepy to Sleeper: Canadian Pacific's revival is apparent everywhere but in its stock price,” Barron’s, May 18, 1998, p. B30.
For exclusive use Xavier Labour Relations Institute (XLRI), 2015
This document is authorized for use only in Business Analysis and Valuation, Term - VIII, BME - 2013-16 by A. Kanagaraj, Xavier Labour Relations Institute (XLRI) from May 2015 to November 2015.
VeryPDF Software Demo Version (http://www.verypdf.com)
VeryPDF Software Demo Version (http://www.verypdf.com)
VeryPDF.com Inc. (http://www.verypdf.com)
Demo Version
This is the demo version of VeryPDF Software, please purchase the full version of VeryPDF Software from http://www.verypdf.com/ site to remove this watermark.

Page 3 9B14N017 PanCanadian Petroleum Ltd. (PanCanadian) PanCanadian was one of Canada’s largest producers and marketers of crude oil and natural gas. While PanCanadian had various U.S. assets, the company’s strength came from its reserves in Western Canada. Low operating costs, high-quality production and above average asset returns were key value drivers. PanCanadian was heavily weighted towards natural gas production, though there was massive potential growth through the company’s assets in the Alberta oil sands. A rise in natural gas and oil prices made PanCanadian the most profitable of CPL’s businesses, generating 50 per cent of CPL’s 2000 net income. PanCanadian was trading at a premium to its Canadian peer group, but at a discount to American peers. CPL owned roughly 86 per cent of PanCanadian’s shares, with the remaining 14 per cent traded on the Toronto Stock Exchange under the ticker PCP. Canadian Pacific Railway (CP Rail) CP Rail provided rail freight transportation across a 22,530 km network extending across Canada and into the United States. CP Rail was the smallest among Class 1 rail operators (identified as rail companies with gross revenues exceeding $250 million), but was one of the most efficient with a ratio of operating expenses to revenues of 77 per cent. CP Rail had taken considerable steps to achieve this efficiency, cutting its workforce by 21 per cent between 1996 and 2001. CP Rail was also poised to grow as business expanded between Asia and North America. Its main Canadian competitor was CN Rail. CP Ships CP Ships operated regional ocean and inland transportation services mainly on three key routes: Transatlantic, Latin America and Australasia. With over 150,000 TEUs5 and revenues of $3.9 billion in 2000, CP Ships was one of the ten largest container-shipping companies in the world. CP Ships was in the middle of a three-year, $1 billion capital renewal program and had limited ability to take on and repay any new debt. Unlike the other CPL businesses, CP Ships had no direct competitors in the North American market, and few traded peers globally as most leading shipping companies were privately held. Canadian Pacific Hotels & Resorts (CPHR) CPHR was a hotel and resort management company with over 76 properties and 30,000 rooms, operating primarily under the Fairmont Hotels brand. CPHR’s main value driver was its unique collection of premium hotels in Canada’s largest cities (including Vancouver, Toronto and Montreal) as well as top tourist resorts (such as Banff Springs and Lake Louise). Occupancy rates stood at 63.9 per cent and revenue per room was $154. Both metrics were forecasted to improve with these figures rising by 2005 to 70 per cent and $230, respectively, much stronger forecast growth than its peer group. CPHR’s closest comparables were Starwood, Hilton Hotels and Orient Express.
5 TEUs are “twenty foot equivalent units,” a key metric for shipping companies indicating shipping capacity.
For exclusive use Xavier Labour Relations Institute (XLRI), 2015
This document is authorized for use only in Business Analysis and Valuation, Term - VIII, BME - 2013-16 by A. Kanagaraj, Xavier Labour Relations Institute (XLRI) from May 2015 to November 2015.
VeryPDF Software Demo Version (http://www.verypdf.com)
VeryPDF Software Demo Version (http://www.verypdf.com)
VeryPDF.com Inc. (http://www.verypdf.com)
Demo Version
This is the demo version of VeryPDF Software, please purchase the full version of VeryPDF Software from http://www.verypdf.com/ site to remove this watermark.

Page 4 9B14N017 Fording Coal (Fording) Fording was a producer and distributor of metallurgical coal and industrial minerals with three major mines in the province of British Columbia. Fording was the second largest producer of metallurgical coal in the world with a market share of 14 per cent and revenue of $896 million in 2000. Despite this figure, it was small relative to other mining companies. Fording was a low-cost producer with high-quality, long-life assets. Rising coal prices were expected to lead to strong cash flows over the coming years. Due to its small contribution, Fording was generally overlooked by equity analysts when valuing CPL. THE CONGLOMERATE DISCOUNT A conglomerate is a company that combines unrelated businesses under one corporate structure. Conglomerates became fashionable during the 1960s and 1970s with investors awarding them premium valuations. Proponents argue a conglomerate structure is superior because it provides: • Access to cheaper capital through internal capital markets: Internally generated cash flows across
businesses lowered the cost of capital and increased the ability to finance investments without relying on costly public capital markets.
• More efficient capital allocation: Management is more informed than investors and can identify and allocate capital more efficiently to superior investment opportunities.
• Diversified and resilient cash flows: The portfolio of businesses is better able to withstand shocks or economic cycles that harm the performance of pure-play companies, lowering overall risk.
Critics note certain drawbacks including: • Subsidization of poorly performing divisions: Critics argue that managers tend to cross-subsidize
poorly performing divisions with cash flows from healthier businesses. • Managerial inefficiencies: It is difficult for a management team to operate efficiently in multiple
industries, as each can require a different strategy and set of management skills. • Poor analyst coverage: Equity analysts, who specialize in a specific industry, find it challenging to
follow and value the many businesses operated by a conglomerate. By the 1980s and early 1990s, conglomerates had fallen out of fashion. Investors preferred pure-play companies operating in a single industry that were easier to value and understand. Academic research suggested that conglomerates were trading at a discount of 15 per cent to the sum of their parts on average.6 In the case of CPL, internal estimates placed the conglomerate discount at around 10 to 15 per cent, while external analysis suggested a figure closer to 25 per cent.7 O’Brien suspected CPL’s discounted stock price was due to poor coverage by equity analysts. CPL’s stock was covered either by railroad analysts, or oil and gas analysts, who had limited knowledge of CPL’s other businesses. These equity analysts were also unsure of the tax implications of any potential asset restructuring. FINANCIAL OPTIONS O’Brien had been privately considering the possibility of restructuring CPL’s businesses for nearly two years. To set the stage for this possibility, he had focused on improving each company’s operating
6 Philip G. Berger and Eli Ofek, 1995, “Diversification’s effect on firm value,” Journal of Financial Economics 37: 39-65. 7 Osakwe and Hedges, op. cit..
For exclusive use Xavier Labour Relations Institute (XLRI), 2015
This document is authorized for use only in Business Analysis and Valuation, Term - VIII, BME - 2013-16 by A. Kanagaraj, Xavier Labour Relations Institute (XLRI) from May 2015 to November 2015.
VeryPDF Software Demo Version (http://www.verypdf.com)
VeryPDF Software Demo Version (http://www.verypdf.com)
VeryPDF.com Inc. (http://www.verypdf.com)
Demo Version
This is the demo version of VeryPDF Software, please purchase the full version of VeryPDF Software from http://www.verypdf.com/ site to remove this watermark.

Page 5 9B14N017 performance to ensure that they would be strong and able to stand on their own. He had been exploring CPL’s options with his advisors at RBC Dominion Securities. The two debated several strategies to raise the stock price and eliminate the conglomerate discount: 1. Divest one or more businesses Selling one or more of CPL’s businesses would narrow the focus of the firm and alleviate CPL’s conglomerate discount. There would be many potential buyers for these assets, either strategic (i.e., competitors) or financial (i.e., private equity firms). Any sale would be relatively simple from both an operational and a media communications point of view. CPL management could make the decision without the requirement to hold a shareholder vote. A divesture would generate funds to pay down debt and lower leverage across CPL’s remaining businesses. Or the cash could be paid out as a special dividend to shareholders or used to repurchase shares. Equity analysts were advocating this strategy. The main disadvantage of a divestiture was the tax treatment. A divestiture was a taxable event, with CPL paying a capital gains tax on the difference between the equity value of the assets and the adjusted cost base (see Exhibit 6). Half of the any capital gain would be taxed at CPL’s corporate rate of 42 per cent, with any distribution taxable to shareholders as dividends. For example, if CPL sold a business with an adjusted cost base of $10 for $11, CPL would realize a capital gain of $1. Half of this capital gain, or $0.50, would be taxed at a rate of 42 per cent, increasing taxes payable by $0.21. CPL could not avoid this corporate tax, as it had no tax loss carry-forwards to shelter gains from a sale. 2. Spin off one or more businesses A spinoff differed from a divestiture in that no actual sale occurred; rather it involved a split of legal entities with no change in ownership. CPL’s shareholders would receive shares in two listed companies, with the shares trading a different prices based on the value of the underlying businesses. If CPL were to spin off CP Rail, existing shareholders in CPL would continue to hold CPL stock while also being issued new stock in CP Rail at a specified conversion rate. CPL’s share price would fall, reflecting the lower value of the remaining assets, but the combined value of the CPL shares plus the new CP Rail shares would be potentially higher. A spinoff would need to be approved by a vote of all shareholders at a special meeting. Shareholders would be mailed a proxy circular outlining the transaction. This process would take valuable management time and corporate resources including legal and financial costs. In Canada a tax-free spinoff was known as a “butterfly reorganization. Recent notable butterfly reorganizations were Shaw Communications’ spinoff of Corus Entertainment and BCE’s spinoff of Nortel Networks. A butterfly reorganization was a complex process involving numerous steps. If CPL were to spin off any businesses in this fashion, CPL would first need to get a favourable tax ruling from Canadian tax authorities. The biggest risk was that the tax exemption could be denied, or a retro-active double tax could be triggered by actions taken after the spinoff was complete. If Revenue Canada felt a spinoff was designed to facilitate a future acquisition of the newly-listed entity, such a transaction would be deemed taxable. For this reason, a spinoff company could not solicit or otherwise discuss any potential sale for a period of time before and after the split. Most troubling to O’Brien, this restriction would cover a period of up to two years following the spinoff. O’Brien’s tax advisors at Felesky Flynn LLP advised him that this double tax for CPL could be in the billions of dollars.
For exclusive use Xavier Labour Relations Institute (XLRI), 2015
This document is authorized for use only in Business Analysis and Valuation, Term - VIII, BME - 2013-16 by A. Kanagaraj, Xavier Labour Relations Institute (XLRI) from May 2015 to November 2015.
VeryPDF Software Demo Version (http://www.verypdf.com)
VeryPDF Software Demo Version (http://www.verypdf.com)
VeryPDF.com Inc. (http://www.verypdf.com)
Demo Version
This is the demo version of VeryPDF Software, please purchase the full version of VeryPDF Software from http://www.verypdf.com/ site to remove this watermark.

Page 6 9B14N017 3. Spin off all five businesses simultaneously O’Brien was aware that analysts and investors would not be surprised by either the divestiture or spinoff of a single business. The market reaction would be predictable and the media communications straightforward. O’Brien worried, however, wehther this would be enough to address the conglomerate discount. O’Brien had been privately contemplating something bolder, namely the spinoff of all five CPL businesses simultaneously. This ‘starburst’ strategy would see the creation of five separately-listed companies, with CPL ceasing to exist. One of Canada’s most iconic companies would disappear. While O’Brien’s financial and tax advisors advised him that a butterfly transaction was possible, there was no precedent for a five-way butterfly. Much work would need to be done to convince Revenue Canada – a process that could take months and would require much faith in this agency. O’Brien’s main concern was how the idea would be received by the financial markets. Would they see this starburst as a move of desperation? While most disaggregations produced value in excess of 30 per cent during the 1990s, those driven by desperation were more likely to destroy shareholder value.8 Hanson plc, a British conglomerate, saw its share price drop by 20 per cent in the weeks after the announcement of a four-way split.9 CPL’s businesses, however, had seen major improvements and a return to profitability during O’Brien’s tenure. He felt that all businesses could survive on their own. He did wonder if it made sense to combine CP Ships with CP Rail to form a separate transportation company. The case could also be made for combining PanCanadian with Fording Coal. Finally, there would be some tough negotiations over how CPL’s debt and overhead expenses would be allocated amongst the businesses. If CPL were split entirely, the existing debt held at the holding company would need to be paid off or assigned, together with an additional $1.0 billion in liabilities and restructuring charges. Funds to pay these liabilities would need to be raised by issuing new debt. CPL was currently rated Baa1 by Moody’s, and O’Brien estimated any new debt would be issued to yield 7.0% per annum. O’Brien wanted to be sure that all of the businesses had appropriate capital structures for their respective industries (see Exhibit 7), and that all companies would retain an investment grade credit rating at a minimum. Exhibit 8 provides details on the current debt outstanding for each business. Exhibit 9 provides the median credit ratios for each rating category for US industrial debt over the prior three years. Other Options O’Brien realized that there were other options. CPL could continue on its path and improve its corporate performance. It could grow even larger through acquisitions. O’Brien could re-double his communications with analysts and investors to convince them of the benefits of the conglomerate model. Business as usual might not be attractive, but it was certainly the path of least resistance. But with CPL’s share price underperforming the market, O’Brien worried that a failure to take action might attract an activist investor who could force the issue.
8 Patrick T. Finegan, 1998, “A Closer Look at the Value of Split-Ups”, Corporate Finance Review March/April 1998:26-31. 9 Iain Jenkins, 1996, “How Hanson tied itself into financial knots,” Global Finance 10.8: 28-35.
For exclusive use Xavier Labour Relations Institute (XLRI), 2015
This document is authorized for use only in Business Analysis and Valuation, Term - VIII, BME - 2013-16 by A. Kanagaraj, Xavier Labour Relations Institute (XLRI) from May 2015 to November 2015.
VeryPDF Software Demo Version (http://www.verypdf.com)
VeryPDF Software Demo Version (http://www.verypdf.com)
VeryPDF.com Inc. (http://www.verypdf.com)
Demo Version
This is the demo version of VeryPDF Software, please purchase the full version of VeryPDF Software from http://www.verypdf.com/ site to remove this watermark.

Page 7 9B14N017 THE DECISION As CEO, O’Brien knew that CPL’s shareholders were looking to him to make a decision. He believed that it no longer made sense to keep all five of CPL businesses together, but he needed to decide which option would maximize shareholder value. He was concerned about the potential tax penalty of a divestiture. Even a spinoff might not receive a favourable tax ruling. If it did, actions in the future might trigger a retroactive double-tax. He wondered how CPL’s shareholders would react if he proposed breaking up this iconic Canadian company. If he decided to move ahead with a five-way spinoff, how would the financial markets react? Was the starburst too bold a move?
The Ivey Business School gratefully acknowledges the generous support of the Bank of Montreal Fellowship in the development of this case.
For exclusive use Xavier Labour Relations Institute (XLRI), 2015
This document is authorized for use only in Business Analysis and Valuation, Term - VIII, BME - 2013-16 by A. Kanagaraj, Xavier Labour Relations Institute (XLRI) from May 2015 to November 2015.
VeryPDF Software Demo Version (http://www.verypdf.com)
VeryPDF Software Demo Version (http://www.verypdf.com)
VeryPDF.com Inc. (http://www.verypdf.com)
Demo Version
This is the demo version of VeryPDF Software, please purchase the full version of VeryPDF Software from http://www.verypdf.com/ site to remove this watermark.

Page 8 9B14N017
EXHIBIT 1: CANADIAN PACIFIC LTD. SHARE PERFORMANCE VERSUS THE STOCK MARKET
Source: Case writers
EXHIBIT 2: TIMELINE OF CANADIAN PACIFIC LTD.’S DEVELOPMENT
Source: Case writers
For exclusive use Xavier Labour Relations Institute (XLRI), 2015
This document is authorized for use only in Business Analysis and Valuation, Term - VIII, BME - 2013-16 by A. Kanagaraj, Xavier Labour Relations Institute (XLRI) from May 2015 to November 2015.
VeryPDF Software Demo Version (http://www.verypdf.com)
VeryPDF Software Demo Version (http://www.verypdf.com)
VeryPDF.com Inc. (http://www.verypdf.com)
Demo Version
This is the demo version of VeryPDF Software, please purchase the full version of VeryPDF Software from http://www.verypdf.com/ site to remove this watermark.

Page 9 9B14N017
EXHIBIT 3: CANADIAN PACIFIC LTD. CONSOLIDATED FINANCIAL STATEMENTS For the Year Ended December 31 2000 1999 1998Revenues 16,102 11,367 10,151Cost of goods sold and services 10,356 7,479 6,432Selling, general and administrative 1,249 1,560 1,193Depreciation, depletion and amortization 1,274 1,082 1,050Operating income (EBIT) 3,223 1,246 1,476Interest expense, net 321 275 251Non-operating expense 123 46 77Earnings before income tax, minority interest and goodwill 2,778 926 1,148Income tax expense 815 244 294Income to Minority interest 152 48 20Goodwill charges, net of tax 45 40 33Net income available to common shareholders 1,767 594 801
Average number of common shares outstanding (millions) 317.9 331.5 335.8Earnings per share 5.56$ 1.79$ 2.39$
For exclusive use Xavier Labour Relations Institute (XLRI), 2015
This document is authorized for use only in Business Analysis and Valuation, Term - VIII, BME - 2013-16 by A. Kanagaraj, Xavier Labour Relations Institute (XLRI) from May 2015 to November 2015.
VeryPDF Software Demo Version (http://www.verypdf.com)
VeryPDF Software Demo Version (http://www.verypdf.com)
VeryPDF.com Inc. (http://www.verypdf.com)
Demo Version
This is the demo version of VeryPDF Software, please purchase the full version of VeryPDF Software from http://www.verypdf.com/ site to remove this watermark.

Page 10 9B14N017
EXHIBIT 4: CANADIAN PACIFIC LTD. CONSOLIDATED BALANCE SHEET (Canadian dollars in millions)
Current Liabilities
Bank Loans 271 41 42Commercial paper 898 725 853Accounts payable and accrued liabilities 3,179 2,595 2,828Income and other taxes payable 203 155 137Dividends payable 52 53 51Long term debt maturing within one year 426 50 163Total Current Liabilities 5,028 3,618 4,074
Deferred liabilities 1,356 1,388 1,061Long Term Debt 4,032 3,491 3,300Future Income Taxes 3,423 2,600 2,879Minority Shareholders' Interest 772 585 358Shareholder's Equity
Common shares 1,915 1,966 1,770Paid-in surplus 228 596 791Foreign currency translation adjustment 139 58 187Retained Income 7,274 5,648 5,250Total Shareholders' Equity 9,556 8,269 7,998
Total Liabilities and Shareholders' Equity 24,166 19,950 19,669
Consolidated Statement of Cash Flows 2000 1999 1998OPERATING ACTIVITIES (Canadian dollars in millions)Net Income 1,767 594 801Depreciation, depletion and amortization 1,320 1,123 1,084Future income taxes expense 696 167 159Minority interest share of income of subsidiary 152 48 20Restructuring provision 0 472 0Amortization of exchange losses 11 8 9Gains for sales of businesses, investments and properties (3) (20) (52)Other (24) (43) 4Restructuring payments (163) (140) (117)Other operating activities, net (263) 11 (62)Decrease (increase) in non-cash working capital balances (153) (402) 870Cash from operations 3,341 1,820 2,716
FINANCING ACTIVITIESDividends paid to shareholder of the Corporation (192) (193) (175)Dividends paid to minority shareholders of subsidiaries (14) (14) (14)Issuance of commercial paper 633 111 853Repayment of commercial paper (460) (240) 0Issuance of long term debt 1,053 647 643Repayment of long term debt (187) (476) (226)Issuance of shares by subsidiaries 86 123 1Buy-back of shares by subsidiaries (8) 0 0Issuance of common shares by the Corporation 18 9 22Buy-back of common shares by the Corporation (438) (10) (325)
492 (42) 779INVESTING ACTIVITIESBusiness acquisitions and investments (1,263) (28) (1,243)Additions to properties (2,587) (1,977) (2,337)Sales of businesses, investments and properties 306 178 158Other investing activities (176) 0 54
(3,720) (1,827) (3,369)CASH POSITIONIncrease (decrease) in cash 113 (50) 127Cash at beginning of year 521 571 444Cash at end of year 633 521 571
Source: Canadian Pacific Ltd. 2000 Annual Report
For exclusive use Xavier Labour Relations Institute (XLRI), 2015
This document is authorized for use only in Business Analysis and Valuation, Term - VIII, BME - 2013-16 by A. Kanagaraj, Xavier Labour Relations Institute (XLRI) from May 2015 to November 2015.
VeryPDF Software Demo Version (http://www.verypdf.com)
VeryPDF Software Demo Version (http://www.verypdf.com)
VeryPDF.com Inc. (http://www.verypdf.com)
Demo Version
This is the demo version of VeryPDF Software, please purchase the full version of VeryPDF Software from http://www.verypdf.com/ site to remove this watermark.
Page 11 9B14N017
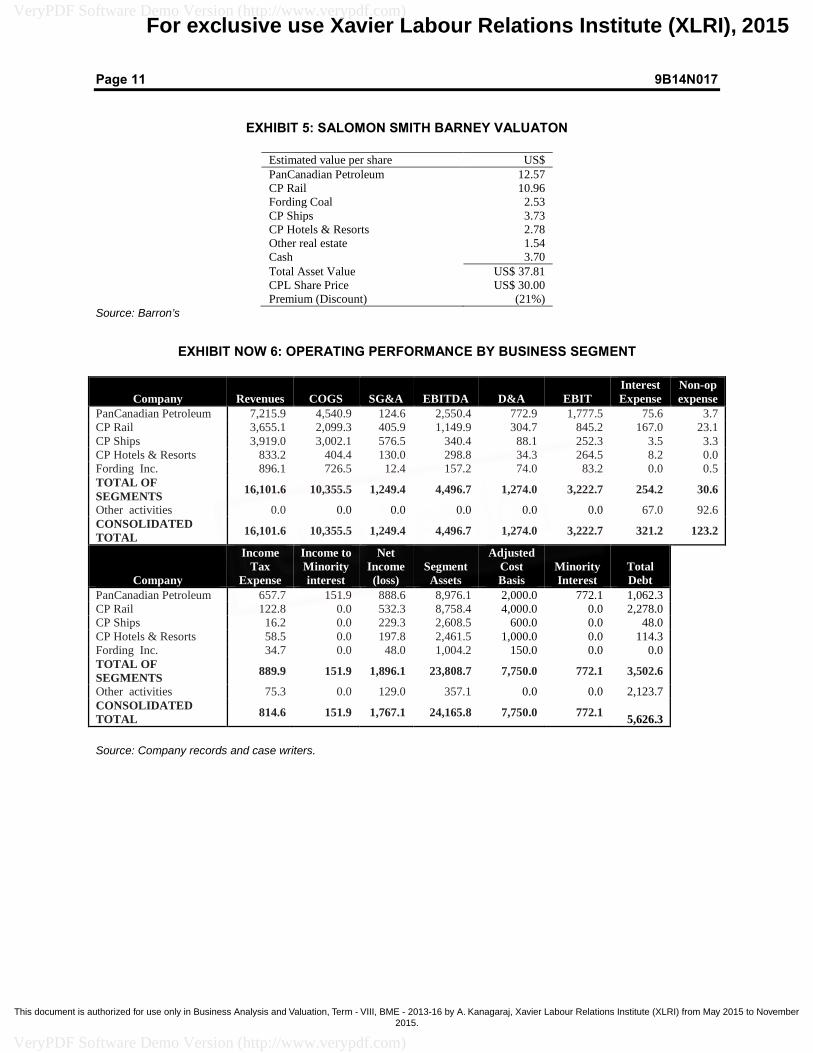
EXHIBIT 5: SALOMON SMITH BARNEY VALUATON
Estimated value per share US$ PanCanadian Petroleum 12.57 CP Rail 10.96 Fording Coal 2.53 CP Ships 3.73 CP Hotels & Resorts 2.78 Other real estate 1.54 Cash 3.70 Total Asset Value US$ 37.81 CPL Share Price US$ 30.00 Premium (Discount) (21%)
Source: Barron’s
EXHIBIT NOW 6: OPERATING PERFORMANCE BY BUSINESS SEGMENT
Source: Company records and case writers.
Company Revenues COGS SG&A EBITDA D&A EBIT Interest Expense
Non-op expense
PanCanadian Petroleum 7,215.9 4,540.9 124.6 2,550.4 772.9 1,777.5 75.6 3.7 CP Rail 3,655.1 2,099.3 405.9 1,149.9 304.7 845.2 167.0 23.1 CP Ships 3,919.0 3,002.1 576.5 340.4 88.1 252.3 3.5 3.3 CP Hotels & Resorts 833.2 404.4 130.0 298.8 34.3 264.5 8.2 0.0 Fording Inc. 896.1 726.5 12.4 157.2 74.0 83.2 0.0 0.5 TOTAL OF SEGMENTS 16,101.6 10,355.5 1,249.4 4,496.7 1,274.0 3,222.7 254.2 30.6
Other activities 0.0 0.0 0.0 0.0 0.0 0.0 67.0 92.6 CONSOLIDATED TOTAL 16,101.6 10,355.5 1,249.4 4,496.7 1,274.0 3,222.7 321.2 123.2
Company
Income Tax
Expense
Income to Minority interest
Net Income (loss)
Segment Assets
Adjusted Cost Basis
Minority Interest
Total Debt
PanCanadian Petroleum 657.7 151.9 888.6 8,976.1 2,000.0 772.1 1,062.3 CP Rail 122.8 0.0 532.3 8,758.4 4,000.0 0.0 2,278.0 CP Ships 16.2 0.0 229.3 2,608.5 600.0 0.0 48.0 CP Hotels & Resorts 58.5 0.0 197.8 2,461.5 1,000.0 0.0 114.3 Fording Inc. 34.7 0.0 48.0 1,004.2 150.0 0.0 0.0 TOTAL OF
SEGMENTS 889.9 151.9 1,896.1 23,808.7 7,750.0 772.1 3,502.6 Other activities 75.3 0.0 129.0 357.1 0.0 0.0 2,123.7
CONSOLIDATED TOTAL 814.6 151.9 1,767.1 24,165.8 7,750.0 772.1 5,626.3
For exclusive use Xavier Labour Relations Institute (XLRI), 2015
This document is authorized for use only in Business Analysis and Valuation, Term - VIII, BME - 2013-16 by A. Kanagaraj, Xavier Labour Relations Institute (XLRI) from May 2015 to November 2015.
VeryPDF Software Demo Version (http://www.verypdf.com)
VeryPDF Software Demo Version (http://www.verypdf.com)
VeryPDF.com Inc. (http://www.verypdf.com)
Demo Version
This is the demo version of VeryPDF Software, please purchase the full version of VeryPDF Software from http://www.verypdf.com/ site to remove this watermark.

Page 12 9B14N017
EXHIBIT 7: COMPARABLE COMPANIES AND MARKET MULTIPLES BY BUSINESS (Canadian dollars in millions)
Source: Company reports and case writers.
Equity Net Enterprise EV / EBITDA /Value Debt Value EBITDA Interest Exp
PanCanadian Energy:Alberta Energy 10,814 4,402 15,216 5.2x 12.1xAnderson Exploration 2,244 1,631 3,875 4.2x 14.5xCanadian Natural Resources 4,096 2,484 6,580 3.0x 13.3xNexen Inc. 4,741 2,046 6,787 3.7x 13.5xTalisman Energy 8,553 1,879 10,432 3.3x 23.8x
Average 3.9x 15.4xMedian 3.7x 13.5x
CP RailBurlington Northern Santa Fe Corp. 12,163 6,856 19,019 6.5x 6.2xCanadian National Rail Company 12,401 4,815 17,216 9.5x 6.1xCSX Corp. 7,917 6,257 14,174 6.9x 2.7xNorfolk Southern Corp. 8,509 7,985 16,494 7.7x 2.4xUnion Pacific Corp. 14,234 9,965 24,199 7.7x 4.2x
Average 7.7x 4.3xMedian 7.7x 4.2x
CP ShipsEvergreen Marine Corp. 901 441 1,342 9.8x 3.4xHanjin Shipping Co. 200 2,600 2,800 5.8x 2.3xNeptune Orient Lines 1,043 1,518 2,561 4.3x 6.4xOrient Overseas Int'l Ltd. 262 531 793 5.3x 2.9xWan Hai 614 40 654 4.6x 100.6xYangming Marine Transport 462 138 600 4.9x 56.7x
Average 5.8x 28.7xMedian 5.1x 4.9x
CP Hotels & ResortsFour Season Hotels & Resorts 1,761 101 1,862 20.2x nmfMarriott International Inc. 11,333 105 11,438 10.0x 34.9xStarwood Hotels & Resorts 7,301 4,921 12,222 7.9x 3.7xHilton Hotels Corp. 4,529 4,353 8,882 7.2x 3.3xOrient Express Hotels Ltd. 679 186 865 6.6x 5.7x
Average 10.4x 11.9xMedian 7.9x 4.7x
Fording CoalConsol Energy Inc. 2,378 379 2,758 6.9x 6.5xArch Coal Inc. 1,546 620 2,166 7.9x 3.1xMassey Energy Co. 1,809 592 2,401 11.1x 3.4xP&L Coal Holdings ($28 IPO Price) 1,389 1,011 2,401 7.2x 2.7xP&L Coal Holdings (Live Price) 1,652 1,011 2,663 8.0x 2.7xLuscar Coal Income Fund 397 581 979 8.8x 2.1x
Average 8.3x 3.4xMedian 8.0x 2.9x
For exclusive use Xavier Labour Relations Institute (XLRI), 2015
This document is authorized for use only in Business Analysis and Valuation, Term - VIII, BME - 2013-16 by A. Kanagaraj, Xavier Labour Relations Institute (XLRI) from May 2015 to November 2015.
VeryPDF Software Demo Version (http://www.verypdf.com)
VeryPDF Software Demo Version (http://www.verypdf.com)
VeryPDF.com Inc. (http://www.verypdf.com)
Demo Version
This is the demo version of VeryPDF Software, please purchase the full version of VeryPDF Software from http://www.verypdf.com/ site to remove this watermark.

Page 13 9B14N017
EXHIBIT 8: CANADIAN PACIFIC DEBT AT YEAR-END 2000 (Canadian dollars in millions)
PanCanadian Petroleum Limited
5.5%-8.4% medium term notes due 2001-2008 825.0
8.75% Debentures due 2005 200.0
Bank loans 37.3
1,062.3 CP Rail
6.875-9.45% Debentures due 2003-2022 1,132.5
7.20% medium term notes due 2005 250.0
Perpetual 4% Consolidated Debenture Stock 61.3
6.91% Secured Equipment Notes due 2005-2024 235.0
7.49% Equipment Trust Certificates due 2005-2021 181.2
Secured Equipment Loan due 2001-2015 165.0
Obligations under capital leases due 2001-2014 253.0
2,278.0 CP Ships
Obligations under capital leases due 2001-2008 48.0 CP Hotels & Resorts
Banks loans 114.3 Fording Coal
Banks loans 0.0 Canadian Pacific Limited
10.5% Debentures due 2001 250.0
5.85%-6.90% medium term notes due 2005-2009 700.0
11.6% Guaranteed Debentures due 2026 3.1
Commercial paper 897.8
Bank loans 119.5
Other 1,215.6
2,123.7
Total CPL Debt $ 5,626.3 Source: Case writers
For exclusive use Xavier Labour Relations Institute (XLRI), 2015
This document is authorized for use only in Business Analysis and Valuation, Term - VIII, BME - 2013-16 by A. Kanagaraj, Xavier Labour Relations Institute (XLRI) from May 2015 to November 2015.
VeryPDF Software Demo Version (http://www.verypdf.com)
VeryPDF Software Demo Version (http://www.verypdf.com)
VeryPDF.com Inc. (http://www.verypdf.com)
Demo Version
This is the demo version of VeryPDF Software, please purchase the full version of VeryPDF Software from http://www.verypdf.com/ site to remove this watermark.

Page 14 9B14N017
EXHIBIT 9: KEY FINANCIAL RATIOS BY CREDIT RATING CATEGORY
US Industrial Long-term Debt, medians based on 1998-2000
AAA AA A BBB BB B CCC
EBIT Interest Coverage 21.4 10.1 6.1 3.7 2.1 0.8 0.1
EBITDA Interest Coverage 26.5 12.9 9.1 5.8 3.4 1.8 1.3
CFO/Total Debt (%) 128.8 55.4 43.2 30.8 18.8 7.8 1.6
EBIT/Sales (%) 27.0 22.1 18.6 15.4 15.9 11.9 11.9
Long-term Debt/Capital (%) 13.3 28.2 33.9 42.5 57.2 69.7 68.8
Source: Standard & Poor’s
For exclusive use Xavier Labour Relations Institute (XLRI), 2015
This document is authorized for use only in Business Analysis and Valuation, Term - VIII, BME - 2013-16 by A. Kanagaraj, Xavier Labour Relations Institute (XLRI) from May 2015 to November 2015.
VeryPDF Software Demo Version (http://www.verypdf.com)
VeryPDF Software Demo Version (http://www.verypdf.com)
VeryPDF.com Inc. (http://www.verypdf.com)
Demo Version
This is the demo version of VeryPDF Software, please purchase the full version of VeryPDF Software from http://www.verypdf.com/ site to remove this watermark.