Very low interest rates: What should pension schemes do? · The Correlation between US Equity and...
21
Very low interest rates: What should pension schemes do? Additional information: For Professional Investors only. Not Suitable for Retail Clients April 2012 Representing Schroders: Andrew Connell – Head of Liability Driven Investment Development Email: [email protected] Mark Humphreys – Head of UK Strategic Solutions Email: [email protected]
Transcript of Very low interest rates: What should pension schemes do? · The Correlation between US Equity and...

Very low interest rates:
What should pension schemes do?
Additional information: For Professional Investors only. Not Suitable for Retail Clients
April 2012
Representing Schroders:
Andrew Connell – Head of Liability Driven Investment Development
Email: [email protected]
Mark Humphreys – Head of UK Strategic Solutions
Email: [email protected]
Agenda
1
Equities and bonds; expected inflation and bond yields
Practical activities in current environment
– Triggers
– Yield pick up on gilts
– Inflation only hedging
– Swaptions

Equity and bond returns
2
Negative equity/bond risk
premia over last 10 years
What are prospects for relative
returns in the future?
-10%
-5%
0%
5%
10%
15%
20%
UK Equity Returns in Excess of Gilts (%pa)
Source: Schroders, Barclays Equity Gilt Study 2011. Total returns in excess of long-dated UK gilts shown.

Equity risk premium
3
Equities risk premia looks
attractive
However, are equities cheap
or bonds expensive?
Source: Schroders,
Cyclically adjusted earnings yield – 10yr gov bond yield
Dec 1985 – Feb 2012 Current Average Discount
Price/Earnings 15.7 24.5 -36.0%
Shiller Price/Earnings 21.9 23.9 -8.2%
Dividend Yield 2.1 2.3 -9.5%
Valuation

Correlation regimes
4
Equity and bond correlations vary over
time
Generally
– High inflation → positive correlation
– Disinflation → positive correlation
– Very low inflation or deflation
→ low or negative correlation
The Correlation between US Equity and Bond Returns
Source: Deutsche Bank, Robert Shiller database, Datastream.
Inflation risk premia effect dominates discount rate

Historic real rates and inflation
5
Source: Schroders
-1.0%
0.0%
1.0%
2.0%
3.0%
4.0%
2001 2002 2003 2004 2005 2006 2007 2008 2009 2010 2011 2012
RPI Swaps - 20 year
Real Swaps - 20 year
Real rates have become
more expensive
RPI expectations have not
‘decoupled’
Faith in inflation targeting
mechanism still in place

Capturing opportunities – governance challenge
6
Source: Bloomberg, Schroders
1994 bond market sell-off – UK gilt yield rose by almost 3% in 8 months
Gilt yields spike again in 1999
4
5
6
7
8
9
10
1993 1994 1995 1996 1997 1998 1999
Yie
ld %
UK 10 Year Government Bond Yield

Triggers to capture a range of scenarios
7
LDI Tranche 1
Cash
LDI Initial
Liabilities
Liability hedging
Asset exposure
Liabilities
Portfolio Structure
Gilts Equities
Gilts
Trigger levels LDI coverage of index linked cashflows
(If average real yield is…)
Funding level* <0.4% >0.6% >0.8% >1.0%
<90% 20% 20% 67% 85%
>90% 20% 67% 85% 85%
LDI Tranche 2
Liability risk coverage is extended as
funding level improves and / or market
rates become more attractive
Source: Schroders, for illustration purposes only.

Practical activities in current environment

Low Interest Rate Environment What Pension Schemes can do
9
Source: Schroders, Bloomberg. For illustration only. As at 31 March 2012.
2.50%
3.00%
3.50%
4.00%
4.50%
5.00%
5.50%
Ma
r 0
7
Sep
07
Ma
r 0
8
Sep
08
Ma
r 0
9
Sep
09
Ma
r 1
0
Sep
10
Ma
r 1
1
Sep
11
20 year inflation swap 20y zero coupon interest rate swap
From an historic perspective inflation is at an attractive level while interest rates are expensive
Look for yield pick up on Gilts
Hedge Inflation only
Swaptions – an alternative to triggers

Yield Pick Up - Synthetic Gilts
10

Expect yield pickup of 40bps or more
Historical comparison of 6m LIBOR and repo rate
Unlocking a Higher Gilt Yield Exploiting the relationship between 6m Libor and repo rate
11
-
50
100
150
200
250
300
0.0%
1.0%
2.0%
3.0%
4.0%
5.0%
6.0%
7.0%
8.0%
Difference in bps (RHS) 6m Repo 6m Libor
Source: Schroders, Bloomberg. For illustration only. From 31 January 2002 to 31 January 2012.
Funding leg for a swap - 6 month LIBOR
Synthetic Gilts - driven by the repo rate
Correlation between rates, approx. 98%
Repo rate is generally lower than LIBOR
Prior to the credit crunch
– difference between repo and Libor rates
was low and stable
Since the credit crunch
– difference has expanded and
relationship is more volatile

Retain exposure to gilt and capture return benefit
Replicate Physical Gilt Returns Structure of solution
12
Source: Schroders, Bloomberg. For illustration only. *Current average funding difference between synthetic gilt and cash using 6 month
LIBOR as proxy. Subject to market conditions. Please see important information in Risk Modelling Disclaimer.
Sell physical gilts
Replace existing exposure with equivalent gilts
Invest capital released into a cash fund
LDI funds and cash holdings
Synthetic gilt exposure
Physical Gilt holdings
Gilt
Before: Physical Gilt holdings
After: Synthetic Gilt Funds plus Cash
Gilt return
Cash Synthetic
Gilt Cash return
Ca
sh
– 0
.4%
*
Gilt
retu
rn
Gilt + 0.4%
Physical gilt exposure
Can be delivered in a pooled or segregated form

Inflation only hedging
13
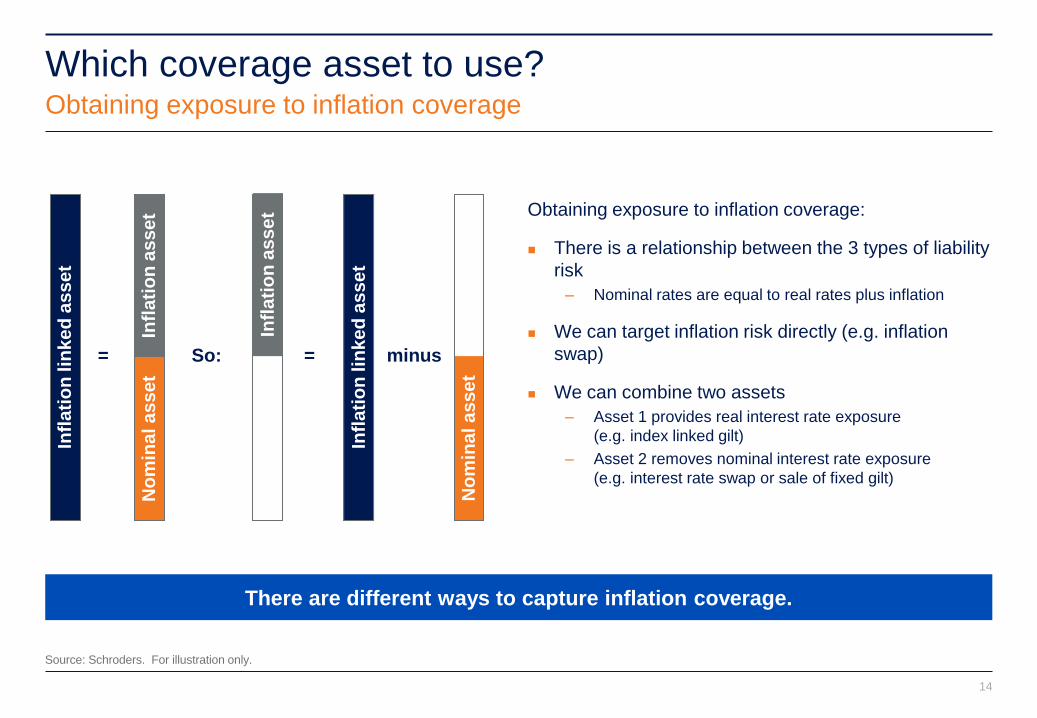
There are different ways to capture inflation coverage.
Which coverage asset to use? Obtaining exposure to inflation coverage
14
Source: Schroders. For illustration only.
Obtaining exposure to inflation coverage:
There is a relationship between the 3 types of liability
risk
– Nominal rates are equal to real rates plus inflation
We can target inflation risk directly (e.g. inflation
swap)
We can combine two assets
– Asset 1 provides real interest rate exposure
(e.g. index linked gilt)
– Asset 2 removes nominal interest rate exposure
(e.g. interest rate swap or sale of fixed gilt)
No
min
al a
ss
et
Infl
ati
on
lin
ke
d a
ss
et
=
Infl
ati
on
as
se
t
So:
No
min
al a
ss
et
Infl
ati
on
lin
ke
d a
ss
et
= minus
Infl
ati
on
as
se
t

0
20
40
60
80
100
120
140
160
180
200
2.0%
2.5%
3.0%
3.5%
4.0%
Jun-09 Dec-09 Jun-10 Dec-10 Jun-11 Dec-11
Difference (Right Hand Scale) Inflation Swap Index linked gilt less interest rate swap
Which coverage asset to use? Identifying the best value coverage asset through intelligent implementation
15
Source: Schroders, Bloomberg. For illustration only. As at 30 March 2012.
Obtaining coverage through a combination of index linked gilts and interest rate swaps offers clients
the opportunity to hedge at more attractive levels than inflation swaps
Absolute levels of inflation remain lower than 3 year average and are therefore attractive on an
historic basis
bps

Swaptions
16

Swaptions can be used as a potentially more efficient LDI implementation strategy than
triggers
Using Swaptions in a Low Rate Environment
A swaption is an option granting its owner the right but not the obligation to enter into an
underlying swap.
Swaptions can lock in to the desired trigger level yield in nominal or real yields
Swaptions offer an uplift through the premium received ie scheme is selling an option
Depending upon the outcome the swaption:
– Is executed into the target yield at which the scheme is happy to extend LDI coverage, or
– Offers further opportunity to capture another premium if not exercised
Issue to consider
– Swaption has a specified maturity
– Yields rise and hit target but then retreat below target on expiry
– Can be closed out prior to expiry locking in target yield and part of premium
Premium can be used to buy protection on rates falling over the same period
17

Summary
18
Ex ante ERP attractive – but environment highly uncertain
Beware regime shifts in inflation and equity/bond correlations
Real and nominal yields low
There are practical things to be doing
– Triggers
– Yield pick up on gilts
– Inflation only hedges
– Swaptions

Important information
Past performance is not a guide to future performance. You should remember that the value of investments can go down as well as up
and is not guaranteed. Exchange rate changes may cause the value of overseas investments to rise or fall. Potential investors should
be aware that investment in global equity markets involves a degree of risk and should be regarded as a long term investment. The
data shown in this presentation represents past performance achieved for the global equity composite. There is no guarantee that this
performance will be repeated.
This document does not constitute an offer to anyone, or a solicitation by anyone, to subscribe for shares of Schroder
International Selection Fund (the “Company”). Nothing in this document should be construed as advice and is therefore not
a recommendation to buy or sell shares. Subscriptions for shares of the Company can only be made on the basis of its
latest prospectus together with the latest audited annual report (and subsequent un-audited semi-annual report, if
published), copies of which can be obtained, free of charge, from Schroder Investment Management (Luxembourg) S.A. The
Company is not managed in order to qualify for UK distributor status. It may not meet the requirements of investors subject
to UK taxation. An investment in the Company entails risks, which are fully described in the prospectus.
For the purposes of the Data Protection Act 1998, the data controller in respect of any personal data you supply is Schroder
Investment Management Ltd. Personal information you supply may be processed for the purposes of investment
administration by the Schroder Group which may include the transfer of data outside the European Economic Area.
Schroder Investment Management Ltd may also use such information for marketing activities unless you notify it otherwise
in writing.
Schroder Investment Management Limited
31 Gresham Street, London EC2V 7QA
Telephone: 020 7658 6000 Fax: 020 7658 6965
Registration No 1893220 England
For your security, communications may be taped or monitored. Issued in January 2012.
Authorised and regulated by the Financial Services Authority
19

Important information
20
Derivatives – Investment
The strategy can use derivatives for investment purposes and may leverage the portfolio. These instruments can be more volatile than
investment in equities or bonds. The use of leverage can increase gains as well as losses and expose the strategy to increased risk.
The use of derivatives and leverage involves a higher degree of risk and may lead to a higher volatility in the unit prices of the funds.
Liability Driven Investment
Entering into derivative contracts introduces counterparty risk, the potential to incur a loss if the counterparty is unable to honour its
obligations. This means clients are exposed to potential losses if a counterparty were to default on its obligation. We mitigate much of
this risk by receiving collateral with a value at least equal to the exposure to each counterparty. Subject to minimum transaction limits,
the level of collateral will be updated on each business day. However, in the event of a default, there would be a cost involved in
liquidating and reinvesting.
Liability hedging strategies may also be subject to basis risk between the valuation methodology applied to a pension scheme’s
liabilities and that applied to the underlying contracts.
Derivative contracts may involve a commitment to meet LIBOR-based payments on the underlying strategies. There is a risk that the
assets of a pension scheme fail to deliver the returns needed to meet these payments which would result in a deterioration in the
scheme’s funding level.
Whilst hedging strategies are constructed to reflect the expected behaviour of pension fund liabilities, note that pension fund liabilities
can only be estimated and as such there may be a divergence between the performance of the hedge and an individual scheme’s
actual liabilities.
Third Party Data Warning
Third party data are owned by the applicable third party identified above and is provided for your internal use only. Such data may not
be reproduced or re-disseminated and may not be used to create any financial instruments or products or any indices. Such data are
provided without any warranties of any kind. Neither the third party data owner nor any other party involved in the publication of this
document can be held liable for any error. The terms of the third party’s specific disclaimers are set forth in the Important Information
section on our website www.schroders.co.uk.
Issued April 2012 by Schroder Investment Management Limited, 31 Gresham Street, London EC2V 7QA