Very long intergenic non-coding (vlinc) RNAs ... - BMC Biology
24
RESEARCH ARTICLE Open Access Very long intergenic non-coding (vlinc) RNAs directly regulate multiple genes in cis and trans Huifen Cao 1† , Dongyang Xu 1† , Ye Cai 1† , Xueer Han 1† , Lu Tang 1 , Fan Gao 1 , Yao Qi 1 , DingDing Cai 1 , Huifang Wang 1 , Maxim Ri 2 , Denis Antonets 2,3 , Yuri Vyatkin 2 , Yue Chen 1 , Xiang You 4 , Fang Wang 1 , Estelle Nicolas 5 and Philipp Kapranov 1* Abstract Background: The majority of the human genome is transcribed in the form of long non-coding (lnc) RNAs. While these transcripts have attracted considerable interest, their molecular mechanisms of function and biological significance remain controversial. One of the main reasons behind this lies in the significant challenges posed by lncRNAs requiring the development of novel methods and concepts to unravel their functionality. Existing methods often lack cross-validation and independent confirmation by different methodologies and therefore leave significant ambiguity as to the authenticity of the outcomes. Nonetheless, despite all the caveats, it appears that lncRNAs may function, at least in part, by regulating other genes via chromatin interactions. Therefore, the function of a lncRNA could be inferred from the function of genes it regulates. In this work, we present a genome-wide functional annotation strategy for lncRNAs based on identification of their regulatory networks via the integration of three distinct types of approaches: co-expression analysis, mapping of lncRNA-chromatin interactions, and assaying molecular effects of lncRNA knockdowns obtained using an inducible and highly specific CRISPR/Cas13 system. Results: We applied the strategy to annotate 407 very long intergenic non-coding (vlinc) RNAs belonging to a novel widespread subclass of lncRNAs. We show that vlincRNAs indeed appear to regulate multiple genes encoding proteins predominantly involved in RNA- and development-related functions, cell cycle, and cellular adhesion via a mechanism involving proximity between vlincRNAs and their targets in the nucleus. A typical vlincRNAs can be both a positive and negative regulator and regulate multiple genes both in trans and cis. Finally, we show vlincRNAs and their regulatory networks potentially represent novel components of DNA damage response and are functionally important for the ability of cancer cells to survive genotoxic stress. (Continued on next page) © The Author(s). 2021 Open Access This article is licensed under a Creative Commons Attribution 4.0 International License, which permits use, sharing, adaptation, distribution and reproduction in any medium or format, as long as you give appropriate credit to the original author(s) and the source, provide a link to the Creative Commons licence, and indicate if changes were made. The images or other third party material in this article are included in the article's Creative Commons licence, unless indicated otherwise in a credit line to the material. If material is not included in the article's Creative Commons licence and your intended use is not permitted by statutory regulation or exceeds the permitted use, you will need to obtain permission directly from the copyright holder. To view a copy of this licence, visit http://creativecommons.org/licenses/by/4.0/. The Creative Commons Public Domain Dedication waiver (http://creativecommons.org/publicdomain/zero/1.0/) applies to the data made available in this article, unless otherwise stated in a credit line to the data. * Correspondence: [email protected] † Huifen Cao, Dongyang Xu, Ye Cai and Xueer Han contributed equally to this work. 1 Institute of Genomics, School of Medicine, Huaqiao University, 668 Jimei Road, Xiamen 361021, China Full list of author information is available at the end of the article Cao et al. BMC Biology (2021) 19:108 https://doi.org/10.1186/s12915-021-01044-x
Transcript of Very long intergenic non-coding (vlinc) RNAs ... - BMC Biology
RESEARCH ARTICLE Open Access
Very long intergenic non-coding (vlinc)RNAs directly regulate multiple genes in cisand transHuifen Cao1†, Dongyang Xu1†, Ye Cai1†, Xueer Han1†, Lu Tang1, Fan Gao1, Yao Qi1, DingDing Cai1, Huifang Wang1,Maxim Ri2, Denis Antonets2,3, Yuri Vyatkin2, Yue Chen1, Xiang You4, Fang Wang1, Estelle Nicolas5 andPhilipp Kapranov1*
Abstract
Background: The majority of the human genome is transcribed in the form of long non-coding (lnc) RNAs. Whilethese transcripts have attracted considerable interest, their molecular mechanisms of function and biologicalsignificance remain controversial. One of the main reasons behind this lies in the significant challenges posed bylncRNAs requiring the development of novel methods and concepts to unravel their functionality. Existing methodsoften lack cross-validation and independent confirmation by different methodologies and therefore leave significantambiguity as to the authenticity of the outcomes. Nonetheless, despite all the caveats, it appears that lncRNAsmay function, at least in part, by regulating other genes via chromatin interactions. Therefore, the function of alncRNA could be inferred from the function of genes it regulates. In this work, we present a genome-widefunctional annotation strategy for lncRNAs based on identification of their regulatory networks via the integrationof three distinct types of approaches: co-expression analysis, mapping of lncRNA-chromatin interactions, andassaying molecular effects of lncRNA knockdowns obtained using an inducible and highly specific CRISPR/Cas13system.
Results: We applied the strategy to annotate 407 very long intergenic non-coding (vlinc) RNAs belonging to anovel widespread subclass of lncRNAs. We show that vlincRNAs indeed appear to regulate multiple genes encodingproteins predominantly involved in RNA- and development-related functions, cell cycle, and cellular adhesion via amechanism involving proximity between vlincRNAs and their targets in the nucleus. A typical vlincRNAs can beboth a positive and negative regulator and regulate multiple genes both in trans and cis. Finally, we showvlincRNAs and their regulatory networks potentially represent novel components of DNA damage response and arefunctionally important for the ability of cancer cells to survive genotoxic stress.
(Continued on next page)
© The Author(s). 2021 Open Access This article is licensed under a Creative Commons Attribution 4.0 International License,which permits use, sharing, adaptation, distribution and reproduction in any medium or format, as long as you giveappropriate credit to the original author(s) and the source, provide a link to the Creative Commons licence, and indicate ifchanges were made. The images or other third party material in this article are included in the article's Creative Commonslicence, unless indicated otherwise in a credit line to the material. If material is not included in the article's Creative Commonslicence and your intended use is not permitted by statutory regulation or exceeds the permitted use, you will need to obtainpermission directly from the copyright holder. To view a copy of this licence, visit http://creativecommons.org/licenses/by/4.0/.The Creative Commons Public Domain Dedication waiver (http://creativecommons.org/publicdomain/zero/1.0/) applies to thedata made available in this article, unless otherwise stated in a credit line to the data.
* Correspondence: [email protected]†Huifen Cao, Dongyang Xu, Ye Cai and Xueer Han contributed equally to thiswork.1Institute of Genomics, School of Medicine, Huaqiao University, 668 JimeiRoad, Xiamen 361021, ChinaFull list of author information is available at the end of the article
Cao et al. BMC Biology (2021) 19:108 https://doi.org/10.1186/s12915-021-01044-x

(Continued from previous page)
Conclusions: This study provides strong evidence for the regulatory role of the vlincRNA class of lncRNAs and apotentially important role played by these transcripts in the hidden layer of RNA-based regulation in complexbiological systems.
Keywords: lncRNA, vlincRNA, Regulatory networks, RNA-chromatin interactions, Single-molecule sequencing, CRISPR/Cas13, RNA processing, Development, Cell cycle, Anti-cancer drugs
BackgroundThe lncRNAs embody a fascinating group of transcripts.Collectively, they represent the vast majority of the tran-scriptional output of the human genome in terms of thesequence complexity [1–3]. These transcripts have beenimplicated in virtually all major biological processes, in-cluding normal development and disease [4–9], and arehypothesized to represent a hidden layer of regulation incomplex biological organisms [10, 11]. Still, relevance ofthis class of transcripts for most part remains controver-sial [12], with one of the main reasons behind it beinglack of understanding of molecular mechanisms of func-tion of these RNA species [13]. The progress of elucidat-ing the functions and mechanisms of lncRNAs has beenhampered by the challenges caused by the vastness ofthe genome covered by lncRNAs and unique features ofthese transcripts [13]. For example, in terms of relativemass, lncRNAs are enriched in the polyA− RNA tran-scriptome and depleted in the fraction of the processedpolyadenylated transcripts while the situation is oppositefor protein-coding mRNAs [2]. In fact, these differenceshave led to a suggestion that lncRNAs do not possesssequence-specific functions, but might rather functionvia the process of transcription itself [14]. While novelapproaches and strategies have been developed to ad-dress these challenges [15], they often lack cross-validation by independent methods and thus leave openthe question about the amount of error and noise in theresulting lncRNA annotations [13].Still, overall, the existing body of evidence for lncRNAs
whose function has significant level of support points tothe regulatory function of lncRNA, such as targetingcomponents of chromatin modulation machinery to spe-cific parts of the genome [4, 5]. Thus, identification ofregulatory targets of lncRNAs likely holds the key to un-derstanding their mechanisms of action. One popularapproach to uncover regulatory networks of lncRNAs isbased on co-expression strategy that assumes transcriptswith similar expression patterns to also have functionalrelationships [16]. This concept has been widely appliedto annotate functions of lncRNAs genome-wide in mul-tiple systems [15]. However, the expression correlationin itself does not imply direct interactions and most ofsuch networks have not been independently validated.Furthermore, the co-expression analysis has been
performed in multiple biological systems using differentgene expression analysis platforms, analytical methods,and sample types [13]. Therefore, the fraction of truesignal in such studies is very hard to estimate withoutthe validation and, in general, the guidelines for properco-expression analysis do not exist yet to ourknowledge.These issues make it hard to ascertain the fraction of
the true interacting partners in published co-expressionnetworks, thus limiting their utility. On the other hand,more direct approaches, based either on (1) the affinityisolation and subsequent molecular analysis of com-plexes containing a lncRNA of interest or (2) on the ana-lysis of RNA populations after knockdown or knockoutof a specific lncRNA, potentially allow for more straight-forward identification of its targets. However, to ourknowledge, most of the networks identified in such ex-periments have not been independently validated either,thus leaving the questions of the technical noise levels inthese networks as well as their biological significanceopen as well [13]. Furthermore, reverse genetics studiesof lncRNAs have been hampered by a number of tech-nical and interpretational issues associated with theexisting techniques leading to significant ambiguity overthe outcomes of these studies [12]. Thus, the lack ofoverall validation significantly limits the credibility ofmost lncRNA networks identified so far.In this regard, it is important to note that the recent
work by the FANTOM6 consortium has found correl-ation between the lncRNA networks and biological ef-fects identified by targeting specific lncRNAs usingantisense oligonucleotide (ASO) technology [17]. More-over, the authors have found significant overlap amongthe networks found in different ASOs targeting the sametarget transcript supporting the validity of these findings[17]. However, the validation rate of these networksusing a different technology (RNAi) was relatively low[17], possibly due to the different targeting modalities ofASOs and RNAi, thus leaving the question of cross-validation of the networks using a different technologyopen.VlincRNAs belong to a recently identified subclass of
lncRNAs. They are apparently un-spliced and polyA−nuclear lncRNAs over 50 kb and are quite common, withover 2000 vlincRNAs identified in the humans,
Cao et al. BMC Biology (2021) 19:108 Page 2 of 24
transcribed from at least 10% of the human genome se-quence [2, 18]. Since their recent discovery, vlincRNAshave been implicated in modulation of chromatin statein senescent cells [19] and control of replication timingof human chromosomes [20]. These transcripts providean intriguing link between pluripotency and cancer [18].Furthermore, vlincRNAs have been suggested to play arole in etiology or progression of acute lymphoblasticleukemia [21]. Recently, vlincRNAs were implicated incellular response to anti-cancer drugs using CRISPR/Cas13 system [22]. However, the regulatory networks ofmost vlincRNAs remain unknown.The goal of this work is to identify lncRNA regulatory
networks cross-validated by unrelated empirical ap-proaches. We identify vlincRNA regulatory networksusing a co-expression approach that theoretically should
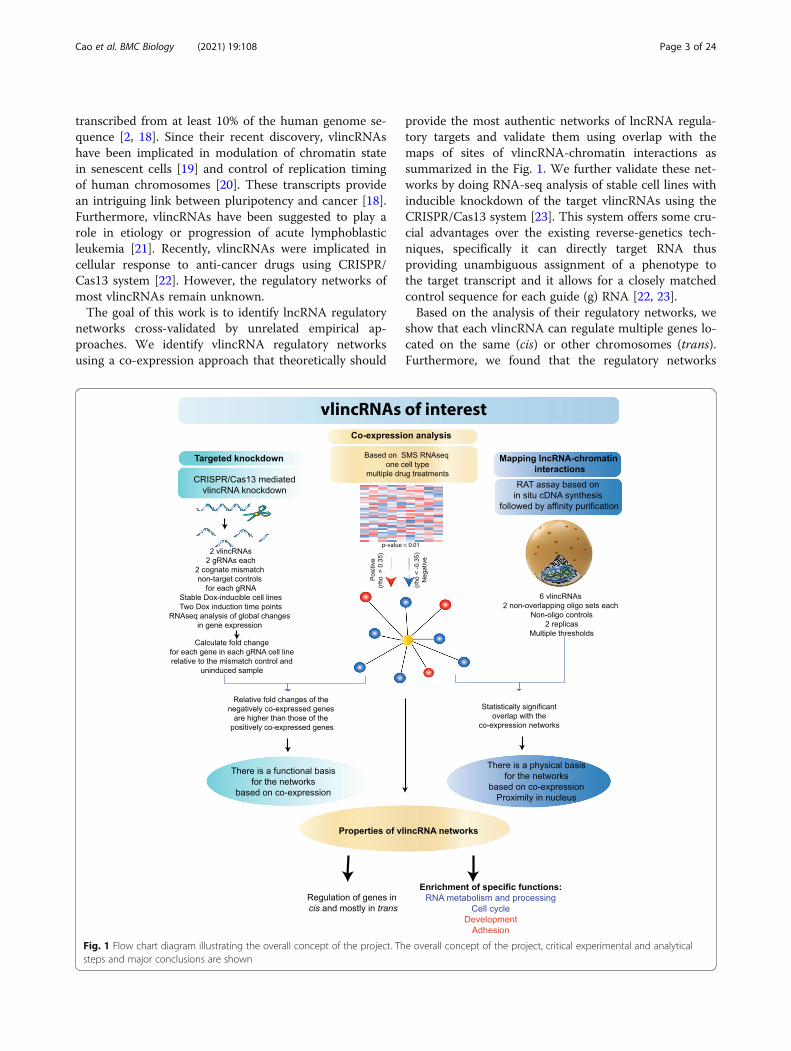
provide the most authentic networks of lncRNA regula-tory targets and validate them using overlap with themaps of sites of vlincRNA-chromatin interactions assummarized in the Fig. 1. We further validate these net-works by doing RNA-seq analysis of stable cell lines withinducible knockdown of the target vlincRNAs using theCRISPR/Cas13 system [23]. This system offers some cru-cial advantages over the existing reverse-genetics tech-niques, specifically it can directly target RNA thusproviding unambiguous assignment of a phenotype tothe target transcript and it allows for a closely matchedcontrol sequence for each guide (g) RNA [22, 23].Based on the analysis of their regulatory networks, we
show that each vlincRNA can regulate multiple genes lo-cated on the same (cis) or other chromosomes (trans).Furthermore, we found that the regulatory networks
Fig. 1 Flow chart diagram illustrating the overall concept of the project. The overall concept of the project, critical experimental and analyticalsteps and major conclusions are shown
Cao et al. BMC Biology (2021) 19:108 Page 3 of 24

were quite reproducible under different treatment condi-tions. On one hand, vlincRNAs tend to negatively regu-late multiple genes involved in RNA-related functionssuch as RNA transcription, metabolism, processing andsplicing as well as cell cycle related functions. On theother hand, these lncRNAs appear to positively regulategenes involved in development, particularly nervous sys-tem development and adhesion. Finally, we show thatexpression analysis platform is critical for authenticity ofthe regulatory networks and careful consideration has tobe given to the choice of RNA measurements and ex-perimental design for such analysis.
ResultsCo-expression strategy for lncRNA annotationWe hypothesized that a co-expression strategy based ona combination of the following features would likely gen-erate the most accurate regulatory networks of lncRNAs(Fig. 1). First, we chose a 3rd generation next generationsequencing (NGS) single-molecule sequencing (SMS)platform as a foundation for estimation of expression ofevery lncRNA and mRNA species. This sequencing plat-form has relatively simple library preparation procedurethat does not involve amplification steps [24] and thusmore likely represents true original abundancies of vari-ous RNA species, especially in the low abundance range[25, 26]. The accuracy in this range is especially relevantfor lncRNAs that tend to have low expression levels ingeneral [3, 27]. Therefore, SMS could, in theory, providea more accurate estimate of co-expression betweenlncRNAs and their potential target mRNAs. Second, weused a single cell type to generate the co-expression net-works. While many publicly available expression datasetsare available, reliance on them in the co-expression an-notation of lncRNAs suffers from a major potentialproblem: lncRNAs are often expressed in just one or fewcell types [3, 27]. Therefore, a co-expression analysisacross multiple cell types would likely include manysamples where any given lncRNA is either not expressedor expressed at noise levels and thus severely dilute thereal correlation signals. Third, we used short time framesof transcriptome perturbing treatments (see below). Weassumed that a co-expression analysis based on RNAlevels measured shortly after the system is perturbed andforced to adapt by altering levels of various transcriptswould more likely capture direct regulatory interactionsas opposed to longer time treatments that could be di-luted with indirect effects.We have previously found expression of many vlincR-
NAs in a human leukemia cell line K562 [18]. This fact,together with the availability of multiple types of genomicdata for this cell line from the ENCODE consortium [3],made K562 an attractive system for this study. The firststep in our pipeline was to generate an expression
database under multiple treatment conditions to calculatethe co-expression of every vlincRNA with all protein-coding mRNAs. We profiled transcriptomes of K562 cellline after treatments with 29 inhibitors and anti-cancerdrugs affecting diverse cellular pathways and functions(signaling pathways, cell cycle, DNA metabolism and re-pair, chromatin modifiers, etc.) (Additional file 1: Supple-mental Table S1). As mentioned above, we used relativelyshort treatments of 3 and 6 h for each drug.Total DNaseI-treated RNA from each sample was con-
verted into cDNA using the not-so-random (NSR) hex-amers devoid of sequences that bind to rRNAs [28] andanalyzed using RNA-seq performed on the SMS plat-form. To estimate the degree of perturbation of the tran-scriptome by each drug, we estimated the number ofdifferentially expressed (DE) up- or downregulated tran-scripts—both protein-coding mRNAs and vlincRNAs—defined by fold change (FC) > 1.5 in both time pointsrelative to the solvent (DMSO or water) controls forboth 12,995 annotated genes expressed in K562 and 407vlincRNAs detected previously in this cell line [18](Fig. 2a–c, Additional file 1: Supplemental Table S2).Overall, expression of 10,248 (78.9%) of the protein-coding genes changed under these conditions in at leastone drug treatment with 7229 up- and 6698 downregu-lated genes (Fig. 2a, Additional file 1: Supplemental TableS2). The corresponding numbers for the vlincRNAs were392 (96.3%) with 176 up- and 374 downregulated (Fig. 2a,Additional file 1: Supplemental Table S2). For any givendrug treatment, we detected 1,190 (9.2%) and 623 (4.8%)up- or downregulated genes and correspondingly 11(2.7%) and 79 (19.4%) vlincRNAs based on the corre-sponding median values across all treatment (Fig. 2a).Overall, vlincRNAs had a tendency to be downregulatedas compared to known genes in response to drug treat-ments, suggesting potential negative correlation betweenthese two types of transcripts (Fig. 2a, also see below).The drugs varied significantly in respect to the effect
on coding and non-coding transcriptomes (Fig. 2b, c,Additional file 1: Supplemental Table S2). Of the topthree drugs that exhibited the largest upregulating effecton vlincRNAs—mirin (inhibitor of MRE11, a componentof the MRN complex), BML-277 (CHK2 inhibitor), andYM-155 (possible DNA intercalator) (Fig. 2b, Additionalfile 1: Supplemental Table S2)—at least two are knownto inhibit DNA damage sensing or response pathways(mirin and BML-277). DNA damage-related drugs alsocaused significant changes in the protein-coding tran-scriptome (Fig. 2c, Additional file 1: Supplemental TableS2). Still, the fraction of vlincRNAs upregulated in re-sponse to mirin and BML-277 treatments was higherthan that of protein-coding mRNAs (Additional file 1:Supplemental Table S2). Furthermore, drugs that in-duced the highest fractions of expression of protein-
Cao et al. BMC Biology (2021) 19:108 Page 4 of 24

coding genes affect epigenetic functions, such chromatinmodifiers (panobinostat and EPZ-6438, inhibiting his-tone deacetylases and Ezh2 respectively) or readers ofspecific histone marks (bromodomain inhibitor I-BET151) and non-DNA damage related functions (Fig.2c, Additional file 1: Supplemental Table S2). As such, itappears that the vlincRNA subclass of lncRNAs mightbe enriched in transcripts that participate in at leastsome cellular processes related to DNA damage.To validate the reproducibility and authenticity of our
expression analysis, we performed independent treat-ment experiments with three drugs (mirin, etoposideand SN-38) and analyzed the changes in expression ofselected vlincRNAs in response to these drugs after 6 hof the treatments using real-time PCR. We selected 42differentially expressed (DE) vlincRNAs and, as ex-pected, most (36, 85.7%) DE vlincRNAs could be vali-dated (Fig. 2d, Additional file 1: Supplemental Table S3).
Furthermore, of the 6 vlincRNAs that could not be vali-dated in the real-time PCR experiments, 4 (66.7%)showed expected direction of the change albeit notreaching the FC of 1.5. As such, the DE analysis basedon the SMS RNA-seq platform appears to capture au-thentic and reproducible expression changes.We then generated a list of mRNAs co-expressed with
each vlincRNA. The co-expression was defined as Spear-man correlation of either > 0.35 or < −0.35 between avlincRNA and a protein-coding mRNA with the correl-ation significance p value < 0.01 (Fig. 1) calculated on 64samples (drug treatments and solvent-treated controlsamples). For each vlincRNA, we found between 134and 5385 (median 1615) co-expressed transcripts usingthese thresholds. Interestingly, we have observed a muchhigher number of negatively correlated mRNAs thanpositively correlated ones with the medians of 430 and1,022 for the positively and negatively co-expressed
Fig. 2 SMS-based expression and co-expression analyses for various drug treatments. a Distributions of the numbers of DE mRNAs (left) andvlincRNAs (right). The yellow inner circles represent mRNAs or vlincRNAs expressed in K562; the orange and green middle sections representrespectively up- or downregulated transcripts in at least one drug treatment; the orange and green outer sections represent respectively up- ordownregulated transcripts in all drug treatments. b, c Numbers of DE vlincRNAs (b) and mRNAs (c) for each indicated treatment. The blue andorange bars represent respectively up- and downregulated transcripts. d Fractions of DE vlincRNAs validated by qPCR in each indicatedtreatment. e Box plots representing numbers genes found in either negative and positive co-expression-based vlincRNA networks
Cao et al. BMC Biology (2021) 19:108 Page 5 of 24
transcripts respectively, and the trend towards negativecorrelation was highly significant (p value < 2.2E−16,Wilcoxon signed rank test) (Fig. 2e, Additional file 1:Supplemental Table S4). Nonetheless, similar to the re-sults reported earlier [29], genes positively correlatingwith vlincRNAs were enriched in the immediate vicinityof these transcripts. The median co-expression correla-tions between vlincRNAs and genes located within 5 kb,5–10 kb, 10–100 kb, and > 100 kb from each other were0.44, 0.37, −0.38, and −0.38 respectively.
Validation of the co-expression networks using lncRNA-chromatin interaction profilesA major potential limitation of the co-expression strat-egy is that the expression correlation (positive or nega-tive) can occur without direct physical or functionalinteractions between the correlated entities. Since anumber of functionally characterized lncRNAs appear toregulate other genes by interacting and modulating theirchromatin environment [4, 5], we assumed that the
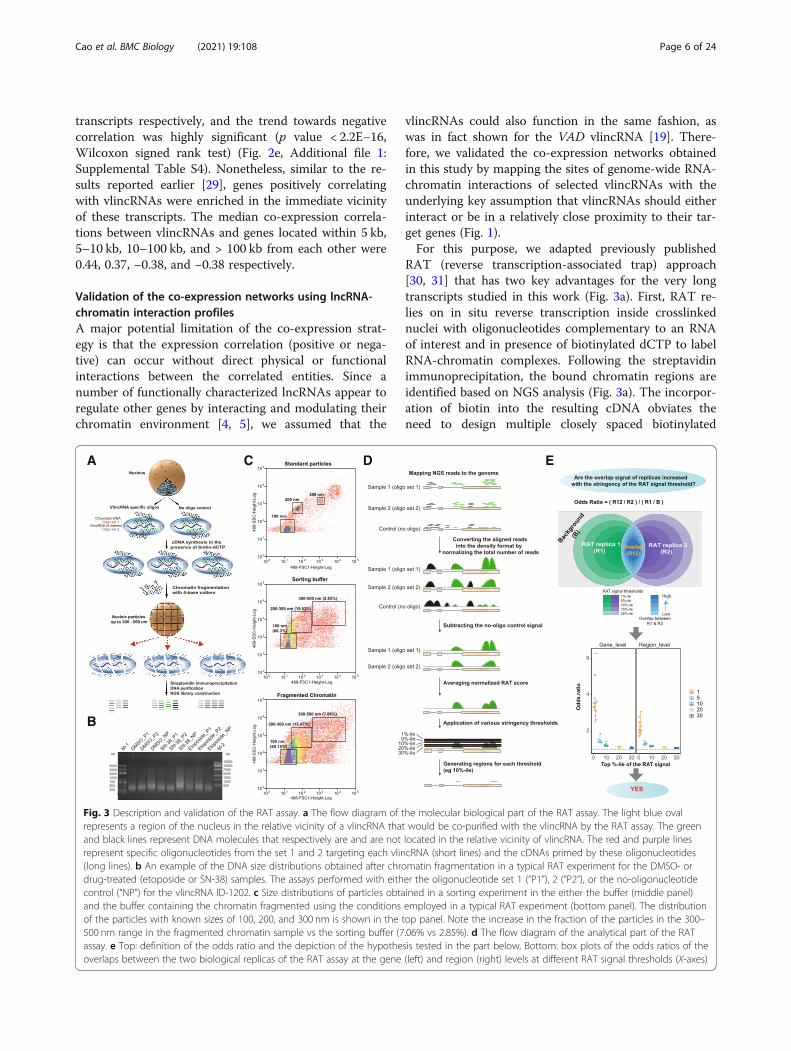
vlincRNAs could also function in the same fashion, aswas in fact shown for the VAD vlincRNA [19]. There-fore, we validated the co-expression networks obtainedin this study by mapping the sites of genome-wide RNA-chromatin interactions of selected vlincRNAs with theunderlying key assumption that vlincRNAs should eitherinteract or be in a relatively close proximity to their tar-get genes (Fig. 1).For this purpose, we adapted previously published
RAT (reverse transcription-associated trap) approach[30, 31] that has two key advantages for the very longtranscripts studied in this work (Fig. 3a). First, RAT re-lies on in situ reverse transcription inside crosslinkednuclei with oligonucleotides complementary to an RNAof interest and in presence of biotinylated dCTP to labelRNA-chromatin complexes. Following the streptavidinimmunoprecipitation, the bound chromatin regions areidentified based on NGS analysis (Fig. 3a). The incorpor-ation of biotin into the resulting cDNA obviates theneed to design multiple closely spaced biotinylated
A C D E
B
Fig. 3 Description and validation of the RAT assay. a The flow diagram of the molecular biological part of the RAT assay. The light blue ovalrepresents a region of the nucleus in the relative vicinity of a vlincRNA that would be co-purified with the vlincRNA by the RAT assay. The greenand black lines represent DNA molecules that respectively are and are not located in the relative vicinity of vlincRNA. The red and purple linesrepresent specific oligonucleotides from the set 1 and 2 targeting each vlincRNA (short lines) and the cDNAs primed by these oligonucleotides(long lines). b An example of the DNA size distributions obtained after chromatin fragmentation in a typical RAT experiment for the DMSO- ordrug-treated (etoposide or SN-38) samples. The assays performed with either the oligonucleotide set 1 (“P1”), 2 (“P2”), or the no-oligonucleotidecontrol (“NP”) for the vlincRNA ID-1202. c Size distributions of particles obtained in a sorting experiment in the either the buffer (middle panel)and the buffer containing the chromatin fragmented using the conditions employed in a typical RAT experiment (bottom panel). The distributionof the particles with known sizes of 100, 200, and 300 nm is shown in the top panel. Note the increase in the fraction of the particles in the 300–500 nm range in the fragmented chromatin sample vs the sorting buffer (7.06% vs 2.85%). d The flow diagram of the analytical part of the RATassay. e Top: definition of the odds ratio and the depiction of the hypothesis tested in the part below. Bottom: box plots of the odds ratios of theoverlaps between the two biological replicas of the RAT assay at the gene (left) and region (right) levels at different RAT signal thresholds (X-axes)
Cao et al. BMC Biology (2021) 19:108 Page 6 of 24
oligonucleotide as in other techniques (e.g., ChIRP andsimilar methods) designed to map sites of interactionsbetween a specific lncRNA and chromatin [32–34],which would be economically prohibitive for these verylong transcripts. Second, chromatin fragmentation isconducted with restriction enzymes (Fig. 3a, b) that donot fragment RNA or single-stranded DNA unlike theother approaches that use sonication [32–34] that wouldlikely break these very long transcripts.Recently, a number of methods to detect genome-wide
RNA-chromatin interactions were developed. However,one common feature of these methods (such as GRID-seq [35], MARGI [36], and Red-C [37]) was ligation ofnearby DNA and RNA molecules using bridging oligo-nucleotides. The latter were in the range of ~ 40–60bases and could thus detect molecules separated by nomore than 20 nm given length of a nucleotide being0.34 nm. However, in our RAT assays, the size of thechromatin particles after DNA fragmentation reached300 to 500 nm (Fig. 3c, Methods). Since all genomic re-gions would be expected to be located within such parti-cles should be co-precipitated with the target transcript(Fig. 3a), this would mean that RAT is not limited to im-mediate interactions, but rather can measure much moredistal proximity or colocalization between RNA andchromatin regions.Since DNA damage-inducing drugs had the highest ef-
fect on the expression of vlincRNAs, we chose 6 vlincR-NAs induced by the topoisomerase inhibitors (etoposideand/or SN-38) for the RAT analysis with an example ofone such vlincRNA shown in Additional file 2: Supple-mental Figure S1. The RAT procedure was performedon cells treated with either etoposide, SN-38 or DMSO.Overall, the RAT analysis was performed on 14vlincRNA-treatment combinations with two biologicalreplicas per combination with the goal of analyzing po-tential change in the networks in response to drug treat-ment. Each RAT assay was performed separately with 2sets of non-overlapping oligonucleotides designedagainst the same vlincRNA (Fig. 3a, Methods). Inaddition, for each treatment, the RAT procedure wasalso performed without the oligonucleotides as a specifi-city control. Downstream analysis was performed usingtwo levels of processed RAT signal: (1) average normal-ized RAT score calculated for every base pair in the hu-man genome or (2) genomic region level obtained afterapplication of thresholds of different stringency to theaverage normalized RAT score (Fig. 3d, Methods). Thethresholds were defined based on the top 1 (most strict),5, 10, 20, or 30 (least strict) percentile (%-ile) of theaverage normalized RAT score for each sample (Fig. 3d,Methods). Genes containing the RAT regions in theirboundaries were considered co-localized with the corre-sponding vlincRNA.
As the first step in evaluation of the performance ofthe RAT approach, we estimated the overlap betweenRAT regions obtained from the biological replicas at ei-ther region or gene levels. In the former, exact genomiccoordinates of the interacting regions had to be presentin both replicas while in the latter genes had to containinteracting regions anywhere within their boundaries inboth replicas but the coordinates of the interacting re-gions could be different. Overall, we found statisticallysignificant overlap of the RAT signal between the rep-licas for every vlincRNA-treatment combination at bothlevels (Fig. 3e, Additional file 1: Supplemental Table S5).Furthermore, the overlaps of the RAT signal betweenthe two replicas were statistically significant at multiplethresholds; however, as would be expected, the strengthsof the overlaps, as measured by the odds ratios (definedin Fig. 3e) increased with the stringency of the RAT sig-nal threshold (Fig. 3e, Additional file 1: SupplementalTable S5, Methods). In general, the odds ratios of thegene-level overlaps between the two replicas wereconsistently higher (Additional file 1: SupplementalTable S5). Therefore, unless specifically indicated, allanalyses below were performed on genes containing thevlincRNA-chromatin interacting regions anywherewithin their boundaries in both replicas (Methods).To evaluate the relationship between co-expression
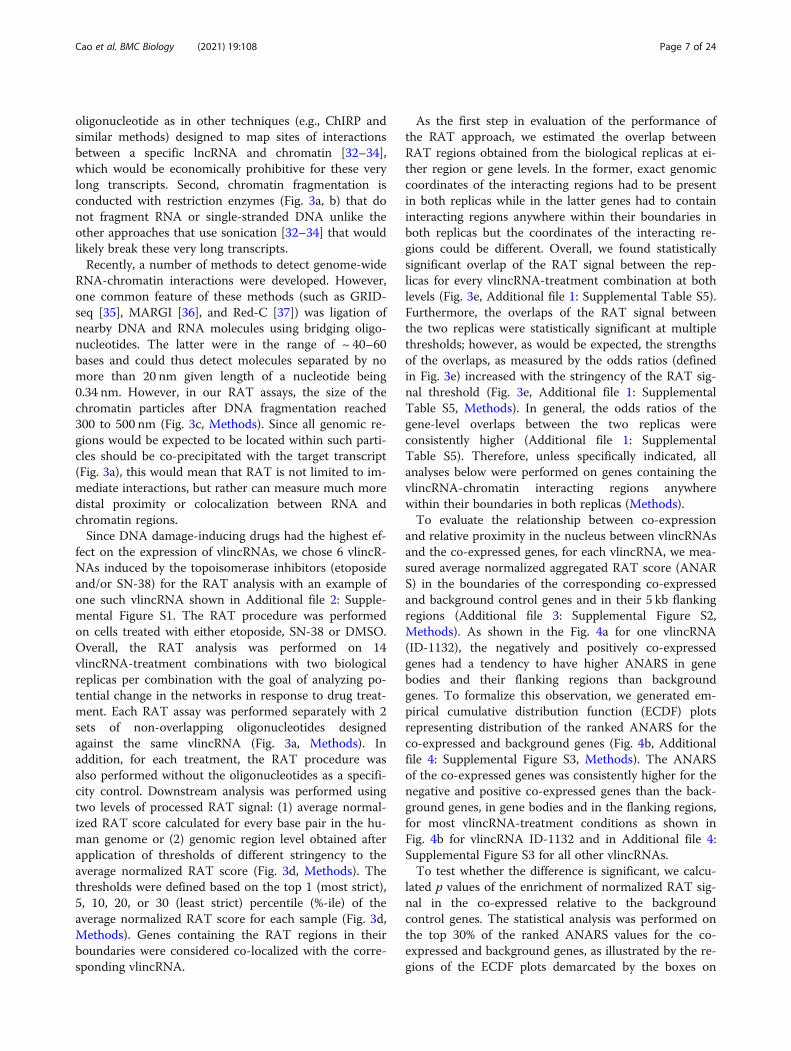
and relative proximity in the nucleus between vlincRNAsand the co-expressed genes, for each vlincRNA, we mea-sured average normalized aggregated RAT score (ANARS) in the boundaries of the corresponding co-expressedand background control genes and in their 5 kb flankingregions (Additional file 3: Supplemental Figure S2,Methods). As shown in the Fig. 4a for one vlincRNA(ID-1132), the negatively and positively co-expressedgenes had a tendency to have higher ANARS in genebodies and their flanking regions than backgroundgenes. To formalize this observation, we generated em-pirical cumulative distribution function (ECDF) plotsrepresenting distribution of the ranked ANARS for theco-expressed and background genes (Fig. 4b, Additionalfile 4: Supplemental Figure S3, Methods). The ANARSof the co-expressed genes was consistently higher for thenegative and positive co-expressed genes than the back-ground genes, in gene bodies and in the flanking regions,for most vlincRNA-treatment conditions as shown inFig. 4b for vlincRNA ID-1132 and in Additional file 4:Supplemental Figure S3 for all other vlincRNAs.To test whether the difference is significant, we calcu-
lated p values of the enrichment of normalized RAT sig-nal in the co-expressed relative to the backgroundcontrol genes. The statistical analysis was performed onthe top 30% of the ranked ANARS values for the co-expressed and background genes, as illustrated by the re-gions of the ECDF plots demarcated by the boxes on
Cao et al. BMC Biology (2021) 19:108 Page 7 of 24
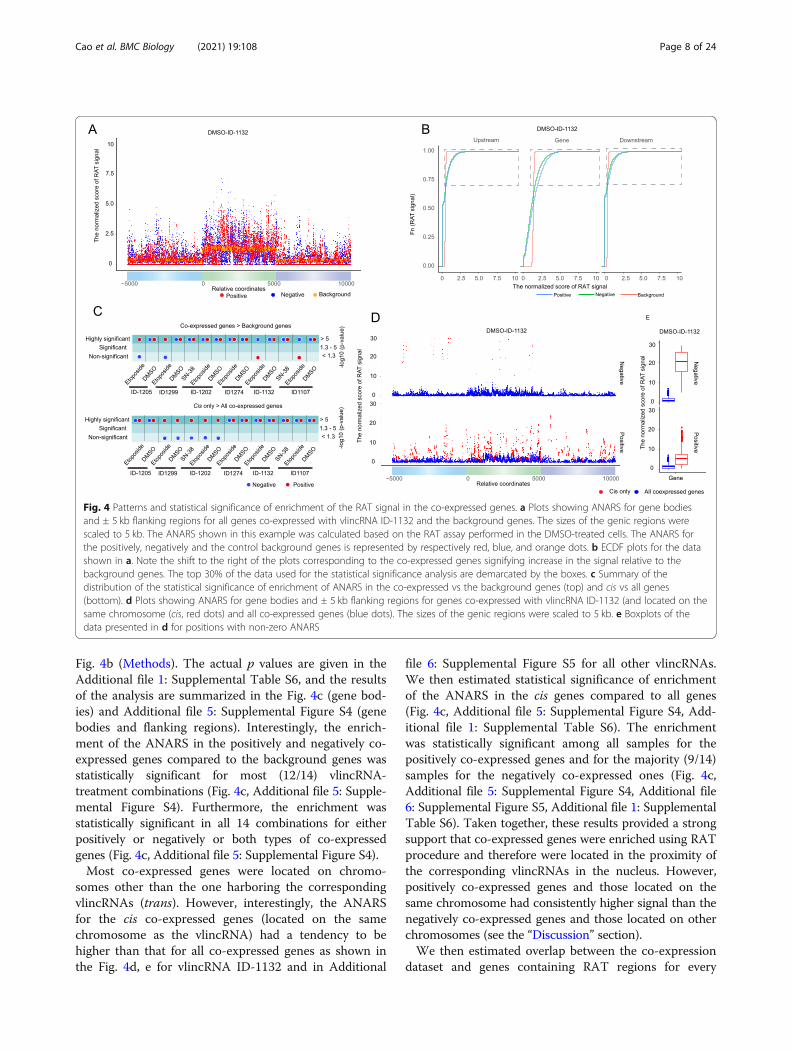
Fig. 4b (Methods). The actual p values are given in theAdditional file 1: Supplemental Table S6, and the resultsof the analysis are summarized in the Fig. 4c (gene bod-ies) and Additional file 5: Supplemental Figure S4 (genebodies and flanking regions). Interestingly, the enrich-ment of the ANARS in the positively and negatively co-expressed genes compared to the background genes wasstatistically significant for most (12/14) vlincRNA-treatment combinations (Fig. 4c, Additional file 5: Supple-mental Figure S4). Furthermore, the enrichment wasstatistically significant in all 14 combinations for eitherpositively or negatively or both types of co-expressedgenes (Fig. 4c, Additional file 5: Supplemental Figure S4).Most co-expressed genes were located on chromo-
somes other than the one harboring the correspondingvlincRNAs (trans). However, interestingly, the ANARSfor the cis co-expressed genes (located on the samechromosome as the vlincRNA) had a tendency to behigher than that for all co-expressed genes as shown inthe Fig. 4d, e for vlincRNA ID-1132 and in Additional
file 6: Supplemental Figure S5 for all other vlincRNAs.We then estimated statistical significance of enrichmentof the ANARS in the cis genes compared to all genes(Fig. 4c, Additional file 5: Supplemental Figure S4, Add-itional file 1: Supplemental Table S6). The enrichmentwas statistically significant among all samples for thepositively co-expressed genes and for the majority (9/14)samples for the negatively co-expressed ones (Fig. 4c,Additional file 5: Supplemental Figure S4, Additional file6: Supplemental Figure S5, Additional file 1: SupplementalTable S6). Taken together, these results provided a strongsupport that co-expressed genes were enriched using RATprocedure and therefore were located in the proximity ofthe corresponding vlincRNAs in the nucleus. However,positively co-expressed genes and those located on thesame chromosome had consistently higher signal than thenegatively co-expressed genes and those located on otherchromosomes (see the “Discussion” section).We then estimated overlap between the co-expression
dataset and genes containing RAT regions for every
Fig. 4 Patterns and statistical significance of enrichment of the RAT signal in the co-expressed genes. a Plots showing ANARS for gene bodiesand ± 5 kb flanking regions for all genes co-expressed with vlincRNA ID-1132 and the background genes. The sizes of the genic regions werescaled to 5 kb. The ANARS shown in this example was calculated based on the RAT assay performed in the DMSO-treated cells. The ANARS forthe positively, negatively and the control background genes is represented by respectively red, blue, and orange dots. b ECDF plots for the datashown in a. Note the shift to the right of the plots corresponding to the co-expressed genes signifying increase in the signal relative to thebackground genes. The top 30% of the data used for the statistical significance analysis are demarcated by the boxes. c Summary of thedistribution of the statistical significance of enrichment of ANARS in the co-expressed vs the background genes (top) and cis vs all genes(bottom). d Plots showing ANARS for gene bodies and ± 5 kb flanking regions for genes co-expressed with vlincRNA ID-1132 (and located on thesame chromosome (cis, red dots) and all co-expressed genes (blue dots). The sizes of the genic regions were scaled to 5 kb. e Boxplots of thedata presented in d for positions with non-zero ANARS
Cao et al. BMC Biology (2021) 19:108 Page 8 of 24
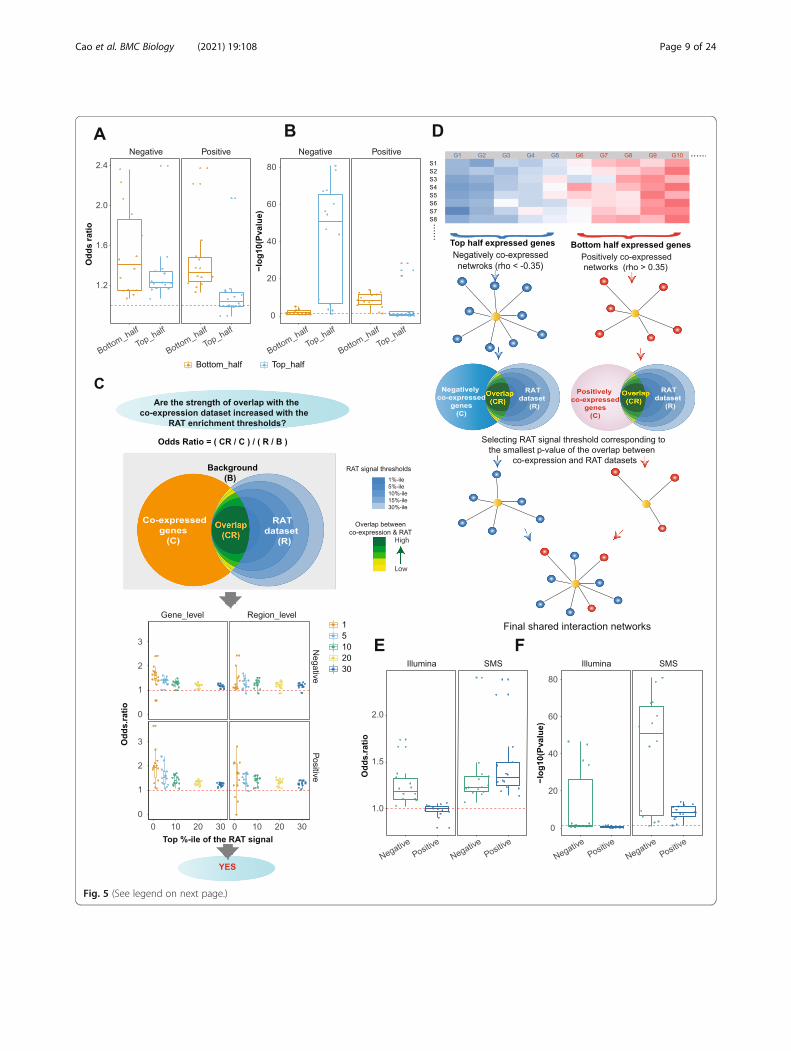
Fig. 5 (See legend on next page.)
Cao et al. BMC Biology (2021) 19:108 Page 9 of 24
vlincRNA and made the following two observations.First, the significance of the overlap depended on ex-pression levels. Specifically, the low abundant genes hada much higher probability of having significant overlapbetween positively co-expressed genes and the genesshowing evidence of co-localization compared to thehighly abundant ones (Fig. 5a, b, Additional file 1: Sup-plemental Table S7). However, the trend was reversedfor the genes negatively correlating with vlincRNAs (Fig.5a, b, Additional file 1: Supplemental Table S7). We ob-served this trend for every vlincRNA and every treat-ment (Additional file 1: Supplemental Table S7).Therefore, to increase the signal to noise ratio, we firstsorted genes by maximum expression among all samplesand then filtered the negatively co-expressed genes bybeing in the top half of expressed genes and the posi-tively co-expressed genes by being in the bottom half.Second, the strength of the overlap increased with thestringency of the RAT signal threshold as judged by theincreasing odds ratios as illustrated in the Fig. 5c (Add-itional file 1: Supplemental Table S8). This result indi-cated that the RAT signal thresholds were indeedinformative in enriching for co-localized vlincRNAs andtheir regulatory targets.As the next step, we set to choose single RAT signal
threshold individually for each of the 14 vlincRNA-treatment combinations based on the best overlap withthe co-expressed genes as illustrated on Fig. 5d(Methods). Using these criteria, we found that avlincRNA can be in the vicinity of 20–2030 (median1104) and 47–239 (median 123) negatively and positivelyco-expressed genes correspondingly. The odds ratiosand the p values for the overlap between the final chro-matin interaction maps and the negatively co-expressedgenes ranged respectively from 1.07 to 2.4 (median 1.23)and from 1.16E−81 to 7.82E−2 (median 9.36E−48) (Fig.5e, f, boxplots marked “SMS” and Additional file 1: Sup-plemental Table S9). The corresponding values for thepositively co-expressed genes were 1.14 to 2.38 (median1.33) and 7.83E−15 to 3.89E−2 (median 3.91E−9) (Fig.5e, f, boxplots marked “SMS” and Additional file 1: Sup-plemental Table S10). The important outcome of thisanalysis was that majority of genes co-expressed with avlincRNA (74.2% positive- or 81.7% negative-correlating
transcripts) had evidence of co-localization with thatvlincRNA.
VlincRNAs directly regulate expression of genes in theirregulatory networksAs the next step, to provide direct support for the regu-latory effect of vlincRNAs, we assessed the effects of dir-ect knockdown of 2 vlincRNAs achieved using the CRISPR/Cas13 system [23] on expression of genes in theirregulatory networks (Fig. 1). We took advantage of theK562 cell line expressing doxycycline (Dox) inducibleCas13 that has been previously used by us to show bio-logical relevance of vlincRNAs in a high-throughputscreening [22]. In that study, a mixed population of cellswith each cell stably expressing one of 588 individualgRNAs was subjected to a survival challenge with differ-ent anti-cancer drugs [22]. Here, we generated 8 stablecell lines expressing individual gRNAs found to makecells sensitive to genotoxic stress in that high-throughput screen and targeting 2 vlincRNAs [22]. Foreach vlincRNA, we generated 4 stable cell lines constitu-tively expressing 2 different targeting gRNAs and 2 cog-nate mis-match control gRNAs containing mutations inbases 12–14 of the 28-mer gRNA as previously reported[22]. These mutations would abrogate the activity of thegRNA [23]. To avoid clonal effects, each cell line wasrepresented by a mixed population of cells with differentsites of lentivirus insertion.Each of the 8 cell lines was treated with Dox for 0, 3,
or 6 days, and the RNA population from each samplewas subjected to RNA-seq analysis. Overall, we observedconsistent knockdown in 3 out of 4 gRNAs with an aver-age depletion of 20.4% compared to day 0 and the non-targeting control gRNAs based on the RNA-seq analysis(Methods, Additional file 1: Supplemental Table S10). Ifdepletion of a vlincRNA has an effect on the genes itregulates, then the RNA levels of the negatively corre-lated genes should increase while those for the positivelycorrelated ones, decrease (Fig. 6a). Thus, the foldchanges of the former in response to vlincRNA knock-down would be higher than that of the latter. Con-versely, if a vlincRNA has no effect on the genes itregulates, there should be no difference in the relativeexpression changes between genes negatively and posi-tively correlating with it. To determine whether the
(See figure on previous page.)Fig. 5 Validation of the co-expression derived networks using RAT assay. a, b Box plots of the odd ratios (a) and p values (b) of overlap betweenco-expression networks and the chromatin interaction datasets after stratifying the genes into the top and bottom half based on the expression.c Top: definition of the odds ratio and the depiction of the hypothesis tested in the part below. Bottom: box plots of the odds ratios of theoverlaps between the co-expression networks and genes containing RAT regions at the gene (left) and region (right) levels at different RAT signalthresholds (X-axes). d A diagram illustrating selection of final RAT signal thresholds for each of the 14 vlincRNA-treatment combinations based onthe best overlap with the co-expressed genes. e, f Overlap between the co-expression networks and genes containing RAT signals at the finalRAT signal thresholds for the SMS and Illumina platforms. Odds ratios (e) and p values (f) are shown
Cao et al. BMC Biology (2021) 19:108 Page 10 of 24

difference exists, fold change of each gene was calculatedfor the 3- and 6-day time point relative to (1) the corre-sponding mismatch control and (2) the un-induced sam-ples (the day 0 controls) based on RNA-seq analysis(Methods).We then estimated differences in the relative fold
changes between 4 groups of genes for every vlincRNA.The first 3 groups were based on the co-expressedgenes: (1) all negatively vs all positively co-expressedgenes, (2) 100 most negatively vs 100 most positively co-expressed genes, and (3) 50 most negatively vs 50 mostpositively co-expressed genes. The final background con-trol group consisted of all remaining genes, many ofwhich also exhibited weak correlation (either positive ornegative) with vlincRNA expression, which however didnot pass the significance thresholds described above forthese genes to be considered co-expressed with vlincR-NAs (Fig. 6a). In theory, the effect of vlincRNA deple-tion on these background genes should be less than onthe co-expressed genes. Thus, the relative fold changedifference in the background genes negatively and posi-tively correlating with vlincRNA expression would serveas a control for the differences observed between thenegatively and positively co-expressed genes (Fig. 6a).Therefore, the background group was split into two sub-sets based on negative or positive correlation with avlincRNA and the differences in the relative fold changesbetween the two groups were calculated. For each
comparison, we calculated 3 metrics: (1) differences be-tween median relative fold changes, (2) Cohen’s d effectsof differences between the average relative fold changes,and (3) statistical significance of the difference using theWilcoxon rank sum test (Fig. 6b–e, Additional file 1:Supplemental Table S10). The comparisons were doneby treating the 3- and 6-day time points separately andby combining the two time points.Strikingly, the relative fold changes of the negatively
co-expressed genes were almost always higher thanthose of the positively co-expressed ones as signified bythe differences of the medians and positive Cohen’s dscores (Fig. 6b–e, Additional File 1: Supplemental TableS10). However, the differences of the medians and theCohen’s d values were much higher for the co-expressedgenes compared to the background correlated genes(Fig. 6b–e, Additional file 1: Supplemental Table S10).This difference was particularly pronounced when thetop 50 or 100 negatively co-expressed genes were com-pared with the top 50 or 100 positively co-expressedones (Fig. 6b–e, Additional file 1: Supplemental TableS10). Overall, the magnitudes of the Cohen’s d effectswere quite small, mostly < 0.1 for the control back-ground genes (Fig. 6b, d, Additional file 1: SupplementalTable S10). The differences of the medians and Cohen’sd values were higher on the day 3 compared to day 6(Fig. 6d, e, Additional file 1: Supplemental Table S10),possibly due to accumulation of indirect effects affecting
Fig. 6 Effect of vlincRNA knockdowns using CRISPR/Cas13 on relative fold changes of the co-expressed genes. a Schematic representation of theexpected connection between the either positively or negatively co-expressed genes (left) and the corresponding change in expression level inresponse to a vlincRNA knockdown (right). b–e Relative differences in the fold changes between negatively and positively co-expressed genes foreach gRNA targeting-control pair (bottom). The relative differences were calculated as Cohen’s d metrics (b, d) or differences of medians (c, e) byeither combining the data for both time points (3 and 6 days) (b, c) or analyzing them separately (d, e). More details in the text
Cao et al. BMC Biology (2021) 19:108 Page 11 of 24
expression of the target genes. Furthermore, using theWilcoxon rank sum test, the median relative foldchanges of the negatively co-expressed genes weresignificantly higher (p value < 0.05) than those of thepositively co-expressed ones for 2 out of 3 gRNAs (Add-itional file 1: Supplemental Table S10). However, severalcomparisons for the remaining gRNA were reaching thethreshold of significance with the p values in the 0.05–0.09 range (Additional file 1: Supplemental Table S10).Based on these results, we reached the following con-clusions. First, vlincRNAs appear to directly regulatemultiple other genes, both positively and negatively,and these regulatory interactions could be predictedbased on expression correlation in our co-expressionassay. Second, genes with stronger co-expression withvlincRNAs do exhibit stronger regulation by the vlincR-NAs. Third, even relatively modest levels of depletion ofthese transcripts can have measurable molecularphenotypes.
Functional properties of vlincRNA regulatory networksThe strong statistical overlap between the SMS co-expression and the chromatin interaction datasets com-bined with the CRISPR/Cas13 validation indicated weidentified true vlincRNA regulatory networks. As de-scribed above, RAT signal for the genes in vlincRNA net-works was significantly higher than in the backgroundgenes in most treatments. Therefore, it appears that differ-ent treatments did not significantly alter vlincRNA regula-tory networks. To further quantify this observation, weidentified lists of genes shared by the co-expression andchromatin interaction datasets in each treatment (DMSOor drugs) for each vlincRNA. Then, we estimated the frac-tion of overlap among these lists for each vlincRNA. Over-all, 83.7–100% (median of 92.9%) and 48.6–83.8% (medianof 63.7%) of respectively negatively and positively corre-lated co-expressed genes were shared by the DMSO-treated controls and the drug treatments. The respectiveodds ratios of positive and negative co-expressions were52.8–192.7 (median 83) and 6.3–95.6 (median 12.6), indi-cating that the overlaps between the drug treatments andDMSO treatments were statistically significant (Fig. 7a,Additional file 1: Supplemental Table S11). Also, the net-works did not change significantly in response to treat-ments with different drugs. For the two vlincRNAsprofiled in both the etoposide and SN-38 treated cells,87.2–99% (median of 93.1%) and 80.4–93.7% (median of87.1%) of respectively negatively and positively correlatedco-expressed genes were shared by the two drugs.Second, networks consisted primarily of genes located
on chromosomes different from those where the vlincR-NAs were found, as exemplified in the Fig. 7b. However,consistent with the results above, the odds ratios of theoverlap between the co-expression and chromatin
interaction datasets were higher for the genes located onthe same chromosomes (cis) as the vlincRNAs thanthose on the other chromosomes (trans) (Fig. 7c), butonly 12/28 of these overlaps were statistically significant(Fig. 7d, Additional file 1: Supplemental Table S12). Thelikely reason for it is that the number of genes on thesame chromosomes was not as high as genome-wide(Fig. 7e, Additional file 1: Supplemental Table S12).Therefore, we combined all samples to increase the stat-istical power and could indeed show that the odds ratiosof overlap between the co-expression and chromatininteraction datasets were higher in cis than in trans (pvalue 6.1E−3, Wilcoxon rank sum test). Therefore, theseresults suggest that vlincRNAs participate in both cisand trans interactions; however, while the latter aremuch more numerous, the RNA-chromatin interactionswith the genes on the same chromosomes tend to bestronger (see the “Discussion” section).To further understand the properties of the vlincRNA
regulatory networks, we performed Gene Ontology (GO)analysis to annotate all 407 vlincRNAs based on thefunctions of genes in the networks. Strikingly, the net-works for different vlincRNAs exhibited enrichment ofsimilar functions (Fig. 7f, g, Additional file 1: Supple-mental Table S13). Most of the negatively correlatednetworks were significantly enriched in functions relatedto RNA (Fig. 7f), while the positive networks were sig-nificantly associated with various development GOterms (Fig. 7g). For example, the top 5 enriched GOterms among the negatively correlated networks andshared by ≥ 65% of the vlincRNAs were “RNA process-ing,” “RNA splicing,” “mRNA splicing,” “mRNA meta-bolic process,” and “mRNA splicing” (Fig. 7f, Additionalfile 1: Supplemental Table S13). “DNA-templated tran-scription” was within top 20 such GO terms and sharedby 50% of all vlincRNAs (Additional file 1: SupplementalTable S13). On the other hand, the top 5 GO termsenriched in the positively correlated networks were“nervous system development,” “central nervous systemdevelopment,” “multicellular organism development,”“system development,” and “anatomical structure devel-opment” shared by 27–35% of the vlincRNAs (Fig. 7g,Additional file 1: Supplemental Table S13). Extending tothe top 50 GO terms revealed additional enrichment ofthe negatively co-expressed networks in functions asso-ciated with cell-cycle, such as “cell cycle phase transi-tion,” “cell cycle,” “mitotic cell cycle process,” “mitoticsister chromatid segregation,” and “negative regulationof cell cycle process” shared by 43–46% of vlincRNAs(Additional file 1: Supplemental Table S13). The samestep revealed the enrichment in functions associatedwith cellular adhesion among the genes found in thepositively correlated networks and shared by 13–21% ofvlincRNAs (Additional file 1: Supplemental Table S13).
Cao et al. BMC Biology (2021) 19:108 Page 12 of 24

0MB 100MB 200MB
10MB
100MB
100MB
100MB
110M
B100M
B12
0MB
100MB
13BM
0
100M
B
140M
B10
0MB
15
0MB
16
0MB
170MB
180MB
190MB100MB
200MB
20MB
200MB
210MB22
0MB
100MB3
0MB
100MB4
0MB
100MB
5
0MB
100M
B
60M
B10
0MB
7
0MB
100M
B80MB
100MB9 0MB 100MBX
0MB 100MB 200MB
10MB
100MB
100MB
100MB
110M
B100M
B12
0MB
100MB
13BM
0
100M
B 140M
B10
0MB
15
0MB
16
0MB
17
0MB
180MB
190MB100MB
200MB
20MB
200MB
21
0MB22
0MB
100MB3
0MB
100MB4
0MB
100MB
5
0MB
100M
B
60M
B10
0MB7
0MB
100M
B80MB
100MB9 0MB 100MB
X
0MB 100MB 200MB
10MB
100MB
100MB
100MB
110M
B100M
B12
0MB
100MB
13BM
0
100M
B
140M
B10
0MB
15
0MB
16
0MB
170MB
180MB
190MB100MB
200MB
20MB
200MB
210MB22
0MB
100MB3
0MB
100MB4
0MB
100MB5
0MB
100M
B
60M
B10
0MB
7
0MB
100M
B80MB
100MB9 0MB 100MBX
0MB 100MB 200MB
10MB
100MB
100MB
100MB
110M
B100M
B12
0MB
100MB
13BM
0
100M
B
140M
B10
0MB
15
0MB
16
0MB
17
0MB
180MB
190MB100MB
200MB
20MB
200MB
210MB22
0MB
100MB3
0MB
100MB4
0MB
100MB
5
0MB
100M
B
60M
B10
0MB7
0MB
100M
B8 0MB100MB
9 0MB 100MBX
Negativelyco-expressed network
Positivelyco-expressed network
Eto
po
sid
e D
MS
O
BA
All Cis only
NegativePositiv
e
NegativePositiv
e
2
4
6
Od
ds
rati
o
C DAll Cis only
NegativePositiv
e
NegativePositiv
e
0
20
40
60
80
−lo
g10
(p
-val
ue)
EAll Cis only
NegativePositiv
e
NegativePositiv
e
0
500
1000
1500
2000
Nu
mb
er o
f m
RN
As
0
50
100
150
200
NegativePositiv
e
Od
ds
rati
o (
Dru
g v
s D
MS
O)
Negative Positive
0.2
0.4
0.6
mRNA-m
RNA
VlincR
NA-Vlin
cRNA
VlincR
NA-mRNA
Co
rrel
atio
n v
alu
e (r
ho
)
0
H
Number of VlincRNAs
67
66
66
66
65
59
58
58
56
56
67
66
66
66
65
59
58
58
56
56
RNA processing
RNA splicing
mRNA splicing
mRNA metabolic process
mRNA processing
heterocycle metabolic process
cellular aromatic compound metabolic process
organic cyclic compound metabolic process
macromolecular complex subunit organization
nucleobase-containing compound metabolic process
0 100 200 300
Negative networks
35
30
28
28
27
24
24
22
22
22
35
30
28
28
27
24
24
22
22
22
nervous system development
central nervous system development
multicellular organism development
system development
anatomical structure development
brain development
developmental process
head development
membrane depolarization during action potential
cellular response to caffeine
0 50 100 150 200
Number of VlincRNAs
Positive networks
GF
Fig. 7 (See legend on next page.)
Cao et al. BMC Biology (2021) 19:108 Page 13 of 24

All in all, the enrichment of similar functions amongthe co-expressed genes suggested that vlincRNAs havesomewhat similar patterns of expression. To addressthis, we calculated median Spearman correlation amongvlincRNAs or mRNAs only and between pairs of vlincR-NAs and mRNAs. The median vlincRNA-vlincRNA,vlincRNA-mRNA, and mRNA-mRNA correlations wererespectively 0.28, −0.02, and 0.03 (Fig. 7h). Thus, indeedvlincRNAs tend to be coordinately regulated and partici-pate in control of genes with similar functions.
VlincRNAs are required for cellular survival under stressconditionsTo directly test whether vlincRNAs and their regulatorynetworks could have biological significance, we testedimportance of the 2 vlincRNAs used for the CRISPR/Cas13 experiments for the cell’s ability to survive geno-toxic stress. Cells from the 8 individual CRISPR/Cas13cell lines described above were mixed in equal propor-tions, grown for 3 days in presence or absence of Doxand then treated with etoposide (also with or withoutDox). As shown in our previous study, etoposide had astrong and long-lasting toxic effect on K562 cells, lead-ing to a continuous cell death even after the removal ofthe drug, and a slow recovery [22]. Here, for every treat-ment, after removing etoposide, the cells were allowedto regrow for ~ 10 days until they resumed normalgrowth and appearance, and then we estimated survivalof the cells harboring each gRNA by calculating the nor-malized abundance of that gRNA in the genomic DNAfrom the pooled cells using NGS. For every treatmentand every gRNA pair, we calculated the ratio of target-ing/non-targeting gRNA abundances to estimate relativesurvival of cell harboring gRNAs targeting vlincRNAsrelative to cells harboring their cognate non-targetingcontrols.Interestingly, the average/median of the ratios of the
targeting gRNAs relative to their cognate controls eitherimmediately after pooling or growth for 3 days beforeetoposide addition were 0.9/0.91 even though all celllines were mixed in equal proportions (Additional file 1:Supplemental Table S14, Methods). This suggests that
even during growth and expansion steps leading fromthe lentiviral transfection to establishment of the indi-vidual cell lines, preferential loss of cells expressing tar-geting gRNAs occurred presumably due to their toxicitycombined with the leaky expression of Cas13 in the ab-sence of Dox. The subsequent treatments with etoposideresulted in further drop in this ratio, especially whencombined with the induction of Cas13 by Dox (Add-itional file 1: Supplemental Table S14). The average/me-dian ratios of targeting vs non-targeting gRNAs were0.91/0.87 for the etoposide/−Dox and 0.78/0.76 for theetoposide/+Dox treatment (Additional file 1: Supple-mental Table S14). Overall, across all 4 gRNAs pairs, thedrop in the ratio (indicating more dead cells) in theetoposide/+Dox samples was statistically significant withp values of 0.01 and 0.04 (one-sided Student’s t test)compared to the cells not treated with etoposide orthose treated with etoposide/−Dox. Interestingly, cellsexpressing the gRNA D33_v2_6 that did not show sig-nificant vlincRNA depletion in the transcriptome ana-lysis were most depleted even without the drugtreatment compared to their non-targeting control inthe cell survival analysis with the corresponding averageratios of 0.84, 0.76 and 0.66 (Additional file 1: Supple-mental Table S14). These results suggest that our inabil-ity to detect consistent changes in the level of the targettranscript could be caused by the death of cells wherethis vlincRNA is depleted in a mixed population of cells.Altogether, these results demonstrate that these vlincR-NAs are required for cell survival during normal growthconditions and especially so under a genotoxic stress.
Effect of an RNA measurement platform on authenticityof co-expression derived networksTo test whether the significant overlap between the co-expression derived networks and chromatin interactiondatasets would be a general feature for any expressiondataset, we regenerated a fraction of the dataset used forthe co-expression analysis using the 2nd generationIllumina platform also using rRNA-depleted total RNA.We generated the co-expression networks using thesame criteria as above. Importantly, application of the
(See figure on previous page.)Fig. 7 Properties of vlincRNA regulatory networks. a Stability of the regulatory networks in different treatments—box plots of the odds ratios ofthe overlap between networks in the DMSO- and drug-treated samples for the 6 vlincRNAs. b–e Regulation of multiple genes in trans and cis.Most of the genes in the positively and negatively correlating networks are found on different chromosomes as illustrated for the co-expressionnetworks of the vlincRNA ID-1202 in either etoposide or DMSO treatments. Connections between the vlincRNA located on the chromosome 3and each gene co-expressed (either positively or negatively) with it and containing site of vlincRNA-chromatin interactions are shown by the thinlines. Box plots of the odds ratios (c), p values (d), and the total number of genes in common (e) based on the comparisons of the co-expressionnetworks and chromatin interaction datasets for either all genes (left plots) or genes found on the same chromosome (right plots) for the 14vlincRNA-drug combinations. f, g Top ten GO terms enriched in genes found in either negative (f) or positive (g) co-expression networks for all407 vlincRNAs. The GO terms were ranked based on the number of vlincRNAs (X-axes) whose networks were enriched in these terms. Thenumbers next to each term represent % of vlincRNAs containing the term out of the total 407 vlincRNAs. h Boxplots of the Spearman correlationvalues of all possible pairwise combinations of mRNA-mRNA, vlincRNA-vlincRNA, and mRNA-vlincRNA
Cao et al. BMC Biology (2021) 19:108 Page 14 of 24
same p value threshold to estimate the reliability of thecorrelation estimates should in theory account for thedifferent numbers of samples used to calculate the co-expression correlations (64 for SMS vs 32 for Illumina).Furthermore, the Illumina dataset had a much larger (onaverage ~10 fold) number of reads generated per sampleand significantly longer reads: paired-end 150 base readsvs single read of on average ~35 bases for SMS. For eachvlincRNA, we found a higher number of co-expressedtranscripts using the same thresholds in the IlluminaRNA-seq dataset than in the SMS one with the corre-sponding median numbers of 2,073 and 1,615. As in theSMS-based co-expression analysis, we observed astatistically significant trend towards the negative correl-ation between vlincRNAs and mRNAs with the corre-sponding median numbers of negatively and positivelyco-expressed mRNAs of 1,119 and 943 per vlincRNAs (pvalue < 2.2E–16, Wilcoxon signed rank test).However, the overlap with the RAT dataset was poor
based on comparisons with individual vlincRNA-treatment combinations or on merged dataset made bycombining all treatments for all vlincRNAs (Fig. 5e, f,Additional file 1: Supplementary Tables 15 & 16). Whilethe odds ratios of the overlaps with the negatively co-expressed genes indicated enrichment and ranged from1.03 to 1.74 (median 1.19) (Fig. 5e, Additional file 1:Supplemental Table S15), the p values were much lesssignificant compared with those from SMS RNA-seqmentioned above, with the median p value of 3.7E−2(ranging from 2.22E−47 to 0.35) (Fig. 5f, Additional file1: Supplemental Table S15). Furthermore, the odds ra-tios for the positively co-expressed genes were muchlower than those for the SMS RNA-seq dataset rangingfrom 0.8 to 1.06 with the median of 1.0 and the medianp value being 0.53 (ranging from 3.09E−2 to 0.93) (Fig.3a, b, Additional file 1: Supplemental Table S15). Similarresults were obtained using the merged data: while theoverlap was significant for the negatively co-expressedvlincRNAs for both platforms albeit with the higher sig-nificance in the case of SMS, it was only significant forthe positively co-expressed vlincRNAs detected by theSMS platform (Additional file 1: Supplemental TableS16). When both positively and negatively co-expressedvlincRNAs were combined, the overlap was only signifi-cant for the SMS platform (Additional file 1: Supple-mental Table S16).We also compared the effect of vlincRNA knockdown
on the co-expression networks generated by both plat-forms. Overall, the Illumina-generated networks hadsimilar profiles as the SMS ones (Additional file 1: Sup-plemental Table S17). However, the differences betweenthe co-expressed genes in the networks and the back-ground genes were mush less significant (Additional file1: Supplemental Table S17). For example, the Cohen’s d
effects of the combined day 3 and 6 data for the gRNAsgRNA D30_v6_6 and D33_v2_10 were 0.148 and 0.273for the network genes and correspondingly 0.062 and0.113 for the background genes for the SMS-generatednetworks (Fig. 6b, Additional file 1: Supplemental TableS10)—on average 2.4-fold higher for the network genes.The corresponding values for the Illumina networkswere 0.086 and 0.295 compared to 0.080 and 0.218(Additional file 1: Supplemental Table S17)—on average1.2-fold higher. Therefore, networks generated using dif-ferent expression platforms even on the same sampletype would likely differ significantly in terms of theirauthenticity.
DiscussionHere, we present a co-expression approach to function-ally annotate lncRNAs belonging to the class of vlincR-NAs based on a 3rd generation SMS. We furtherauthenticate the vlincRNA regulatory networks derivedusing this approach with genome-wide maps of chroma-tin interactions and targeted knockdown of selectedvlincRNAs. We provide several lines of evidence show-ing that the overlap between the co-expression networksand chromatin interaction dataset is not random andlikely represents biologically meaningful interactions.First, the chromatin interaction profiles are reproduciblein different biological replicas. Second, the signal derivedfrom the chromatin interaction profiles is much strongerfor the co-expressed genes compared to the backgroundgenes. Third, the overlap between genes showing evi-dence of proximity to lncRNAs and the co-expressiondataset is statistically significant. Fourth, the strength ofthe overlap is proportional to the stringency of the cutoffused in the RAT assay. Finally, we provide direct proofthat vlincRNAs regulate the target genes identified usingthe co-expression analysis via knockdown of specificvlincRNAs with the CRISPR/Cas13 system.Furthermore, we show that the transcriptome analysis
platform is crucial for obtaining authentic co-expressiondataset. Usage of a platform requiring PCR amplificationduring library preparation step significantly reduced ortotally abolished the concordance between the co-expression and the chromatin interaction datasets. Thiswas especially apparent in correlation between vlincR-NAs—a relatively low abundant class of transcripts—andlow-abundant mRNAs and was in agreement with theprevious reports showing that SMS is more accurate indetection and quantitation of low-abundant transcriptscompared to the platforms utilizing PCR amplificationduring library preparation such as Illumina and others[25]. While SMS has been used previously to generate abroad expression dataset across multiple cell type basedon CAGE (cap analysis gene expression) technology bythe FANTOM5 consortium [38], to our knowledge, no
Cao et al. BMC Biology (2021) 19:108 Page 15 of 24

extensive SMS dataset based on RNA-seq and generatedon a single cell type exists. Most lncRNA networks gen-erated so far are based on co-expression analyses whereexpression measurements include PCR amplificationsteps during the library preparations. Furthermore, noneof these networks have been independently validated.Therefore, the results presented here represent the firsteffort to generate lncRNA networks using cross-validation by independent molecular biological and re-verse genetics approaches.Altogether, in this work, we provide a guideline for a
co-expression annotation strategy that could be broadlyapplied to annotating transcripts of unknown function,both coding and non-coding. Based on our results, suchstrategy would include the following features: (1) itshould be based on a highly accurate whole-genome ex-pression analysis that does not involve PCR amplifica-tion steps, (2) include short time of transcriptomeperturbations to capture direct interactions, and (3) lim-ited to a single cell type. However, it is also quite con-ceivable that strategies that can at least partiallyovercome PCR-induced artifacts such as unique molecu-lar identifiers (UMI) might also work well in annotationstrategies based on co-expression analysis.Using this general strategy, we reach the following
conclusions about functionality of the vlincRNA class oftranscripts. First, vlincRNAs appear to regulate multiplegenes both in trans and cis. In this respect, they resem-ble transcription factors, yet their mode of function islikely to be quite different. Second, even though the ma-jority of genes regulated by vlincRNAs lie on differentchromosomes, genes located in cis are more likely to beregulated by vlincRNAs. Third, vlincRNAs appear tomostly negatively regulate other genes with the excep-tion of those in their immediate vicinity. This propertywould be similar to other lncRNAs reported to functionby targeting repressive chromatin modifying componentsto promoters of their target genes [4, 5].Fourth, the RNA-chromatin interaction assay used in
this study does not require direct interaction betweenlncRNAs and the target DNA, but rather relies on theirrelative proximity in the nucleus. Recently, a number ofexperimental approaches assaying either direct interac-tions or immediate proximity between DNA and RNAmolecules genome-wide have been reported [35–37].However, our results suggest that lncRNAs also engagein functionally important trans interactions that aremore distal to their target genes yet still having impacton regulation of expression of these genes. In this re-spect, it is noteworthy that vlincRNAs were previouslyreported to localize to discrete subnuclear structures[19, 29]. Together with these localization properties, theresults presented here suggest that vlincRNAs mightfunction by participating in formation of subnuclear
domains and thus control expression and/or processingof multiple genes within these domains. Consistent withthese results, lncRNAs were previously hypothesized tofunction as intelligent scaffolds that fulfill the role of or-ganizers of micro-domains within nucleus that facilitateinformation exchange and computation necessary todeal with staggering complexity of molecular decisionstaking place within the nucleus of a human cell [39]. In-deed, a precedent for this exists, as exemplified theNeat1 lncRNA shown to represent a critical componentof the subnuclear structures paraspeckles [40, 41]; how-ever, our results suggest this functionality of lncRNAsmight be much more common.Interestingly, we found that any given vlincRNA can
apparently regulate multiple (from hundreds to thou-sands) genes. This raises a question of how a lncRNA—even a very long one—could be in proximity of andaffect so many genes. One possible explanation is thatgenes are enriched near vlincRNAs in the 3Dorganization of the nucleus, and this enrichment is cap-tured by the RAT assay. In fact, NEAT1 and MALAT1lncRNAs have been shown to not only form subnucleardomains but also interact with hundreds of genes [42].Similarly, vlincRNAs could also provide connections be-tween the multiple genes they interact with and the nu-clear domains they help to form. Another possibility isthat not all of these interactions take place in the samecell and the batch-based assays used in this study cap-ture the full complexity of interactions happening inmultiple cells. However, additional studies, likely usingsingle-cell approach are needed to address this question.Interestingly, all 407 vlincRNAs representing ~ 2% of
the genomic space (similar to what is represented byexons of mRNAs) have similar patterns of expressionand appear to regulate genes involved in relatively fewtypes of functions. The latter include those related tovarious aspects of RNA metabolism, nervous system de-velopment, and development in general and, to a lesserextent, cell-cycle and cellular adhesion. Previously, thefunctions related to early development and early braindevelopment were also found among positively correlat-ing functions for vlincRNAs regulated by pluripotency-associated transcription factors Sox2, Nanog, or Oct4using co-expression across multiple cell types [29]. Ourdata suggest that this association may be a more generalfeature of vlincRNAs and not necessarily limited to theones regulated by the pluripotency-associated transcrip-tion factors.The enrichment of cell-cycle related functions was also
found previously among the genes negatively correlatedwith vlincRNAs [29]. Furthermore, the two characterizedvlincRNAs—VAD and ASAR6-141—have been impli-cated in respectively control of cell cycle [19] andchromosomal replication timing [20]. It thus appears
Cao et al. BMC Biology (2021) 19:108 Page 16 of 24
that regulation of cell cycle related functions might in-deed be a common feature of vlincRNAs. Overall,networks consisting of genes encoding RNA-relatedfunctions and those involved in the cell-cycle fit quitewell the potential involvement of vlincRNAs in DNAdamage response found in this work. The cell cycle con-trol is a major and well-understood component of thisprocess [43].However, perhaps the most striking and novel outcome
of this study is the association of the majority of vlincR-NAs with regulating genes encoding functions involved inRNA processing and metabolism. The complexity of tran-scriptome in a human cell is staggering with almost everygene possessing alternative isoforms due to initiation, ter-mination and splicing with many such isoforms still undis-covered [44, 45]. Regulation of this complexity must itselfbe extremely complex and dynamic to respond to the vari-ous environmental and developmental cues and challengesfaced by a cell. Furthermore, DNA damage response isknown to involve multiple genes whose products functionin RNA splicing and RNA metabolism [46]. The resultspresented here argue that vlincRNAs could provide novelregulatory hubs responsible for coordination of responseof cells to DNA damage predominantly via regulatinggenes encoding RNA-related functions. In general, thevlincRNAs appear to serve as regulators of the regulatorsof the transcriptome and thus potentially represent an im-portant component of the hidden layer of RNA-basedcontrol postulated to occur in cells of complex organisms[10, 11].
ConclusionsThis work represents the first comprehensive study ofregulatory networks uncovered for a novel class oflncRNAs—vlincRNAs. The networks were initially ob-tained using the co-expression analysis based on SMStranscriptome profiling and then validated using two dif-ferent approaches. This cross-validation approachconfirmed the authenticity of these lncRNA regulatorynetworks and ensured validity of the following majorconclusions derived from the analysis of these networks.First, a typical vlincRNA appears to function by regulat-ing expression of multiple genes in cis and trans.Second, a vlincRNA can have both positive and negativeeffects on expression of different target genes. Third,vlincRNAs tend to regulate genes encoding certainfunctions related most notably to RNA processing, cellcycle, development, and adhesion. Fourth, the regulationdepends on a mechanism based on co-localization, yetnot necessarily direct interaction, of the vlincRNAs andtheir target genes in nucleus. In this regard, two otherwell-characterized lncRNAs NEAT1 and MALAT1 showsimilar mode of regulation. It is tempting to speculatetherefore that regulation of multiple genes and doing so
via proximity in the nucleus might be a common modeof lncRNA functionality. Furthermore, targeted knock-down of 2 vlincRNAs in stable cell lines has revealedbiological importance of these transcripts and their regu-latory networks in survival in response to genotoxicstress at least at the level of cultured cells similar to theresults obtained previously by our group in a high-throughput screen [22]. However, additional studies arerequired to address of functionality of vlincRNAs, andlncRNAs in general, at the organismal level [12].
MethodsBiological material and reagentsHuman CML leukemia cell line K562 was obtained fromCell Bank of Chinese Academy of Sciences. Cells werecultured in RPMI 1640 (Thermo Fisher Scientific) sup-plemented with 10% (v/v) heat-inactivated fetal bovineserum (Thermo Fisher Scientific) and 1% (v/v) pen-strep(Thermo Fisher Scientific) at 37 °C and 5% CO2. Fordrug treatments, 1.5 million cells were seeded in 3 ml ofthe medium without antibiotic per well in 6-well plates.After 16 h, various drugs or DMSO/water controls wereadded at the concentrations indicated in Additional file1: Supplemental Table S1 and incubated for 3 or 6 hr.All drugs were obtained from Abmole Bioscience Inc.and dissolved in DMSO (with the exception of YM-155and cytarabine that were dissolved in water) (Additionalfile 1: Supplemental Table S1). The concentration ofDMSO was kept at 0.1% in all treatments. Total RNAwas extracted using TRNzol Universal (Tiangen, DP424)and Total RNA kit I (Omega, R6834-02) according tothe manufacturer’s protocols and quantified using Qubit3.0 Fluorometer (Life technologies). Total RNA (5 μg)was treated with 5 U of TURBO DNase (Thermo FisherScientific, AM2238) in 1× TURBO DNase buffer(Thermo Fisher Scientific, AM2238) at 37 °C for 30 minto remove genomic DNA, and then purified with 2× vol-umes of VAHTS RNA Clean Beads (Vazyme, N412).The DNase-treated material was subjected to eitherRNA-seq or real-time qPCR analysis.
RNA-seqHelicos/SeqLL SMScDNA synthesis was performed with a modified versionof the NSR hexamer method to avoid synthesis of rRNA.DNase-treated RNA (1 μg) was combined with 80 ng ofa mixture of 749 NSR hexamers (described by [28] andsynthesized by Shanghai TranSheep Bio Co. Ltd), 4 μl of10 mM dNTP and water to a total volume of 13 μl. Themix was heated at 65 °C for 5 min and kept on ice beforeadding 4 μl of 5× SuperScript III reaction buffer and 1 μlof 0.1M DTT followed by incubation at 25 °C for 20min. The sample were moved on ice and 1 μl of Super-Script III enzyme (Invitrogen) was added followed by
Cao et al. BMC Biology (2021) 19:108 Page 17 of 24

incubation at 25 °C for 10 min, 40 °C for 40 min, 55 °Cfor 50 min, and 75 °C for 5 min. The RNA template wasremoved by adding 1 μl of RNase H (New England Bio-labs Inc.) and 1 μl of RNase If (New England BiolabsInc.) and incubating at 37 °C for 30 min. cDNA waspurified using Performa DTR Gel Filtration Cartridges(EdgeBio) and polyA−tailed with TdT essentially as pre-viously described [2]. Sequencing was outsourced to theSeqLL, LLC facility (Woburn, MA, USA).
IlluminaAfter DNase-treatment, the total RNA samples wereused for RNA-seq library construction using rRNA-depletion strategy. The library construction and the Illu-mina sequencing using paired end 150 bp strategy on10-gigabase (GB) scale was outsourced to NovogeneCorporation (Beijing).
Real-time qPCR analysisThe DNase-treated RNA (1 μg) was used for first-strandcDNA synthesis using SuperScript III kit (Invitrogen,18080093) and 80 ng random hexamers according to themanufacturer’s protocols. The cDNA was purified with2× volumes of VAHTS DNA Clean Beads (Vazyme,N411). The concentrations of the cDNA samples werealways measured on Qubit 3.0 fluorometer (Life Tech-nologies, MAN0010876) with “Qubit ssDNA Assay” kit(Invitrogen, Q10212). Then, either 10 ng or 60 ng cDNAwas combined with 5 μl PowerUp™ SYBR™ Green MasterMix (Thermo Fisher Scientific) and 0.5 μl of each primer(10 μM) in total volume of 10 μl. Each primer pair-sample combination was represented by 3 independenttechnical qPCR replicas. The Ct values were obtainedusing MxPro software (Agilent Technologies, Inc) withComparative Quantitation (Calibrator) settings.
RAT assayCrosslinking and cell lysisFor 4 vlincRNAs (ID-1132, ID-1205, ID1299 andID1274) (Additional file 1: Supplemental Table S18)found to be induced only by etoposide, the RAT proced-ure was performed on nuclei isolated from cells treatedwith either etoposide or DMSO. For 2 vlincRNAs (ID-1202 and ID1107) (Additional file 1: Supplemental TableS18) induced by either etoposide or SN-38, the RATprocedure was performed on nuclei isolated from cellstreated with either etoposide, SN-38 or DMSO.K562 cells (5 × 10⁵ cells/ml) were incubated in RPMI
1640 (ThermoFisher Scientific) supplemented with 10%(v/v) fetal bovine serum (ThermoFisher Scientific) at37 °C and 5% CO2 for 16 h and treated with 1 μM SN-38(Abmole Bioscience Inc, M3016) or 100 μM etoposide(Abmole Bioscience Inc, M2326) or the same volume ofDMSO as control for 6 h. The cells (3 × 10⁶) were
crosslinked in 1 ml of growth medium supplementedwith 1% formaldehyde for 10 min at room temperatureand immediately collected by centrifugation at 1000 rpmfor 10 min at 4 °C. Cells were washed twice with 5 mlcold 1× PBS followed by treatment with 100 μl of 1.375M glycine to neutralize crosslinking at roomtemperature for 2 min and centrifugation at 3500 rpmfor 15 min at 4 °C. To prepare the nuclei, the crosslinkedcells were lysed with 5 ml cell lysis buffer (1 mM Tris[pH 8.0], 10 mM NaCl, 0.2% NP-40, 1× protease inhibi-tors (Abmole Bioscience Inc, M5293)) for 1 h at 4 °Cwith mixing and centrifuged at 2500 rpm for 15min at4 °C followed by lysis for additional 15 min. The nucleiwere washed twice with 500 μl 1× first strand reversetranscription buffer (FS buffer: 50 mM Tris-HCl (pH8.0), 75 mM KCl, 3 mM MgCl2) and suspended in 100 μl1× FS buffer (Invitrogen) in the presence of 0.3% sodiumdodecyl sulfate (SDS) and incubated at 37 °C for 1 h withgentle mixing. In order to sequester the SDS, triton X-100 was added to a final concentration of 1.8%. Nucleiwere centrifuged at 2500 rpm for 15min at roomtemperature and washed twice with 500 μl 1× FS buffer.
Strand-specific reverse transcription (SSRT)The nuclei were resuspended in 80 μl SSRT solution(9 μl primer set containing 5 μM of each oligonucleotide,3.75 μl of 0.4 mM biotin-14-dCTP (Invitrogen), 6 μl of10 mM dNTP (Invitrogen), 800 U Maxima Reverse Tran-scriptase (Thermo Fisher Scientific), 160 U RNaseOUT(Invitrogen), 6 μl of 0.1 M DTT (Invitrogen) and 1× FSbuffer (Invitrogen)) and incubated at 60 °C for 50 min,followed by heating at 85 °C for 5 min to inactivate theenzyme. For each vlincRNA, we designed 2 sets of spe-cific non-overlapping oligonucleotides complementaryto the RNA sequence of each of the six vlincRNAs men-tioned in the text (Additional file 1: Supplemental TableS18). The oligonucleotides were separated by ~ 5 kb andpooled together as primer set to a final concentration of5 μM for each. Separate SSRT reactions performed inparallel with the two specific oligonucleotide sets andwithout the oligonucleotides as the control. All RAT ex-periments were done in two biological replicas.
Chromatin DNA fragmentationAfter SSRT, samples were washed twice with 500 μl 1×NEBuffer 3 (New England BioLabs). For chromatinfragmentation, samples were digested with 250 μl 1×NEBuffer 3 containing 250 U DpnII (New England Bio-Labs), 250 U AluI (New England BioLabs) and 250 UMseI (New England BioLabs) for 6 h at 37 °C.
Size detection of fragmented chromatinFragmented chromatin particles were collected and re-suspended in the sorting buffer (2× saline-sodium
Cao et al. BMC Biology (2021) 19:108 Page 18 of 24

citrate, 20% (vol/vol) formamide and 0.2 mg/ml RNase-free BSA in nuclease-free water) and detected based onSSC (side scatter) and FSC (forward scatter) under 488nm excitation using the MoFlo Astrios EQ flow cellsorter (Beckman Coulter). Latex beads measuring 100,200, and 300 nm from the Photon Correlation Spectros-copy control mixed kit (Beckman Coulter, 6602336)were used as the standard size particles, and the sortingbuffer was used as the background control. The data wascollected and analyzed by the Summit 6.2 software(Beckman Coulter), and the gates were set based on thestandard particle sizes. The measurements were done in3 biological replicas with one shown in Fig. 3c. On aver-age, ~ 250 and ~ 480 thousand particles were measuredfor the buffer-alone control and the fragmented chroma-tin samples respectively.
Enrichment and crosslink reversalPierce Streptavidin Magnetic Beads (ThermoFisher Sci-entific) were washed with binding/wash buffer (25 mMTris, 0.15M NaCl, pH 7.2, 0.1% Tween-20) following themanufacturer’s instructions. Each sample was mixedwith 20 μl pre-washed magnetic beads and incubated atroom temperature for 2 h with mixing to enrich thecomplexes containing vlincRNA/biotinylated-cDNA/chromatin DNA. The beads were collected by magneticstand and washed six times with 300 μl of the binding/wash buffer. The crosslink reversal was performed by in-cubation with 50 μl binding/wash buffer and 50 μl of 20mg/ml proteinase K (Invitrogen) overnight at 65 °C.After collecting the beads with a magnetic stand, thesupernatant was saved and used for the subsequentsteps.
DNA extractionTo remove RNA, 50 U RNase If (New England BioLabs)was added into the supernatant and incubated at 37 °Cfor 1 h. DNA was harvested in following steps. First, thesample was vigorously mixed with the same volume ofphenol-chloroform-isoamyl alcohol (25:24:1, v/v) andcentrifuged at the top speed for 5 min at roomtemperature. Second, after removing the colorless upperaqueous phase into a new tube, the DNA was precipi-tated by adding 2.5× volume of absolute ethanol, 0.1×volume of 5M NH4Ac and 20 μg of glycogen (Thermo-Fisher Scientific) and incubating for 30 min at −80 °Cfollowed by centrifugation at the top speed for 10 min at4 °C. Third, the pellet was washed with 1ml ice-cold70% ethanol and vacuum-dried, followed by resuspen-sion in 22 μl of water. Fourth, the concentration of theDNA was measured using Qubit 3.0 fluorometer anddsDNA HS Assay kit (Thermo Fisher Scientific).
NGS library preparation and sequencingThe libraries were constructed with the NEBNext®Ultra™ DNA Library Prep Kit for Illumina® (NewEngland BioLabs) following the manufacturer’s recom-mendations and sequenced on the Illumina HiSeq XTen platform using paired end 150 base strategy by theNovogene Corporation (Beijing) and 10-GB of raw datawas collected for each sample.
Construction of the vlincRNA inducible knockdown celllines and their transcriptomic and phenotypic analysesConstructionTwo pairs of targeting gRNAs and corresponding mis-match controls with mutations in the bases 12–14 of the28-mer gRNAs (Additional file 1: Supplemental TableS18) [22] were selected for each of the two vlincRNAsID-1162 and ID1107 corresponding to vlincRNAs ID-838 and ID274 used by Xu et al [22] and cloned into thegRNA vector pLentiguide by Golden Gate cloning.Lentivirus particles were produced by transfecting the293FT packaging cell line with plasmid expressing eachindividual gRNA and used to transfect the TRE-LwCas13a-K562 cell line expressing Dox-inducibleCas13 [22]. Transfected cells stably expressing the gRNAsequences were selected by flow cytometry (BD Cyto-FLEX) using mCherry as the selection marker to gener-ate vlincRNA inducible knockdown cell lines. These celllines were generated by SyngenTech (Beijing, China).
Transcriptome analysisFor the expression analysis of the vlincRNA knockdowncell lines, cells (5 × 10⁵ cells/ml) were grown in 10mlculture medium supplemented with 1 μg/ml Dox for 0, 3and 6 days. RNA was isolated with E.Z.N.A. Total RNAKit I (Omega) and RNA-seq was performed on the Illu-mina NovaSeq platform by the Novogene Corporation(Beijing, China) using rRNA-depletion protocol andpaired end 150 bp strategy on 10-GB scale.
Survival challenge experimentFor each vlincRNA ID-1162 and ID1107, 3.5 × 10⁵ cellsfrom each of the 8 cell lines harboring individual target-ing and corresponding mismatch control gRNAs (4 celllines per vlincRNA) were pooled together and incubatedin 10ml culture medium supplemented with 1 μg/mlDox (or −Dox control) in a T25 flask for 3 days beforeseeding. Then, 7 × 10⁵ of mixed cells were seeded into awell of 6-well plates containing 2 ml medium and treatedwith 25 μM etoposide (AbMole BioScience, USA) in thepresence of Dox or water (–Dox) control. After 24 h,cells were collected, washed twice with 1 ml RPMI 1640medium to remove the drug and resuspended in 2mlfresh culture medium with Dox or without Dox for re-covery. For each well, cells were passaged daily with the
Cao et al. BMC Biology (2021) 19:108 Page 19 of 24
maximum density of 3.5 × 10⁵ cells/ml, until most cellsrecovered the normal shape and the doubling rate of theuntreated cells. Genomic DNA was harvested from cellsimmediately after pooling, 3 days after the Dox (or −Doxcontrol) treatment but before adding etoposide, and atthe end of the survival challenge using TIANamp Gen-omic DNA Kit. The gRNAs were PCR amplified fromthe genomic DNA and profiled by NGS to estimate theabundance of each gRNA as described previously [22].The gRNA profiles after survival challenges were ana-lyzed to assess the effect of vlincRNA knockdown on thecell survival based on the abundance of cell harboringthe targeting gRNAs compared to their cognate mis-match controls. Three independent biological repeatswere performed for each drug treatment. In some treat-ments, an outlying replica was removed, resulting in aminimum of 2 biological repeats per treatment.
BioinformaticsThe R environment was used for all bioinformatics ana-lyses. Known genes were represented by the UCSC Genesdatabase, specifically the table knownGene.txt downloadedfrom the GRCh37/hg19 assembly of the UCSC genomebrowser [47]. And for each gene, only the longest anno-tated transcript (based on the total length(s) of theexon(s)) was chosen for the subsequent analysis. The over-laps between genomic coordinates were calculated usingthe “intersect” function of the BEDTools suite (v2) [48].The enrichment p values of overlaps were calculated usinghypergeometric tests in the R environment. All Wilcoxonrank-sum tests mentioned in the text were two-sided,while Wilcoxon signed rank tests and hypergeometrictests were one-sided.
RNA-seq data analysis of K562 cell line treated withanticancer drugsHelicos/SeqLL SMSRaw SMS reads were filtered for length (≥ 25 bases) andsequence quality using Helisphere package as previouslydescribed [2]. The remaining reads were then aligned tothe GRCh37/hg19 assembly of the human genome usingindexDPgenomic software [49]. RPKM values were cal-culated for each transcript annotated in UCSC Genesdatabase based on reads mapping to exons of these tran-scripts and vlincRNAs as previously described [2].
Illumina(1) Only paired end raw reads where each read was ≥ 30bases after adaptor trimming and each base had the Phredquality score ≥ 20 were selected. (2) Such reads were thenaligned to the GRCh38/hg38 assembly of the human gen-ome by the Tophat software [50], and the uniquely mappingreads were used to calculate the FPKM for each transcriptannotated in UCSC Genes database and vlincRNAs by the
Cufflinks software with the default parameters [51]. Onlythe genes shared with the annotation used for the Helicos/SeqLL SMS analysis were kept for further analysis.
Co-expression analysisSpearman correlations were calculated between eachvlincRNAs and a protein-coding mRNA using the“stats.spearmanr” function from the NumPy package inPython for the SMS and Illumina RNA-seq datasets sep-arately. Only the pairs with the correlations > 0.35 or <−0.35 and the corresponding p values < 0.01 were usedfor the subsequent analyses.
RAT data analysisGeneration of the average normalized RAT score
1) Only paired end raw reads where each read was ≥30 bases after adaptor trimming and each base hada Phred quality score ≥ 20 were selected. Suchreads were then aligned to the GRCh37/hg19assembly of the human genome using the BWA-MEM (Version 0.7.12) aligner with the default set-tings. Only the pairs of the reads where both pairedreads uniquely mapped to the genome with the ap-propriate configuration and spacing were kept.
2) For each target oligonucleotide set and the no-oligocontrol, the alignments were converted into densityformat where each position of the genome wasassigned score based on the total number of readsmapping there and normalized to the total numberof reads in the sample.
3) For each target oligonucleotide set, the RAT signalfrom the step above was subtracted by thenormalized signal of the corresponding control no-oligo treatment.
4) For each drug-vlincRNA combination, the score ofRAT signal of each position in the genome was de-fined as the average of the control-subtracted nor-malized scores from the two RAT replicas.
Analysis based on ANARS (Fig. 4)
1) For each vlincRNA, all genes were divided into 3groups: (i) positively co-expressed, (ii) negativelyco-expressed, and (iii) the rest of genes was consid-ered as background.
2) ANARS was derived as follows (Additional file 3:Supplemental Figure S2):a. The length of each gene was normalized to 5 kb
resulting in the relative coordinates rangingfrom 1 to 5000 shown on Fig. 4a, d.
b. Finally, ANARS was calculated for each position(from 1 to 5000) of each group of genes definedin the step 1 by summing up the normalized
Cao et al. BMC Biology (2021) 19:108 Page 20 of 24
average RAT score of such position and thendividing by the number of genes.
3) Furthermore, for each gene, the upstream anddownstream 5 kb regions were extracted and thencorresponding ANARS values were calculated asin the step 2, but without the lengthnormalization.
4) ANARS for each category of genes (co-expressed orbackground) in each sample was ranked and the top30% were used for calculation of the significance ofthe difference between co-expressed genes andbackground control genes. Only non-zero ANARSvalues were used in the comparison between the cisco-expressed genes and all co-expressed genes.One-sided Wilcoxon rank sum test was used in thisanalysis.
Generation of RAT regions for each replica (Fig. 3d)
1) A threshold of > 0 was applied to averagenormalized RAT score to generate regions wherethe signal of each base was higher in the specificoligonucleotide sample than in the no-oligo control.
2) The resulting regions were further filtered forprecise overlap between the two oligonucleotidesets and only shared regions were extracted.
3) The resulting regions were further filtered based onthe magnitude of the RAT signal after thesubtraction of the no-oligo controls. The RAT sig-nal for each base that survived filtration in the step1 was ranked and thresholds based on the top 1%,5%, 10%, 20%, and 30% of the signal were applied.Adjacent bases with signal above correspondingthresholds were merged as regions.
4) The genes containing within their boundaries suchregions for each replica and each vlincRNA-treatment combination for each %-ile thresholdwere then selected and used in the analysis shownin Fig. 3d. For this analysis, the RAT regions withingene boundaries were defined either by a union(gene-level analysis) or by overlap of regions foundin both replicas requiring precise matching of gen-omic coordinates (region-level analysis).
Analysis of overlap between genes containing RAT regionsand co-expressed genes (Fig. 5)
1) Lists of genes based on the gene-level and region-level analyses were generated for each thresholdand each vlincRNA-treatment combination.
2) The overlaps between co-expression networks andvlincRNAs-chromatin networks (Fig. 5a–c) werecalculated as follows:
a. For each mRNA, the maximum FPKM amongthe 64 SMS RNA-seq samples was calculated,and mRNAs with the maximum FPKM > 0 wereretained for the downstream analysis.
b. The mRNAs were ranked by the maximumFPKM values from largest to smallest, and thetop and bottom 50% expressed genes weredefined as either “top half” or “bottom half”mRNAs.
c. Based on the separation, the positively co-expressed genes were further divided into thosederived from the top or bottom half of expres-sion and the same was done for the negativelyco-expressed genes resulting in 4 groups.
d. Each of the 4 groups of co-expressed genes foreach vlincRNA was used to calculate the signifi-cance of overlap with the gene and region-levelRAT signal for each treatment of the corre-sponding vlincRNA. The significance of theoverlap was calculated separately for each RATsignal threshold with single-sided hypergeo-metric test (Fig. 5a–c).
3) To build the final regulatory networks (Fig. 5d) forthe 6 vlincRNAs using in the RAT analysis, RATsignal thresholds yielding lowest p values in thegene level analysis in the step 2d for the genesderived from the top half of expression for thenegatively and bottom half for the positively co-expressed genes. The resulting networks were usedin the analyses show in Fig. 7a–e.
4) The same analytical steps were used to generateoverlap between the RAT and co-expression resultsobtained using Illumina RNA-seq.
GO analysisThe analysis was performed on positively and negativelyco-expressed genes found using SMS RNA-seq for all407 vlincRNAs as defined in the “Co-expression ana-lysis” section. The gene set enrichment analysis was per-formed using the GOstats package (version 2.46) [52] inthe R environment (package org.Hs.eg.db), and the pvalues adjusted according to the Benjamini and Hoch-berg approach were calculated using the package “mult-test” with the parameter “BH” also in R. The GO termswith the adjusted p values < 0.01 were further trimmedby the REVIGO software [53].
RNA-seq analysis of the vlincRNA inducible CRISPR/Cas13knockdown cell linesThe procedures of calculating FPKM for each transcriptannotated in the UCSC Genes database and vlincRNAwere identical to the Illumina RNA-seq data analysis de-scribed above. In order to test whether depletion of a
Cao et al. BMC Biology (2021) 19:108 Page 21 of 24
vlincRNA has an effect on the genes it regulates, the fol-lowing analytical steps were performed:
1) Genes with FPKM > 1 in at least one sample wereselected for downstream analysis.
2) For each gene or vlincRNA in each pair of cell linesexpressing targeting or mis-match control gRNA,we calculated fold changes (FC) at days 3 or 6 ofDox treatment relative to the day 0 as follows: FC-T3 = T3/(T3 + T0), FC-T6 = T6/(T6+ T0), FC-NT3 =NT3/(NT3 + NT0), FC-NT6 = NT6/(NT6 + NT6),where T0, T3, T6, NT0, NT3 and NT6 are FPKMvalues for correspondingly the targeting (T) andmis-match (NT) gRNAs at days 0, 3, and 6.
3) We then calculated relative fold change (RFC) toestimate change relative to the control mis-matchgRNA for each gene or vlincRNAs as follows: RFC-T3 = FC-T3/(FC-T3 + FC-NT3), RFC-T6 = FC-T6/(FC-T6 + FC-NT6), and the average RFC-T3/6 =(RFC-T3 + RFC-T6)/2.
4) For each gRNA, genes were separated into fourgroups based on the Spearman correlation (rho) ofthe co-expression with the targeted vlincRNA asfollows: positively co-expressed genes (rho > 0.35and p value < 0.01), negatively co-expressed genes(rho < −0.35 and p value < 0.01), background nega-tively correlated control genes (rho < 0.35 or p value> 0.01), background positively correlated controlgenes (rho > −0.35 or p value > 0.01). We thenranked the genes based on the Spearman correl-ation with the corresponding vlincRNA and ex-tracted the top 50 and 100 significant positively andnegatively correlated genes.
5) We then calculated the differences of medians andCohen’s d effects between the correspondinggroups of the negatively and positively correlatedgenes. We also used the Wilcoxon rank sum test totest whether the relative fold changes of genesnegatively correlating with each target vlincRNAare larger than those positively correlating.
Supplementary InformationThe online version contains supplementary material available at https://doi.org/10.1186/s12915-021-01044-x.
Additional file 1: Table S1. Drugs used in SMS and Illumina RNAseqanalyses. Table S2. DE mRNAs or vlincRNAs found in each drugtreatment in the SMS RNAseq analysis. Table S3. Summary of thevalidation of the DE vlincRNAs by real-time PCR. Table S4. Numbers ofmRNAs found to be co-expressed with each vlincRNA using either SMSor Illumina RNAseq. Table S5. Analysis of the concordancy of the twobiological replicas (B1 and B2) of the RAT experiments. Table S6. Com-parison of the aggregated RAT signal of different types of genes basedon single-sided Wilcoxson Rank Sum Test. Table S7. The overlap be-tween co-expression and the chromatin interaction datasets for top andbotton half of expressed mRNAs. Table S8. Significance of the overlap
between the co-expression and vlincRNA-chromatin interaction datasetswith increasing RAT signal thresholds. Table S9. Overlap between theco-expression networks obtained after the separation based on the ex-pression level and the chromatin interaction dataset for the SMS RNAseqplatform. Table S10. Relative fold changes of the co-expressed tran-scripts in response to vlincRNA knockdown. Table S11. Genes in com-mon between the co-expression and chromatin interaction datasets foreach vlincRNA tend to be found consistently in drug and DMSO treat-ments. Table S12. The overlap between the co-expression and chroma-tin interaction datasets limited to the genes located on the samechromosomes based on top 50% and bottom 50% expressed mRNAs.Table S13. The top 100 GO terms enriched in the genes either nega-tively (Table S13.1) or positively (Table S13.2) co-expressed with thevlincRNAs. Table S14. Ratios of the normalized counts of each targetinggRNA vs the cognate non-targeting gRNA control in the mixed CRISPR/Cas13 cell lines subjected to various treatments. Table S15. Overlap be-tween the co-expression networks and the chromatin interaction datasetfor the Illumina RNAseq platform. Table S16. Overlap between the co-expression and the chromatin interaction datasets based on merged datafor SMS and Illumina RNAseq platform. Table S17. The effect of vlincRNAknockdown on Illumina-based co-expression networks. Table S18. Coor-dinates of vlincRNAs and sequences of gRNAs used in the RAT and Cas13knockdown cell lines.
Additional file 2: Supplemental Figure S1. UCSC Browser shot forthe vlincRNA ID-1202 (Additional file 1: Supplemental Table S18) used inthe RAT experiments. The vlincRNA (found on the minus strand) is anti-sense to RTP4 gene. K562 promoters are based on the “Chromatin StateSegmentation by HMM from ENCODE/Broad” track. K562 nuclear polyA-RNAseq is based on the “Long RNA-seq from ENCODE/Cold Spring Har-bor Lab” track. K562 nuclear polyA- CAGE is based on “RNA SubcellularCAGE Localization from ENCODE/RIKEN” track. The genomic strand is de-noted as either (+) or (-). The gene RTP4 antisense to the vlincRNA isbased on the UCSC Genes database. Zoom-in view of the boxed regionin the panel (a) is shown in (b).
Additional file 3: Supplemental Figure S2. A flow chart diagram ofcalculating average normalized aggregated RAT score (ANARS) for geneboundaries and upstream or downstream 5 kb flanking regions.
Additional file 4: Supplemental Figure S3. ECDF plots of ANARS inthe boundaries and upstream or downstream 5 kb flanking regions ofpositively and negatively co-expressed genes and background genes foreach indicated vlincRNA-treatment combination.
Additional file 5: Supplemental Figure S4. Distribution of thestatistical significance of enrichment of ANARS in the co-expressed vs thebackground genes (top) and cis only vs all co-expressed genes (bottom)for gene boundaries and upstream or downstream 5 kb flanking regionsamong all indicated vlincRNA-treatment combinations. The p values werecalculated based on the top 30% of the ranked ANARS values in eachtreatment as described in text and Methods.
Additional file 6: Supplemental Figure S5. Boxplots of non-zeroANARS in the cis and all co-expressed genes for gene boundaries andupstream or downstream 5 kb flanking regions and for all indicatedvlincRNA-treatment combinations.
AcknowledgementsWe wish to thank Dr. Jifan Hu for his advice on the RAT assays and a senioranalyst Jilong Gou from Beckman Coulter Commercial Enterprise (China) forhis advice on the flow cytometry. The authors wish to thank Dan Jones andDebra Dederich (SeqLL, LLC) for help with SMS and Chaofan Huang(Huaqiao University) for excellent administrative support.
Authors’ contributionsPK conceived the project, supervised the analytical and the wet lab parts ofproject, and wrote the manuscript. HC performed the bioinformatics analysisand contributed to writing the manuscript. DX and LT performed the CRISPR/Cas13 experiments. Ye C performed the CRISPR/Cas13 experiments andRAT experiments. XH performed the RAT experiments. FG, YQ, DDC, and HWperformed the drug treatment and RNA-seq work for the co-expression ex-periments. Yue C and XY performed the particle sorting experiments. MR,DA, YV, and FW contributed to the bioinformatics analysis. EN performed
Cao et al. BMC Biology (2021) 19:108 Page 22 of 24
pilot experiments and contributed to writing the manuscript. All authors readand approved the final manuscript.
FundingPK is supported by the Natural Science Foundation of Fujian Province, China(Grant No. 2020J02006), the National Science Foundation of China (Grant No.31671382), and the Scientific Research Funds of Huaqiao University. HC issupported by the National Science Foundation of China (Grant No.32000476), Youth Innovation Grant of Xiamen, Fujian Province, China (GrantNo. 3502Z20206015), the Natural Science Foundation of Fujian Province,China (Grant No. 2018J01050), and the Scientific Research Funds of HuaqiaoUniversity (Grant No. 600005-Z17Y0043). DX is supported by the National Sci-ence Foundation of China (Grant No. 32000441) and the Scientific ResearchFunds of Huaqiao University (Grant No. 605-50Y18033). FG and YC are sup-ported by the Postgraduates Innovative Fund in Scientific Research fromHuaqiao University.
Availability of data and materialsNGS data have been deposited to GEO with accession No: GSE173221 [54].
Declarations
Ethics approval and consent to participateNot applicable.
Consent for publicationNot applicable.
Competing interestsThe authors declare that they have no competing interests.
Author details1Institute of Genomics, School of Medicine, Huaqiao University, 668 JimeiRoad, Xiamen 361021, China. 2AcademGene Ltd., 6, Acad. Lavrentjev ave,Novosibirsk 630090, Russia. 3SRC VB “Vector” Rospotrebnadzor, Novosibirsk,Koltsovo 630559, Russia. 4School of Medicine, Xiamen University, Xiang’anSouthern Road, Xiamen 361102, China. 5LBCMCP, Centre de BiologieIntégrative (CBI), Université de Toulouse, CNRS, UPS, Toulouse, France.
Received: 26 October 2020 Accepted: 1 May 2021
References1. Kapranov P, Cawley SE, Drenkow J, Bekiranov S, Strausberg RL, Fodor SP,
et al. Large-scale transcriptional activity in chromosomes 21 and 22. Science.2002;296(5569):916–9. https://doi.org/10.1126/science.1068597.
2. Kapranov P, St Laurent G, Raz T, Ozsolak F, Reynolds CP, Sorensen PH, et al.The majority of total nuclear-encoded non-ribosomal RNA in a human cellis 'dark matter' un-annotated RNA. BMC Biol. 2010;8(1):149. https://doi.org/10.1186/1741-7007-8-149.
3. Djebali S, Davis CA, Merkel A, Dobin A, Lassmann T, Mortazavi A, et al.Landscape of transcription in human cells. Nature. 2012;489(7414):101–8.https://doi.org/10.1038/nature11233.
4. Kung JT, Colognori D, Lee JT. Long noncoding RNAs: past, present, andfuture. Genetics. 2013;193(3):651–69. https://doi.org/10.1534/genetics.112.146704.
5. Mercer TR, Mattick JS. Structure and function of long noncoding RNAs inepigenetic regulation. Nat Struct Mol Biol. 2013;20(3):300–7. https://doi.org/10.1038/nsmb.2480.
6. Bergmann JH, Spector DL. Long non-coding RNAs: modulators of nuclearstructure and function. Curr Opin Cell Biol. 2014;26:10–8. https://doi.org/10.1016/j.ceb.2013.08.005.
7. Clark MB, Choudhary A, Smith MA, Taft RJ, Mattick JS. The dark matter rises:the expanding world of regulatory RNAs. Essays Biochem. 2013;54:1–16.
8. Morris KV, Mattick JS. The rise of regulatory RNA. Nat Rev Genet. 2014;15(6):423–37. https://doi.org/10.1038/nrg3722.
9. St Laurent G, Wahlestedt C, Kapranov P. The landscape of long noncodingRNA classification. Trends Genet. 2015;31(5):239–51. https://doi.org/10.1016/j.tig.2015.03.007.
10. Mattick JS. Challenging the dogma: the hidden layer of non-protein-codingRNAs in complex organisms. Bioessays. 2003;25(10):930–9. https://doi.org/10.1002/bies.10332.
11. Mattick JS. A new paradigm for developmental biology. J Exp Biol. 2007;210(Pt 9):1526–47. https://doi.org/10.1242/jeb.005017.
12. Gao F, Cai Y, Kapranov P, Xu D. Reverse-genetics studies of lncRNAs-whatwe have learnt and paths forward. Genome Biol. 2020;21(1):93. https://doi.org/10.1186/s13059-020-01994-5.
13. Cao H, Wahlestedt C, Kapranov P. Strategies to annotate and characterizelong noncoding RNAs: advantages and pitfalls. Trends Genet. 2018;34(9):704–21. https://doi.org/10.1016/j.tig.2018.06.002.
14. Schlackow M, Nojima T, Gomes T, Dhir A, Carmo-Fonseca M, ProudfootNJ. Distinctive patterns of transcription and RNA processing for humanlincRNAs. Mol Cell. 2017;65(1):25–38. https://doi.org/10.1016/j.molcel.2016.11.029.
15. Kopp F, Mendell JT. Functional classification and experimental dissection oflong noncoding RNAs. Cell. 2018;172(3):393–407. https://doi.org/10.1016/j.cell.2018.01.011.
16. Guttman M, Amit I, Garber M, French C, Lin MF, Feldser D, et al. Chromatinsignature reveals over a thousand highly conserved large non-coding RNAsin mammals. Nature. 2009;458(7235):223–7. https://doi.org/10.1038/nature07672.
17. Ramilowski JA, Yip CW, Agrawal S, Chang JC, Ciani Y, Kulakovskiy IV, et al.Functional annotation of human long noncoding RNAs via molecularphenotyping. Genome Res. 2020;30(7):1060–72. https://doi.org/10.1101/gr.254219.119.
18. St Laurent G, Shtokalo D, Dong B, Tackett M, Fan X, Lazorthes S, et al.VlincRNAs controlled by retroviral elements are a hallmark of pluripotencyand cancer. Genome Biol. 2013;14(7):R73. https://doi.org/10.1186/gb-2013-14-7-r73.
19. Lazorthes S, Vallot C, Briois S, Aguirrebengoa M, Thuret JY, Laurent GS, et al.A vlincRNA participates in senescence maintenance by relieving H2AZ-mediated repression at the INK4 locus. Nat Commun. 2015;6(1):5971.https://doi.org/10.1038/ncomms6971.
20. Heskett MB, Smith LG, Spellman P, Thayer MJ. Reciprocal monoallelicexpression of ASAR lncRNA genes controls replication timing of humanchromosome 6. RNA. 2020;26(6):724–38. https://doi.org/10.1261/rna.073114.119.
21. Caron M, St-Onge P, Drouin S, Richer C, Sontag T, Busche S, et al.Very long intergenic non-coding RNA transcripts and expressionprofiles are associated to specific childhood acute lymphoblasticleukemia subtypes. PLoS One. 2018;13(11):e0207250. https://doi.org/10.1371/journal.pone.0207250.
22. Xu D, Cai Y, Tang L, Han X, Gao F, Cao H, et al. A CRISPR/Cas13-basedapproach demonstrates biological relevance of vlinc class of long non-coding RNAs in anticancer drug response. Sci Rep. 2020;10(1):1794. https://doi.org/10.1038/s41598-020-58104-5.
23. Abudayyeh OO, Gootenberg JS, Essletzbichler P, Han S, Joung J, Belanto JJ,et al. RNA targeting with CRISPR-Cas13. Nature. 2017;550(7675):280–4.https://doi.org/10.1038/nature24049.
24. Harris TD, Buzby PR, Babcock H, Beer E, Bowers J, Braslavsky I, et al. Single-molecule DNA sequencing of a viral genome. Science. 2008;320(5872):106–9. https://doi.org/10.1126/science.1150427.
25. Sam LT, Lipson D, Raz T, Cao X, Thompson J, Milos PM, et al. A comparisonof single molecule and amplification based sequencing of cancertranscriptomes. PLoS One. 2011;6(3):e17305. https://doi.org/10.1371/journal.pone.0017305.
26. Raz T, Kapranov P, Lipson D, Letovsky S, Milos PM, Thompson JF. Protocoldependence of sequencing-based gene expression measurements. PLoSOne. 2011;6(5):e19287. https://doi.org/10.1371/journal.pone.0019287.
27. Derrien T, Johnson R, Bussotti G, Tanzer A, Djebali S, Tilgner H. TheGENCODE v7 catalog of human long noncoding RNAs: analysis of theirgene structure, evolution, and expression. Genome Res. 2012;22(9):1775–89.https://doi.org/10.1101/gr.132159.111.
28. Armour CD, Castle JC, Chen R, Babak T, Loerch P, Jackson S, et al. Digitaltranscriptome profiling using selective hexamer priming for cDNA synthesis.Nat Methods. 2009;6(9):647–9. https://doi.org/10.1038/nmeth.1360.
29. St Laurent G, Vyatkin Y, Antonets D, Ri M, Qi Y, Saik O, et al. Functionalannotation of the vlinc class of non-coding RNAs using systems biologyapproach. Nucleic Acids Res. 2016;44(7):3233–52. https://doi.org/10.1093/nar/gkw162.
Cao et al. BMC Biology (2021) 19:108 Page 23 of 24

30. Sun J, Li W, Sun Y, Yu D, Wen X, Wang H, et al. A novel antisense longnoncoding RNA within the IGF1R gene locus is imprinted in hematopoieticmalignancies. Nucleic Acids Res. 2014;42(15):9588–601. https://doi.org/10.1093/nar/gku549.
31. Chen N, Zhao G, Yan X, Lv Z, Yin H, Zhang S, et al. A novel FLI1 exoniccircular RNA promotes metastasis in breast cancer by coordinatelyregulating TET1 and DNMT1. Genome Biol. 2018;19(1):218. https://doi.org/10.1186/s13059-018-1594-y.
32. Chu C, Chang HY. Understanding RNA-chromatin interactions usingchromatin isolation by RNA purification (ChIRP). Methods Mol Biol. 2016;1480:115–23. https://doi.org/10.1007/978-1-4939-6380-5_10.
33. Vance KW. Mapping long noncoding RNA chromatin occupancy usingcapture hybridization analysis of RNA targets (CHART). Methods Mol Biol.2017;1468:39–50. https://doi.org/10.1007/978-1-4939-4035-6_5.
34. Engreitz J, Lander ES, Guttman M. RNA antisense purification (RAP) formapping RNA interactions with chromatin. Methods Mol Biol. 2015;1262:183–97. https://doi.org/10.1007/978-1-4939-2253-6_11.
35. Li X, Zhou B, Chen L, Gou LT, Li H, Fu XD. GRID-seq reveals the global RNA-chromatin interactome. Nat Biotechnol. 2017;35(10):940–50. https://doi.org/10.1038/nbt.3968.
36. Sridhar B, Rivas-Astroza M, Nguyen TC, Chen W, Yan Z, Cao X, et al.Systematic mapping of RNA-chromatin interactions in vivo. Curr Biol. 2017;27(4):602–9. https://doi.org/10.1016/j.cub.2017.01.011.
37. Razin SV, Mironov AA, Magnitov MD, Ulianov SV, Kantidze OL, LogachevaMaria D, et al. Studying RNA–DNA interactome by red-C identifiesnoncoding RNAs associated with various chromatin types and revealstranscription dynamics. Nucleic Acids Res. 2020;48(12):6699–714.
38. FANTOM, Consortium, and, the, RIKEN, PMI, and, CLST, (DGT). A promoter-level mammalian expression atlas. Nature. 2014;507(7493):462–70. https://doi.org/10.1038/nature13182.
39. St Laurent G, Savva YA, Kapranov P. Dark matter RNA: an intelligent scaffoldfor the dynamic regulation of the nuclear information landscape. FrontGenet. 2012;3:57.
40. Clemson CM, Hutchinson JN, Sara SA, Ensminger AW, Fox AH, Chess A, et al.An architectural role for a nuclear noncoding RNA: NEAT1 RNA is essentialfor the structure of paraspeckles. Mol Cell. 2009;33(6):717–26. https://doi.org/10.1016/j.molcel.2009.01.026.
41. Nakagawa S, Naganuma T, Shioi G, Hirose T. Paraspeckles aresubpopulation-specific nuclear bodies that are not essential in mice. J CellBiol. 2011;193(1):31–9. https://doi.org/10.1083/jcb.201011110.
42. West JA, Davis CP, Sunwoo H, Simon MD, Sadreyev RI, Wang PI, et al. Thelong noncoding RNAs NEAT1 and MALAT1 bind active chromatin sites. MolCell. 2014;55(5):791–802. https://doi.org/10.1016/j.molcel.2014.07.012.
43. Sirbu BM, Cortez D. DNA damage response: three levels of DNA repairregulation. Cold Spring Harb Perspect Biol. 2013;5(8):a012724. https://doi.org/10.1101/cshperspect.a012724.
44. Denoeud F, Kapranov P, Ucla C, Frankish A, Castelo R, Drenkow J, et al.Prominent use of distal 5' transcription start sites and discovery of a largenumber of additional exons in ENCODE regions. Genome Res. 2007;17(6):746–59. https://doi.org/10.1101/gr.5660607.
45. Mercer TR, Gerhardt DJ, Dinger ME, Crawford J, Trapnell C, Jeddeloh JA,et al. Targeted RNA sequencing reveals the deep complexity of the humantranscriptome. Nat Biotechnol. 2012;30(1):99–104. https://doi.org/10.1038/nbt.2024.
46. Giono LE, Nieto Moreno N, Cambindo Botto AE, Dujardin G, Munoz MJ,Kornblihtt AR. The RNA response to DNA damage. J Mol Biol. 2016;428(12):2636–51. https://doi.org/10.1016/j.jmb.2016.03.004.
47. Kent WJ, Sugnet CW, Furey TS, Roskin KM, Pringle TH, Zahler AM, et al. Thehuman genome browser at UCSC. Genome Res. 2002;12(6):996–1006.https://doi.org/10.1101/gr.229102.
48. Quinlan AR, Hall IM. BEDTools: a flexible suite of utilities for comparinggenomic features. Bioinformatics. 2010;26(6):841–2. https://doi.org/10.1093/bioinformatics/btq033.
49. Giladi E, Healy J, Myers G, Hart C, Kapranov P, Lipson D, et al. Error tolerantindexing and alignment of short reads with covering template families. JComput Biol. 2010;17(10):1397–411. https://doi.org/10.1089/cmb.2010.0005.
50. Trapnell C, Pachter L, Salzberg SL. TopHat: discovering splice junctions withRNA-Seq. Bioinformatics. 2009;25(9):1105–11. https://doi.org/10.1093/bioinformatics/btp120.
51. Trapnell C, Williams B, Pertea G, Mortazavi A, Kwan G, van Baren M, et al.Transcript assembly and quantification by RNA-Seq reveals unannotated
transcripts and isoform switching during cell differentiation. Nat Biotechnol.2010;28(5):511–5. https://doi.org/10.1038/nbt.1621.
52. Falcon S, Gentleman R. Using GOstats to test gene lists for GO termassociation. Bioinformatics. 2007;23(2):257–8. https://doi.org/10.1093/bioinformatics/btl567.
53. Supek F, Bosnjak M, Skunca N, Smuc T. REVIGO summarizes and visualizeslong lists of gene ontology terms. PLoS One. 2011;6(7):e21800. https://doi.org/10.1371/journal.pone.0021800.
54. Kapranov P, Cao H. Very long intergenic non-coding (vlinc) RNAs directlyregulate multiple genes in cis and trans. NCBI GEO , https://identifiers.org/geo:GSE173221 (2021).
Publisher’s NoteSpringer Nature remains neutral with regard to jurisdictional claims inpublished maps and institutional affiliations.
Cao et al. BMC Biology (2021) 19:108 Page 24 of 24