Very High Strength Concrete - trb.org
107
SHRP-C-365 Mechanical Behavior of High Performance Concretes, Volume 5 Very High Strength Concrete Paul Zia Shuaib H. Ahmad Michael L. Leming North Carolina State University Raleigh, North Carolina John J. Schemmel Robert P. Elliott University of Arkansas Fayetteville, Arkansas Strategic Highway Research Program National Research Council Washington, DC 1993
Transcript of Very High Strength Concrete - trb.org

SHRP-C-365
Mechanical Behavior of
High Performance Concretes, Volume 5
Very High Strength Concrete
Paul ZiaShuaib H. Ahmad
Michael L. LemingNorth Carolina State University
Raleigh, North Carolina
John J. SchemmelRobert P. Elliott
University of ArkansasFayetteville, Arkansas
Strategic Highway Research ProgramNational Research Council
Washington, DC 1993

SHRP-C--365
ISBN 0-309-05624-1Contract C-205
Product No. 2014, 2023, 2024
Program Manager: Don M. HarriottProject Manager: Inam JawedProduction Editor: Cara J. Tate
Program Area Secretary: Carina S. Hretb
November 1993
key words:admixture
aggregatecompressive strengthconcrete mixture
durabilityfly ashhigh performance concrete
portland cement concreteearly strengthhigh strength
silica fume
Strategic Highway Research ProgramNational Academy of Sciences2101 Constitution Avenue N.W.
Washington, DC 20418
(202) 334-3774
The publication of this report does not necessarily indicate approval or eladorsement of the findings, opinions,conclusions, or recommendations either inferred or specifically expressed herein by the National Academy ofSciences, the United States Government, or the American Association of State Highway and TransportationOfficials or its member states.
© 1993 National Academy of Sciences
I 5M/NAP/1193
Acknowledgments
The research described herein was supported by the Strategic Highway Research Program(SHRP). SHRP is a unit of the National Research Council authorized by section 128 of theSurface Transportation and Uniform Relocation Assistance Act of 1987.
The research was conducted by a consortium among researchers at North Carolina State
University (prime contractor), the University of Arkansas, and the University of Michigan. Theteam included Paul Zia, Shuaib t t. Ahmad, and Michael L. Leming at North Carolina StateUniversity; John J. Schemmel and Robert P. Elliott at the University of Arkansas; and A. E.Naaman at the University of Michigan.
The late Robert E. Philleo served as a project consultant during the initial stage of the project.He helped in defining the criteria for high performance concrete and in setting the direction ofthe research. The research team benefited greatly from his many stimulating discussions andguidance.
The research team also received valuable support, counsel, and guidance from the Expert TaskGroup. The support and encouragement provided by Inam Jawed, SHRP program manager, aredeeply appreciated.
Special recognition is given to New York Department of Transportation, North CarolinaDepartment of Transportation, Illinois Department of Transportation, Arkansas State Highwayand Transportation Department, and Nebraska Department of Roads. The cooperation andassistance given by the staffs of these five state transportation agencies were critical to the fieldinstallations of pavements to demonstrate the use of high performance concrete.
A group of materials producers and suppliers donated the materials used for the laboratorystudies of high performance concrete. These industrial partners included Blue Circle Cement,Inc.; Pyrament/Lone Star Industries, Inc.; Martin Marietta Company; Memphis Stone and GravelCo.; McClinton-Anchor; Arkhola Sand and Gravel; Monex Resources, Inc.; Fly Ash Products;Elkem Chemicals; Cormix; Dow Chemical; and W. R. Grace. Their generous support of thisresearch program is deeply appreciated.
The authors of this report would also like to acknowledge the contributions of manycollaborators who participated in the various phases of this research program. They includeformer and present graduate research assistants William K. Chi, Wayne L. Ellenberger, M. R.
iii

Hansen, Aykut Cetin, Kristina M. Hanes, Johnny D. Waycaster, Randy Maccaferri, and DenaFirebaugh and former undergraduate laboratory assistants Randall A. Boy& Joseph B. Taylor,Wesley N. Denton, and Harold D. Ingram at North Carolina State University. The collaboratorsat the University of Arkansas include former and present graduatc research assistants James R.Powell, Vikas Arora, and Mike Callahan and fi)mler undergradua'-e laboratory assistant Memory
Rodgers.
Opinions expressed in this report reflect the views of the authors, who should be heldaccountable for any errors and omissions.
iv
Contents
Acknowledgments ........................................................................................................................ iii
List of Figures .............................................................................................................................. vii
List of Tables ................................................................................................................................ ix
Preface ........................................................................................................................................... xi
Abstract ........................................................................................................................................... 1
Executive Summary ....................................................................................................................... 3
1 Introduction ........................................................................................................................ 7
1.1 Definition of Very High Strength Concrete 81.2 Potential Applications of VHS concrete 9
2 Objective and Scope ......................................................................................................... 11
3 Characterizations of Constituent Materials .................................................................. 13
3.1 Cements 133.2 Coarse Aggregates 133.3 Fine Aggregates 153.4 Chemical Admixtures 163.5 Mineral Admixtures 17
4 Mixture Proportions ........................................................................................................ 19

5 Mixing and Curing Procedures ....................................................................................... 21
5.1 Mixing Procedures 215.2 Curing Procedures 22
6 Laboratory Experiments .................................................................................................. 23
6.1 Compression Tests 236.2 Tension Tests 376.3 Freezing-Thawing Tests 476.4 Shrinkage Tests 596.5 Creep Tests 626.6 Rapid Chloride Permeability Tests 646.7 AC Impedance Tests 666.8 Concrete-to-Steel Bond Tests 70
7 Conclusions ....................................................................................................................... 75
References ..................................................................................................................................... 79
Appendix ....................................................................................................................................... 81
vi

List of Figures
Figure 6.1 Stress-strain relationship of VHS (F) concrete at design age of 28 days ............ 28Figure 6.2 Stress-strain relationship ofVHS (S) concrete at design age of 28 days ............ 28Figure 6.3a Effect of age on stress-strain curve for VHS (F) concrete with RG ................... 30Figure 6.3b Effect of age on stress-strain curve for VHS (S) concrete with RG ................... 30Figure 6.4a Variation of compressive strength with time for VHS (F) concrete ................... 33Figure 6.4b Variation of compressive strength with time for VHS (S) concrete ................... 33Figure 6.5a Variation of modulus of elasticity with time for VHS (F) concrete ................... 34Figure 6.5b Variation of modulus of elasticity with time for VHS (S) concrete ................... 34Figure 6.6a Comparison of observed versus predicted modulus of elasticity
of VHS concrete considering all test ages .......................................................... 36Figure 6.6b Average size effect of VHS (S) concrete at design age ................................... 36Figure 6.7 Comparison of observed versus predicted split cylinder strength
of VHS concrete at design age ............................................................................ 42Figure 6.8 Comparison of oberved versus predicted modulus of rupture of
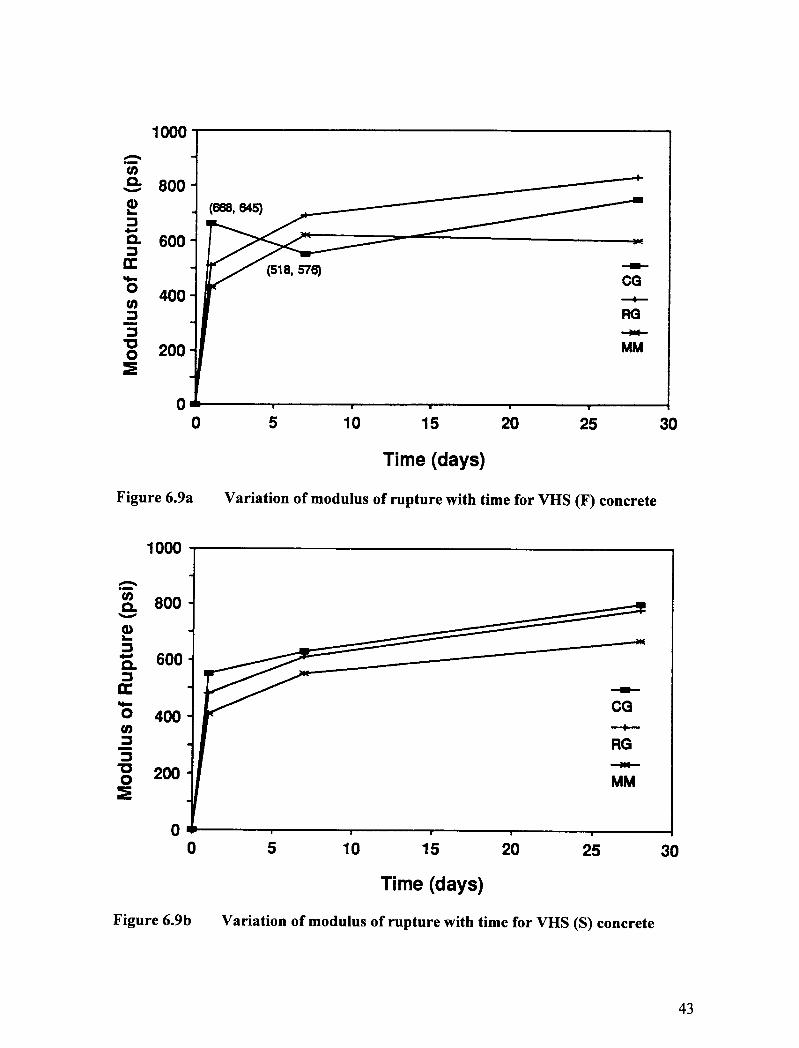
VttS concrete at design age ................................................................................ 42Figure 6.9a Variation of modulus of rupture with time for VHS (F) concrete ...................... 43Figure 6.9b Variation of modulus of rupture with time for VHS (S) concrete ...................... 43Figure 6.10a Load versus midspan deflection of VHS (F) concrete
at design age of 28 days ...................................................................................... 44Figure 6.10b Load versus midspan deflection ofVHS (S) concrete
at design age of 28 days ...................................................................................... 44Figure 6.1 la Load versus midspan deflection ofVttS (F) concrete with MM ........................ 45Figure 6.1 lb Load versus midspan deflection ofVHS (S) concrete with MM ....................... 45Figure 6.12a Load versus tensile strain ofVHS (F) concrete at design age of 28 days ........... 46Figure 6.12b Load versus tensile strain ofVHS (S) concrete at design age of 28 days ........... 46Figure 6.13a Load versus tensile strain ofVHS (F) concrete with MM .................................. 48Figure 6.13b Load versus tensile strain of VHS (S) concrete with MM .................................. 48Figure 6.14 Relative dynamic modulus versus number of freezing-thawing cycles
for C/VH(F)/3 ..................................................................................................... 55Figure 6.15 Relative dynamic modulus versus number of freezing-thawing cycles
for C/VH(S)/3 ..................................................................................................... 56Figure 6.16 Relative dynamic modulus versus number of freezing-thawing cycles
for RfVH(S)/3 ..................................................................................................... 57Figure 6.17 Relative dynamic modulus versus number of freezing-thawing cycles
for M/VH(S)/3 .................................................................................................... 58
vii

Figure 6.18 Variation of shrinkage strain with time for VHS Concretes ............................... 61Figure 6.19a Variation of creep strain with time for VHS (F) concrete ................................... 63Figure 6.19b Variation of creep strain with time for VHS (S) concrete ................................... 63Figure 6.20 Comparisons of results from AC impedance test and RCPT. ............................. 71Figure 6.21a Stress versus net slip for VHS (F) concrete in C-S bond test ............................. 73Figure 6.21b Stress versus net slip for VHS (S) concrete in C-S bond test ............................. 73
viii

List of Tables
Table 2.1 Types of coarse and fine aggregates ...................................................................... 11
Table 3.1 Results of physical and chemical analyses of Type I cementscompared with ASTM C 150 ................................................................................. 14
Table 3.2 Properties of coarse aggregates .............................................................................. 15Table 3.3 Properties of fine aggregates .................................................................................. 16Table 3.4 Chemical admixtures used in the test program ...................................................... 16Table 3.5 Results of physical and chemical analyses of fly ash ............................................ 17
Table 4.1 Mixture proportions of VHS (F) concrete .............................................................. 20Table 4.2 Mixture proportions ofVHS (S) concrete .............................................................. 20
Table 6.1 Test program for compressive strength and modulus of elasticity -- Group 1 .....24Table 6.2 Test program for modulus of rupture, tensile strain capacity,
and split tensile strength -- Group 2 ..................................................................... 24Table 6.3 Test program for frost durability, shrinkage, creep,
and chloride permeability -- Group 3 ................................................................... 25Table 6.4 Test program for bond strength -- Group 5 .......................................................... 25Table 6.5a Summary of test results for compressive strength and modulus
of elasticity at different test ages for VHS (F) concrete ......................................... 31Table 6.5b Summary of test results for compressive strength and modulus
of elasticity at different test ages for VHS (S) concrete ......................................... 32"Fable 6.6 Summary of test results for 4 x 8-in. and 6 x 12-in.
cylinder strengths for VHS (S) concrete ................................................................ 35Table 6.7a Summary of test results for modulus of rupture, tensile strain capacity,
and split cylinder tensile strength for VHS (F) concrete ........................................ 39Table 6.7b Summary of test results for modulus of rupture, tensile strain capacity,
and split cylinder tensile strength for VHS (S) concrete ........................................ 40Table 6.8a Mixture proportions, strength, and plastic properties of VHS (F) concrete
used for freezing-thawing test specimens .............................................................. 51Table 6.8b Mixture proportions, strength, and plastic properties ofVHS (S) concrete
used for freezing-thawing test specimens .............................................................. 52Table 6.9 Results of freezing-thawing test of VHS concrete ................................................. 54Table 6.10 Summary of shrinkage test results for VHS (F) and VHS(S) concretes ................ 60Table 6.11 Results of rapid chloride permeability test (RCPT) of VHS concrete ................... 67
ix

Table 6.12 Results of AC impedance test of VHS concrete .................................................... 69Table 6.13 Summary of test results of concrete-to-steel bond tests
for VHS (F) and VHS (S) concretes ...................................................................... 72
X
Preface
The Strategic Highway Research Program (SHRP) is a 5-year, nationally coordinated researcheffort initiated in 1987 at a cost of $150 million. This highly focused and mission oriented
program originated from a thorough and probing study* to address the serious problems ofdeterioration of the nation's highway and bridge infrastructure. The study documented the needfor a concerted research effort to produce major innovations for increasing the productivity and
safety of the nation's highway system. Further, it recommended that the research effort befocused on six critical areas in which the nation spends most of the $50 billion used for roads
annually and thus technical innovations could lead to substantial payoffs. The six criticalresearch areas were as follows:
• Asphalt Characteristics• Long-Term Pavement Performance• Maintenance Cost-Effectiveness
• Concrete Bridge Component Protection• Cement and Concrete• Snow and Ice Control
When SHRP was initiated, the two research areas of Concrete Bridge Component Protection andCement and Concrete were combined under a single program directorate of Concrete andStructures. Likewise, the two research areas of Maintenance Cost-Effectiveness and Snow andIce Control were also combined under another program directorate of Highway Operations.
* America's Highways: Accelerating the Search for Innovation. 1984. Special Report 202, Transportation ResearchBoard, National Research Council, Washington, D. C.
xi
Abstract
This report documents laboratory investigations of the mechanical behavior of high performanceconcrete for highway applications. High performance concrete is defined as concrete with muchhigher early strength and greatly enhanced durability against freezing and thawing comparedwith conventional concrete. Very high strength (VHS) concrete is one of the three categories ofhigh perfornlance concrete investigated in this program. The objective is to obtain informationon the mechanical behavior of VHS concrete.
The laboratory investigation consisted of tests for both fresh or plastic concrete and hardenedconcrete. The plastic concrete tests included slump, air content, etc.; the results of these tests arepresented in volume 2 of this report series, Production of High Performance Concrete. Thehardened concrete tests include compression tests for strength amd modulus of elasticity, tensiontests for tensile strength and flexural modulus, freezing-thawing tests for durability factor,shrinkage tests, creep tests, rapid chloride permeability tests, tests for AC impedance, and testsfor bond between concrete and steel reinforcement.

Executive Summary
This report documents laboratory investigations of the mechanical behavior of high performanceconcrete for highway applications. High performance concrete (HPC) is defined as concrete withmuch higher early strength and greatly enhanced durability against freezing and thawingcompared with conventional concrete. Very high strength (VHS) concrete is one of the three
categories of high performance concrete investigated in this progrmn. The objective is to obtaininformation on the mechanical behavior of VHS concrete.
For the purpose of this program, HPC is defined in terms of certain target strength and durabilityrequirements as shown below:
Category of High Minimum Maximum Water/ Minimum Frost
Performance Concrete Compressive Strength Cement Ratio Durability Factor
Very early strength (VES)
Option A 2,000 psi (14 MPa) 0.40 80%(with Type III cement) in 6 hours
Option B 2,500 psi (l 7.5 MPa) 0.29 80%(with Pyrament PBC-XT cement) in 4 hours
High early strength (HES) 5,000 psi (35 MPa) 0.35 80%(with Type III cement) in 24 hours
Very high strength (VHS) 10,000 psi (70 MPa) 0.35 80%(with Type I cement) in 28 days
In the above definition, the target minimum strength should be achieved in the specified timeafter water is added to the concrete mixture. The compressive strength is determined from 4 x 8-in. (100 x 200-mm) cylinders tested with neoprene caps. The water/cement ratio (W/C) is basedon all cementitious materials. The minimum durability factor of 80% should be achieved after300 cycles of freezing and thawing according to ASTM C 666, procedure A. This is in contrastto a durability factor of 60% for conventional concrete.
3
So that the research results would be applicable to different geographical regions, four differenttypes of coarse aggregate were selected for producing VHS concrete. They included crushedgranite and marine marl from North Carolina, dense crushed limestone from Arkansas, andwashed rounded gravel from Tennessee. These aggregates were used with local sand from thethree states. The characteristics of all constituent materials used Ibr producing VHS concrete are
described in detail in terms of their physical, chemical, and mineral properties. The normallaboratory mixing and batching procedures (ASTM C 192) were raodified slightly to representtypical concrete dry-batch plant operations more closely.
The laboratory investigation consisted of tests tbr both fresh or plastic concrete and hardenedconcrete. The plastic concrete tests included slump, air content, e:c.; the results of these tests arepresented in volume 2 of this report series, Production of High Performance Concrete. Thehardened concrete tests included compression tests for strength anld modulus of elasticity,tension tests for tensile strength and flexural modulus, freezing-thawing tests for durabilityfactor, shrinkage tests, creep tests, rapid chloride permeability tesls, AC impedance tests, andtests for bond between concrete and steel reinforcement.
Based on the experience of the laboratory investigations, the following conclusions were drawn:
1. Using conventional materials and equipment, but with more care than needed forconventional concrete, VHS concrete with either fly ash or silica fume as the mineraladmixture can be produced that will achieve a minimu:_n compressive strength of10,000 psi (70 MPa) in 28 days. Such concretes can be produced with either crushedgranite or dense crushed limestone as coarse aggregate. However, with weakeraggregates such as marine marl and washed rounded gravel, the compressive strengthwould be slightly lower for comparable mixture proportions.
2. Because the demand for early strength gain is not critical for VHS concrete, it is notnecessary to use insulation for curing under normal conditions.
3. Because of a larger amount of Type I cement plus fly ash or silica fume used in theVHS concrete mixtures along with a relatively low W/C, the strength development ofthe concretes is much more rapid in the first 7 days than predicted by the currentrecommendation of ACI Committee 209 (1993a) based on conventional concrete.The subsequent rate of strcngth growth is greatly reduced and is comparable to thatpredicted by the ACI method.
4. The modulus of elasticity increases with time in the same manner as the compressivestrength. The same is true of the flexural modulus.
5. Because the design strength of VHS concrete is not too much higher than the upperranges of the conventional concrete, the mechanical behavior of VHS concrete, suchas the modulus of elasticity and the compressive and tensile strain capacities, issimilar to that of conventional concrete. The modulus of elasticity, the flexural
4

modulus, and the splitting tensile strength can still be predicted reasonably well bythe ACI Code equations (1993c).
6. As VHS concrete ages in time, its stress-strain relationship becomes more linear.
7. VHS concrete with silica fume [VHS (S)] appeared to be slightly stiffer than VHSconcrete with fly ash [VHS (F)] as measured by the modulus of elasticity. Themodulus of elasticity is lower for concrete with softer aggregates such as marine marl.
8. The observed compressive strain capacity ranged from 1,000 to 2,500 microstrains.The VHS (F) concrete exhibited slightly higher compressive strain capacity than theVHS (S) concrete. The tensile strain capacity varied from 120 to 180 microstrains.The VHS (F) concrete exhibited lower tensile strain capacity than the VHS (S)concrete. These strain capacities are comparable to those of conventional concrete.
9. Even with a very low W/C, VHS concrete should have an adequate amount of airentrainment to enhance its freezing-thawing resistance. The results of thisinvestigation indicate that VHS concrete will meet the stringent requirement of adurability factor of 80% (in contrast to 60% commonly expected of qualityconventional concrete) after 300 cycles of freezing and thawing according to ASTMC 666, procedure A, if the concrete contains at least 5% entrained air.
10. VHS concrete produced with washed rounded gravel from Memphis, Tennesseefailed the freezing-thawing test according to ASTM C 666-90, procedure A, becauseof the deterioration of the aggregate, even though the concrete contained 8% entrainedair. The aggregate had an absorption of about 5% and pore size of about 0.10 microns(as observed from scanning electron micrographs), the worst possible condition forfreezing-thawing deterioration (Hansen 1993).
11. Shrinkage of VHS concrete follows the general trend of conventional concrete. Theaverage shrinkage strain of VHS (F) concrete with crushed granite aggregate was 521microstrains at 90 days, which is about 70% of the ultimate shrinkage strainrecommended by ACI Committee 209 for the conventional concrete. On the otherhand, the average 90-day shrinkage strains of VHS (S) concrete varied from -72microstrains for concrete with washed rounded gravel aggregate to 361 microstrainsfor concrete with crushed granite aggregate, which indicates that VHS (S) concretehas even less shrinkage potential than VHS (F) concrete.
12. The observed creep strains of the different groups of VHS concrete ranged from 20%to 50% of that of conventional concrete. The creep strains were especially low forconcretes with a 28-day strength in excess of 10,000 psi (70 MPa). The specific creepof the concrete with marine marl was much higher than that of the concrete witheither crushed granite or washed rounded gravel.

13. With very low W/C and using silica fume or fly ash as mineral additive, VHSconcrete after 14 days of moist curi_agexhibited fairly low chloride permeabilitybased on the rapid chloride permeability test (RCPT).
14. The initial current (in amperes) flowing through the concrete specimen in the RCPTcorrelates consistently with the total charge measured !n 6 hours. Therefore the initialcurrent, which is an indirect measure of the concrete conductance, can be used as analternate measurement for the RCPT. The total testing; time can thus be shortened by6 hours.
15. The AC impedance test measures the total resistance (in ohms) of a concretespecimen. This test method is simpler and faster than the RCPT and has the potentialto be used as a substitute for the RCPT. The best correlation between the two test
methods is to express the inverse impedance (reciprocal of impedance) in terms of theinitial current measured in the RCPT.
16. A "beam" type concrete-to-steel bond test showed thw: by using the ACI 318requirement for development length (1993c), sufficiertt bond strength was developedby VHS concrete that the steel reinforcement yielded before any significant bond slipoccurred.
6

1
Introduction
SHRP's research on mechanical behavior of high performance concretes had three generalobjectives:
1. To obtain needed information to fill gaps in the present knowledge;2. To develop new, significantly improved engineering criteria for the mechanical
properties and behavior of high performance concretes; and3. To provide recommendations and guidelines for using these concretes in highway
applications according to the intended use, required properties, environment, andservice.
Both plain and fiber-reinforced concretes were included in the study. The research findings arepresented in a series of six project reports:
Volume 1 Summary Report
Volume 2 Production of High Performance Concrete
Volume 3 Very Early Strength (VES) Concrete
Volume 4 High Early Strength (HES) Concrete
Volume 5 Very High Strength (VHS) Concrete
Volume 6 High Early Strength Fiber-Reinforced Concrete (HESFRC)
This volume is the fifth of these reports. The readers will notice a certain uniformity in formatand similarity in many general statements in these reports. This feature is adopted intentionallyso that each volume of the reports can be read independently without the need to cross referenceto other reports in the series.
7
1.1 Definition of Very High Strength Concrete
Very high strength (VHS) concrete is one of the three categories of high perfornlance concrete(HPC) investigated in this research program. [n volume 2 of this report series, Production ofHigh Performance Concrete, the strength and durability criteria were defined for each of thethree categories of HPC.
For VHS concrete, a minimum compressive slrength of 10,000 p_i (69 MPa) is required in 28days with a maximum water/cement ratio (W/C) of 0.35. It must also achieve a mininmmdurability factor of 80% at 300 cycles of freezing and thawing according to ASTM C 666,procedure A. These criteria were adopted after several importanl factors pertinent to theconstruction and design of highway pavements and structures were considered. The rationale forthe selection of the various limits is as follow,_.
The choice of a time requirement of 28 days for VHS concrete is based on conventionalconstruction practice, in which time would not be a critical facto::. It is considered unnecessaryto extend this time requirement to a longer period, such as 56 days, as in many previousconstruction projects using moderately high strength concrete (Zia et al. 1991).
The use of 10,000 psi (69 MPa) as the strength criterion for VHS concrete is based in part on theresults of previous research (Jobse and Moustafa 1984, Zia et al. 1989), which indicates thatconcrete strength of 8,000 to 10,000 psi (55.2 to 69 MPa) is opti:nal for the current AASttTOstandard bridge girders, and in part on cost considerations indicating that concrete cost increasessubstantially when its strength level exceeds 10,000 psi (69 MPa).
The W/C specified is relatively low. For VHS concrete, a low W/C is needed to meet the highstrength requirement. With low W/C, concrete durability may be improved in all exposureconditions. Since HPC is intended for highway applications where exposure to frost must beexpected, it must be frost resistant.
The choice of an appropriate measure for frost durability is debatable and subjective. It isrecognized that ASTM C 666, procedure A, which involves freezing and thawing in water, is asevere test. Therefore a durability criterion should not be undul'¢ conservative. On the otherhand, if HPC is to provide enhanced durability, it can be argued that higher standards arerequired. Since frost durability of concrete as measured by ASTM C 666, procedure A, is highlydependent on the air void system, and since freezing low-permeability concrete at the very highrate as required in the test procedure tends to discriminate against concrete of low W/C, theselected durability factor of 80% at 300 cycles of freezing and thawing is considered appropriate.This is in contrast to a durability factor of 60% commonly expe_ztedof quality conventionalconcrete according to ASTM C 666.
8
1.2 Potential Applications of VHS Concrete
VHS concrete is useful primarily for structural members for which construction time is not acritical factor. Little, if any, direct application of HVS concrete to pavement is anticipated.However, if including a mineral admixture such as silica fume or fly ash would improve abrasionresistance or prevent deleterious alkali-silica reactivity, VHS concrete might be chosen forapplication in a pavement or bridge deck. In addition, VHS concrete provides considerablestructural advantages and economy when used in bridge girders, precast elements, prestressedpiles, columns, and piers.
9

2
Objective and Scope
The objective of this investigation was to develop and analyze basic data on the mechanicalproperties of very high strength (VHS) concrete for highway applications. The concrete was
produced using only conventional constituent materials and normal production and curingprocedures. The laboratory experiments included eight different types of tests: compression,tension (both flexure and splitting), freezing-thawing, shrinkage, creep, rapid chloridepermeability, AC impedance, and concrete-to-steel bond.
VHS concrete was produced in the laboratory with four different types of coarse aggregate andthree kinds of sand, as summarized in Table 2.1.
Table 2.1 Types of coarse and fine aggregates
Type Symbol Source
Marine Marl MM Castle Hayne, North CarolinaCrushed Granite CG Garner, North CarolinaDense Crushed Limestone DL West Fork, ArkansasWashed Rounded Gravel RG Memphis, TennesseeSand Lillington, North CarolinaSand Memphis, TennesseeSand Van Buren, Arkansas
The studies using crushed granite, marine marl, and washed rounded gravel were conducted atNorth Carolina State University (NCSU); the studies using dense crushed limestone wereconducted at the University of Arkansas. Lillington sand was used for the concretes made withcrushed granite or marine marl, but Memphis sand was used for the concrete made with washedrounded gravel. Van Buren sand from the Arkansas River was used for the concrete made withdense crushed limestone.
11
3
Characterizations of Constituent Materials
3.1 Cements
Type I cement was used for the production of very high strength (VHS) concrete. The cementused at North Carolina State University (NCSU) was of low alkali content and met therequirements ofASTM C 150 specifications. It was supplied by Blue Circle Cement, Inc., fromits plant in Harleyville, South Carolina. The cement used at Arkansas was supplied by the samemanufacturer from its plant in Tulsa, Oklahoma.
The results of physical and chemical analyses of the cements are summarized in Table 3.1 alongwith the requirements of relevant ASTM specifications for comparison.
3.2 Coarse Aggregates
Four different types of coarse aggregates were used in this investigation. They were chosen asrepresentative aggregates from a wide geographical area. Crushed granite (CG) is a strong,durable aggregate locally available in North Carolina; it was supplied by Martin Marietta Co.from its quarry in Garner. Marine marl (MM) is a weaker and more absorptive aggregateavailable in the coastal area of North Carolina; it was also supplied by Martin Marietta Co. fromits quarry in Castle Hayne. Washed rounded gravel (RG) was provided by Memphis Stone andGravel Co. from its Pit 558 in Shelby County, Tennessee. Dense crushed limestone (DL) wassupplied by McClinton-Anchor from its West Fork quarry just outside Fayetteville, Arkansas.
The coarse aggregates used at NCSU met ASTM C 33 size #57 specifications, with most of thematerial passing the 1-in. (25-ram) sieve. The CG was a hard, angular aggregate of lowabsorption (0.6%). The MM was a cubical to subangular, relatively porous, and highlyabsorptive (typically more than 4.5%) shell limestone. The RG, drawn from a river, wasprimarily silicious and contained some crushed faces, but most of them were worn. Theabsorption was moderate (just under 3%), and hard chert particles were present. The maximumsize of the DL used at Arkansas was slightly smaller and met ASTM C 33 size #67specifications.
13
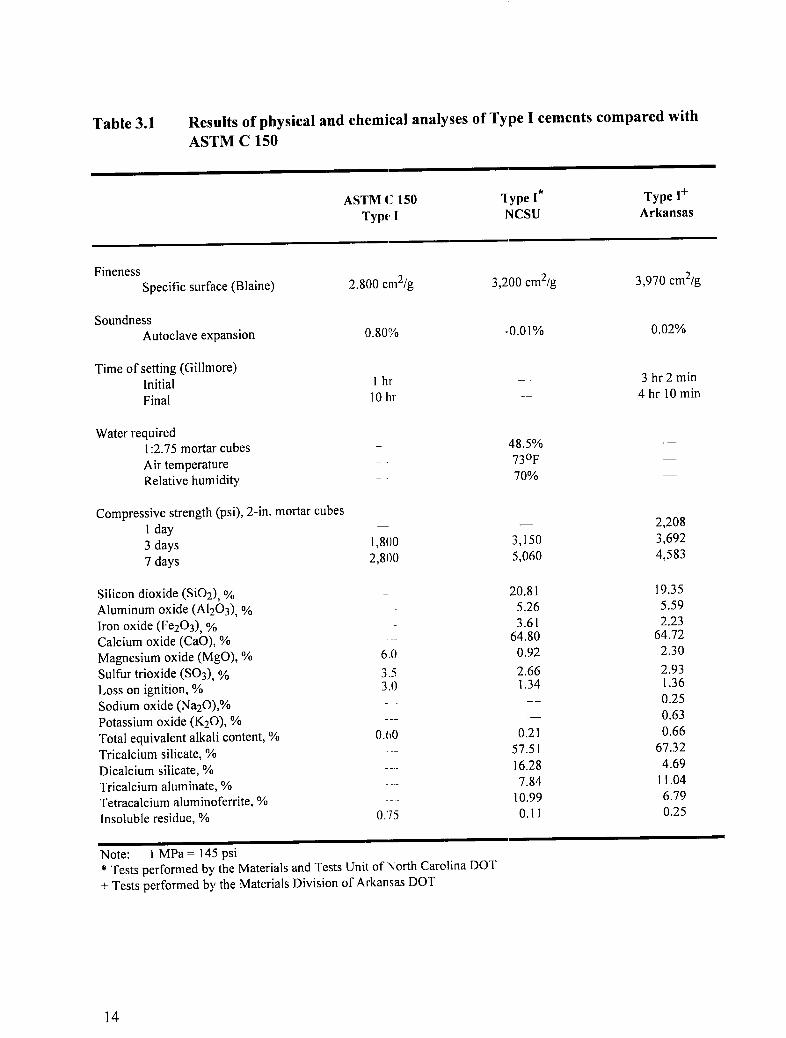
Table 3.1 Results of physical and chemical analyses of Type I cements compared withASTM C 150
ASTM C 150 _[ype l* Type I+Type ! NCSU Arkansas
Fineness
Specific surface (Blaine) 2,800 cm2/g 3,200 cm2/g 3,970 cm2/g
Soundness
Autoclave expansion 0.80% -0.01% 0.02%
Time of setting (Gillmore)Initial 1 hr - • 3 hr 2 minFinal 10 hr -- 4 hr I0 rain
Water required1:2.75 mortar cubes - 48.5% . -
Air temperature - - 73°F --Relative humidity - - 70% --
Compressive strength (psi), 2-in. mortar cubesI day -- -- 2,208
3 days 1,800 3,150 3,6927 days 2,81)0 5,060 4,583
Silicon dioxide (SiO2), % 20.81 19.35Aluminum oxide (AI203) ' % 5.26 5.59Iron oxide (Fe203) ' % 3.61 2.23Calcium oxide (CaO), % --- 64.80 64.72Magnesium oxide (MgO), % 6.0 0.92 2.30
Sulfur trioxide (SO3), % 3.5 2.66 2.93Loss on ignition, % 3.0 1.34 1.36Sodium oxide (Na20),% .... 0.25Potassium oxide (K20), % ..... 0.63
Total equivalent alkali content, % 0.60 0.21 0.66Tricalcium silicate, % --- 57.51 67.32Dicalcium silicate, % .... 16.28 4.69Tricalcium aluminate, % .... 7.84 11.04Tetracalcium aluminoferrite, % .... 10.99 6.79Insoluble residue, % 0.'75 0.11 0.25
Note: 1 MPa-- 145 psi• Tests performed by the Materials and Tests Unit of North Carolina DOT+ Tests performed by the Materials Division of Arkansas DOT
14
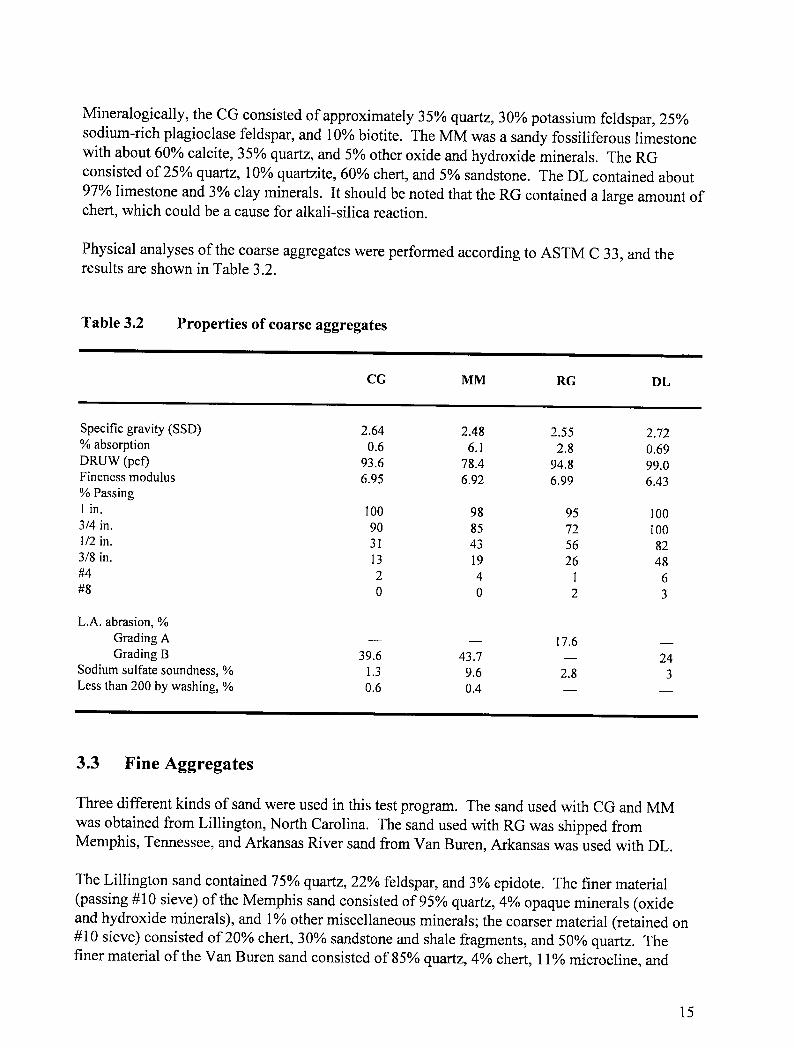
Mineralogically, the CG consisted of approximately 35% quartz, 30% potassium feldspar, 25%sodium-rich plagioclase feldspar, and 10% biotite. The MM was a sandy fossiliferous limestonewith about 60% calcite, 35% quartz, and 5% other oxide and hydroxide minerals. The RGconsisted of 25% quartz, 10% quartzite, 60% chert, and 5% sandstone. The DL contained about97% limestone and 3% clay minerals. It should be noted that the RG contained a large amount ofchert, which could be a cause for alkali-silica reaction.
Physical analyses of the coarse aggregates were performed according to ASTM C 33, and theresults are shown in Table 3.2.
Table 3.2 Properties of coarse aggregates
CG MM RG DL
Specific gravity (SSD) 2.64 2.48 2.55 2.72% absorption 0.6 6. l 2.8 0.69DRUW (pcf) 93.6 78.4 94.8 99.0Fineness modulus 6.95 6.92 6.99 6.43
% Passing1 in. 100 98 95 I00
3/4 in. 90 85 72 1001/2 in. 31 43 56 823/8 in. 13 19 26 48#4 2 4 I 6#8 0 0 2 3
L.A. abrasion, %Grading A -- -- 17.6 --Grading B 39.6 43.7 -- 24
Sodium sulfate soundness, % 1.3 9.6 2.8 3Less than 200 by washing, % 0.6 0.4 -- --
3.3 Fine Aggregates
Three different kinds of sand were used in this test program. The sand used with CG and MMwas obtained from Lillington, North Carolina. The sand used with RG was shipped fromMemphis, Tennessee, and Arkansas River sand from Van Buren, Arkansas was used with DL.
The Lillington sand contained 75% quartz, 22% feldspar, and 3% epidote. The finer material(passing #10 sieve) of the Memphis sand consisted of 95% quartz, 4% opaque minerals (oxideand hydroxide minerals), and 1% other miscellaneous minerals; the coarser material (retained on#10 sieve) consisted of 20% chert, 30% sandstone and shale fragments, and 50% quartz. Thefiner material of the Van Buren sand consisted of 85% quartz, 4% chert, 11% microcline, and
15
less than 1% rock fragments and heavy minerals; the coarser material consisted of 62% quartz,
16% chert, 1 I% microcline, and 5% rock fragments. The characteristics of the three kinds of
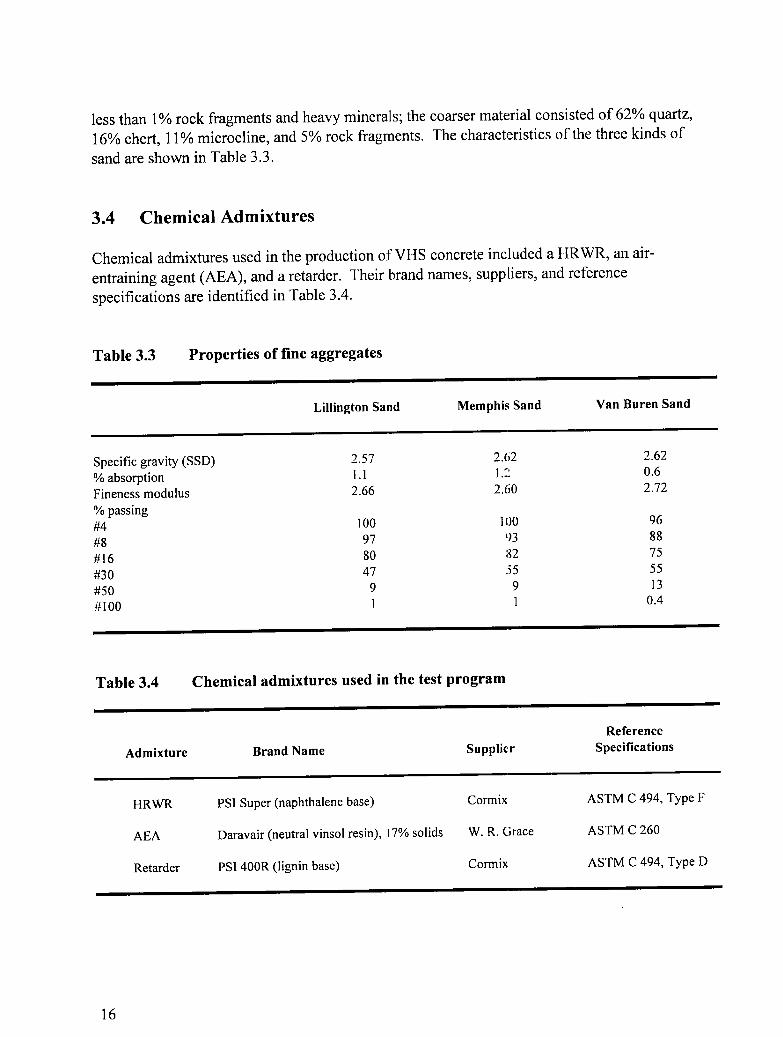
sand are shown in Table 3.3.
3.4 Chemical Admixtures
Chemical admixtures used in the production o:f VHS concrete included a HRWR, an air-
entraining agent (AEA), and a retarder. Their brand names, suppliers, and reference
specifications are identified in Table 3.4.
Table 3.3 Properties of fine aggregates
Lillington Sand Memphis Sand Van Buren Sand
Specific gravity (SSD) 2.57 2.62 2.62% absorption I. 1 1.2 0.6Fineness modulus 2.66 2.60 2.72
% passing#4 100 100 96#8 97 93 88# 16 80 '32 75#30 47 :55 55#50 9 9 13#100 1 1 0.4
Table 3.4 Chemical admixtures used in the test program
Reference
Admixture Brand Name Supplier Specifications
HRWR PSI Super (naphthalene base) Cormix ASTM C 494, Type F
AEA Daravair (neutral vinsol resin), 17% solids W.R. (;race ASTM C 260
Retarder PSI 400R (lignin base) Cormix ASTM C 494, Type D
16

3.5 Mineral Admixtures
Mineral admixtures used for VHS concrete included fly ash (classes F and C) and silica fume.The class F fly ash used for the tests in North Carolina was supplied by Monex Resources, Inc.,from its plant at Belews Creek, North Carolina. The class C fly ash used for the tests in Arkansaswas supplied by Fly Ash Products in Pine Bluff, Arkansas. Class F fly ash typically containsmuch less calcium than class C fly ash. Therefore, although both are pozzolanic, class C fly ashusually has cementitious properties. The results of physical and chemical analyses of the fly ashare given in Table 3.5 along with the requirements of ASTM C 618 for comparison.
The silica fume used for the tests in North Carolina was EMSAC, Type F-100, supplied byElkem Chemicals, Pittsburgh, Pennsylvania (now a subsidiary of Cormix). It was in slurry form,containing approximately 50% solids. In contrast, the silica fume for the tests in Arkansas was inpowder form supplied by Cormix.
Table 3.5 Results of physical and chemical analyses of fly ash
ASTM C 618 Class F* ASTM C 618 Class C+Class F NCSU Class C Arkansas
Fineness: Retained on no. 325 sieve, % 34 26.5 34 12.06
Soundness: Autoclave expansion, % 0.8 -- 0.8 --Specific gravity -- 2.20 -- 2.58
Silicon dioxide plus iron and aluminum oxides, % 70 96.0 50 63.3Calcium oxide, % -- -- -- 29.70Magnesium oxide, % -- -- -- 5.1Sulfur trioxide, % 5 0.5 5 1.9Moisture content, % 3 0.4 3 0.05
Loss on ignition, % 6 1.1 6 0.1
* Analyses performed by the Materials and Tests Unit of North Carolina DOT+ Analyses performed by the Materials Division of Arkansas DOT
17
4
Mixture Proportions
In the early stage of this investigation, extensive development work involving a total of 360 trialbatches of concrete was conducted to determine appropriate mixture proportions for the varioustypes of high performance concrete. A detailed discussion of this development work can befound in volume 2 of this report series, Production of High Performance Concrete. For VHSconcrete, the development work included 75 trial batches using four different kinds of coarseaggregate.
Proportioning of the concrete mixtures was based on the methods recommended by ACICommittee 211 (1993b). Selections of W/C, workability, and air content requirements weremade first and these constraints were incorporated in accordance with the ACI Committee 211guidelines, as was selection of aggregate quantities. Trial batches were formulated for severaldifferent percentages of mineral admixtures with several different amounts of portland cement.
At NCSU, a nominal maximum size (NMSA) of 1 in. (25 mm) (ASTM C 33, size #57) for thecoarse aggregate was selected as being the most appropriate for a variety of applications. Thisaggregate size could be used for many structural members. The coarse aggregate used atArkansas was slightly smaller (ASTM C 33, size #67).
Although the quantity of coarse aggregate (volume of coarse aggregate per unit volume ofconcrete) could have been increased by about 10% for paving applications, the quantity initiallyselected was at or near the recommended value in ACI Committee 211. These values were
adjusted slightly in subsequent trial batches. The purpose of selecting a less coarse mixture wasto provide a more general-purpose mixture.
Following evaluation of the results of the trial batches, the mixture proportions for VHS concretewith fly ash [VHS (F)] and VHS concrete with silica fume [VHS (S)] concretes with fourdifferent types of aggregate were selected, and they are summarized in Tables 4.1 and 4.2.
19
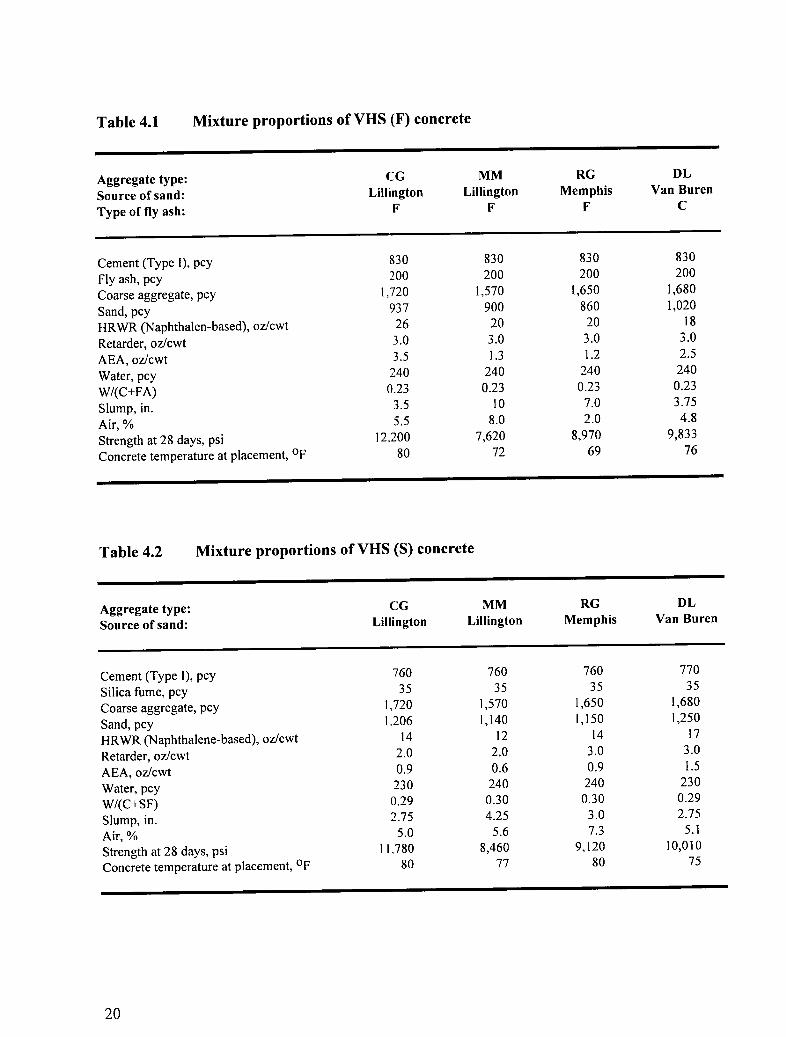
Table 4.1 Mixture proportions of VHS (F) concrete
Aggregate type: CG MM RG DLSource of sand: Lillington Lillington Memphis Van BurenType of fly ash: F F F C
Cement (Type 1), pcy 830 830 830 830Fly ash, pcy 200 200 200 200Coarse aggregate, pcy 1,720 1,570 1,650 1,680Sand, pcy 937 900 860 1,020HRWR (Naphthalen-based), oz/cwt 26 20 20 18Retarder, oz/cwt 3.0 3.0 3.0 3.0AEA, oz/cwt 3.5 1.3 1.2 2.5
Water, pcy 240 240 240 240W/(C+FA) 0.23 0.23 0.23 0.23Slump, in. 3.5 10 7.0 3.75Air, % 5.5 8.0 2.0 4.8Strength at 28 days, psi 12..200 7,620 8,970 9,833Concrete temperature at placement, OF 80 72 69 76
Table 4.2 Mixture proportions of VHS (S) eoncrete
Aggregate type: CG MM RG DLSource of sand: Lillington Lillington Memphis Van Buren
Cement (Type 1), pcy 760 760 760 770Silica fume, pcy 35 35 35 35Coarse aggregate, pcy 1,720 1,570 1,650 1,680Sand, pcy 1.206 1,140 1,150 1,250HRWR (Naphthalene-based), oz/cwt 14 12 14 17Retarder, oz/cwt 2.0 2.0 3.0 3.0AEA, oz/cwt 0.9 0.6 0.9 1.5Water, pcy 230 240 240 230W/(C+SF) 0.29 0.30 0.30 0.29Slump, in. 2.75 4.25 3.0 2.75Air, % 5.0 5.6 7.3 5. I
Strength at 28 days, psi 11.780 8,460 9,120 I0,010Concrete temperature at placement, OF 80 77 80 75
2O

5
Mixing and Curing Procedures
5.1 Mixing Procedures
Concretes made with crushed granite (CG), marine marl (MM), or washed rounded gravel (RG)were produced in the Concrete Materials Laboratory at North Carolina State University (NCSU)using a tilt-drum mixer with a rated capacity of 3.5 ft3 (0.1 m3). Concretes using dense crushedlimestone (DL) were produced also in an identical mixer in the Concrete Laboratory at theUniversity of Arkansas. The normal laboratory mixing and batching procedures (ASTM C 192)were modified slightly to represent typical concrete dry-batch plant operations more closely.Whether the concrete was produced at NCSU or Arkansas, the same general mixing procedureswere followed.
VHS concrete used Type I portland cement and either fly ash or silica fume as pozzolan. Themixing procedure followed these steps:
1. Butter the mixer with a representative sample of mortar composed of approximately 3lb (1.36 kg) cement, 6 lb (2.73 kg) sand, and 2 lb (0.91 kg) water. Turn on the mixerto coat the interior completely. (At Arkansas, only water was used to butter themixer.) Empty the mixer and drain it for i minute.
2. Charge the mixer successively with approximately 25% of the coarse aggregate, 67%of thesand, 50% of the water, and 100% of the air entraining agent (AEA) added withthe sand. Mix for 1 minute to generate air bubbles. The amount of water may bevaried slightly to obtain a thick slurry. (At Arkansas, the mixer was charged with0.33% of the coarse aggregate, 50% of the sand, and 67% of the water.)
3. Stop the mixer and add the remaining coarse aggregate, sand, water, and retarder.Mix for 10 seconds to coat sand and rock with water. If silica fume is used, add itwith the sand.
4. Add cement (and fly ash, if used). Record the time as the beginning of the totalmixing time. Mix for 1 minute. Stop the mixer and add the high-range water reducer
21

(HRWR). Mix for a minimum of 10 minutes, until a homogeneous mass ofacceptable workability has been achieved. During all mixing, cover the mixer with alid to minimize evaporation.
5. Discharge the concrete into a wheelbarrow; measure unit weight, air content, slump,and temperature; and fabricate test specimens.
5.2 Curing Procedures
Curing procedures differed for different categories of high performance concrete. For VHSconcrete, the demand for early strength gain _vasnot as critical as for very early strength (VES)concrete, thus it was not necessary to use insulation for curing.
VHS concrete specimens were cast in steel molds except in Arkansas, where plastic molds wereused. The specimens were maintained for the first 20 to 24 hours at 60° to 80°F (15.6 ° to26.7°C) and were protected from evaporation; they were then re:noved ti'om their molds andplaced in an atmosphere with 100% RH at 71o to 75°F (21.7 ° to 23.9°C) until testing. Some ofthe specimens with DL were soaked in limewater. After the specimens were removed from themoist curing room or limewater bath, they were allowed to dry in the laboratory for at least 1hour before they were tested for strength. The drying was necessary to permit adhesion of linearvoltage differential transducer (LVDT) connections during testing.
22
6
Laboratory Experiments
The laboratory investigation consisted of tests for both fresh or plastic concrete and hardenedconcrete. Plastic concrete were tested for slump, air content, etc.; the results of these tests arepresented in volume 2 of this report series, Production of High Performance Concrete. The testsfor hardened concrete included compression tests for strength and modulus of elasticity, tensiontests for tensile strength and flexural modulus, freezing-thawing tests for durability factor,shrinkage tests, creep tests, rapid chloride permeability tests, tests for AC impedance, and testsfor bond between concrete and steel reinforcement.
The testing program for the mechanical properties of hardened concrete is outlined in Tables 6.1through 6.4*.
6.1 Compression Tests
The compression tests were conducted on 4 x 8-in. (i 01 x 202-mm) cylinders at different ages toobtain stress-strain, strength-time, and modulus-time relationships for VHS concrete with thefour different types of coarse aggregates (MM, CG, DL, and RG). These tests were conductedfor VHS concrete with fly ash [VHS (F)] and VHS concrete with silica fume [VHS (S)] asmineral additives. A limited number of compression tests were also conducted on 6 x 12-in. (I 52x 304-mm) cylinders to investigate the size effect.
6.1.1 Test Setup and Procedure
The tests were conducted in a 2,000 kip (8,900 kN) compression testing machine with ahydraulic feedback system and an MTS 436 controller unit. The machine was capable of bothload and displacement control modes; the tests for strength and modulus of elasticity were doneusing the load control option.
* Testingfor the fatiguepropertiesof plainconcrete(Group4) wasnotconducteddueto the changeof the scopeofthe project.
23

Table 6.1 Test program for compressive strength and modulus
of elasticity m Group 1
No. of 4 x 8-in. Cylinders Tested No. of 6 x 12-in. Cylinders Tested
Category Aggregate
of HPC Type1 Days 3 Days 7 Days 28 Days 28 Days
VHS (F) MM -- 3 3 3 --.CG 3 3 3 3 ---DL -- -- 3 3 --.RG 3 3 3 3 ---
VHS (S) MM 3 3 3 3 2CG 3 3 3 3 2
DL -- -- 3 3 2RG 3 3 -- 3 ---
Table 6.2 Test program for modulus of rupture, tensile strain capacity, and
split tensile strength -- Group 2
No. of Split No. of 4 x 8-in.No. of Rupture Specimens Tested Tensile "Control"
Category Aggregate Specimens Tested Cylinders Testedof HPC Type
3 Days 7 Days 28 Days 28 Days 28 Days
VHS (F) MM 2 2 2 .-- 2CG 2 2 2 2 2DL -- 2 2 2 2RG 2 2 2 2 2
VHS (S) MM 2 2 2 2 2CG 2 2 2 2 2DL -- -. 2 2 2RG 2 2 "2 2 - -
24
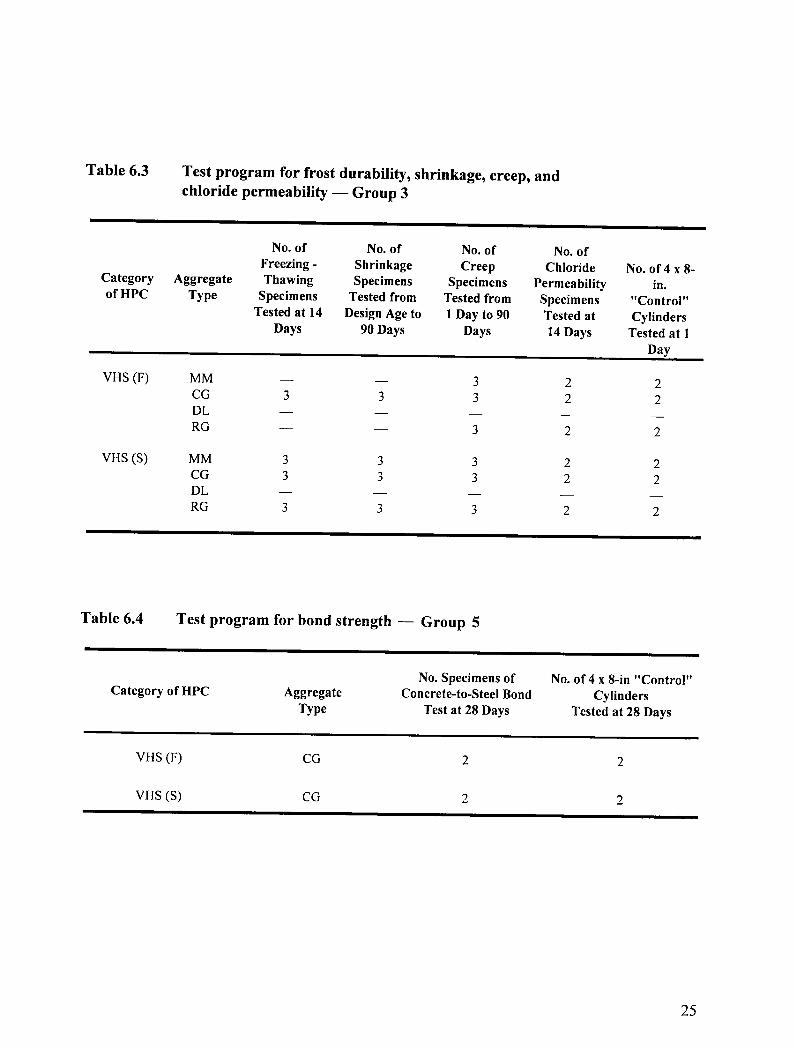
Table 6.3 Test program for frost durability, shrinkage, creep, and
chloride permeability m Group 3
No. of No. of No. of No. of
Freezing - Shrinkage Creep Chloride No. of 4 x 8-Category Aggregate Thawing Specimens Specimens Permeability in.of HPC Type Specimens Tested from Tested from Specimens "Control"
Tested at 14 Design Age to 1 Day to 90 Tested at CylindersDays 90 Days Days 14 Days Tested at I
Day
VHS (F) MM -- -- 3 2 2CG 3 3 3 2 2DL .....RG -- -- 3 2 2
VHS (S) MM 3 3 3 2 2CG 3 3 3 2 2DL .....RG 3 3 3 2 2
Table 6.4 Test program for bond strength -- Group 5
No. Specimens of No. of 4 x 8-in "Control"Category of HPC Aggregate Concrete-to-Steel Bond Cylinders
Type Test at 28 Days Tested at 28 Days
VttS (F) CG 2 2
VHS (S) CG 2 2
25

The tests were conducted according to AASHTO T-22-86 and ASTM C 39, with minormodifications. The modifications were the use of an unbonded capping system, such as steelcaps lined with neoprene pads, and the use of a deformation measuring fixture that includedlinear voltage differential transducers (LVDTs). The two LVDTs used in the compressive testswere Lucas Schaevitz MHR 050, with a sensitivity of 2.500 mV/V/O.O01 in. The voltage wasconverted by a National Instruments AT-MIO- 16 12-bit analog-to-digital converter.
An aluminum mounting jig was built to facilitate the mounting of the LVDTs on the testcylinder. The jig ensured that the LVDTs were placed 180 degrees apart and in the central 4 in.(101 mm) of the test cylinders. The device for mounting the transducers on the 4 x 8-in. (101 x202-mm) cylinders is shown in Figure A.1. First the specimens were placed in the device andthe bottom of the cylinder was placed so as to align with the alignment mark. A line of super-glue was applied at each of the four locations where the transducers were to be attached. Themetallic contact area of the LVDT holder was sprayed with a zip kicker (a product for speedingup the reaction between the metal and the concrete surface with saper-glue), and the LVDTholders together with LVDTs were attached with the wires of the LVDT protruding toward thebottom of the cylinder. After about a minute, the cylinder was removed from the transducermounting device. To ensure a good bond between the LVDT holders and the concrete surface,additional super-glue was applied all around the contact surface and sprayed with the zip kicker.The unbonded caps were put on the cylinders and the specimen was placed in the compressiontesting machine.
The LVDTs used to measure the axial deformation of the cylinders had a maximum range of+_0.05in. (1.27 mm) and the gage length for the axial deformation measurements was 4 in. (101mm). The core of the LVDTs could be moved up or down by a specially designed screw-threadmechanism (which was machined to become a part of the core of the LVDT) so as to adjust theoutput voltage to zero or near zero.
The test specimen with the two mounted LVDTs was placed inside a protective steel jacket thatrested between the two platens of the compression testing machine (Figure A.2). The steel jacketprevented damage to the transducers from the brittle failure of the specimens at the maximumload.
The test cylinders were loaded and unloaded up to a load of 5,000 lb (22.2 kN) at least twicebefore the cylinders were loaded to failure. This initial loading and unloading was done forseating purposes and the properly zero out the LVDTs. After the' initial loading and unloading,the cylinders were loaded to failure. For 4 x 8-in. (101 x 202-mm) cylinders, a loading rate of26,500 Ib/min (l 18 kN/min) was used; for the 6 x 12-in. (152 x 303-ram) cylinders, a loadingrate of 59,400 lb/min (264 kN/min) was used. The loading rates were within the range of 20 to50 psi/see (0.14 to 0.34 MPa/sec) as specified in AASHTO T 22-86 and ASTM C 39 revised.
The data acquisition system used was an OPTIM system (Megadec 100) capable of recording upto 40 channels of output. The load output and the output from the two displacement transducerswere recorded using LabWindows software in conjunction with the OPTIM data acquisitionsystem. A view of the compression test setup is shown in Figure A.3.
26
6.1.2 Specimen Preparation
The specimens were prepared according to ASTM C 192. Specimens used specifically fordetermining the compressive strength and modulus of elasticity were 4 x 8-in. (101 x 202-mm)cylinders and were cast in plastic molds. Companion 6 x 12-in. (152 x 304-ram) cylinders werealso cast in plastic molds to investigate the size effect.
After casting, the specimens inside the molds were covered with plastic sheets for about 24 hoursto prevent moisture loss. After 24 hours, the specimens were stripped and placed in sealedplastic bags to be tested at different ages. Before the tests, the specimens were air-dried for 10 to15 minutes before the LVDTs were mounted on the sides of the specimens.
6.1.3 Test Results and Discussion
There are three categories of test results. They include stress-strain relationships, strength-timeand modulus-time relationships, and strength comparisons of 4 x 8-in. (101 x 202-mm) cylinderswith 6 x 12-in. (152 x304-mm) cylinders.
6.1.3. l Stress-Strain Relationships
The stress-strain curves were obtained from the load-deformation curves by dividing the load bythe nominal area of the cylinders and the axial deformation by the gage length. Figure 6. l showstypical stress-strain curves ofVHS (F) concrete at the design age of 28 days with different typesof coarse aggregates. From Figure 6.1, it appears that the slope of the stress-strain curve for VHS(F) concrete with RG is relatively steeper than those for VHS (F) concretes with MM, CG andDI,. The strain capacity corresponding to the maximum strength varies from about 1,200microstrains for VHS (F) concrete with RG to about 2,000 to 2,500 microstrains for VHS (F)concrete with MM, CG, and DL.
Figure 6.2 shows typical stress-strain curves of VES (S) concrete at the design age of 28 dayswith different types of coarse aggregates. From Figure 6.2, it appears that the slope of the stress-strain curve for VHS (S) concrete with RG is relatively steeper than those for VHS (S) concreteswith MM, CG, and DL. The strain capacity corresponding to the maximum strength is about1,600 microstrains for the VHS (F) concrete with MM, RG, and DL, compared to about 1,900microstrains for VHS (S) concrete with CG.
Examination of Figures 6.1 and 6.2 shows that softer coarse aggregates such as MM exhibitsofter response in the initial portion of the curve, which translates into a lower modulus ofelasticity.
The effect of age on the stress-strain curve for VHS (F) and VHS (S) concretes with one type ofcoarse aggregate (MM) is shown in Figures 6.3a and 6.3b. The initial portion of the stress-straincurve becomes more linear as the concrete matures, and there is a slight increase in the straincapacity during early age (up to 3 days), after which there is an insignificant effect on the strain
27

14
CQE
10
RG8
• 6
w • v i
0 500 1000 1500 2oo0 2500
Microstrains
Figure 6.1 Stress-strain relationship ofVHS (F) concrete at design age of 28 days
14
12RG CG
10DL
_, 8MM
u_ 6(9IN.
4
2
| i ! i
0 50 1000 1500 2000 2500
Microstrains
Figure 6.2 Stress-strain relationship of VHS (S) concrete at design age of 28 days
28

capacity due to the age of the concrete. For VHS (S) concrete, the strain capacity during earlyages (up to 3 days) decreases as the concrete matures; at 28 days, the strain capacity is about 50%of the strain capacity at 3 days. Figures 6.3a and 6.3b also show that for VHS (S) concrete, theinitial stiffness of the stress-strain curve at early ages less than 7 days is noticeably less than atlater ages, whereas for VHS (F) concrete, the initial stiffness at early ages is comparable to that atlater ages. Note that the stiffening of the behavior in the initial portion of the stress-strain curvewith time results in an increase in the modulus of elasticity with time.
6.1.3.2 Strength-Time and Modulus-Time Relationships
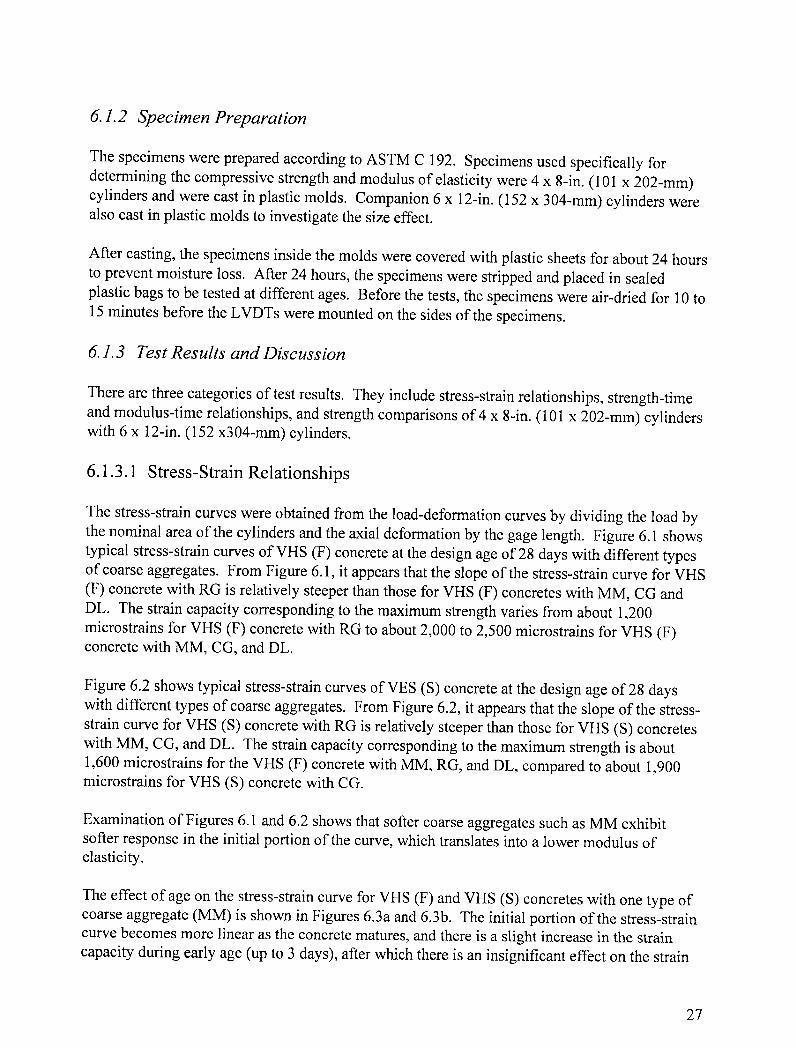
The strength and modulus of elasticity test results for VHS (F) and VHS (S) concretes aresummarized in Tables 6.5a and 6.5b. The values shown in the table are averages of threereplicate specimens. The strength-time relationships for VHS (F) and VHS (S) concretes withdifferent types of coarse aggregate in a nondimensional form are shown in Figures 6.4a and 6.4b.Each point on the curve is based on an average of three replicate specimens. From Figure 6.4a, itcan be seen that for VHS (F) concrete, the strength gain with time for different types of coarseaggregates is similar. At 3 days, the strength achieved is about 55% to 75% of the 28-daystrength and that during the early age (up to 3 days), the concrete with softer aggregate reaches ahigher fraction of its 28 day strength. Figure 6.4a also compares the observed strength-timerelationships of VHS (F) concrete with the prediction of ACI Committee 209 (1993a). Thestrength gain for VHS (F) concrete compares well with this prediction. Note that the equation ofACI Committee 209 was developed from a large number of experimental data for concretes withstrengths up to 6,000 psi (42 MPa) at 28 days.
The nondimensional strength-time relationship for VHS (S) concrete shown in Figure 6.4bindicates that at 3 days, the strength achieved is about 70% to 80% of the 28-day design strengthand that the strength gain with time for VHS (S) with CG is lower than for VHS (S) with MM,RG, and DL. Comparison with the prediction of ACI Committee 209 shows that strength gain ismuch faster in the first 7 days for VHS (S) concrete than the prediction indicates. Comparison ofFigure 6.4a and Figure 6.4b shows that strength-time relationship is dependent on the type ofcoarse aggregate, and the general shape of the strength-time relationship is similar for VHS (F)and VHS (S) concretes.
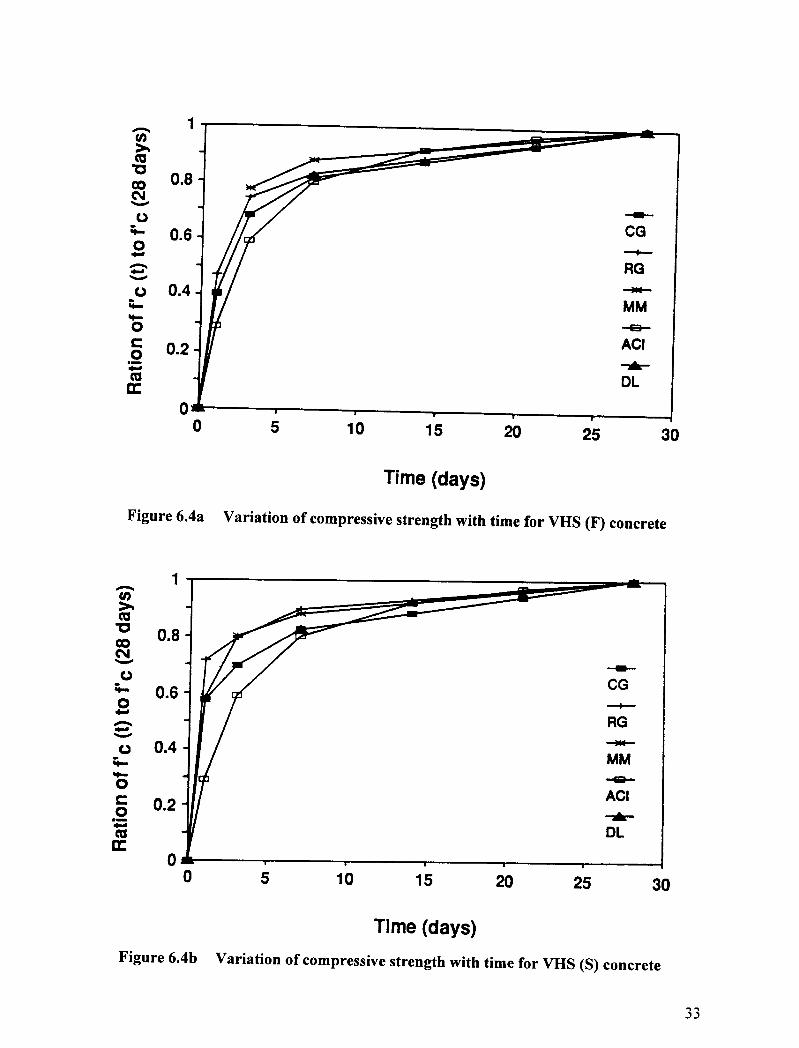
The modulus-time relationships for the different types of coarse aggregate for VHS (F) and VHS(S) concretes are shown in Figures 6.5a and 6.5b. Each point on the curve is an average of threereplicate specimens. The results for VHS (F) concrete indicate lower modulus for the softercoarse aggregate such as MM; however, the rate of increase in the modulus with time iscomparable to VHS (F) concrete with other types of coarse aggregates. For VHS (S) concrete,the variation of the modulus with time for RG is different than those for CG, MM, and DL. TheVHS (S) concrete with RG shows a nearly linear increase in the modulus with age after the first 3days, which is not a typical response. At 3 days, the modulus of elasticity ofVHS (S) concretewith RG is about 55% of the modulus ofVHS (S) with CG; however, at the design age of 28days, the modulus of VHS concrete with RG is slightly greater than the modulus of VHSconcrete with CG.
29

10 28 Days9
8 7 Days
7 3 Days
6
51 Day•- 4
or)3
2
1
! • i
0 500 1000 1500 2000
Microstrains
Figure 6.3a Effect of age on stress-strain curve for VHS (F)concrete with RG
12
10
/ 3oa.6
4
2
00 500 1000 1500 2000 2500 3000
Microstrains
Figure 6.3b Effect of age on stress-strain curve for VHS (S)concrete with RG
3O

Table 6.5a Summary of test results for compressive strength
and modulus of elasticity at different test ages forVHS (F) concrete
Age (days) MM CG DL RG
Compressive Strength (psi)
I -- 4,920 -- 4,550
3 6,590 8,300 -- 7,200
7 7,470 9,940 8,660 8,050
28 ] 5,600 11,430 9,040 8,690
282 ....
283 8,510 12,200 10,500 9,700
Modulus of Elasticity (106 psi)
1 -- 3.40 -- 4.25
3 4.85 5.30 -- 5.45
7 5.30 5.60 6.91 5.40
281 4.85 6.25 6.19 6.60
282 5.12 5.45 -- 6.20
i 4 x 8-in. companion cylinders of flexural strength testing.2 6 x 12-in. companion cylinders of compressive strength testing.3 4 x 8-in. cylinders of compressive strength testing.
31

Table 6.5b Summary of test results for compressive strength
and modulus of elasticity at different test ages for
VHS (S) concrete
Age (days) MM CG DL RG
Compressive Strength (psi)
1 4,730 7,720 --- 7,920
3 6,460 9,360 -- 8,810
7 7,110 11,060 8,690 9,920
281 5,380 8,330 10,100 9,120
282 7,910 12,230 10,310 --
283 8,080 13,420 10,480 11,080
Modulus of Elasticity (106 psi)
1 3.65 3.96 - 2.95
3 4.40 5.55 - 3.15
7 4.70 5.75 6.88 4.00
281 4.23 4.45 7.61 5.33
282 5.05 6.45 - 7.00
I 4 x 8-in. companion cylinders of flexural strength testing.2 6 x 12-in. companion cylinders of compressive strength testing.3 4 x - in. cylinders of compressive slrength testing.
32
0.8
0
..oo.4ACI
0.2DL
' ! | i i I
0 5 10 15 20 25 30
Time (days)
Figure 6.4a Variation of compressive strength with time for VHS (F) concrete
1
0.8
O
;" 0.6o
o 0.4 MM
"6
_mO 0.2 _ ..... DL
DL
00 5 10 15 20 25 30
Time (days)
Figure 6.4b Variation of compressive strength with time for VHS (S) concrete
33
8
'--':" 7 a,.
>, 6
".= 5u_
-.ra-m 4 CGql,-,, !
O 3 RG
=mr
"O MMO .A:S 1 DL
| i w w w
0 5 10 15 20 25 30
Time (days)
Figure 6.5a Variation of modulus of elasticity with time for VHS (F) concrete
8 _k
(n 7
>, 6im
"" 5
4 CGit,,, ! -
O 3 RG
:3 .-.)x-"5 2 MM'100 A
1 DL
| i i
0 5 10 15 20 25 30
Time (days)
Figure 6.5b Variation of modulus of elasticity with time for VHS (S) concrete
34

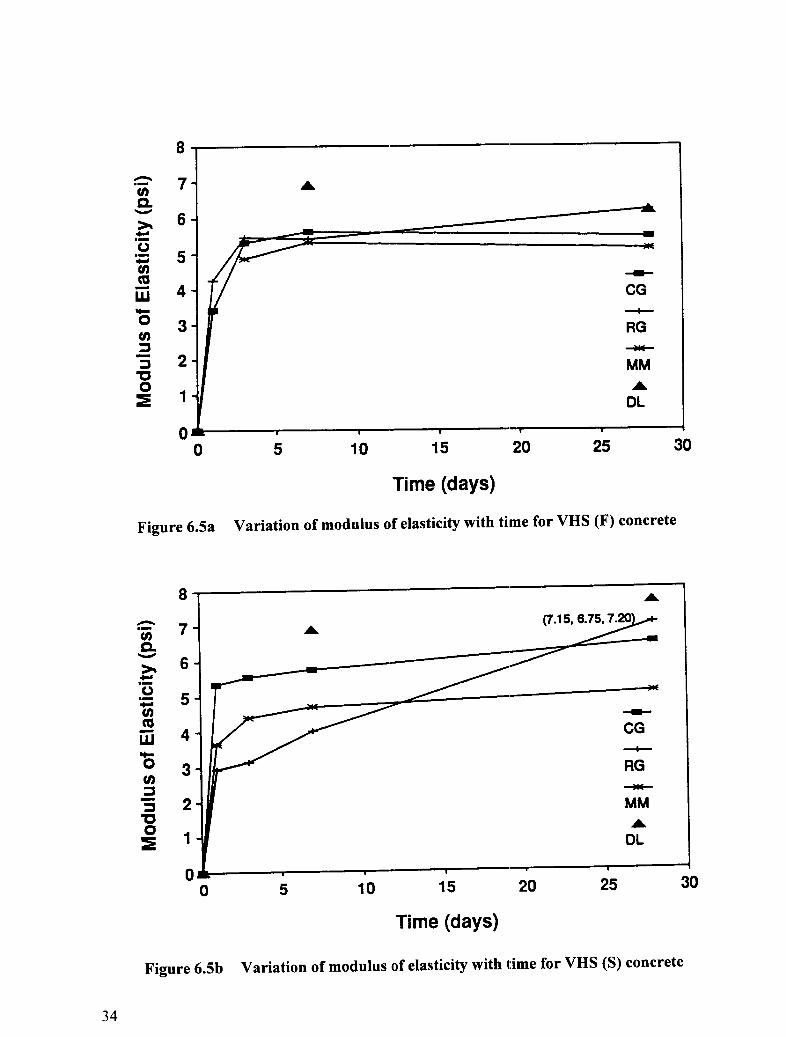
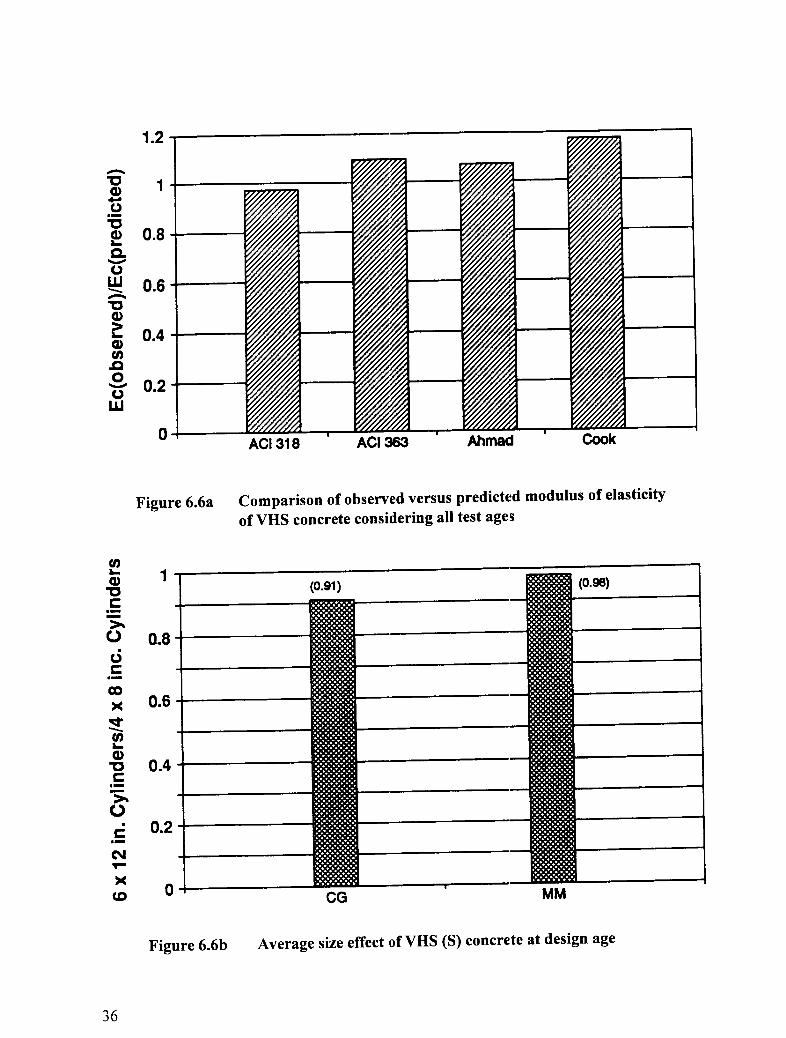
The predictions by the various published equations for the modulus of elasticity by ACI 318(1993c), ACI 363 (1993d), and Ahmad and Shah (1985) were compared with the observedmodulus of elasticity of VHS concrete at different ages up to 28 days (Figures 6.6a). The ACI318 equation uses a premultiplier of 57,000 to the square root of the compressive strength in psiunits. It can be seen that for VHS concrete, the prediction by the ACI equation (I 993c) is inclose agreement with the experimental results, underpredicting the observed values by only 2%.The equations of ACI 363 (1993d), Ahmad and Shah (1985), and Cook (1989) overpredict theexperimental results by 10%, 5%, and 15% respectively. Note that the ACI 318 equation wasdeveloped for lower strength concretes up to 6,000 psi (42 MPa) at 28 days, whereas the otherequations were developed primarily for concretes with strengths exceeding 10,000 psi (70 MPa)at 28 days.
6.1.3.3 Strength Comparisons of 4 x 8-in. and 6 x 12-in. Cylinders
A summary of the strength comparisons between the 4 x 8-in. (101 x202-mm) cylinders and the 6x 12-in. (152 x 304-ram) cylinders for VHS (S) concrete is presented in Table 6.6 and shown inFigure 6.6b. The results indicate that the ratio of the 6 x 12-in. (152 x 304-ram) cylinderstrengths to the 4 x 8-in. (101 x 202-ram) cylinder strengths varies with the type of coarseaggregate used. The ratio of 6 x 12-in. (152 x 304ram) cylinder strength to 4 x 8-in. (101 x 202-mm) cylinder strength is 0.91 for the VHS (F) concrete with CG and 0.98 for VHS (F) concretewith MM and DL. Values reported in the literature for concretes with 28-day strength rangingfrom 5,000 psi (35 MPa) to 12,000 psi (84 MPa) vary from 0.90 to 0.95 (Carrasquillo et al. 1991,Leming 1988, Moreno 1990).
Table 6.6 Summary of test results for 4 x 8-in. and 6 x 12-in. cylinderstrengths for VHS (S) concrete
No. of Test Age Strength (psi)Specimen Size Specimens (days) MM CG DL RG
A: 4 x 8 in. 3 28 8,880 13,420 10,480 11,080
B: 6 x 12 in. 2 28 7,910 12,230 I0,310 --
A/B 0.98 0.91 0.98 --
35
1.2
._o
o.8
-0_'_0.6_.0.4
° N0-_ o.2
0 •ACI 318 ACI 363 Ahmad Cook
Figure 6.6a Comparison of observed versus predicted modulus of elasticity
of VHS concrete considering all test ages
Figure 6.6b Average size effect of VHS (S) concrete at design age
36

6.2 Tension Tests
Two types of tensile strength tests were conducted: split cylinder tests and flexural tests. Thesplit cylinder tests were conducted on 4 x 8-in. (101 x 202-ram) cylinders, and the flexural testswere conducted on 4 x 4 x 17.5-in. (101 x 101 x 444-mm) beams.
6. 2.1 Test Setup and Procedure
6.2.1.1 Split Cylinder Tests
The split cylinder tests were conducted according to ASTM C 496. The cylinders were loaded ata rate of 7,500 lb/min (33.4 kN/min) until failure. This rate of loading was within the ASTMspecified range of 100 to 200 psi/min (0.69 to 1.38 MPa/min). The split cylinder tests wereconducted on a 300 kip (1335 kN) compression testing machine.
6.2.1.2 Flexural Tests
The flexural tests were conducted on a universal testing machine with a capacity of 120 kip (534kN). The machine was equipped with a SATEC System Inc. M 120BTE automated controlsystem for programming the loading rate. The flexural tests were conducted in accordance withAASHTO T 97-86 and ASTM C 78, with some modifications. The modifications werenecessary to incorporate the capability of monitoring the tensile strain capacity and the load-deflection response of the test specimen during testing. To measure the tensile strain and themidspan deflection of the test specimen, a mounting frame (fixture) was designed and fabricated.The mounting frame is capable of holding four LVDTs (two on each side of the beam) and anadditional one for measuring the midspan deflection. To prevent damage to the transducers, aNo. 2 smooth reinforcing bar was placed along the centroidal axis of the beam. This preventedthe sudden collapse of the specimen upon reaching the maximum load and protected all thetransducers.
Several preliminary tests indicated that the use of a No. 2 smooth reinforcing bar along thecentroidal axis did not have any detectable effect on the strength and behavior of the testspecimens. The test specimens were first placed in a transducer mounting device to facilitate themounting of the four transducers to monitor the tensile and compressive strains during theflexural test. The device for mounting the transducers is shown in Figure A.4.
Preliminary testing revealed that the combination of slight imperfections in the steel molds forthe beams and the rigid supports introduced a torsional effect that changed the mode of failure ofthe test specimen. A special beam support unit that could accommodate these imperfections wasthen designed and fabricated. In the beam support unit, both of the supports are restrainedagainst motion along the centroidal axis of the beam; however, in the transverse direction, one ofthe supports is allowed to rotate (Figure A.5).
37
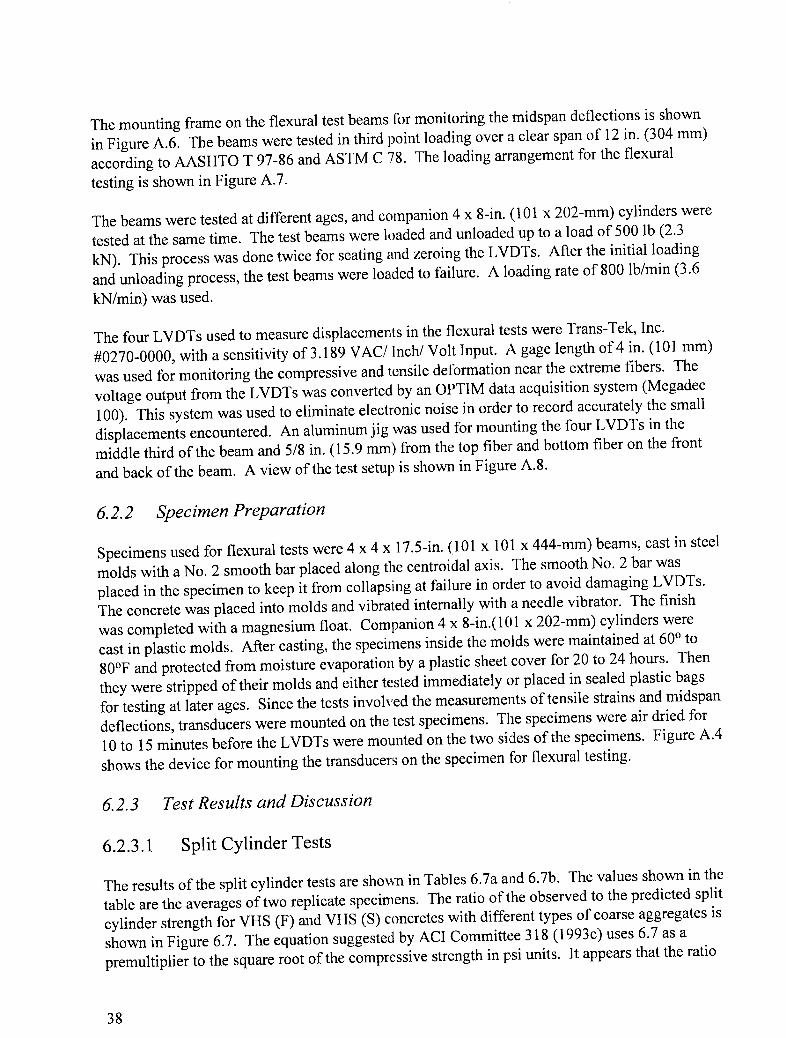
The mounting frame on the flexural test beams for monitoring the midspan deflections is shownin Figure A.6. The beams were tested in third point loading over a clear span of 12 in. (304 mm)according to AASHTO T 97-86 and ASTM C 78. The loading an'angement for the flexuraltesting is shown in Figure A.7.
The beams were tested at different ages, and companion 4 x 8-in. (101 x 202-ram) cylinders weretested at the same time. The test beams were loaded and unloaded up to a load of 500 lb (2.3kN). This process was done twice for seating and zeroing the LVDTs. After the initial loadingand unloading process, the test beams were loaded to failure. A loading rate of 800 lb/min (3.6kN/min) was used.
The four LVDTs used to measure displacements in the flexural tests were Trans-Tek, Inc.#0270-0000, with a sensitivity of 3.189 VAC/ Inch/ Volt Input. A gage length of 4 in. (101 ram)was used for monitoring the compressive and T,ensile detbrmation near the extreme fibers. Thevoltage output from the LVDTs was converted by an OPTIM data acquisition system (Megadec100). This system was used to eliminate electronic noise in order to record accurately the smalldisplacements encountered. An aluminum jig was used for mounting the tbur LVDTs in themiddle third of the beam and 5/8 in. (15.9 mm) from the top fiber and bottom fiber on the frontand back of the beam. A view of the test setup is shown in Figure A.8.
6.2.2 Specimen Preparation
Specimens used for flexural tests were 4 x 4 x 17.5-in. (101 x 101 x 444-mm) beams, cast in steelmolds with a No. 2 smooth bar placed along the centroidal axis. The smooth No. 2 bar wasplaced in the specimen to keep it from collapsing at failure in order to avoid damaging LVDTs.The concrete was placed into molds and vibrated internally with a needle vibrator. The finishwas completed with a magnesium float. Companion 4 x 8-in.(101 x 202-mm) cylinders werecast in plastic molds. After casting, the specimens inside the molds were maintained at 60° to80°F and protected from moisture evaporation by a plastic sheet cover for 20 to 24 hours. Thenthey were stripped of their molds and either tested immediately or placed in sealed plastic bagsfor testing at later ages. Since the tests invoh'ed the measurements of tensile strains and midspandeflections, transducers were mounted on the test specimens. The specimens were air dried for10 to 15 minutes before the LVDTs were mounted on the two sides of the specimens. Figure A.4shows the device for mounting the transducers on the specimen for flexural testing.
6.2.3 Test Results and Discussion
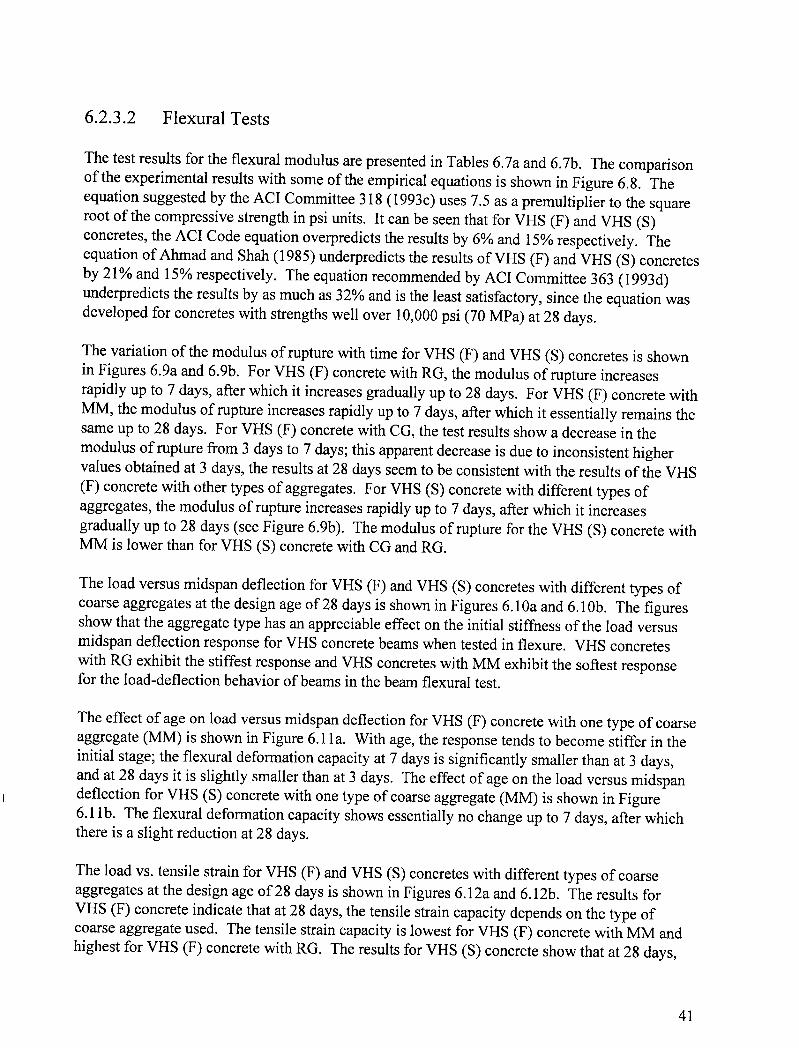
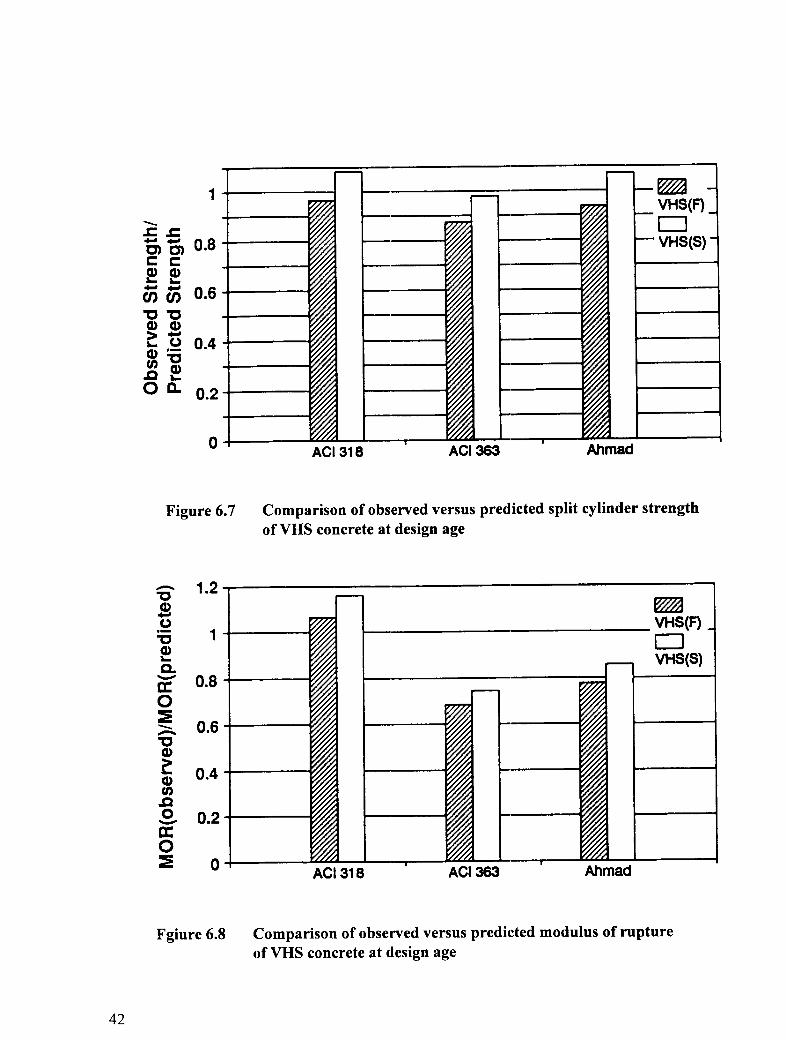
6.2.3.1 Split Cylinder Tests
The results of the split cylinder tests are shown in Tables 6.7a and 6.7b. The values shown in thetable are the averages of two replicate specimens. The ratio of the observed to the predicted splitcylinder strength for VHS (F) and VHS (S) concretes with different types of coarse aggregates isshown in Figure 6.7. The equation suggested by ACI Committee 318 (1993c) uses 6.7 as apremultiplier to the square root of the compressive strength in psi units. It appears that the ratio
38

of the observed to the predicted split cylinder strength is higher for VHS (S) concrete than forVHS (F) concrete. For VHS (F) concrete, the equations of ACI Committee 318 (1993c), ACICommittee 363 (1993d), and Ahmad and Shah (1985) underpredict the observed values by 5%,14%, and 8% respectively. For VHS (S) concrete, the equations of the ACI Committee 318 andAhmad and Shah overpredict by 8% and 5% respectively, whereas the equation of ACICommittee 363 underpredicts by 3%. Note that the equation of ACI Committee 318 wasdeveloped for concretes with strengths up to 6,000 psi (42 MPa) at 28 days age, whereas theequations of ACI Committee 363 and Ahmad and Shah were primarily for concretes withcompressive strengths more than 6,000 psi (42 MPa) at 28 days.
Table 6.7a Summary of test results for modulus of rupture, tensile strain capacity,and split cylinder tensile strength for VHS (F) concrete
4 x 8-in.Coarse Modulus of Tensile Strain "Control"
Aggregate Rupture Capacity Split Cylinder CylinderType Age (days) (psi) (mierostrains) Strength (psi) Strength (psi)
MM 3 450 -125 -- --
7 620 -120 -- --
28 600 -120 -- 5600
CG 3 660 -150 -- --
7 550 -200 -- --
28 750 -140 620 11,430
DL 3 ....
7 110 -180 670 --
28 590 -130 810 9,040
RG 3 230 -130 -- 8,690
7 380 -125 -- --
28 430 -160 660 --
39
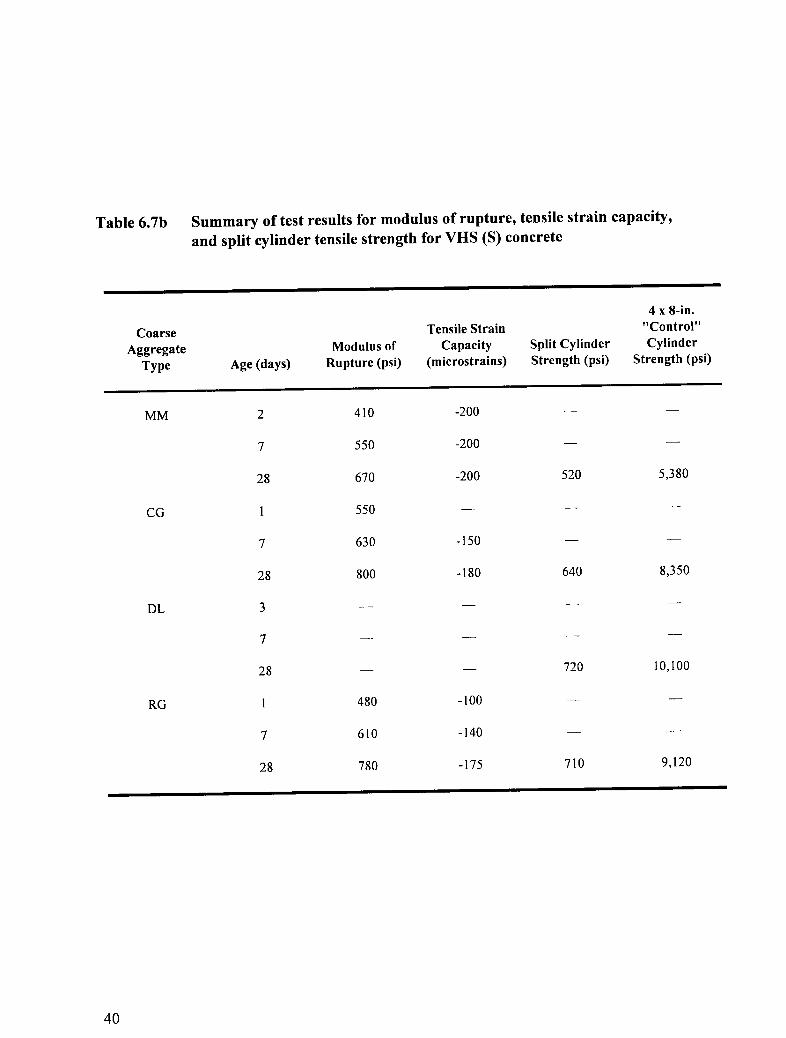
Table 6.7b Summary of test results for modulus of rupture, tensile strain capacity,
and split cylinder tensile strength for VHS (S) concrete
4 x 8-in.Coarse Tensile Strain "Control"
Aggregate Modulus of Capacity Split Cylinder Cylinder
Type Age (days) Rupture (psi) (microstrains) Strength (psi) Strength (psi)
MM 2 410 -200 -- --
7 550 -200 -- --
28 670 -200 520 5,380
CG 1 550 ......
7 630 -150 -- --
28 800 -180 640 8,350
DL 3 ........
.......
28 -- --- 720 I0, I00
RG 1 480 -100 -- --
7 610 -140 -- --
28 780 -175 710 9,120
40
6.2.3.2 Flexural Tests
The test results for the flexural modulus are presented in Tables 6.7a and 6.7b. The comparisonof the experimental results with some of the empirical equations is shown in Figure 6.8. Theequation suggested by the ACI Committee 318 (1993c) uses 7.5 as a premultiplier to the squareroot of the compressive strength in psi units. It can be seen that for VHS (F) and VHS (S)concretes, the ACI Code equation overpredicts the results by 6% and 15% respectively. Theequation of Ahmad and Shah (1985) underpredicts the results ofVHS (F) and VHS (S) concretesby 21% and 15% respectively. The equation recommended by ACI Committee 363 (1993d)underpredicts the results by as much as 32% and is the least satisfactory, since the equation wasdeveloped for concretes with strengths well over 10,000 psi (70 MPa) at 28 days.
The variation of the modulus of rupture with time for VHS (F) and VHS (S) concretes is shownin Figures 6.9a and 6.9b. For VHS (F) concrete with RG, the modulus of rupture increasesrapidly up to 7 days, after which it increases gradually up to 28 days. For VHS (F) concrete withMM, the modulus of rupture increases rapidly up to 7 days, after which it essentially remains thesame up to 28 days. For VHS (F) concrete with CG, the test results show a decrease in themodulus of rupture from 3 days to 7 days; this apparent decrease is due to inconsistent highervalues obtained at 3 days, the results at 28 days seem to be consistent with the results of the VHS(F) concrete with other types of aggregates. For VHS (S) concrete with different types ofaggregates, the modulus of rupture increases rapidly up to 7 days, after which it increasesgradually up to 28 days (see Figure 6.9b). The modulus of rupture for the VHS (S) concrete withMM is lower than for VHS (S) concrete with CG and RG.
The load versus midspan deflection for VHS (F) and VHS (S) concretes with different types ofcoarse aggregates at the design age of 28 days is shown in Figures 6.10a and 6.10b. The figuresshow that the aggregate type has an appreciable effect on the initial stiffness of the load versusmidspan deflection response for VHS concrete beams when tested in flexure. VHS concreteswith RG exhibit the stiffest response and VHS concretes with MM exhibit the softest responsefor the load-deflection behavior of beams in the beam flexural test.
The effect of age on load versus midspan deflection for VHS (F) concrete with one type of coarseaggregate (MM) is shown in Figure 6.1 la. With age, the response tends to become stiffer in theinitial stage; the flexural deformation capacity at 7 days is significantly smaller than at 3 days,and at 28 days it is slightly smaller than at 3 days. The effect of age on the load versus midspan
i deflection for VttS (S) concrete with one type of coarse aggregate (MM) is shown in Figure6.1 lb. The flexural deformation capacity shows essentially no change up to 7 days, after whichthere is a slight reduction at 28 days.
The load vs. tensile strain for VHS (F) and VHS (S) concretes with different types of coarseaggregates at the design age of 28 days is shown in Figures 6.12a and 6.12b. The results forVHS (F) concrete indicate that at 28 days, the tensile strain capacity depends on the type ofcoarse aggregate used. The tensile strain capacity is lowest for VHS (F) concrete with MM andhighest for VHS (F) concrete with RG. The results for VHS (S) concrete show that at 28 days,
41
1VHS(F)
=:=: _ I---I_ _ 0.8 -- vHs(s)-
"o"o°0°0_o 0.4_> "m 0.6
on 0.20 , ,
AC 318 ACI 363 Abroad
Figure 6.7 Comparison of observed versus predicted split cylinder strengthof VHS concrete at design age
A 1.2
_5 1 _ VHS(F).
o. _ VHS(S)E 0.8
o0.6
_ 0.4
& 0.2
= N No_ 0 . ,
ACI 318 ACI 363 Ahmacl
Fgiure 6.8 Comparison of observed versus predicted modulus of rupture
of VHS concrete at design age
42
,-_m1°°° tr, 800
k.
:3
O.. 600 _:3
n" (518,576)'*" CG0 400"! RG
m
"00 200 MM
i i w i i
0 5 10 15 20 25 30
Time (days)
Figure 6.9a Variation of modulus of rupture with time for VHS (F) concrete
1000
A,u
o. 800
¢_
:3"" 600:3n-'
O 4000
:3 RGm
:3,-,.)N.--
"o 200O MM:S
O | = | i =
0 5 10 15 20 25 30
Time (days)
Figure 6.9b Variation of modulus of rupture with time for VHS (S) concrete
43

5000
RG4000 ce
3000
o 2000
IOO0
l w e e
0 0.0004 0.0008 0.0O12 0.0O16 0.()02
Midspan Deflection (in.)
Figure 6.10a Load versus midspan deflection of VHS (F) concrete
at design age of 28 days
5000RG
4000 cG
3000
o 2000
1000
' • i |
0 0.0004 0.0008 0.0Ol 2 0.0016 0.002
Midspan Deflection (in.)
Figure 6.10b Load versus midspan deflection of VHS (S) concreteat design age of 28 days
44

5000
4OOO
7 Days 28 Days300O
10 3 DaysO
2000
1000
• i
0 0.0005 0.001 0.0015 0.002
Midspan Deflection (in.)
Figure 6.11a Load versus midspan deflection ofVHS (F)concrete with MM
5000
4000
28 Days
3000 7 DaysV
10
o 2000-_ 2 Days
1000
| | i
0 0.0005 0.001 0.0015 0.002
Midspan Deflection (in.)
Figure 6.11b Load versus midspan deflection ofVHS (S)concrete with MM
45

5000 IRG
4000
CG
.o 3000 MM10
0._ 2000
1000
i i • i i •
0 20 40 60 80 100 120 140 160
Microstrains
Figure 6.12a Load versus tensile strain of VHS (F) concrete
at design age of 28 days
5000
RG
4000C,G
A
3000MM
10
o 2000
1000
00 20 40 60 80 100 120 140 160 180 200
Microstrains
Figure 6.12b Load versus tensile strain of VHS (S) concreteat design age of 28 days
46
the tensile strain capacity is significantly affected by the type of coarse aggregate used (seeFigure 6.12b). The tensile strain capacity is lowest for VHS (S) concrete with RG and is highestfor VHS (S) concrete with MM.
The load versus tensile strain for VHS (F) concrete with MM (see Figure 6.13a) shows that at 3days, the tensile strain capacity is about 125 microstrains and that it does not change significantlywith age up to 28 days. The load versus tensile strain for VHS (S) concrete with MM (see Figure6.13b) shows that at 2 days, the tensile strain capacity is about 200 microstrains and that itessentially remains constant with age up to 28 days.
6.3 Freezing-Thawing Tests
6. 3.1 Test Setup and Procedure
The freezing-thawing tests were performed in accordance with ASTM C 666, procedure A, usinga programmable freezing-thawing chamber as shown in Figure A.9. The chamber housed 12rectangular aluminum containers 4 1/4 in. (106 ram) wide, 16 1/4 in. (413 ram) long, and 6 in.(150 ram) deep, surrounded by an antifreeze liquid that served as a heat exchange medium for thefreeze-thaw cycle.
Two narrow vertical slits were cut in each side of the container to reduce its rigidity. The slitswere then filled with silicon to make the container water-tight. Inside the container, small stripsof Plexiglas were adhered to the two longitudinal side walls and the bottom to serve as supportsfor the specimen so that the specimen would be completely surrounded by water. The thicknessof the side supports was 1/16 in. (1.6 mm), and that of the bottom supports was 1/8 in. (3.2 mm).These supports ensured proper spacing and clearance of the submerged specimens. The size ofthe specimen was 3 x 4 x 16 in. (75 x 100 x 400 mm). The specimens were placed inside plasticbags that were filled with water, then placed in the containers. This was to prevent aluminumfrom reacting with the lime (CaOtt) in the concrete.
When the specimens were 14 days old, they were placed, with the finished surface up, in thefreezing-thawing chamber and subjected to freezing and thawing between 0° and 40°F (+ 3°F), or-17.8 ° to 4.4°C (+1.7°C). Each freezing-thawing cycle required approximately 2.5 hours tocomplete. The exact amount of time was somewhat influenced by the ambient temperature in thelaboratory.
At intervals of not more than 36 freezing-thawing cycles, the specimens were removed from thefreezing-thawing chamber, brought to saturated surface dry condition, and weighed in grams.The weight was later automatically converted to pounds by the computer program used for dataanalysis. The dimensions of each specimen were measured to the nearest 1/8 in. (3.2 mm). Eachspecimen was then tested for its fundamental transverse frequency.
47
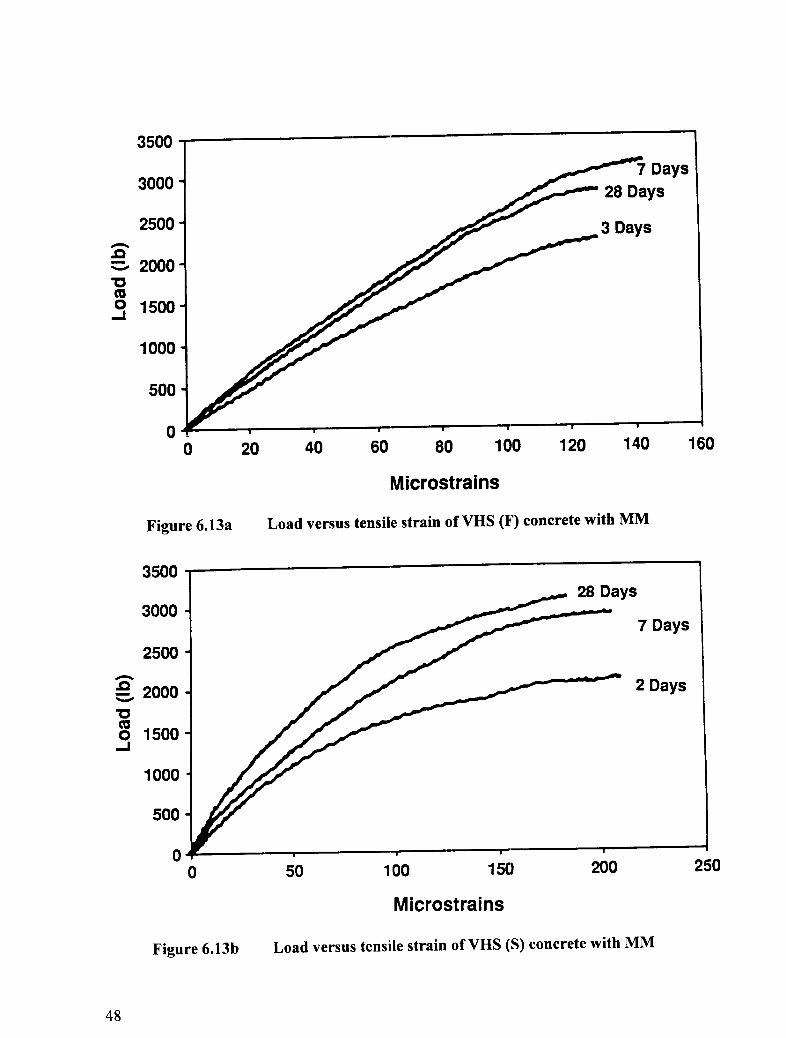
3500
3000 7 Days28 Days
2500 3 Days.Q-- 2000"O
o 1500,.I
1000
5OO
• i i • i | •
0 20 40 60 80 100 120 140 160
Microstrains
Figure 6.13a Load versus tensile strain of VHS _') concrete with MM
3500
.28 Days3000 7 Days
_21_0 2 Days
o, 1500
1000
5O0
! | i
0 50 100 150 200 250
Microstrains
Figure 6.13b Load versus tensile strain ofVHS (S) concrete with MM
48

The fundamental transverse frequency of the specimen was determined using an impactresonance device in accordance with the proposed revision of ASTM C 215. The equipmentused for the test is shown in Figure A. 10. The impactor used to excite the specimen forfrequency measurement was a 1 x 0.5 x 7.75-in. (25 x 13 x 197-mm) steel bar with a weight of1.034 lb (469 g). The steel bar was used instead of a spherical impactor for practicalconvenience. Results obtained using both spherical and prismatic impactors were comparedbeforehand, and no appreciable difference was found.
Soft rubber pad supports were placed at the estimated nodal points of the specimen, atapproximately 0.224 of the length of the specimen from each end, to allow the specimen tovibrate freely. A small piezometric accelerometer (Model 303A02, PCB Piezotronics, Inc.,Depew, New York) weighing 0.113 oz was placed at mid-height on the specimen near one end.The accelerometer had a calibrated operating frequency range of 10 to 10,000 Hz, a self-resonantfrequency of 100 kHz, and a voltage sensitivity in excess of 10 mV/g. Amplitude deviation waswithin 3% full range.
Since the specimen was moist and adhesion to its surface was difficult, the accelerometer washeld tightly against the specimen with a rubber band. Soft wax with good acoustic propertieswas used between the accelerometer and the specimen surface, which frequently was rough, toensure good mechanical contact. The soft wax also provided some adhesion and kept theaccelerometer from slipping.
The specimen was struck lightly at mid-height near its middle in the same direction as theprimary axis of the accclerometer. The accelerometer was connected to a power unit supplied bythe same manufacturer. The output signal from the power unit was sent to a digital acquisition(DAQ) board in a PC computer. The board (Model AT-MIO-16L-9, National Instruments,Austin, Texas) is a 12-bit, multipurpose, multiple-gain, 16 single-ended or 8 differential channel,input-output, plug-in board, with a 9 jas analog-to-digital converter, permitting sanlpling rates ofup to 90,000 to 100,000 samples per second. The board was used within an 80386-based 20MHz stand-alone microcomputer.
The software used to set up and operate the DAQ board was also provided by NationalInstruments. This software, LabWindows version 2.0 with the Advanced Analysis Libraryoption, permitted standard programming languages to be used (together with special functioncalls provided with the software) to control or program data acquisition and to optionally performanalysis on the data and save the data or analysis to computer files. The programming languageused in this application was Microsoft QuiekBASIC version 4.0.
The program was written so that data acquisition of the output from the accelerometer was self-initiating (i.e., a jump in voltage from the accelerometer would initiate data acquisition). Thesampling rate was 50 kHz with 2,048 sample points collected. The program transformed the datato time-based values and, using a LabWindows function call, conducted a fast Fourier transform(FFT) on the first 1,024 data points. The program examined the FFT output and selected thefrequency with the largest amplitude as the fundanaental or resonant frequency.
49
The program then used the resonant frequency., in combination with the mass of the specimen, tocompute the dynamic modulus of elasticity of_he specimen based on the following equationgiven in ASTM C 215:
E = CWr,'2
where W = weight of specimen, lbsn = fundamental transverse frequency, HzC = 0.00245 (L3T/bt3), sec2/in2, for a prismL = length of specimen, in.t, b = dimensions of cross-section of prism, in. (t is the direction in which the
prism is driven)T = a correction factor obtained from a table given in ASTM C 215 = 1.4
(T depends on the ratio of the radius of gyration to the length of the specimen,and on Poisson's ratio).
The resonant frequency test was conducted three times to observe,' the repeatability of the results.If any one reading deviated from the average of three measurements by more than 10%, thereading was ignored and the test was repeated. The average of the three final readings was thenrecorded.
After all the specimens were tested, they were returned to the freezing-thawing chamber andplaced at different locations before the freezing-thawing cycles were resumed. Each specimenwas subjected to the freezing-thawing test for 300 cycles or until its dynamic modulus becameless than 80% of its original value, whichever occurred first.
A set of control specimens kept in water at room temperature was also tested for resonantfrequency at the same time as the freeze-thaw specimens. The change in dynamic modulus of thecontrol specimen reflected the effect of strength variation of the concrete.
6. 3.2 Specimen Preparation
Six groups of specimens of VHS concrete using Type I cement with CG, MM, DL, or RG asaggregates were produced for the freezing-thawing tests. Silica J_hmewas used with each of thefour aggregate types, but fly ash was used only with the concrete mixtures containing CG andDL. Each group consisted of a set of three freezing-thawing spezimens and one or two controlspecimens. In addition to the freezing-thawing specimens, a 6 x 6 x 24 in. (150 x 150 x 600 mm)prism was also cast from which the specimens for rapid chloride permeability and AC impedancetests were later obtained.
The mixture proportions, strength, and plastic: properties of the concrete used for the testspecimens are detailed in Tables 6.8a and 6.8b. The concrete was placed in the molds, vibratedwith a needle vibrator, and finished with a magnesium float. A ,:hermocouple wire was placed inone of the freezing-thawing specimens to measure the concrete lemperature in the freezing-
50
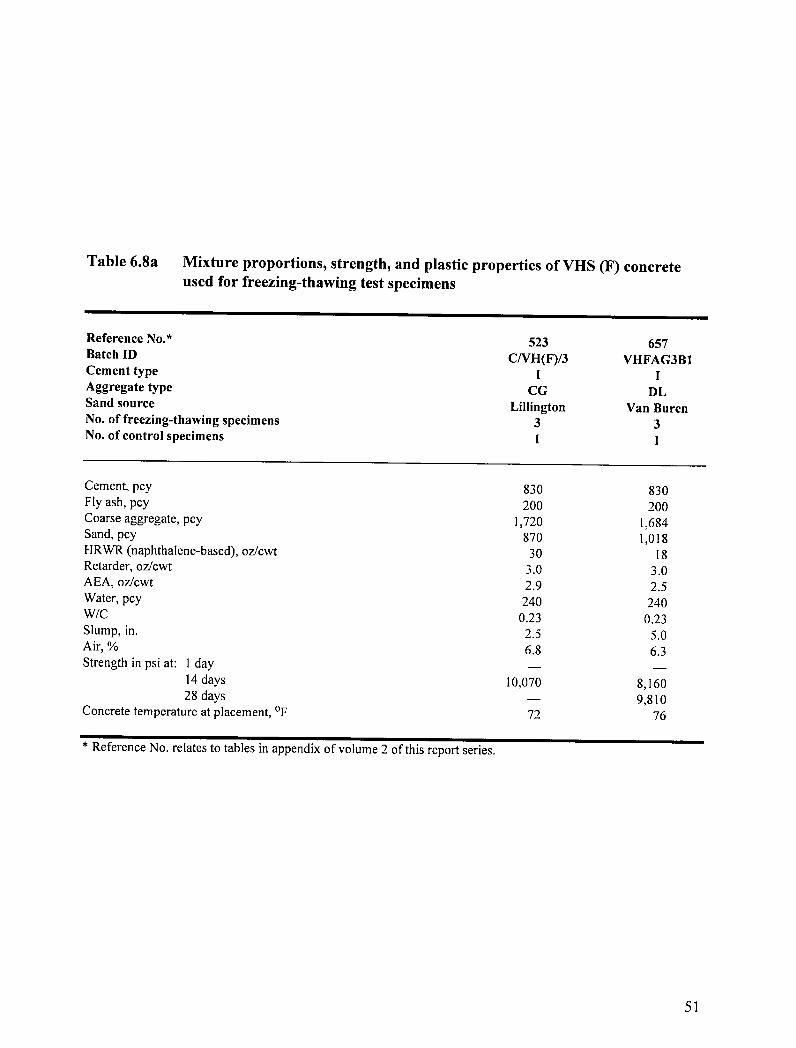
Table 6.8a Mixture proportions, strength, and plastic properties of VHS (F) concrete
used for freezing-thawing test specimens
Reference No.* 523 657
Batch ID C/VH(F)/3 VHFAG3BICement type 1 IAggregate type CG DLSand source Lillington Van Buren
No. of freezing-thawing specimens 3 3No. of control specimens 1 1
Cement, pcy 830 830Fly ash, pcy 200 200Coarse aggregate, pcy 1,720 1,684Sand, pcy 870 1,018HRWR (naphthalene-based), oz/cwt 30 18Retarder, oz/cwt 3.0 3.0
AEA, oz/cwt 2.9 2.5Water, pcy 240 240W/C 0.23 0.23
Slump, in. 2.5 5.0Air, % 6.8 6.3
Strength in psi at: 1 day -- --14 days 10,070 8,16028 days -- 9,810
Concrete temperature at placement, °F 72 76
* Reference No. relates to tables in appendix of volume 2 of this report series.
51

Table 6.8b Mixture proportions, strength, and plastic properties of VHS (S) concrete
used for freezing-thawing test specimens
Reference No.* 518 608 556 667
Batch ID C/VH(S)/3 R/VH(S)/3 MNH(S)/3 VHSFT08Cement type I I I !Aggregate type CG RG MM DLSand source Lillington Memphis Lillington Van Buren
No. of freezing-thawing specimens 3 3 3 3No. of control specimens I 1 1 1
Cement, pcy 760 760 760 770Silica fume, pcy 35 35 35 35
Coarse aggregate, pcy 1,721) 1,650 1,570 1,684Sand, pcy 1,206 1,160 1,140 1,252HRWR (naphthalene-based), oz/cwt 14 14 12 17Retarder, oz/cwt 2 3 2 3AEA, oz/cwt 0.9 0.9 0.6 1.5
Water, pcy 230 220 240 230W/C 0.29 0.28 0.30 0.29
Slump, in. 2.7.5 -- 4.25 3.5Air, % 5 8 5.6 5.8Strength in psi at: 1 day 5,750 ....
14 days 11,780 7,420 6,700 8,62028 days --- 8,000 -- 9,810
Concrete temperature at placement, °F 80 69 77 76
* Reference No. relates to tables in appendix of volume 2 of this report series.
52
thawing chamber. All specimens were moist-cured for 14 days before they were subjected to thefeezing-thawing test.
6.3.3 Test Results and Discussion
The results of the freezing-thawing tests expressed in terms of durability factor are summarizedin Table 6.9. Durability factor is defined as
D.F. = (E/Eo) x (N/300)
where Eo = initial dynamic modulus of specimenN = number of cycles of freeze-thaw up to 300E = dynamic modulus of specimen after N cycles of freezing-thawing
Figures 6.14 through 6.17 show the typical behavior of selected groups of test specimens interms of the effect of freezing-thawing on the relative dynamic modulus of each specimen.
Table 6.9 shows that only one group of test specimens failed the freezing-thawing test. The threespecimens of R/VH(S)/3 failed completely after only 42 cycles of freezing and thawing. Theirfailure was due to the weakness of the coarse aggregate used in the concrete. There was clearevidence of disintegration of the coarse aggregate at failure. The RG coarse aggregate fromMemphis, Tennessee had an absorption of about 5% but pore sizes of about 0.10 microns (asobserved in scaning electron micrographs), the worst possible situation for freezing-thawingdeterioration (Hansen 1993).
The results of these tests indicate that VHS concrete can be produced with enhanced durability ifit has a minimum air content of 5°/'0and the coarse aggregate used is not susceptible to freezing-thawing damage.
53
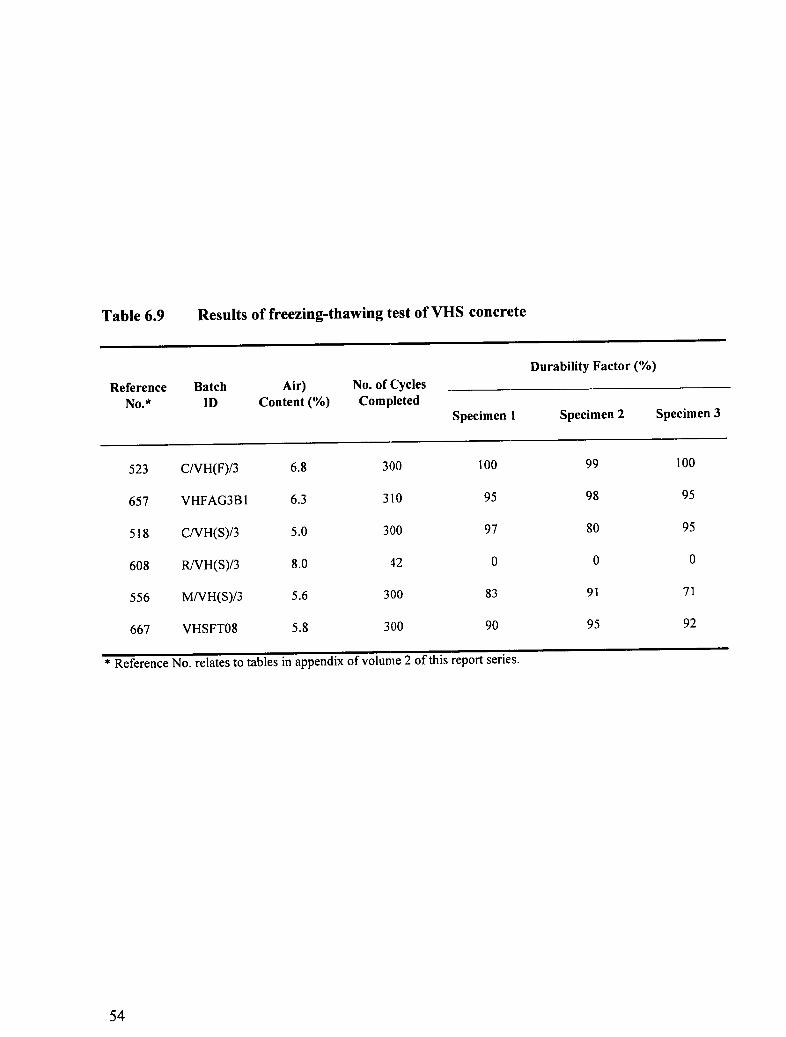
Table 6.9 Results of freezing-thawing test of VHS concrete
Durability Factor (%)Reference Batch Air) No. of Cycles
No.* ID Content (%) Completed
Specimen 1 Specimen 2 Specimen 3
523 C/VH(F)/3 6.8 300 100 99 100
657 VHFAG3B 1 6.3 310 95 98 95
518 C/VH(S)/3 5.0 300 97 80 95
608 R/VH(S)/3 8.0 42 0 0 0
556 M/VH(S)/3 5.6 300 83 91 71
667 VHSFT08 5.8 300 90 95 92
* Reference No. relates to tables in appendix of volume 2 of this report series.
54
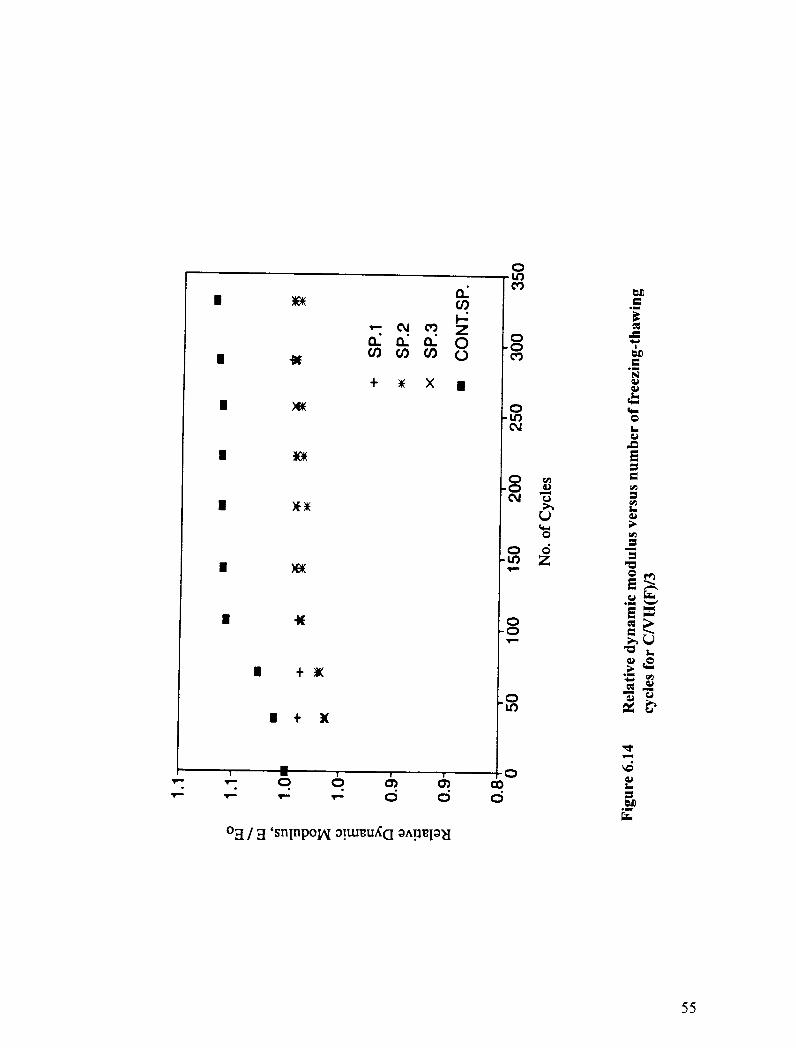
0
n" _I _ (/) .._
I,-: _:
n" n" ,.," 0 o .,-o _*_
N_a
L
I _ o _=•1._ @L_I I.
_a.¢=
I _e_ E=
I )_ _ "_ ,_
_ @
E_o_ _
E=I -lie 0 _.
I + _ ;"mm
" _I + tK
, I o _d_a
"- "" "- "- 0 0 (:5 =.__
08 / .q 'snlnpoN 3!ttn_ugcIOA.Ill_[O_I
55
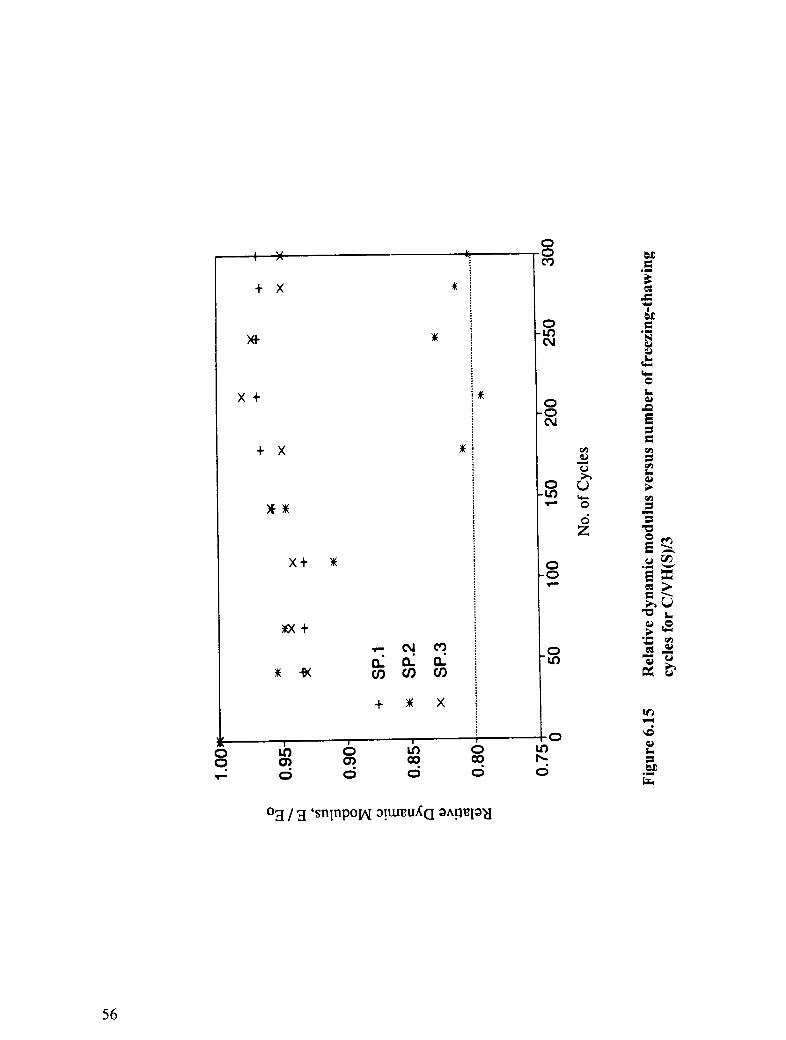
0
e_ .E
+ X _
,y
0 =- L,t'_ N
@
X+ _ '-¢,1,o-0
+ X _ _
X'_ ','- o =6 =;z; "=
E_X+ )_ 0 _
-o E
_+ _._""
_ ._ ,.," a.. ,', "_ _ _.
+ _ X
1 -0 "=
oq / _I'snlnpol,q o!turu,_oOA_.I_[O_I
56

0
=
0 o =0 '_" N
&CO ok
OrJl
o
, I 0 ,-.o _ o _ 6 _ o•- ,- ,- d d d d _"
o_ / H 'snlnpolAI o!tmzu,(o OA!llZlO_[
57
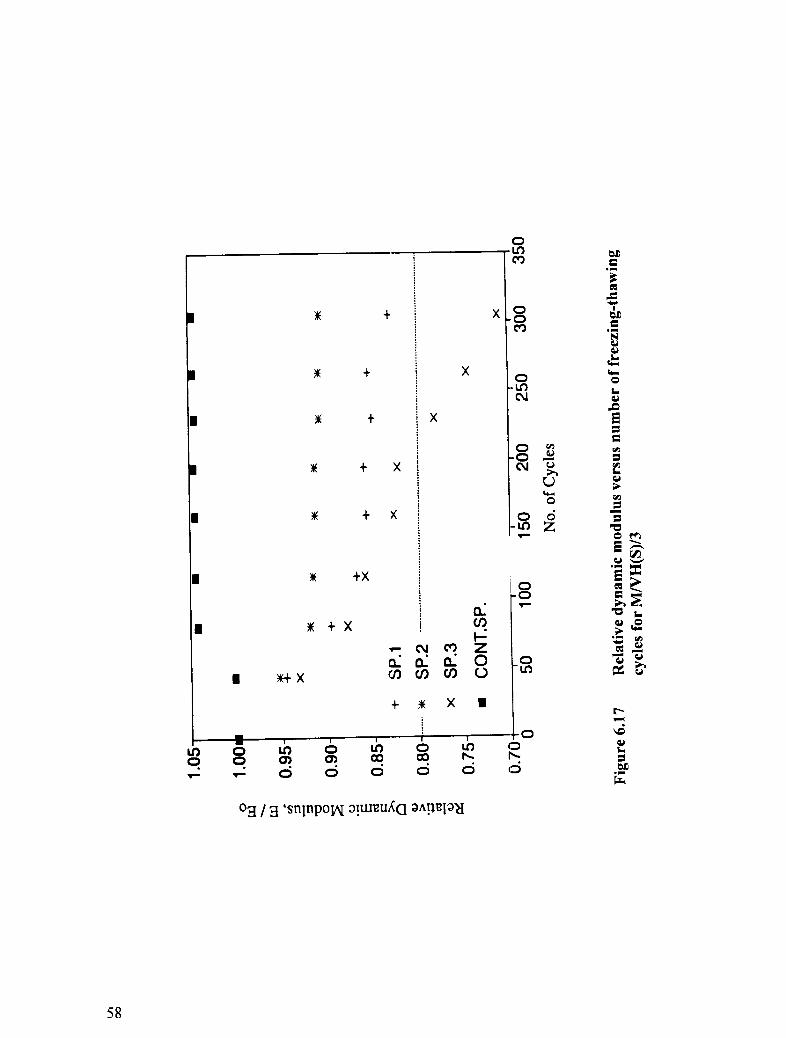
0
(0 =om
c_
+ x o
&iDa _ + X o o
OJ c_.o
.m _ + x=
m _ + x c_ _ r.
o =m _ + x o d -_
E_r_m
m _ +x o "_=
E I_ ,F- "_ t.
mm _+x : _ "_
o o• _x oo co _o
x • N,,...
.. _ .o0') O_ O_ cO I_ h., =0
,,.- ,- c5 c5 c5 d c5 ,5 .._
o_i / _ 'snlnpoN _!ureuXo o^!lel_I
58

6.4 Shrinkage Tests
The shrinkage tests were conducted on test specimens of 4 x 4 x 11.25-in (100 x 100 x 281-mm)prisms for a period of up to 90 days. Three replicate specimens were tested for each type ofcoarse aggregate. The overall program for the shrinkage tests is outlined in Table 6.3.
6. 4.1 Test Setup and Procedure
The shrinkage tests were conducted in accordance with ASTM C 157. A digital dial gage (OKOSOKKI model DG 154) was used to measure length changes. The gage had a range of 2 in. (50mm). A view of the shrinkage test is shown in Figure A.11.
6.4.2 Specimen Preparation
The 4 x 4 x 11.25-in. (100 xl00 x 281-mm) prisms were cast in steel molds, internally vibratedwith a needle vibrator, and finished with a magnesium float. The specimens with molds wereprotected from moisture loss by covering them with plastic sheets. The specimens were strippedat 24 hours. Upon removal of the specimens from the molds, the specimens and the standardcalibration bar were placed in water maintained at 73°F for a period of 30 minutes before beingmeasured for length. This was done to equalize the temperature of the specimens and the bar.
After the initial readings, the specimens were cured in lime-saturated water for 28 days. Duringthis period, the specimens were removed from the water only for measurements. Subsequently,they were stored in air under normal laboratory conditions.
6. 4. 3 Test Results and Discussions
The results of the shrinkage tests for VHS (F) and VHS (S) concretes are summarized in Table6.10. The results for VHS (F) concrete indicate that at 90 days, the average shrinkage strain was521 microstrains for the concrete with CG. The variation of the shrinkage strains with time forVHS (F) concrete with CG and for VHS (S) concrete with three types of coarse aggregates isshown in Figure 6.18. These curves are based on average measurements of three replicatespecimens. It can be seen that the curves for VHS (F) concrete with CG and for VHS (S)concrete with MM and RG show an initial expansion where readings were taken at early ages.This phenomenon is common for shrinkage specimens stored in water, according to ACICommittee 209 (1993a). For VHS (S) concrete with MM and RG, the shrinkage strains at 90days were much smaller (-72 to 124 microstrains) than the generally accepted values (700 to 800microstrains) for conventional concretes. However, for VHS (S) concrete with CG the averageshrinkage strain at 90 days was 361 microstrains, which is about 50% of the generally acceptedvalue for conventional concrete. The general trend of variation of shrinkage strains with time forVHS concretes was similar to that generally accepted for conventional concrete.
Note that the coarse aggregate in a concrete provides a restraining effect on the drying shrinkageof pure cement paste. The amount of restraint provided by the aggregate depends on the amount
59
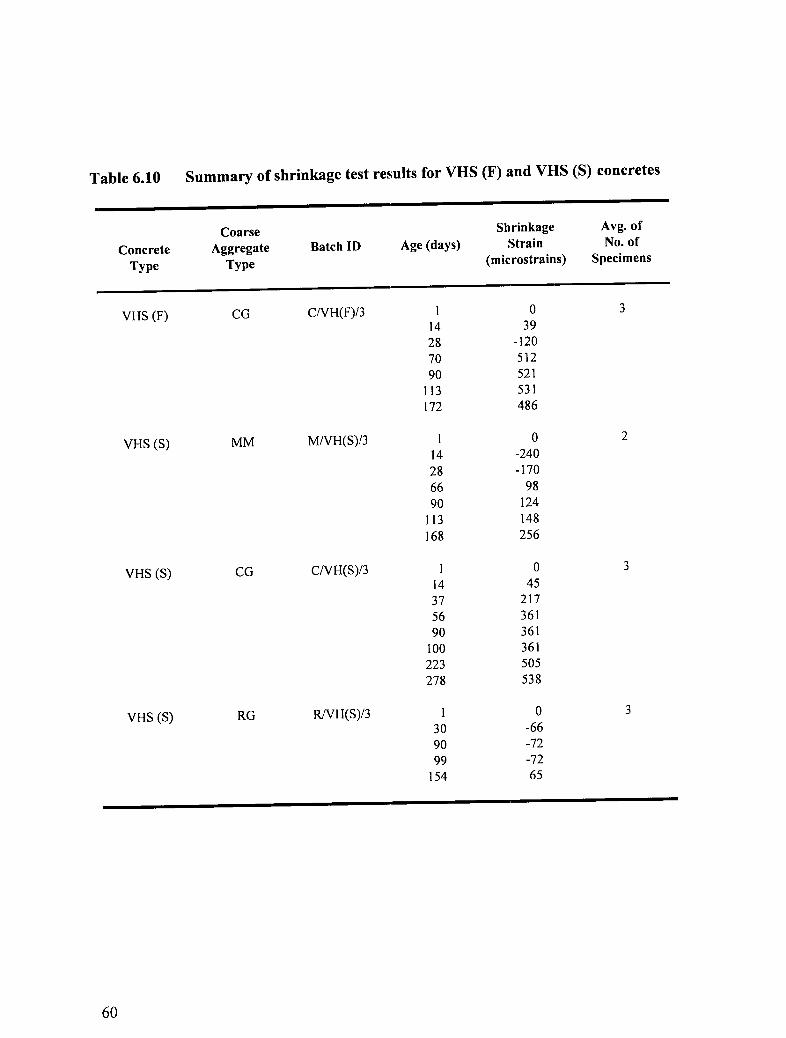
Table 6.10 Summary of shrinkage test results for VHS (F) and VHS (S) concretes
Coarse Shrinkage Avg. ofConcrete Aggregate Batch ID Age (days) Strain No. of
Type Type (microstrains) Specimens
VHS (F) CG C/VH(F)/3 1 0 314 3928 -12070 51290 521
113 531
172 486
VHS (S) MM M/VH(S)/3 1 0 214 -24028 -17066 98
90 124113 148168 256
VHS (S) CG C/VH(S)/3 l 0 314 4537 21756 361
90 361I00 361223 505278 538
VHS (S) RG R/VH(S)/3 1 0 330 -6690 -7299 -72
154 65
60

0.0006
VHS(F)/CG
e. 0.0004im
L-
U_ VHS(S)/MM_) 0.0002o)tu
e-"-,_ VHS(S)/RG¢: 0
-0.0002
i i ! • i
0 50 100 150 200 250 300
Time (days)
Figure 6.18 Variation of shrinkage strain with time for VHS concretes
of coarse aggregate, the stiffness of the concrete; and the maximum size of the coarse aggregate(Mindess, 1981). The stresses due to drying shrinkage at the interface between cement paste andaggregate increase as the maximum aggregate size increases (Mindess, 1981). The size andshape of a concrete specimen determine the rate of moisture loss and hence the rate andmagnitude of drying shrinkage. The absorption characteristics of the coarse aggregate alsoinfluence the shrinkage characteristics of the concrete, especially during early ages. The lengthof diffusion path also has a strong influence on the rate of moisture loss, which in turn affects theshrinkage characteristics.
ACI Committee 209 (1993a) recommends a set of empirical equations that allow shrinkagestrains to be estimated as a function of drying and relative humidity. The value of the ultimateshrinkage strain recommended by ACI Committee 209 is 730 x l 0-6in./in. The magnitude ofultimate shrinkage strain is difficult to estimate accurately because it depends on a number offactors including W/C, degree of hydration, presence of admixtures, and cement content. Theaverage shrinkage strain at 90 days for VHS (F) concrete with CG was 521 microstrains. Theaverage strains at 90 days for VHS (S) concrete varied from an expansion strain of 172microstrains for concrete with RG to a shrinkage strain of 361 microstrains for concrete with CG.
61
6.5 Creep Tests
The creep tests were conducted on 4 x 8-in. (100 x 200-ram) cylinders for a period of 90 days.Three replicate specimens were tested for each type of coarse aggregate. The test program isoutlined in Table 6.3.
6. 5.1 Test Setup and Procedure
The tests were conducted in accordance with ASTM C 512-87. A special creep frame wasfabricated to accommodate three 4 x 8-in. (100 x 200-mm) cylinders along with 4 x 4-in. (100x100-mm) cylinders at each end to minimize the end effects.
6.5.2 Specimen Preparation
The 4 x 8-in. (100 x 200-mm) cylinders were cast in plastic molds, internally vibrated inaccordance with section 5.2 of ASTM C 512. Mong with three specimens for the creep tests,four additional specimens were also cast. Three of the four additional specimens, referred to as"control" cylinders, were tested for strength; the fourth 4 x 8-in. (100x200-mm) cylinder wasused to obtain the 4 x 4-in. (100 x 100-mm) end cylinders to be used in the creep frame. Thespecimens with molds were protected from moisture loss by covering them with plastic sheets.The specimens were removed from the molds after 24 hours. Upon removal, the specimens weremoist-cured in a curing room with 100% relative humidity for a period of 28 days. At the age of28 days, the three control 4 x 8-in. (100 x 200-ram) cylinders were tested for strength. The threespecimens for the creep tests were capped with sulfur capping and placed in the creep framealong with the 4 x 4-in. (100 x 100-mm) end cylinders. The creep frame was located in a roomwith controlled temperature and humidity. During the creep tests, the temperature and relativehumidity were maintained at 73°F and 50% respectively. In placing the creep specimens in thecreep frame, special care was taken in aligning the specimens to avoid eccentric loading. Thecreep specimens were loaded to 40% of the average compressive strength determined from thestrength tests of the control cylinders. A load cell was used to monitor the load. The creepdeformations were recorded periodically by a Whitmore gage. The load level was also checkedperiodically, and necessary adjustments were :made to ensure that the load level was maintainedfor the duration of the creep tests.
6.5.3 Test Results and Discussion
The results of the creep tests for VHS (F) and VHS (S) concretes are shown in Figures 6.19a and6.19b. These curves are averages of three replicate specimens. Note that the total creep strain ineach case was obtained by subtracting the inflial elastic strain and the shrinkage strain ofunloaded control specimens from the total measured strain of the creep specimens. Specificcreep in each case was obtained by dividing fhe total creep strain by the applied stress.
The results for VHS (F) concrete indicate that the creep behavior of concrete is influenced by thetype of coarse aggregate. The role of the aggregate in influencing creep behavior is similar to the
62

0.0016MM
0.0012 ---------CG
L_
¢n 0.0008D..
G)I,,,,
O0.0004
0_ f'_ .......0 10 20 30 40 50 60 70 80 gO
Load Time (days)
Figure 6.19a Variation of creep strain with time for VHS (F) concrete
0.0018 cG
0.0016 MM
0.0014
=m
"_ 0.0012x_
or)0.001
(9(1)L.
O 0.0008 Ra
0.0_6
0.00040 10 20 30 40 50 60 70 80 90
Load Time (days)
Figure 6.19b Variation of creep strain with time for VHS (S) concrete
63
role of aggregate in influencing shrinkage beb.avior. The coarse aggregate acts as a restraint toreduce the potential deformations of the paste. Thus, the aggregate content and the modulus of
elasticity are the more important parameters affecting the creep of the concrete. Aggregate size,grading, and surface texture have little influence (Mindess, 1981). VHS (F) concrete with RG
exhibits larger total creep strains as well as larger specific creep ,;trains compared with VHS (F)concrete with CG and MM (see Figure 6.19a) Note that although MM is softer than the other
aggregates, concrete with MM exhibits smaller total creep strains as well as smaller specificcreep strains compared with the relatively stiffer aggregates.
For VHS (S) concrete, the creep strain at 90 days for concrete with MM is larger than forconcretes with CG and RG. The variation of the creep strain with time is similar to that for VHS
(F) concrete except for VHS (S) concrete with MM. The results (see Figures 6.19a and 6.19b)also indicate that addition of silica fume instead of fly ash to obtain VHS concrete appears toreduce both the total and the specific creep strains for concrete with RG and CG. For VItS
concretes with MM, the results of specific creep strains for VHS (S) concrete appear to beinconsistently higher than for VHS (F) concrete with MM coarse aggregate. The results indicatethat the specific creep strain for VHS concretes ranges from 20% to 50% of the specific creepstrain of conventional concrete with a strength of 4,000 psi (28 MPa).
6.6 Rapid Chloride Permeability Tests
6. 6.1 Test Setup and Procedure
The rapid chloride permeability test (RCPT) v_asperformed in accordance with AASHTO T 277-83 and the identical ASTM C 1202. The typical specimen was a 2-in. (50-mm) thick slice sawedfrom the top of a 3.75-in. (94-mm) diameter core from a concrete prism cast at the same time asthe freezing-thawing test specimens (Section 6.3.2). The top of the specimen was the finishedsurface that would be exposed to chloride ions.
The specimen was prepared by vacuum saturation and by soaking in water for 18 hours (FigureA. 12). The specimen was then sealed in the test cells. The cell connected to the top surface ofthe specimen was filled with 3% sodium chloride (NaC1) solution, and the cell connected to the
bottom surface of the specimen was filled with 0.3 N sodium hydroxide (NaOH) (Figure A. 13).Two replicate specimens were always tested concurrently. Both specimens were energizedcontinuously with 60 V DC between the cells (Figure A. 14). The current flowing through theconcrete specimen was measured and plotted on a strip chart recorder for 6 hours (Figure A. 15).A switching unit was built to allow two measurements to be alternately plotted on one strip chart.The total time required to complete each test was about 33 hours. The test procedure followedthese steps:
1. Obtain two 3.75-in. (94-mm) diameter concrete samples by coring through a 6 x 6-in.(150 x 150-mm) prism, oriented as cast, when the concrete is 12 days old. (Two days
64

are allowed for specimen preparation so that actual testing can be started at 14 days.)Keep the samples in a plastic bag.
2. Saw a 2-in. (50-mm) slice from the top of each core. Surface-dry the specimens for10 minutes after cutting. Mark ID on each specimen and clearly identify its topsurface. Keep the specimens in a plastic bag.
3. Boil 2 liters of water vigorously to de-air the water. Do not cap the boiling pot.Allow the water to cool.
4. Prepare clear epoxy; brush on side surface of each specimen. Allow the epoxy to cureas per manufacturer's instructions (use a type that will cure in 1 hour or less).
5. Place both specimens, separated slightly, in a tilted position in a beaker, then placethe beaker in a vacuum-type desiccator and start vacuum (1 mm Hg abs.). Maintainvacuum for 3 hours.
6. While keeping the vacuum pump running, fill the beaker with the boiled water until itsubmerges the specimens.
7. Continue running the vacuum pump for 1 additional hour.
8. Turn the pump off and allow air to enter the desiccator.
9. Allow both specimens to remain in the beaker to soak in water for 18 hours.
10. Remove the specimens from the beaker, blot off water, and place the specimens in a
plastic bag.
11. Place a small amount of silicon sealant on the brass shim around the inside perimeter
of each cell. Place the specimen in the cell assembly with its top side toward theNaC1 cell. Apply liberal amounts of silicon sealant around the specimen to seal it tothe cells. Allow the sealant to cure as per manufacturer's recommendations (use a
type that will cure in about 1 hour).
12. Fill (-) cell (top side) with 3% NaC1 solution. Fill (+) cell with 0.3 N NaOH.Connect wires as marked with negative to NaC1 and positive to NaOH. Turn on
power, set to 60.0+0.1 v DC, and turn on plotter. Set plotter at 1 v full scale (this isactually 0.985 A full scale on NCSU's plotter) and 2 in./hr. Record time and IDnumber on plotter paper. Run the test for 6 hours.
13. Remove the specimens from the test cells. Rinse the cells and clean the assembly.
14. Integrate the area under the curve produced by the plotter in units of ampere-seconds(i.e., coulombs) and record results.
65

6. 6. 2 Test Results and Discussion
A total of seven groups of specimens of VHS concrete were subjected to the RCPT (Table 6.11).Each group consisted of two replicate specimens that were tested concurrently in two separateRCPT cells. A typical output strip chart from the RCPT is shown in Figure A. 16. The abscissarepresents time, obtained at a chart rate of 5 cm/hr for approximately 6 hours. The ordinaterepresents current (in amperes) flowing through the specimen, with a chart calibration of fullscale being equal to 0.985 A for the particular plotter used.
As described above, two replicate specimens were tested together and both were energizedcontinuously for 6 hours. However, the current flowing through each specimen was measuredand plotted alternately on the strip chart. The average area under the curve in ampere-seconds(coulombs) is the total charge that passed through the specimen in 6 hours. The initial current inamperes is the average ordinate just after the test was started.
It can be seen that the amount of current flowing through the spe_:imen tended to increase duringthe RCPT, due at least in part to the temperature increase in the specimen. This heating problemwas, in turn, caused by the current. Thus the question was raised whether the initial current,which is also an indirect measure of the concrete conductance, could be used in lieu of the total
charge as a more convenient way to obtain data for the RCPT. If so, 6 hours of testing timecould be saved. It is encouraging to observe that a comparison of the initial current with the totalcharge for each of the seven groups of testing (Table 6.11) indicates a good correlation betweenthe two measurements.
Note that both the freezing-thawing test and the RCPT were performed for six of the sevengroups of specimens. As discussed in Section 6.3.3, only one of the six groups failed thefreezing-thawing test because of deterioration of the coarse aggregate (i.e., RG). However, eventhough the specimens failed the freezing-thawing test, their coulomb values from the RCPT werereasonably low.
6.7 AC Impedance Tests
The objective of conducting the AC impedance test was to examine its potential as a reasonablealternative to the RCPT for more rapid determination of concrete permeability. The goal was toexplore a faster method that could be more versatile and portable. The method would also avoidelaborate test setups and specimen preparation as well as expensive and time-consumingprocedures. The use of external measurement terminals would allow more versatility thaninternal terminals used for the RCPT. A "point source" type of test such as the AC impedancetest would be also more versatile since it could be adapted more easily to specimens of differentshapes.
66

Table 6.11 Results of rapid chloride permeability test (RCPT) of VHS concrete
Freezing- Durability Factor (%) RCPTReference Batch Air Thawing
No.* ID W/C (%) Cycles Initial TotalSp. 1 Sp. 2 Sp. 3 Current (A) Charge (C)
523 C/VH(F)/3 0.23 6.8 300 !00 99 100 0.087 2,366
563 M/VH(F)/3F1 0.23 10.6 ........ 0.186 6,500
657 VHFAG3B1 0.23 6.3 310 95 98 95 0.144 3,260
518 C/VH(S)/3 0.29 5.0 300 97 80 95 0.028 510
608 R/VH(S)/3 0.28 8.0 42 0 0 0 0.118 3,120
556 M/VH(S)/3 0.30 5.6 300 83 91 71 0.090 2,149
667 VHSFT08 0.29 5.8 300 90 95 92 0.140 3,155
* Reference No. relates to tables in appendix of volume 2 of this report series.
The RCPT measures total conductance of a specimen rather than conductivity. Similarly, the AC
impedance test measures total resistance (in ohms), which may be more indicative of the gross
concrete properties than resistivity. As long as the test could classify concrete as accurately as
the RCPT, it would be a satisfactory alternative.
6. 7.1 Test Setup and Procedure
Currently there are no AASHTO or ASTM standards for the AC impedance test. The test for this
investigation was conducted using a Kohlrausch bridge instrument (Model 4000, AEMC
Instruments, Boston). The Kohlrausch bridge uses 1,000 Hz AC with an accuracy of 1% on the
impedance measurement. Eight impedance ranges can be selected using pushbuttons; usually the
1-10 kf_ range was used. The voltage actually placed across the specimen was measured to be
about 0.20 v. Six 1.5 v AA batteries were used as power supply. The general setup is shown in
Figure A. 17.
A good electrical connection between the Kohlrausch bridge terminals and the concrete specimen
was ensured by using potassium agar gel. The impedance (resistance) was measured at five
random points on each specimen (see Figure A. 18).
The AC impedance test was conducted in conjunction with the RCPT at three different stages:
67
1. after the RCPT specimens were cut, but before they were subjected to the vacuumsaturation process;
2. after the specimens were vacuum-saturated, but before they were subjected to RCPT;
3. after the specimens were subjected to RCPT.
Therefore the specimens for the AC impedance test were prepared exactly in the same manner asfor the RCPT. The AC impedance test procedure followed these steps:
1. After the specimen is cut from a 3.75 in. (95.3 mm.) concrete core, air-dry thespecimen to avoid wet surfaces that may distort the electrical measurements.
2. Connect two electrode wires to the Kohlrausch bridge (which is similar to aWheatstone bridge), with the sepecimen placed into one arm of the bridge. The freeend of each wire should have a flattened piece of solder, about 0.25-in. (6.4-mm)diameter, as electrode. Virtually any type of electrical wire can be used to connect theconcrete specimen into the bridge circuit since the current is very small. A wirelength of about 18 in. (450 ram) is recommended.
3. Put a rubber glove on the hand that will press the electrodes onto the concretespecimen.
4. Dip the solder ends of the wires into potassium agar gel to obtain a small amount ofgel, which ensures good conductivity between the electrodes and the concrete.
5. Press the solder flat ends against the two flat surfaces of the test specimen and holdthem in place with the thumb and middle finger of one hand. With a little practice, agood connection can be made by feel. Also, the gel "fingerprint" should be kept smalland consistent throughout the testing.
6. Balance the Kohlrausch bridge circuit and record the impedance measurement (inohms).
7. Repeat the measurement at five random locations on the flat surfaces of each of thereplicate specimens. Be careful not to allow the gel fingerprint to overlap, as this willaffect the conductance.
6. 7. 2 Test Results and D&cussion
AC impedance tests were conducted along with the RCPT on four groups of VHS concretespecimens (Table 6.12). (The AC impedance test was not conducted at Arkansas on concretewith DL.) As mentioned above, AC impedance was measured live times on each of two replicate
68
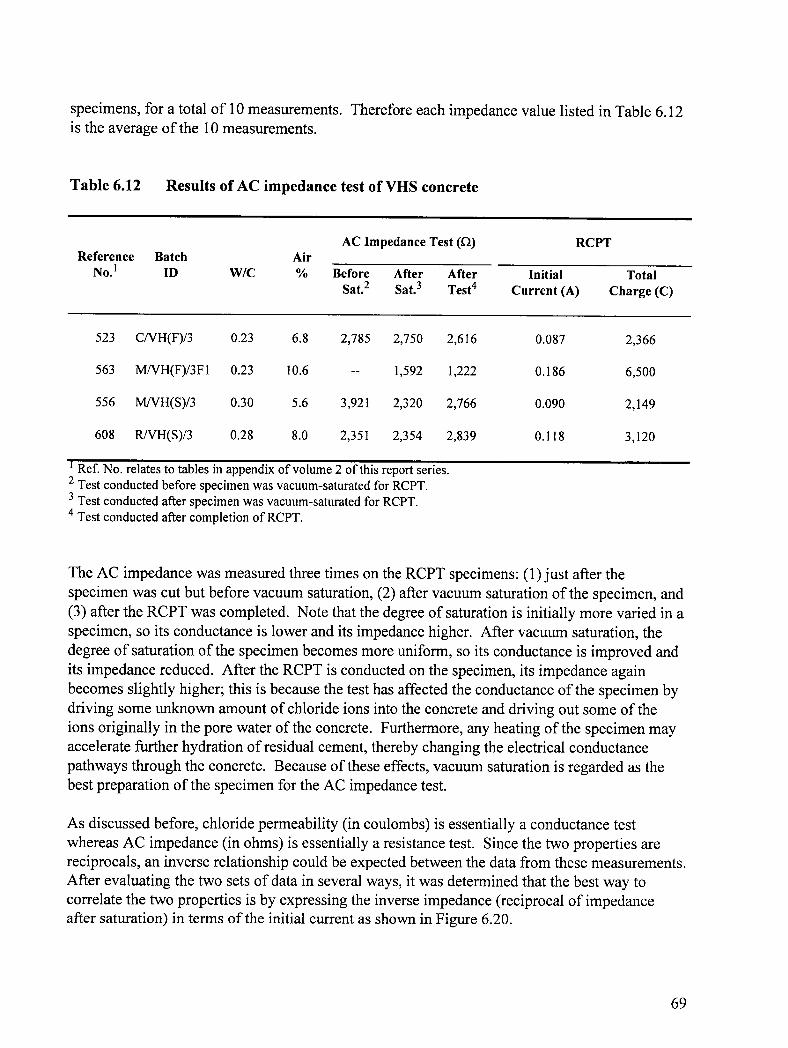
specimens, for a total of 10 measurements. Therefore each impedance value listed in Table 6.12is the average of the 10 measurements.
Table 6.12 Results of AC impedance test of VHS concrete
AC Impedance Test (f2) RCPTReference Batch Air
No. 1 ID W/C % Before After After Initial Total
Sat. 2 Sat. 3 Test 4 Current (A) Charge (C)
523 C/VH(F)/3 0.23 6.8 2,785 2,750 2,616 0.087 2,366
563 M/VH(F)/3 F1 0.23 10.6 -- 1,592 1,222 0.186 6,500
556 M/VH(S)/3 0.30 5.6 3,921 2,320 2,766 0.090 2,149
608 R/VH(S)/3 0.28 8.0 2,351 2,354 2,839 0.118 3,120
Ref. No. relates to tables in appendix of volume 2 of this report series.2 Test conducted before specimen was vacuum-saturated for RCPT.3 Test conducted after specimen was vacuum-saturated for RCPT.4 Test conducted after completion of RCPT.
The AC impedance was measured three times on the RCPT specimens: (1)just after thespecimen was cut but before vacuum saturation, (2) after vacuum saturation of the specimen, and(3) after the RCPT was completed. Note that the degree of saturation is initially more varied in aspecimen, so its conductance is lower and its impedance higher. After vacuum saturation, thedegree of saturation of the specimen becomes more uniform, so its conductance is improved andits impedance reduced. After the RCPT is conducted on the specimen, its impedance againbecomes slightly higher; this is because the test has affected the conductance of the specimen bydriving some unknown amount of chloride ions into the concrete and driving out some of theions originally in the pore water of the concrete. Furthermore, any heating of the specimen mayaccelerate further hydration of residual cement, thereby changing the electrical conductancepathways through the concrete. Because of these effects, vacuum saturation is regarded as thebest preparation of the specimen for the AC impedance test.
As discussed before, chloride permeability (in coulombs) is essentially a conductance testwhereas AC impedance (in ohms) is essentially a resistance test. Since the two properties arereciprocals, an inverse relationship could be expected between the data from these measurements.After evaluating the two sets of data in several ways, it was determined that the best way tocorrelate the two properties is by expressing the inverse impedance (reciprocal of impedanceafter saturation) in terms of the initial current as shown in Figure 6.20.
69

6.8 Concrete-to-Steel Bond Tests
Concrete-to-reinforcing steel (C-S) bond test:s were conducted to determine the concrete-steelbond strength for VHS concrete. For these tests, the specimens were designed according tocurrent ACI Code provisions for embedment length. The specimens had a cross-sectional area of6 x 15 in. (150 x 375 mm) with an embedment length of 14 in. (350 mm) and a total length of 26in. (650 mm). A No. 6 bar was centered 3 in (75 mm) from the top and protruded from bothends of the specimen. The test program is outlined in Table 6.3.
6. 8.1 Test Setup and Procedure
The test frame and general loading arrangement for the C-S bond test is shown in Figure A.19. A120 kip (534 kN) center hole jack was used to apply the load to a No. 6 reinforcing barembedded in the concrete specimen. The load was increased monotonically and the associatedslip at the loaded and free ends of the bar was monitored. The reinforcing bar was axiallyattached to a 160 ksi (1,102 MPa) smooth prestressing rod of equal diameter. This smoothprestressing rod was instrumented with electrical resistance strain gages to act as a load cell.
Bar slip was measured using dial gages accurate up to 0.0001 ir,..(0.0025 ram). At the free end,the gages were mounted with the probe touching the end of the bar. At the loaded end, the gageswere attached to the bar using a ring and set screws.
Loads were applied to the bar in increments of 2 kip (4.5 ksi, 31 MPa stress) until yieldingoccurred. Loading was stopped either upon pullout of the reinfiJrcing bar or upon reaching 125%to 140% of the yield strength of the bar. At each load increment, load was maintained for a shortperiod until the slip movements stabilized. A pictorial view of the test setup is shown in FigureA.20.
6.8.2 Specimen Preparation
The C-S bond test specimens were cast with the No. 6 bar at 2.5 in. (63 mm) from the bottom ofthe concrete beam with a concrete cover of 3 in. (76.2 mm) on each side. Polyvinyl chloride pipesleeves with a 1-in. (25-mm) inner diameter surrounded the reinforcing steel bar on either end ofthe designed embedment length of 15 in. (375 ram). This minimized the local effect from thepoint loading. The embedment length used for the No. 6 bar was computed using the ACI 318equation (1993c) based on a design strength of 5,000 psi (35 MPa) and a steel yield strength of60,000 psi (420 MPa).
7O

]lllllirl[[lllllt[llF[llFI II ".......................... IIIII,,IIII;I _ _IIIIIIIIIIIIIIIII:IIIIIIIIIIIIIIIIIIIII _ _ _
N _
m mmm __<
. _
L <.t. _
]]lllllr_rllJJll_lllll[[_l fr_llll:llJ]l]
I]lt]tlltlEll_tllllllLIIJJ]]tll]lllllL_l[l_lll!ltl]lt_ _Ettl_J_tllt_l[ll]lllll_lllllllllllltiL_tl[tllltt!l_l]]
llJItllE_lJ]tllllllll;l_l]l]lJtLItt[_t_ltlllJ]]t Jl _ _
fl_rrl]11]: ,_llllllll_E[fll flll]l]Jl_,l':'_':_]ll]ll]ll _
L .-
I I I I I I
CO CO C_ C_ v- v-
7]
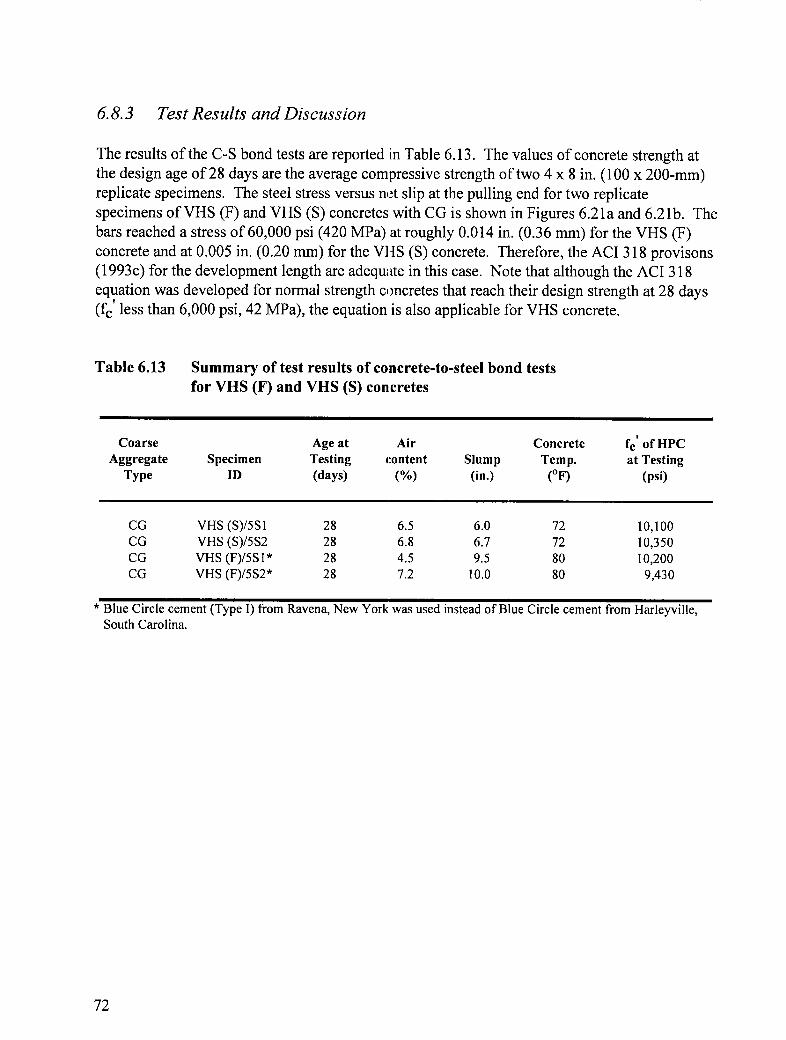
6. 8. 3 Test Results and Discussion
The results of the C-S bond tests are reported in Table 6.13. The values of concrete strength atthe design age of 28 days are the average compressive strength of two 4 x 8 in. (100 x 200-mm)replicate specimens. The steel stress versus n,_tslip at the pulling end for two replicatespecimens ofVHS (F) and VHS (S) concretes with CG is shown in Figures 6.21a and 6.21b. Thebars reached a stress of 60,000 psi (420 MPa) at roughly 0.014 in. (0.36 mm) for the VHS (F)concrete and at 0.005 in. (0.20 mm) for the VHS (S) concrete. Therefore, the ACI 318 provisons(1993c) for the development length are adequate in this case. Note that although the ACI 318equation was developed for normal strength concretes that reach their design strength at 28 days(fc' less than 6,000 psi, 42 MPa), the equation is also applicable ibr VHS concrete.
Table 6.13 Summary of test results of concrete-to-steel bond testsfor VHS (F) and VHS (S) concretes
Coarse Age at Air Concrete fc' of HPCAggregate Specimen Testing content Slump Temp. at Testing
Type ID (days) (%) (in.) (°F) (psi)
CG VHS (S)/5S1 28 6.5 6.0 72 10,100
CG VHS (S)/5S2 28 6.8 6.7 72 10,350CG VHS (F)/5S 1" 28 4.5 9.5 80 10,200CG VHS (F)/5S2" 28 7.2 10.0 80 9,430
* Blue Circle cement (Type I) from Ravena, New York was used instead of Blue Circle cement from Harleyville,South Carolina.
72
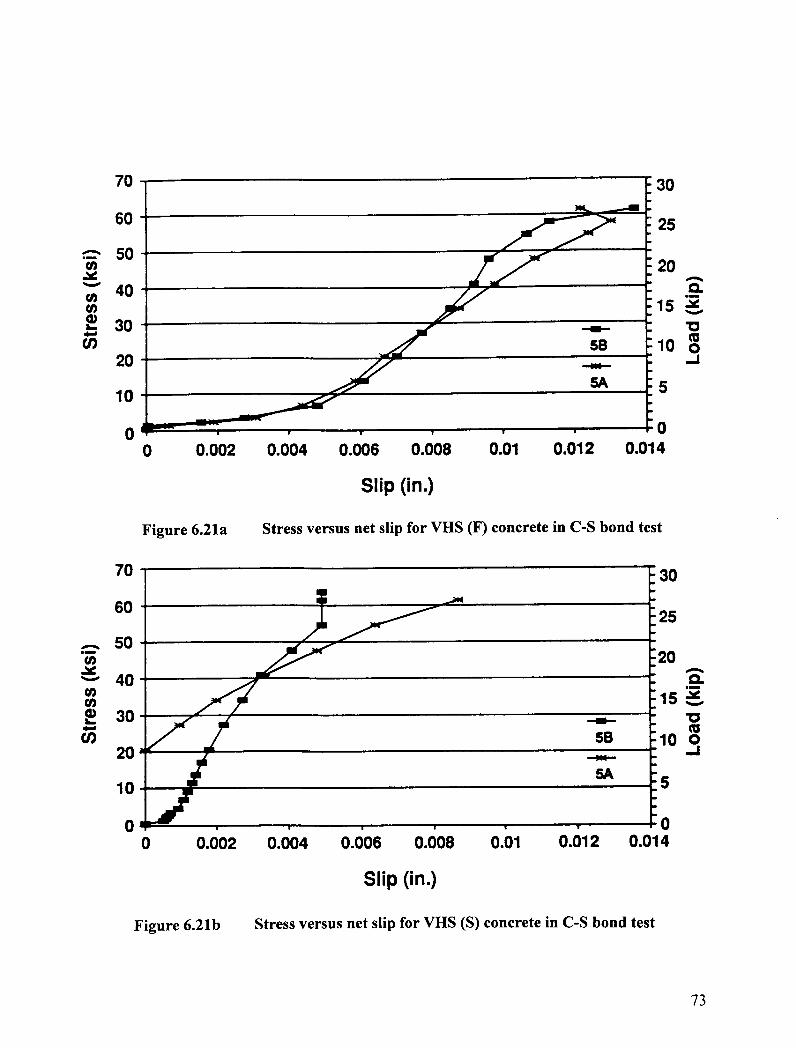
70 30
60 25
5020
40 o.m 15¢D•- 30 -4,- qoU) SB 10
20 _ -I
SA 510
0 0.002 0.004 0.006 0.008 0.01 0.012 0.014
Slip (in.)
Figure 6.21a Stress versus net slip for VHS (F) concrete in C-S bond test
70 30
60 25
_-, 50"_ 20
40 o.m 15 _
30 "oL ---IBm*-' ¢0
SB 10 020 _ ..I
5A10 5
• i | ¢ I I 0
0 0.002 0.004 0.006 0.008 0.01 0.012 0.014
Slip (in.)
Figure 6.21b Stress versus net slip for VHS (S) concrete in C-S bond test
73
7
Conclusions
This report has documented the results of an extensive program of laboratory studies on theperformance of very high strength (VHS) concrete, which is a class of high performance concretedesigned for highway applications. The laboratory studies included eight different types of test:compression, flexural and split tension, shrinkage, creep, freezing-thawing, rapid chloridepermeability, AC impedance, and concrete-to-steel bond. Based on the results of thisinvestigation, the following conclusions can be drawn:
1. Using conventional materials and equipment, but with more care than needed forconventional concrete, VHS concrete with either fly ash or silica fume as the mineraladmixture can be produced that will achieve a minimum compressive strength of10,000 psi (70 MPa) in 28 days. Such concretes can be produced with either crushedgranite or dense crushed limestone as coarse aggregate. However, with weakeraggregates such as marine marl and washed rounded gravel, the compressive strengthwould be slightly lower for comparable mixture proportions.
2. Because the demand for early strength gain is not critical for VHS concrete, it is notnecessary to use insulation for curing under normal conditions.
3. Because of a larger amount of Type I cement plus fly ash or silica fume used in theVHS concrete mixtures along with a relatively low W/C, the strength development ofthe concretes is much more rapid in the first 7 days than predicted by the currentrecommendation of ACI Committee 209 (i 993a) based on conventional concrete.The subsequent rate of strength growth is greatly reduced and is comparable to thatpredicted by the ACI method.
4. The modulus of elasticity increases with time in the same manner as the compressivestrength. The same is true of the flexural modulus.
5. Because the design strength of VHS concrete is not too much higher than the upperranges of conventional concrete, the mechanical behavior of VHS concrete, such asthe modulus of elasticity and the compressive and tensile strain capacities, is similarto that of conventional concrete. The modulus of elasticity, the flexural modulus, and
75

the splitting tensile strength can still be predicted reasonably well by the ACI Codeequations (1993c).
6. As VHS concrete ages, its stress-slrain relationship becomes more linear.
7. VHS concrete with silica fume [VIIS (S)] appeared to be slightly stifler than VHSconcrete with fly ash [VtlS (F)] as measured by the modulus of elasticity. Themodulus of elasticity is lower for concrete with softer aggregates such as marine marl.
8. The observed compressive strain capacity ranged from 1,000 to 2,500 microstrains.
The VHS (F) concrete exhibited sbghtly higher compressive strain capacity than theVHS (S) concrete. The tensile strain capacity varied from 120 to 180 microstrains.The VHS (F) concrete exhibited lower tensile strain capacity than the VHS (S)concrete. These strain capacities are comparable to those of conventional concrete.
9. Even with a very low W/C, VHS concrete should have an adequate amount of airentrainment to enhance its freezing-thawing resistance. The results of this
investigation indicate that the VHS concrete will meet the stringent requirement of adurability factor of 80% (in contrast to 60% commonly expected of qualityconventional concrete) after 300 c)cles of freezing and thawing according to ASTMC 666, procedure A, if the concrete contains at least 5% entrained air.
10. VtIS concrete produced with washed rounded gravel li'om Memphis, Tennesseefailed the freezing-thawing test according to ASTM C 666, procedure A, because ofthe deterioration of the aggregate, even though the concrete contained 8% entrainedair. The aggregate had an absorption of about 5% and pore size of about 0. I0 microns(as observed from scanning electron micrographs), the, worst possible condition forfreezing-thawing deterioration (Hansen 1993).
11. Shrinkage of VHS concrete follow,; the general trend of conventional concrete. The
average shrinkage strain of the VHS (F) concrete with crushed granite aggregate was521 microstrains at 90 days, which is about 70% of the ultimate shrinkage strainrecommended by ACI Committee 209 (1993a) for the conventional concrete. On theother hand, the average 90-day shrinkage strains of VttS (S) concrete varied from -72microstrains for concrete with washed rounded gravel aggregate to 361 microstrainsfor concrete with crushed granite aggregate, which indicates that VHS (S) concretehas even less shrinkage potential than Vt-IS(F) concrete.
12. The observed creep strains of the different groups of VtIS concrete ranged from 20%to 50% of that of conventional concrete. The creep strains were especially low forconcretes with a 28-day strength in excess of 10,000 psi (70 MPa). The specific creepof the concrete with marine marl was much higher than that of the concrete witheither crushed granite or washed rounded gravel.
76
13. With very low W/C and using silica fume or fly ash as mineral additive, VHSconcrete after 14 days of moist curing exhibited fairly low chloride permeability
based on the rapid chloride permeability test (RCPT).
14. The initial current (in amperes) flowing through the concrete specimen in the RCPTcorrelates consistently with the total charge measured in 6 hours. Therefore the initialcurrent, which is an indirect measure of the concrete conductance, can be used as analternate measurement for the RCPT. The total testing time can thus be shortened by6 hours.
15. The AC impedance test measures the total resistance (in ohms) of a concretespecimen. This test method is simpler and faster than the RCPT, and has the potentialto be used as a substitute for the RCPT. The best correlation between the two test
methods is to express the inverse impedance (reciprocal of impedance) in terms of theinitial current measured in the RCPT.
16. A "beam" type concrete-to-steel bond test showed that by using the ACI 318requirement for development length (1993c), sufficient bond strength was developedby VHS concrete such that the steel reinforcement yielded before any significant bondslip occurred.
77
References
ACI Committee 209. 1993a. Prediction of Creep, Shrinkage and Temperature Effects inConcrete Structures (ACI 209R-92). ACI Manual of Concrete Practice, part 1, 47 pp.
ACI Committee 211. 1993b. Standard Practice for Selecting Proportions for Normal,Heavyweight, and Mass Concrete (ACI 211.1-91 ). ACI Manual of Concrete Practice, part 1, 38pp.
ACI Committee 318. 1993c. Building Code Requirements for Reinforced Concrete (ACI 318-89) and Commentary (ACI318R-89), (Revised 1992). ACIManual of Concrete Practice, part 3,347 pp.
ACI Committee 363. 1993d. State-of-the-Art Report on High Strength Concrete (ACI 363R-92). ACI Manual of Concrete Practice, part 1, 55 pp.
Ahmad, S. H., and Shah, S.P. 1985. Structural Properties of High Strength Concrete and itsImplications for Precast Prestressed Concrete. PCIJournal, vol. 30, no. 6, Nov-Dec, pp. 91-119.
America's Highways." Accelerating the Search for Innovation. 1984. Special report 202,Transportation Research Board, National Research Council, Washington, D.C.
Carrasquillo, R. L.; Slate, F. O.; and Nilson, A. H. 1981. Microcracking and Behavior of HighStrength Concrete Subjected to Short Term Loading. ACIJournal, vol. 78, no. 3, May-June, pp.179-186.
Cook, J. E. 1989. Research and Application of High-Strength Concrete: 10,000 PSI Concrete.Concrete International, vol. 11, no. 10, October, pp. 67-75.
Hansen, M. R. 1993. Durability of High Peformance Concrete. Ph.D. Dissertation, NorthCarolina State University, Raleigh, N.C., May, 224 pp.
Jobse, H. J., and Moustafa, S. E. 1984. Applications of High Strength Concrete for HighwayBridges. PCIJournal, vol. 29, no. 3, May-June, pp. 44-73.
79

Leming, M. L. 1988. Properties of High Stre_,gth Concrete: An investigation of ttigh StrengthConcrete Characteristics Using Materials in North Carolina. Report no. FHWA/NC/88-006,Department of Civil Engineering, North Carolina State University, Raleigh, N.C, July, 202 pp.
Mindess, S., and Young, J. F. 1981. Concrete Prentice Hall, Inc., Englewood Cliffs, NewJersey, 671 pp.
Moreno, J. 1990. The State-of-the-Art of ttigh-Strength Concrete in Chicago: 225 W. WackerDrive. Concrete International, vol. 12, no. 1, January, pp. 35-39.
Zia, P.; Leming, M. L.; and Ahmad, S.H. 1991. High Performance Concretes: A State-of-the-Art-Report. SHRP-C317, Strategic Highway Research Program, National Research Council,Washington, D.C., 250 pp.
Zia, P.; Schemmel, J. J.; and Tallman, T. E. 1989. StructuralApplications of High StrengthConcrete. Report no. FHWA/NC/89-006, Center for Transportation Engineering Studies, NorthCarolina State University, Raleigh, N.C., June, 330 pp.
80

Appendix
List of Figures
Figure A. 1 Device for mounting transducers on 4 x 8-in. cylinders ............................ 82Figure A.2 Steel jackets for protecting transducers during compression testing ......... 83Figure A.3 Compression test setup .............................................................................. 84Figure A.4 Transducer mounting device for flexural testing ....................................... 85Figure A.5 Beam support for flexural testing ............................................................... 86Figure A.6 Frame mounting on flexural test beams for recording
midspan deflection ..................................................................................... 87Figure A.7 Loading arrangement for flexural test ........................................................ 88Figure A.8 Flexural test setup ...................................................................................... 89Figure A.9 Freezing-thawing chamber ......................................................................... 90Figure A. 10 Measurement of dynamic modulus of elasticity ........................................ 91Figure A. 11 Shrinkage test setup ................................................................................... 92Figure A. 12 Rapid chloride permeability test (RCPT) vacuum saturation setup ........... 93Figure A.I 3 RCPT specimens sealed in two test cells ................................................... 94Figure A. 14 RCPT test cells attached to power supply .................................................. 95Figure A. 15 RCPT output being recorded ...................................................................... 96Figure A. 16 RCPT output recorded on strip chart ......................................................... 97Figure A. 17 AC impedance test setup ............................................................................ 98Figure A. 18 AC impedance test in progress ................................................................... 99Figure A. 19 Loading arrangement for concrete-to-steel bond test ............................... 100Figure A.20 Concrete-to-steel bond test setup ............................................................. 101
81

1/4" 1/4" 1/4"
_t.H-H3/8" 7/8"
_m
5/16"I 1,'2" 1118"
2 5/8"
13/4-- I_ = I _.3/4-- 1_
31/2" - I - - I - 31/4" I- - I - 31/2"
"_ 113/4" - I
Elevation
L -_"3,'4" 1"1/4"
I II I
8" _t
.---- Alignment mark II (bottom cylindar) III I
Top View
1/4"2 5/8"
4- ,q,Side View
Figure A.1 Device for mounting transducers oil 4 x 8-in. cylinders
82
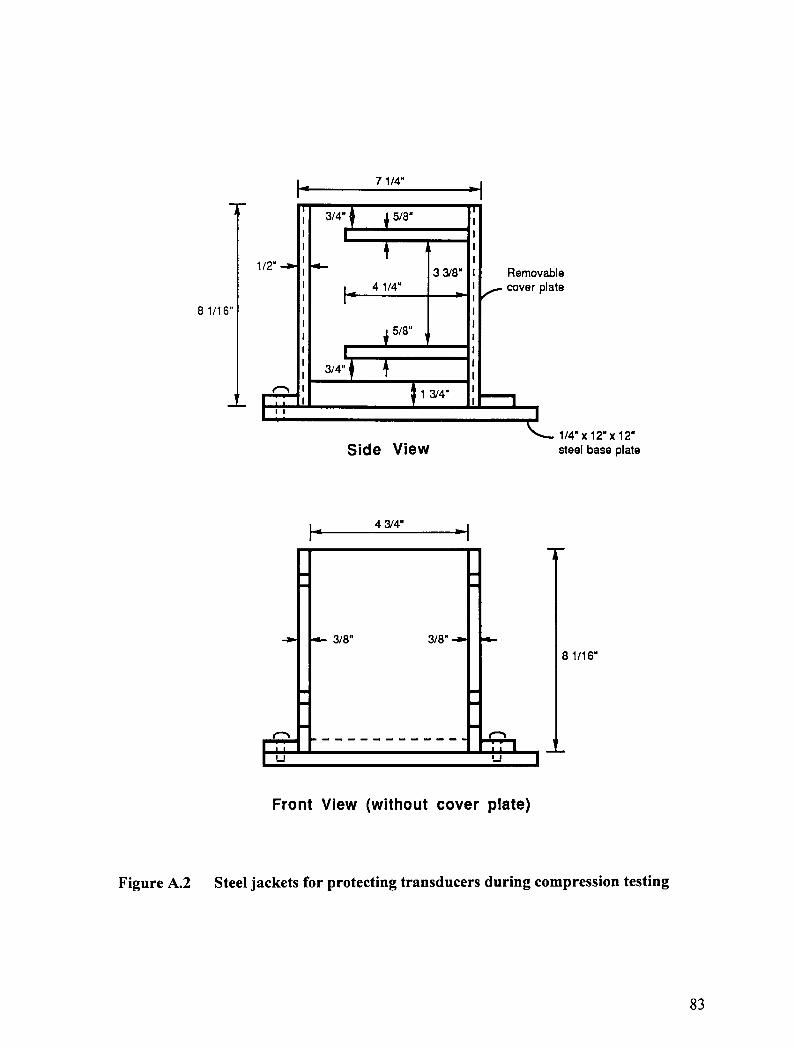
L. 7 1/4"
' 'i i 314 5/8" IIi I
, _II 3 3/8" Removable
I L.. 4 1/4" cover plateI 1
8 1/16" I !lt !l
j _ 5/8"
,II 3/4'
, ._._=_ I _13/4"- I !
I I
1/4" x 12" x 12"
Side View steel base plate
4 3/4"
m m
m m
3/8" 3/8"
8 1116"
== m
=i
m m
mIJ ij
Front View (without cover plate)
Figure A.2 Steel jackets for protecting transducers during compression testing
83
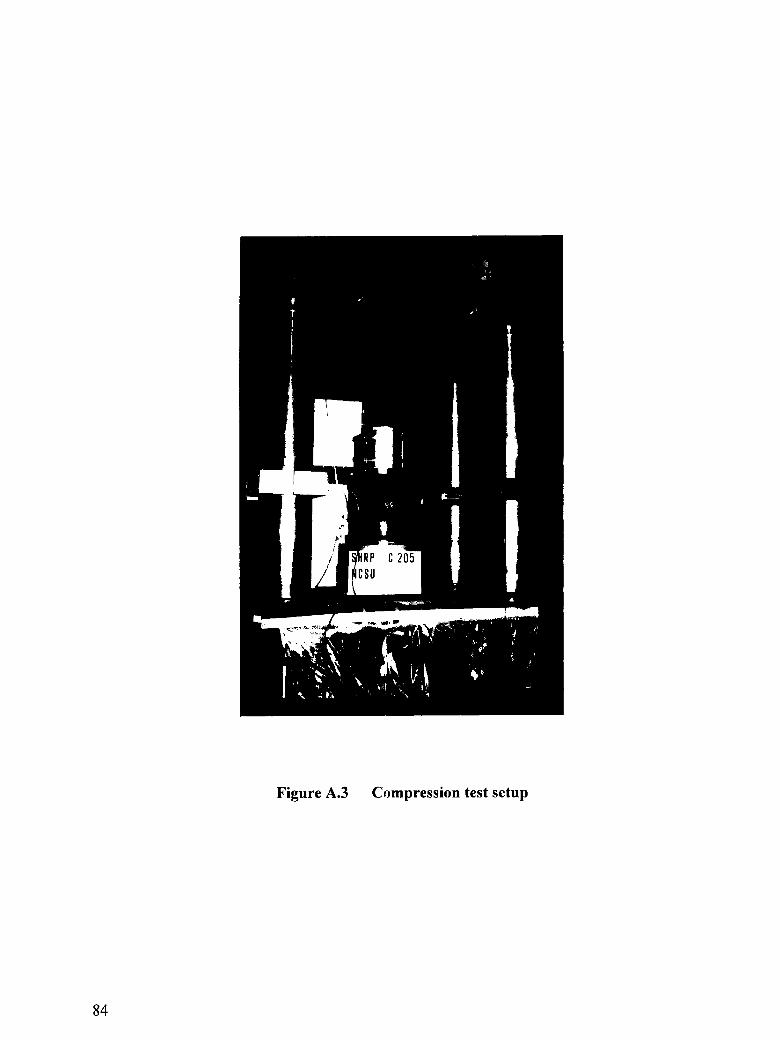
Figure A.3 Compression test setup
84

1,s,,+__+i3/4"
2 1/4" l 4 1/4" 1/2" 0,1/8" thick
height spacersI"'1 I--I
I I
37/8" - 1 -1"- I - 3" - I -1"- I - 4" - I
- 12 7/8" I
Front View
-' 1 . - - :1/8"
3/4"
4" X 4"
specimen
-_ ----- __1/8"
3/4"
6 1/2"
Side View
Figure A.4 Transducer mounting device for flexural testing
85

12" -I
Rotates Does not rotate
BoLts2 3/8"
1 3/4"
_1 'l' 1 _4" I 18" x 6" x 1/2" plate/2
Side View
0 0 0 , 0
C..... _" "'-:)0 0 0 0
Plan View
Figure A.5 Beam support for flexural testing
86
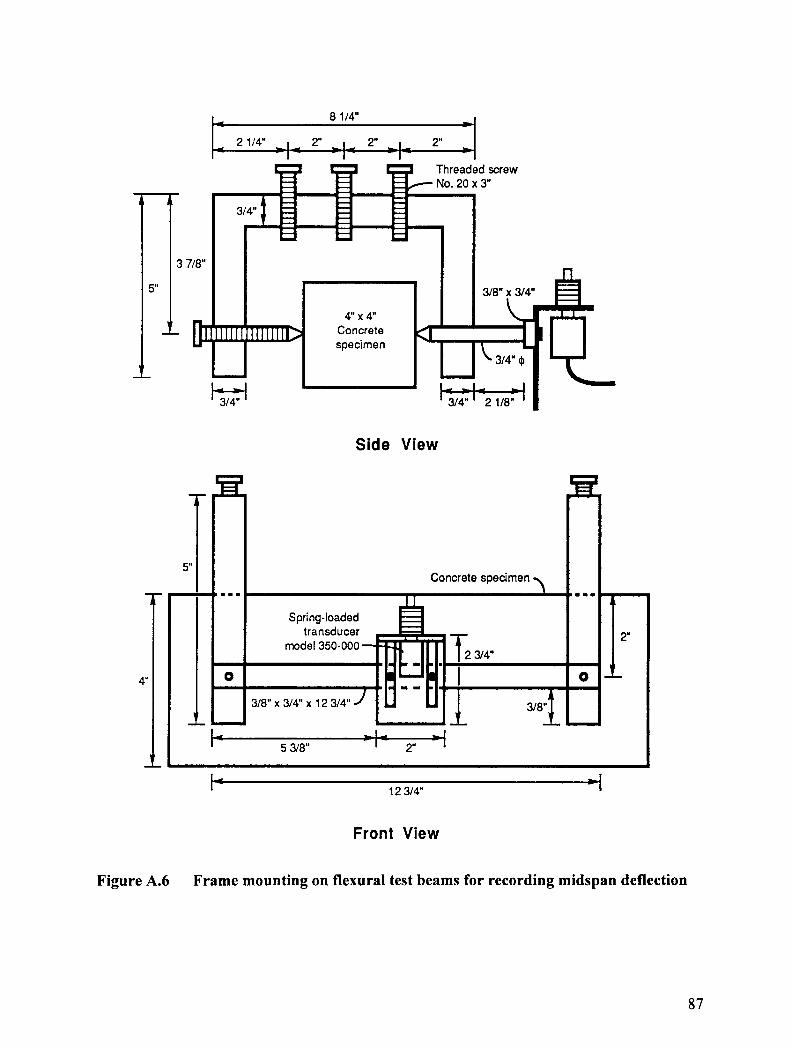
8 1/4"
k 2 1/4" I_ 2" _1_ 2" _1_
Threaded screwNo. 20 x 3"
I - -3/4" -- = -
3
t t4" x 4"m IIIII i11111111 Concrete I
specimen IL
Side View
5 =l
Concrete specimen ._u I himIn lUlI
Spring-loadedtransducer
model 350-000 _ 3/4"I •
4" O I!
3/8" x 3/4" x 12 3/4" -) 3/8"_
,,all _ ___ _"=
5 3/8" 2"
m
P= 12 3/4" I
Front View
Figure A.6 Frame mounting on flexural test beams for recording midspan deflection
87
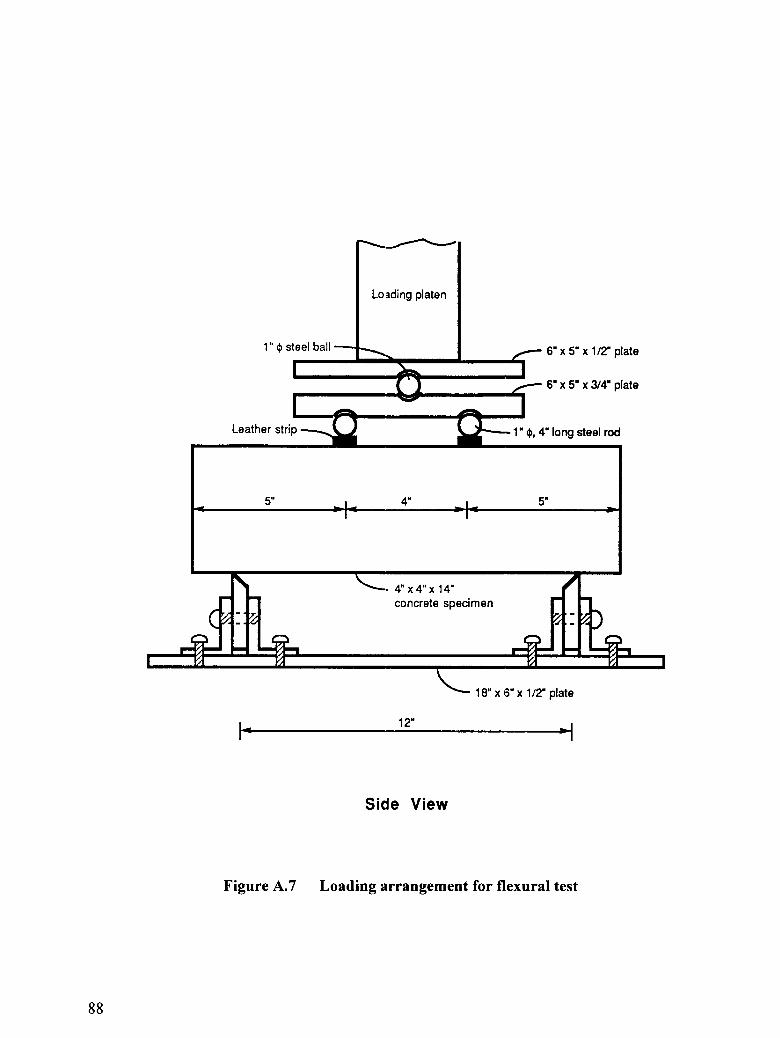
Loading platen
1" _ steel ball -.-.- 6" x 5" x 1/2" plate
6" x 5" x 3/4" plate
Leather stri 4" long steel rod
5" _1_ 4" _1_ 5"I -I
r__ _%.,,_-. 4. x 4,, x 14"
concrete specimen
_'_- 18" x 6" x 1/2" plate
-I
Side View
Figure A.7 Loading arrangement for flexural test
88

Figure A.8 Flexural test setup
89
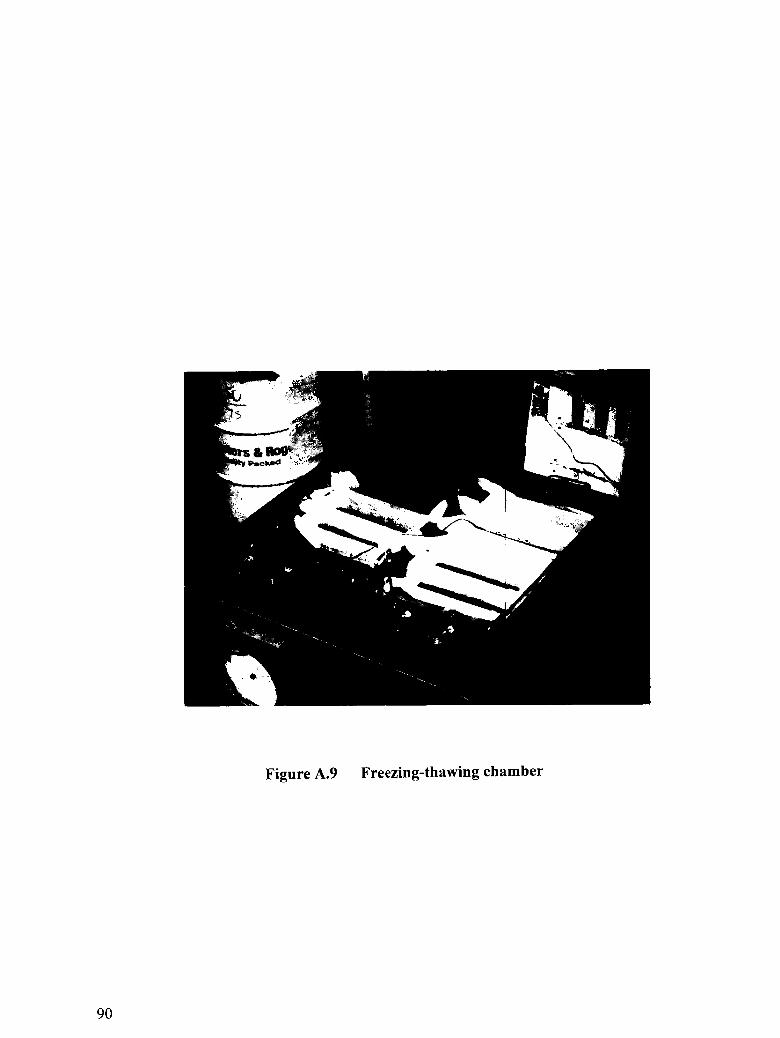
Figure A.9 Freezing-thawing chamber
9O

Figure A.10 Measurement of dynamic modulus of elasticity
91

sail, c,2o5 ,,HCSU __;!,i,
:..i.
Figure A.1I Shrinkage test setup
92
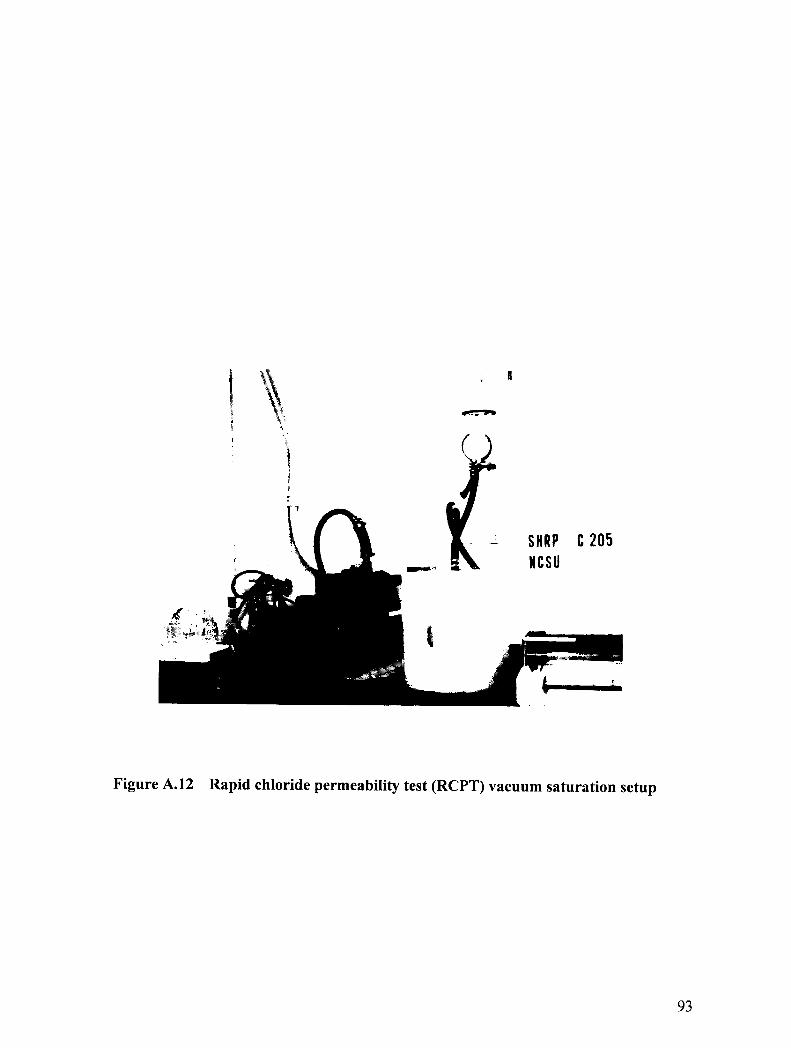
: SHRP C205
' ,,.,__ NCSU
Figure A.12 Rapid chloride permeability test (RCPT) vacuum saturation setup
93

SHHPC-205HCSU ,
RAPIDCHLORIDE
PERMEABILITYTEST
Figure A.13 RCPT specimens sealed in two test cells
94

I 20""15_'_"i!i1, SHRP C-
NCSU
I_ \Pit) !
I III I bl_illll.!'1 14',.11 \1111 II"Y
11_,t
Figure A.14 RCPT test cells attached to power supply
95
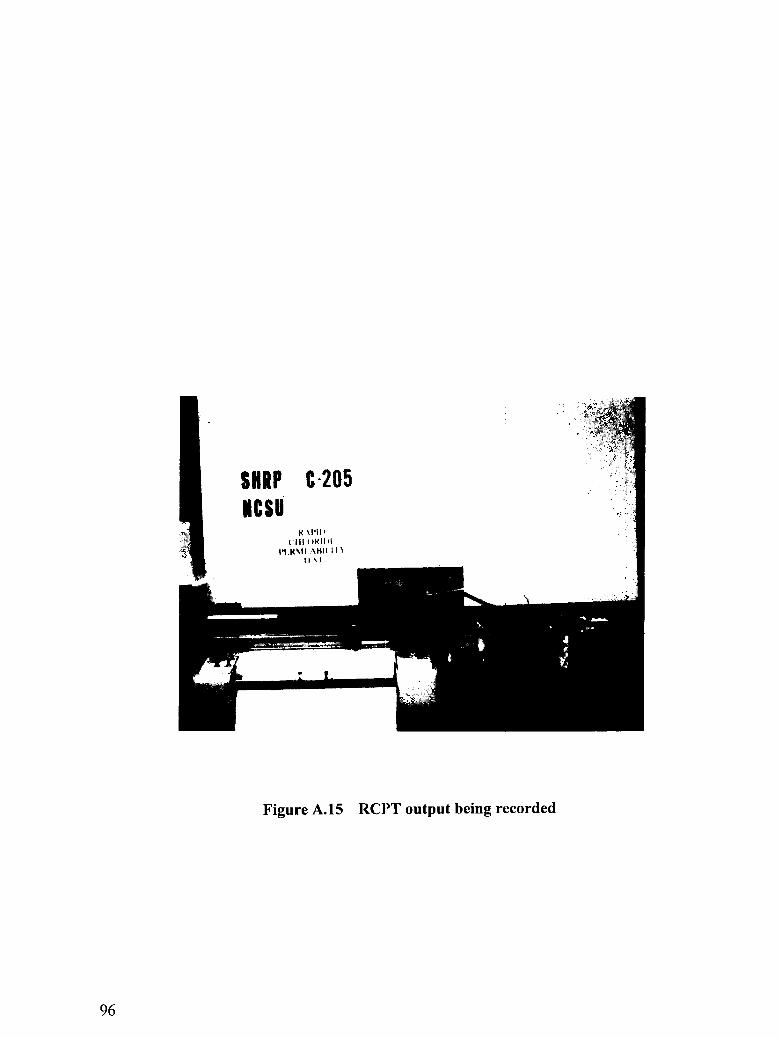
.... • ,....,;..:._--_."_.:_:"_ ..
• .._SHRPC-205IlCSU
Illl i iI_ll)l
PERMI ..%!41111 '_
.! II kl
Figure A.15 RCPT output being recorded
96

97

SUP C-205HCSg
AC IMI_DANCe_.._. TE_T
• .. : .
Figure A.17 AC impedance test setup
98
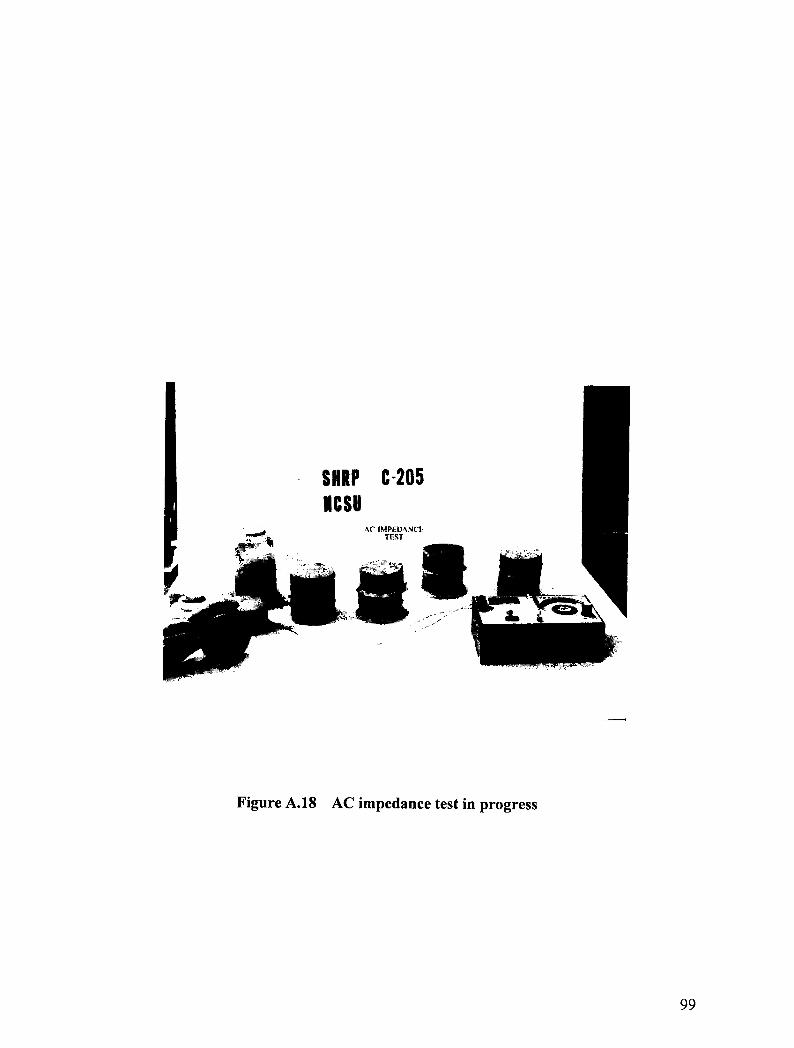
SHRPC-205NCSU
Figure A.18 AC impedance test in progress
99

100

Figure A.20 Concrete-to-steel bond test setup
101
Concrete and Structures Advisory Committee
Chairman Liaisons
James J. Murphy
New York Department of Transportation (retired) Theodore R. FerragutFederal Highway Administration
Vice Chairman
Howard H. Newlon, Jr. Crawford F. Jeneks
Virginia Transportation Research Council (retired) Transportation Research Board
Members Bryant MatherUSAE Waterways F_periment Station
Charles J. Arnold
Michigan Department of Transportation Thomas J. Pasko, Jr.Federal Highway Administration
Donald E. BeuerleinKoss Construction Co. John L. Rice
Federal Aviation Administration
Bernard C. Brown
lowa Department of Transportation Suneel VanikarFederal Highway Administration
Richard D. GaynorNational Aggregates Association Ready Mixed Concrete 11/19/92Association
Expert Task GroupRobert J. Girard
Missouri Highway and Transportation Department Stephen Forster
David L. Gress Federal Highway Administration
University of New Hampshire Amir Hanna
Gary Lee Hoffman Transportation Research Board
Pennsylvania Department of Transportation Richard H. Howe
Brian B. Hope Pennsylvania Department of Transportation (retired)
Queens University Susan Lane
Carl E. Locke, Jr. Federal Highway Administration
University of Kansas Rebecca S. MeDaniel
Clellon L. Loveall Indiana Department of Transportation
Tennessee Department of Transportation Howard H. Newlon, Jr.
David G. Manning Virginia Transportation Research Council (retired)
Ontario Ministry of Transportation Celik H. Ozyildirim
Robert G. Packard Virginia Transportation Research Council
Portland Cement Association Jan P. Skainy
W.R. Grace and Company (retired)James E. Roberts
California Department of Transportation A. Haleem Tahir
American Association of State Highway and TransportationJohn M. Scanlon, Jr. OfficialsWiss Janney Elstner Associates
LiUian Wakeley
Charles F. Scholer USAE Waterways Experiment StationPurdue University
7/22/93Lawrence L. Smith
Florida Department of Transportation
JohnR. StradaWashington Department of Transportation (retired)