
Vertu Motors plc (“Vertu” or “Group”)
33
9 May 2018 Vertu Motors plc (“Vertu” or “Group”) Final results for the year ended 28 February 2018 Strong balance sheet to drive growth and take advantage of tougher trading environment Vertu Motors plc, the UK automotive retailer with a network of 120 sales and aftersales outlets across the UK, announces its audited results for the year ended 28 February 2018 (“the Period”). Highlights: • Adjusted profit before tax of £28.6m (2017: £31.5m) reflective of a tougher trading environment • Aftersales and used cars represent 72.3% of gross profit (2017: 71.5%) • Exceptional property profits of £3.5m: evidence of value in freehold and long leasehold portfolio • Strong balance sheet to fund future growth with net cash of £19.3m (2017: £21.0m) and unutilised bank facilities of £30m, with the potential to add a further £30m • Tangible net assets of £174.3m (2017: £156.1m) with tangible net assets per share up 14.9% at 45.4p (2017 : 39.5p) • Focus on capital allocation: £11.1m returned to shareholders through dividends and share Buy-backs. Since July 2017, our ongoing share Buy-back Programme has acquired 18m ordinary shares for cancellation at a cost of £7.9m, the equivalent of 4.53% of the issued share capital • Full year dividend of 1.5p per share up 7.1% • Encouraging outlook with trading in March and April 2018 in line with management expectations: used car volumes up year on year • Board remains confident about the Group’s prospects for the year ahead and continues to evaluate acquisition growth opportunities Financial Year ended 28 February 2018 Year ended 28 February 2017 % Change Revenue £2,796.1m £2,822.6m (0.9%) EBITDA £43.2m £41.4m 4.3% Operating profit £32.3m £32.1m 0.6% Profit before tax £30.5m £29.8m 2.3% Earnings per share 6.31p 6.14p 2.7% Exceptional profit on property disposals £3.5m - - Adjusted EBITDA* £40.7m £42.4m (4.0%) Adjusted profit before tax* £28.6m £31.5m (9.2%) Adjusted earnings per share* 5.79p 6.54p (11.5%) Operating cash inflow £27.3m £58.1m (53.0%) Net cash £19.3m £21.0m (8.1%) Net assets per share 68.9p 62.3p 10.6% Tangible net assets per share 45.4p 39.5p 14.9% Dividend per share 1.5p 1.4p 7.1% * adjusted for amortisation of intangible assets, share based payments charge and exceptional items.
Transcript of Vertu Motors plc (“Vertu” or “Group”)

9 May 2018
Vertu Motors plc (“Vertu” or “Group”)
Final results for the year ended 28 February 2018
Strong balance sheet to drive growth and take advantage of tougher trading environment
Vertu Motors plc, the UK automotive retailer with a network of 120 sales and aftersales outlets across the UK,
announces its audited results for the year ended 28 February 2018 (“the Period”).
Highlights:
• Adjusted profit before tax of £28.6m (2017: £31.5m) reflective of a tougher trading environment
• Aftersales and used cars represent 72.3% of gross profit (2017: 71.5%)
• Exceptional property profits of £3.5m: evidence of value in freehold and long leasehold portfolio
• Strong balance sheet to fund future growth with net cash of £19.3m (2017: £21.0m) and unutilised bank facilities of £30m, with the potential to add a further £30m
• Tangible net assets of £174.3m (2017: £156.1m) with tangible net assets per share up 14.9% at 45.4p (2017 : 39.5p)
• Focus on capital allocation: £11.1m returned to shareholders through dividends and share Buy-backs. Since July 2017, our ongoing share Buy-back Programme has acquired 18m ordinary shares for cancellation at a cost of £7.9m, the equivalent of 4.53% of the issued share capital
• Full year dividend of 1.5p per share up 7.1%
• Encouraging outlook with trading in March and April 2018 in line with management expectations: used car volumes up year on year
• Board remains confident about the Group’s prospects for the year ahead and continues to evaluate acquisition growth opportunities
Financial
Year ended 28 February
2018
Year ended 28 February
2017
% Change
Revenue £2,796.1m £2,822.6m (0.9%) EBITDA £43.2m £41.4m 4.3% Operating profit £32.3m £32.1m 0.6% Profit before tax £30.5m £29.8m 2.3% Earnings per share 6.31p 6.14p 2.7% Exceptional profit on property disposals £3.5m - - Adjusted EBITDA* £40.7m £42.4m (4.0%) Adjusted profit before tax* £28.6m £31.5m (9.2%) Adjusted earnings per share* 5.79p 6.54p (11.5%) Operating cash inflow £27.3m £58.1m (53.0%) Net cash £19.3m £21.0m (8.1%) Net assets per share 68.9p 62.3p 10.6% Tangible net assets per share 45.4p 39.5p 14.9% Dividend per share 1.5p 1.4p 7.1%
* adjusted for amortisation of intangible assets, share based payments charge and exceptional items.

Operational
Increase/(decrease) year-on-year
Revenue:
Total %
Like-for-Like %
SMMT Registrations
% Group revenues (0.9) (0.2) Service revenues 3.5 4.2 Used retail vehicles 3.0 3.0 New retail & Motability vehicles (8.0) (6.5) Fleet & commercial vehicles 2.1 2.4
Volumes: Used retail vehicles (2.2) (0.5) New retail vehicles (14.7) (13.3) (7.6) Motability vehicles (5.5) (4.3) (2.7) Fleet new cars (6.0) (5.0) (5.7) Commercial new vehicles (4.1) (4.2) (3.5)
Robert Forrester, Chief Executive of Vertu said: “We have closed what turned out to be a more challenging year for the sector, with the business in a strong position.
We have been deliberately cautious on the acquisition front as pricing moved away from our investment valuation
metrics. This trend is beginning to reverse and potential acquisition opportunities are increasing. Our strong balance
sheet with net cash of £19.3m, together with our unutilised debt facilities, provides scope for further scaling-up of
the business to drive value and further enhance shareholder returns.
We remain very focused on capital allocation and continue to make progress on realising surplus property assets
and managing the dealership portfolio. The Board sees value in a continued share buyback programme cognisant
that tangible net assets per share are at 45.4p. The full year dividend has been increased by 7.1%.
We are pleased with the performance of the Group in March and April in all key areas. The Board therefore has
confidence for the full year”.
Webcast details Vertu management will host a webcast for analysts and investors at 9.30am (BST) this morning. Please click here to register.
http://webcasting.brrmedia.co.uk/broadcast/5acf1a2a6fc60958623b4d32
A recording of the webcast will subsequently be uploaded to the Company’s website.
Annual Report and Financial Statements The Group’s Annual Report and Financial Statements for the year ended 28 February 2018 are available today on the Group’s website www.vertumotors.com/investors. This announcement contains inside information as defined in Article 7 of the Market Abuse Regulation No. 596/2014 and is disclosed in accordance with the Company's obligations under Article 17 of those Regulations.

For further information please contact:
Vertu Motors plc
Robert Forrester, CEO
Michael Sherwin, CFO
Tel: 0191 491 2111
Tel: 0191 491 2112
Camarco
Billy Clegg
Tom Huddart
Tel: 020 3757 4983
Canaccord Genuity Limited
Chris Connors
Henry Fitzgerald O’Connor
Richard Andrews
Tel: 020 7523 8350
Zeus Capital Limited
Dominic King Tel: 020 3829 5000
Notes to Editors Vertu, the UK automotive retailer with a proven growth strategy, is the sixth largest automotive retailer in the UK
with a network of 120 sales outlets across the UK. Its dealerships operate predominantly under the Bristol Street
Motors, Vertu, Farnell and Macklin Motors brand names.
Vertu was established in November 2006 with the strategy to consolidate the UK automotive retail sector. It is
intended that the Group will continue to acquire automotive retail operations to grow a scaled dealership group.
The Group's acquisition strategy is supplemented by a focused organic growth strategy to drive operational
efficiencies through its national dealership network. The Group currently operates 117 franchised sales outlets and
3 non-franchised sales outlets from 103 locations across the UK.
Vertu’s Mission Statement is to “deliver an outstanding customer motoring experience through honesty and trust”.
Vertu Group websites - www.vertumotors.com / www.vertucareers.com
Vertu brand websites - www.bristolstreet.co.uk / www.macklinmotors.co.uk / www.vertuhonda.com /
www.farnelllandrover.com / www.farnelljaguar.com / www.vertutoyota.com / www.vertuvolkswagen.com /
www.vertumercedes-benz.com
Chairman’s Statement
The Board is announcing a creditable set of results against a tougher market backdrop for the automotive sector.
The Group generated adjusted EBITDA of £40.7m (2017: £42.4m) and continued to invest in its core automotive
retail assets to support future growth while focusing on capital allocation, returning £11.1m to shareholders through
both dividends and a programme of share buy-backs (the “Buy-back Programme”). Under the Buy-back Programme,
the Group, as at 28 February 2018, had repurchased 12.3m shares, equivalent to 3.1% of the Group’s issued share
capital. Subsequent to the end of the financial year ended 28 February 2018 (“the Period”), the purchase of the
Group’s own shares continued and a further 5.7m shares have been acquired equivalent to 1.4% of the Group’s
issued share capital, with the result that 18.0m shares equating to 4.53% of the Group’s share capital as at 1 March
2017 have now been repurchased in total. The cash saving from lower dividend payments as a result of the Buy-
back Programme, based upon an annual dividend of 1.5p per share, amounts to £270,000 per annum. The Board will
seek a renewed approval for the Buy-back Programme at the forthcoming Annual General Meeting.

We have kept a sharp focus on maximising the value in our property portfolio, realising a profit of £4.1m from a sale
and leaseback transaction while maintaining our strong asset backing. We have adopted a similar approach to the
Group’s dealership portfolio, with the disposal or closure of five underperforming sales outlets during the Period
realising cash of £2.8m in the process, with a further £2.0m realised from surplus property disposals subsequent to
the year end. This approach has ensured that the Group remains in a strong position to take advantage of both
organic and acquisition-led opportunities in the months ahead. The Group’s balance sheet continues to be very well-
capitalised, with net cash of £19.3m at 28 February 2018 and available, unutilised bank facilities of £30m with the
potential to add a further £30m.
The Period has been a more challenging time for the UK automotive retail sector. The value of Sterling was weak
during the Period (trading between €1.08 and €1.20) and as a consequence, following five consecutive years of
growth, the UK private new vehicle market fell by 6.8% in 2017 in terms of registrations (SMMT). Neither the General
Election in June, the ongoing negative press coverage surrounding the Brexit negotiations nor the mixed messages
from Government about the future of diesel vehicles have helped the consumer environment for vehicle sales.
However, the management team has been disciplined in avoiding distraction and maintaining its focus on what it
can control: setting the agenda for operational improvement, especially in the businesses acquired in recent years,
investing in world class training to lift the skills and leadership ability of the dealership teams, controlling costs and
keeping a sharp focus on capital allocation. This latter point has been particularly important, and it is indeed no
accident, that the Group has not made any acquisitions during the Period. Acquisition pricing has been driven in
part by foreign (non-Sterling) investors and the Board has not strayed from the discipline of its valuation metrics.
This will ensure that future returns are not diluted by chasing inflated prices. As a consequence, the Group is now
in a strong position to grow as the sector cycle presents better value acquisition opportunities.
It should also be noted that, against the backdrop set out above, 2017 represented the third largest annual new car
retail market in the United Kingdom in the last 13 years and the country remains in a positive economic growth
environment. Economic forecasts currently see this growth environment continuing.
The Group remains set for further growth, well positioned with Manufacturers and in a very healthy financial
position. I remain optimistic about the Group’s growth prospects underpinned by our very strong and well
capitalised balance sheet.
The Group’s objective remains to deliver long-term value for its owners through building a scaled, franchised
dealership business generating significant, resilient and increasing cashflows. The Group seeks to do this by pursuing
a consistent strategy with a well-established business model. This report will set out the strategy, explain the
business model and describe how the Group has used the model to establish a competitive position from which to
generate growth in cashflows over the long-term. Growing cashflow is a result of growing revenues, managing
margins, operating costs and tax payments and managing working capital and capital expenditure within the
framework of a suitable funding structure. This report will examine each of these areas.
The Group continues to develop a talented, stable and experienced operational team which is committed to
delivering on the Group’s strategy and I would like to take this opportunity to thank every colleague in the Group
for their commitment and dedication during the year.

Current Trading and Outlook In March and April 2018 (“the Post Year-end Period”) the Group has traded in line with management’s expectations.
March remains the most significant month of the year for the profitability of UK automotive retail due to the plate
change. This year comparisons of March with the prior year were skewed due to the impact of the pull forward of
registrations due to the vehicle excise duty changes on 1 April 2017 and the timing of Easter which reduced March
profitability in 2018. We have therefore considered the two months of March and April together. The UK private
new car market fell by 8.8% in the Post Year-end Period. The Group’s like-for-like new retail volume declined by
2.6% during the Post Year-end Period, significantly outperforming the market with the result that the Group grew
its market share. In addition, the Group also grew market share in the Motability, fleet and commercial channels.
The Group achieved manufacturer volume targets at a high level and, as a result, new car gross margins were stable.
Both used car and aftersales performance during the Post Year-end Period were impacted by the adverse weather
conditions in early March 2018. However, over the Post Year-end Period as a whole like-for-like used car volumes
rose 7.0% and like-for-like service revenues were up 6.8%. The Group is benefitting from having additional technician
resources in place. Whilst as anticipated due to last year’s record March trading performance, the profits in the Post
Year-end Period are behind last year, the Board believes they represent a very positive outcome.
Subsequent to the year end, the Group disposed of a vacant freehold property for £2.0m in cash, realising a profit
on sale of £0.6m. This further demonstrates the value inherent in the Group’s freehold and long leasehold property
portfolio and further disposals of vacant property are likely in the coming months.
The prospects for the UK new car market are likely to be more favourable with stabilisation of volumes from April
2018 onwards currently anticipated by the SMMT. The market significantly weakened from April 2017 onwards.
There is a degree of uncertainty over new vehicle supply around the implementation of Worldwide Harmonised Light
Vehicle Test Procedures (“WLTP”) regulations due to come into force on 1 September 2018. The impact of WLTP on
production and supply of new vehicles is currently not clear and this may cause some short-term supply limitations
until the end of quarter four 2018. The current consumer trend for increased petrol new vehicle demand, reducing
diesel new vehicle demand, may also result in supply limitations as a result of the lag in changing production to
respond to this shift in consumer behaviour in the last 12 months.
The outlook for used cars is strong with the Group focused on continuing growth in profitability for the remainder
of the year following a successful Post Year-end Period. Aftersales prospects are positive due to the impact of
previous service plan penetration, rising vehicle parcs and the successful recruitment and retention strategies
adopted for technician resource.
Cost increases continue to impact the Group as previously reported and these are likely to absorb some of the
expected increases in revenues and gross profit.
Given the encouraging trading performance of the Group and the Group’s strong balance sheet, the Board remains
confident about the Group’s prospects for the current year and its ability to undertake further growth through
acquisitions.
P Jones Chairman
Strategic Report

Strategy and Active Portfolio Management
To deliver long-term value to the Group’s owners, the Group’s strategy is to grow a scaled UK automotive retail
group through acquiring both volume and premium franchised dealerships. The Board believes that the benefits of
scale in the sector are increasing over time. Scale benefits include: a national on-line and off-line co-ordinated
marketing strategy to maximise the benefits of our unique national footprint, scaled contact centres, franchise
management dedication, purchasing efficiencies and access to competitive consumer finance packages for the
Group’s customers. Further consolidation of the sector by large-scale national brands is likely to continue in the
years ahead in what is still a sector with a fragmented ownership structure in many franchises.
The Group will continue to acquire dealerships across the volume and premium spectrum as the Board currently
believes that capital can continue to be invested in additional dealerships to deliver significant return on investment
to shareholders in the short and medium term. The fragmented nature of the UK automotive retail sector means
that significant growth potential remains, and crucially, the Group has substantial headroom for further growth with
the vast majority of its Manufacturer partners, particularly in the Premium space.
The Board adopts a rigorous and disciplined capital allocation process in deciding whether to pursue an acquisition.
Six-monthly we assess our strategic position with each Manufacturer to confirm the Board’s standpoint on future
investment in the franchise. This leads to an Add, Hold, Reduce or Avoid conclusion which underpins the Group’s
strategic portfolio management. Investment evaluations for specific opportunities involve detailed three-year
investment appraisals and utilising set return on investment hurdle rates to ensure appropriate capital allocation.
During the Period, the Board has continued to assess several further acquisition opportunities, rigorously applying
consistent valuation criteria. A number of these opportunities have not resulted in transactions as the valuations
sought by the vendors have not met the Board’s investment return criteria. Indeed, a number of the opportunities
introduced by Corporate Finance practitioners did not result in the marketed businesses being sold. Valuation
expectations in the minds of vendors have been fuelled to some extent by overseas bidders. Further opportunities
continue to be assessed and the Group has seen an increase in potential deal flow in the last few months. The
addition of further dealerships and new franchise partners to the Group’s portfolio will enable the Board to deliver
its goal of creating a balanced and diversified portfolio of franchised businesses, so reducing the Group’s exposure
to variations in individual Manufacturers’ performance. Such growth, however, will only be undertaken at
appropriate valuations to ensure future returns. We will remain selective and disciplined in our approach, cognisant
that the Board is trusted to spend our shareholders’ capital sensibly with the goal of creating and sustaining long
term value.
Modern automotive retailing is undergoing substantial changes and these changes are likely to accelerate in the
years ahead. The rise of digital sales channels, CASE (Connected, Autonomous, Sharing and Electric) developments
and Manufacturer investment and scale requirements expected of retailers are likely to have an impact on
franchised networks and the locations which the Group will want to operate from in the future. These trends which
represent an opportunity for scaled franchised dealer groups, are likely to drive further consolidation in the sector
and to lead to an increase in sales per outlet in the sector. We are mindful of these changes when considering the
current portfolio and how it will evolve and the following trends are considered particularly pertinent:
• There will be a trend away from rural, smaller franchise points and greater investment in larger, urban
representation points. This will yield operational gearing benefits of increased sales per outlet. Acquisitions
and disposals must reflect this trend.
• Property flexibility may have increasing importance as network restructuring occurs and retail formats and
requirements change. Lease length and structures will take on a greater importance as a result. Freehold
ownership is preferred by the Board given the greater flexibility this affords.

The Board performs a detailed review of underperforming dealerships within the portfolio on a continual basis,
applying its strategy of “fix, re-franchise, sell or close”. This is an important element of the capital allocation process
providing cash for investment in higher return activities. The Group has seen the benefit of this during the Period.
Portfolio Changes Portfolio changes have been made during the Period reflective of the capital allocation principles and trends outlined above:
• In March 2017 the Group disposed of its loss-making Chesterfield Peugeot business and in due course the
freehold premises will be sold
• In May 2017 the Group ceased its Mazda operations in Bristol allowing sole focus on the Hyundai franchise
• The Group completed its exit from the Fiat Group business with the closure in December 2017 of Worcester Fiat
and Alfa Romeo and of its multi-franchise Cheltenham Fiat and Mazda business in March 2018
• The Group disposed of its loss-making former Volkswagen dealership in Boston, Lincolnshire. This included the
disposal of the freehold premises for £1.2m
• The Group closed two accident repair centres to increase capacity in more profitable activities as part of
dealership redevelopments
• In April 2018 the Group ceased its Volvo operation in Sheffield allowing sole focus on the Nissan franchise at the
location
During the Period these changes released £1.2m from property assets and £1.6m from working capital which was
re-deployed to activities generating higher returns. Dealerships acquired in the year ended 28 February 2017 made
a profit before interest and tax contribution of £1.2m in the Period. The sites closed or disposed of during the Period
lost £1.1m (2017: £1.6m) hence these actions will enhance future returns and operating margins of the Group.
Subsequent to these changes the Group now operates 117 franchised sales outlets, and 3 non-franchised sales
outlets, from 103 locations.
Business Model and Competitive Positioning
The Group’s business model has remained consistent for the eleven years the Group has operated and enables the
successful delivery of enhanced business performance from acquired dealerships, through the implementation of
the Group’s brand model, business processes and systems. This is delivered by a senior management team that is
very stable and highly experienced. Many of the Group’s acquisitions are turnaround opportunities and a number
are new start-up dealerships sharing similar characteristics, including a weak customer database and consequently
an aftersales business performing below its potential. The aftersales activities have significantly higher margins
compared to vehicle sales and the Group’s business model works to improve and then maximise the aftersales
performance and hence improve overall margins. Growing the aftersales potential is fundamentally a function of
increasing the sale of new and used cars by the dealership in the locality and ensuring high levels of customer
retention into service.
The success of the Group’s strategy is evidenced by the rapid growth since the first acquisition in 2007 and the
turnaround and integration of acquired dealerships to date. The Group has become the sixth largest automotive
retailer in the UK by revenues from a standing start in 2007. Many of the acquisitions undertaken in recent periods
have still to become fully established and this provides the Group with further opportunity to deliver improved
margins and grow organic profit over the medium term.
The successful integration of acquisitions into the Group has to be one of our core competencies. Management has
a significant amount of experience in this area. Key to successful integration are the following:

• Ensuring new colleagues (employees) understand the Vision, Values and culture of the Group
• Transferring key managers from the core Group to the new businesses
• Implementation of the Group’s single platform of systems and processes as soon as possible
• Leveraging the Group’s key scaled brands and marketing power, including on-line assets, across the new
businesses
The Group adopts a “Right People, Right Choice, Right Deal” brand model, centred on a “Right Experience for You”.
The “Right Experience” applies equally to colleagues, customers, Manufacturer partners and indeed investors. This
brand model is based on a fundamental premise that it is the colleagues in each business together with management
who deliver on customer needs to create long-term value for the business. Ensuring that each business has the right
Values and culture is of paramount importance to building both long-term relationships with loyal customers and a
stable team of colleagues.
In the July 2017 Colleague Satisfaction Survey over 98% of responding colleagues knew the Vertu Values and 88%
thought the Directors actively practiced them. It is clear that the more the Core Values of Passion, Respect,
Professionalism, Integrity, Recognition, Opportunity and Commitment are in place in the business, the stronger the
business is and significant senior management time is spent promoting and reinforcing these Values. The brand
model has a number of brand actions which are designed to guide colleagues and management into being customer-
centric. For example, “effortless journeys, not complex processes” is an important mantra in assessing the
effectiveness of both on-line and off-line processes and any proposed developments impacting customers. By
building trust from customers for the business, the Group aims to build long term relationships through the lifecycle
of buying, owning and selling vehicles. There is a clear correlation, in our view, between a high level of colleague
satisfaction, great customer experiences and the generation of higher margins in the business.
The success of the business and the delivery of the brand model relies heavily on strong, high quality management
teams to deliver the required returns over time. The recruitment, development and retention of high performing
automotive retail professionals is of paramount importance, particularly in General Manager roles providing
leadership in each dealership. The Group has developed a culture which seeks to attract and retain top performers
and the Board believes it is successful in doing so.
As part of the Group’s strategy to attract, retain and develop high performing colleagues and management, the
Group continues to invest in training. This includes substantial internal training programmes, management
development programmes for high potential colleagues, including management training undertaken by Dale
Carnegie and an enterprise wide e-learning platform for all 5,340 colleagues. 1.3 million minutes of e-learning have
been undertaken on the newly launched platform since 1 January 2018. This platform is industry leading, covering
personal development, leadership skills and sales skills, delivered on personal devices.
The operations of the Group are overseen by a CEO Committee of the 14 most senior people in the Group. This
cadre is very stable with five members in place since the Group started and an average tenure of nine years. Three
new leaders were promoted internally to the CEO Committee on 1 March 2018:
• Steve Gould, Operations Director, (46) has been with the Group for 6 years having previous experience
with Reg Vardy plc, Pendragon plc and Peter Vardy Limited. He is responsible for the Renault and
Nissan operations of the Group.
• Matthew Barr, HR Director, (37) has been with the Group ten years having previously worked for Reg
Vardy plc. He is responsible for HR and Training within the Group.
• Martin Wastie, Group Strategy Director, (43) oversees the Group’s acquisitions, disposals and business
improvement initiatives. Martin was previously Group Finance Director of Marshall Group and worked
for Inchcape and Volkswagen Group. He has been with the Group 3 years.
These three individuals bring excellent skills and energy to the CEO Committee.

The stability of senior management provides a consistency that helps to build a single Group culture. As the Group
has expanded over a larger number of dealerships, maintaining focus and a consistency of culture remains
paramount. We believe that multi-layering of management is best avoided since it elongates decision-making and
can make senior management divorced from customers and the grass roots operations. Having the right people at
a senior level in the Group who can positively influence large divisions is therefore vital and the Board believe this
balance has been achieved to date. It is critical that the entrepreneurial culture that the business started with,
remains in place and simplicity and lack of bureaucracy are crucial objectives applied to operational proposals and
changes. We look to have a culture built on “Speed, Simplicity and Self-Confidence”.
The Mission Statement of the Group is to “deliver an outstanding customer motoring experience through honesty
and trust”. Fundamentally it is the acquisition and retention of customers that drives the ultimate value of the Group
in the long-term. Marketing is critical to both the acquisition and retention of customers. During the Period
substantial progress has been made to improve the quality, effectiveness and channel reach of the Group’s
marketing activities as Liz Cope concludes her second year as Chief Marketing Officer. Key achievements in the
Period include:
• Full on-line retailing of used vehicles has been launched including part-exchange, finance provision and delivery
to the door
• Sales through this on-line channel continue to build and we believe this full on-line retailing capability is unique
to the Group
• E-commerce and digital marketing expertise has been significantly enhanced in-house in the Period to develop
user digital experiences and deliver cost effective marketing campaigns
• New initiatives such as Buy-it-now are being rolled out across the Group whereby customers are offered the
ability to purchase the vehicles on-line that they have test driven during dealership visits
• Implementation of nationwide TV campaigns in both new and used car sales across multiple Group brands
delivering tactical sales and building brand awareness
• Profitability achieved in the Group’s Ace Parts on-line parts business with increased sales and product lines
through effective use of Marketplaces
The retention of customers is achieved by several Group strategies:
• Retention of sales customers into the higher margin aftersales channel is aided by the Group’s centralised
Business Development Centre which ensures contact is made to book relevant service work, in addition to
increasingly effective on-line booking capabilities.
• High sales penetration of service retention products, notably three-year service plans, has been successful in
increasing the retention of used car customers in the Group’s service departments. The Group now has over
104,000 customers paying monthly for servicing over a three-year period and 44% of used car customers are
retained into the Group’s service departments for routine servicing in the year following purchase.
• Customer experience is crucial for creating loyalty and the desire to return to the Group for future motoring
needs. Customer experience is measured by the Group in several ways:
o Manufacturers measure service and new car sales customer experience monthly for each dealership
as well as undertaking mystery shops. The Group scores significantly ahead of national average scores
on these measures and in addition undertakes its own extensive mystery shopping programme.
o On used cars, the Group measures customer experience using a third party. Over 97% of customers
currently would recommend the Group following the purchase of a used car. This high level of
customer advocacy is mirrored in high scores on the public review sites such as Trust Pilot.
o Management at all levels, including the Executive Directors, are rewarded based on the above
customer experience measures which the Board believes are fundamental to the future success of the
Group in generating higher revenues, margins and cash returns.
Other Industry Issues

United Kingdom’s exit from the European Union (EU)
The UK’s exit from the EU may impact the Group in the areas of changing regulation, currency fluctuations and terms
of trade for new vehicle imports to the United Kingdom.
In the short term, the biggest impact of Brexit on the automotive retail sector has been the weakening of Sterling
which reduces the attractiveness of the UK as a market to EU producing vehicle Manufacturers. Vehicle price rises
have been evident, along with reducing volumes in the new retail car sector since the Referendum.
In the medium term there could be consequences for the UK automotive retail sector if tariffs were to be introduced
on motor vehicles imported into the UK. This could further increase sales prices and potentially reduce consumer
demand. The UK Government has a stated negotiating objective to avoid any such tariff barriers, and in the
negotiation of the future trade terms between the UK and the EU, tariffs on motor vehicles are likely to be a key
point of discussion. Potential free trade agreements with Non-EU states may present UK opportunities for
Manufacturers with Non-EU production capacity and the future franchising strategy of the Group will need to be
cognisant of these developments.
The contractual relationships between Manufacturers and franchise partners are constructed within the framework
of EU competition law. There is, therefore, the potential for the legal frameworks to evolve in a different direction
once legal competency returns to the UK. The Board continues to judge that it is unlikely to be a priority area for
the UK Government in the short term and the status quo is likely to remain in place as a result. Franchise agreements
are evolving in any event as Manufacturers and retailers react to developments in technology, changing retail
formats and new revenue models.
GDPR
From May 2018 the Group will be required to comply with the enhanced EU regulations regarding the use of personal
data (“GDPR”). Following an extensive review of the Group’s systems and procedures, we have established a
detailed plan to ensure compliance with the new regulation. Our systems have been upgraded to enable the capture
and recording of preferences which will drive future customer contact. Training of all colleagues involved in
customer contact is underway, and a new post of Group Data and Security Manager has been created in order to
provide the required focus.
Regulatory Environment
The Group, via its subsidiary trading companies, acts as a credit broker for several finance company partners, both
Manufacturer owned and independent, who provide vehicle finance to the Group’s customers. In addition, the
Group sells a limited range of other regulated products. The Group has developed a robust sales and compliance
process to ensure that customers are treated fairly, addressing such potential risk areas as product affordability,
transparency of product explanations and ensuring remuneration structures protect customer outcomes.
Investment in systems to enhance control in these areas is ongoing.
The Financial Conduct Authority (“FCA”) is currently performing a review of the motor finance sector, which is due
to be completed in September 2018. The Group’s Compliance Committee has reviewed the FCA update on its Motor
Finance review, issued in March 2018, and continues to monitor the Group’s procedures and controls in this area.
Diesel Vehicles
Successive Governments have encouraged drivers, via the taxation system, to drive diesel vehicles which produce
lower amounts of carbon dioxide (CO2) emissions. This has enabled Governments to comply with European
emissions targets, based upon CO2. As a result the proportion of diesel vehicles in the vehicle parc has grown
considerably.
More recently focus has turned to the fact that previous generation diesel vehicles produce higher levels of nitrogen
oxide and particulates emissions, which are one of a number of sources impacting local air quality. Cars built after
2015, which comply with Euro 6 regulations, produce substantially less nitrogen oxide and particulates emissions

than older engines, and the introduction of Euro 6c engines from August 2018 will further enhance air quality
impacts. There has been a considerable amount of misinformation regarding these matters, and a lack of strategic
direction and consistency from Governments, both in the UK and elsewhere and at local and national level. This
situation has confused customers and made them fearful of diesel in its totality and as a consequence sales of the
more modern, environmentally friendly vehicles have reduced so reducing the potential speed of air quality
improvements. UK registrations of diesel vehicles fell by 17.1% during 2017, with the rate of decline accelerating
more recently to 31.9% for the four month period to April 2018. Manufacturers have begun to react by switching
diesel manufacturing capacity to petrol or hybrid vehicles, and this process is accelerating. The UK used diesel
vehicle market was buoyant in 2017 with transactions growing by 3.3% as more diesel vehicles were part exchanged
for new petrol product. Residual values of diesel vehicles versus petrol vehicles in the Period saw no major variation.
As at 28 February 2018 diesel vehicles represented 42.3% of the Group’s used vehicle inventory (2017: 45.7%).
WLTP New emission testing regulations for passenger cars come into effect in the EU on 1 September 2018 called
Worldwide Harmonised Light Vehicle Test Procedures (“WLTP”). This replaces the previous New European Driving
Cycle (“NEDC”) testing regimes. From 1 September 2018 only vehicles which have been tested under the new WLTP
regime can be sold as new vehicles, with the possible exception of small volumes of vehicles which member states
may allow to be sold in the short term under “derogation powers”. This change has the capacity to cause dislocation
in manufacturer production schedules and, in particular, could lead to short term supply issues which may impact
the important September market. We are currently working with each of our manufacturer partners to assess this
potential impact.
Market Dynamics
New Vehicles
During the Period, Sterling traded at lower levels against other major currencies, and this currency depreciation
(which began in June 2016 following the UK referendum on EU membership) impacted the supply side of the UK
new vehicle market. The majority of vehicles sold in the UK are manufactured in factories located in either Euro,
Yen or Won currency zones, and the depreciation of Sterling has made it less profitable for most Manufacturers to
sell vehicles in the UK. As a consequence, several manufacturers have increased selling prices, reassessed their UK
marketing budgets and diverted production to other more profitable markets. Manufacturers have also reduced
their exposure to the lower margin channels, for example daily rental, fleet and broker channels. This supply side
dynamic has also put downward pressure on pre-registration activity in the market place. These trends have been
most evident in volume franchises which have reduced the supply of vehicles into the UK market. While the same
economic and currency related challenges have faced premium franchises, the higher margins available to these
Manufacturers have enabled them to adopt a different, and more aggressive approach. Seeing the retreat of the
volume franchises, they have kept price rises to a minimum and have continued to fund attractive, often finance led,
offers to the UK consumers. As a consequence, premium franchises have grown their UK market share during the
Period.
On the demand side, the period leading up to the UK General Election in June 2017 saw a particularly volatile
consumer environment. This stabilised from July onwards but demonstrated weakness again during the pre-
Christmas period. Consumer confidence has appeared to regain a degree of vibrancy in 2018 to date compared to
2017. This consumer environment has been exacerbated by a lack of clarity from Government regarding its current
and future policy for diesel vehicles, and the media focus on this issue. This has led to a significant shift away from
diesel product and may have led to some customers delaying entering the market altogether whilst uncertainty
persists.

As a consequence of these supply and demand trends the UK private new retail vehicle registrations during the
Period fell by 7.6% and car fleet volumes fell by 5.7%.
The light commercial vehicle market also saw selling price increases and a reduction in volumes, with UK registrations
down by 3.5% in the Period. The year-on-year price increases were in part due to the introduction in June 2016 of
the more expensive Euro 6 models, and in part due to the currency impacts referred to above.
Used Cars
During the year ended 31 December 2017, the used car market in the UK recorded marginally declining sales of 1.1%
(SMMT) against a backdrop of volatility in consumer demand and reduced supply of volume used cars as pre-
registration activity reduced in line with the trends described above in the new car market.
On the supply side of volume used cars, reducing part-exchanges as a result of declining new car sales volumes from
April onwards, together with lower supply as a result of declining pre-registration volumes and a contracting daily
rental market, kept wholesale used car market prices robust as the Period progressed.
The premium used car market diverged in trends from the volume car market. The continued new car volume
pressure described above, led to high levels of nearly new and pre-registered product in the market competing with
strong new car offers. Residual values saw significant falls as a result in the Period with a consequent impact on
premium used car margins.
Since 1 January 2018 more normalised demand and supply conditions have been exhibited across the used car
market in the UK.
Aftersales
The aftersales market continued to benefit during the Period from a growing vehicle parc following several years of
new car market growth. The mix of service department work shifted in favour of warranty work as a consequence
of several manufacturer recalls and significant product quality issues affecting a number of franchises. The
continuing introduction by manufacturers of increasingly technologically complex, connected vehicles with
innovative engine and vehicle management systems is contributing to this trend. A growth in retail and warranty
demand was partly offset by reduced internal volumes in the workshops in the preparation of cars for sale,
particularly in relation to lower new car sales.
The rising demand for aftersales saw a lack of technician resource nationwide in 2017 and this constrained sales
growth in workshops. This capacity constraint reduced as the year went on due to: the impact of apprentice training
from previous years; increasing numbers of trained technicians coming into the market; rising salaries attracting
technicians from the non-franchised sector and more resource becoming available as tougher sector market
conditions led to a number of dealership closures in the UK.
Manufacturers continue to pursue strategies to increase the efficiency of parts distribution networks and to seek to
reduce the supply push of parts into the retailer network. Reduced rebates may arise from these changes, but
benefits such as a reduction in low margin sales, lower stockholding and obsolescence costs and reduced costs of
funding working capital, may also accrue to the retailer.

Group Revenues and Margins
Year ended 28 February 2018
Revenue
Revenue
Mix
Gross
Margin
Gross Margin
Mix
Gross
Margin £’m % £’m % %
Aftersales1 228.2 8.2 124.7 40.4 44.5
Used cars 1,068.9 38.2 98.7 31.9 9.2
New car retail and Motability 836.5 29.9 64.1 20.8 7.7
New fleet and commercial 662.5 23.7 21.4 6.9 3.2
2,796.1 100.0 308.9 100.0 11.0
Year ended 28 February 2017
Revenue
Revenue
Mix
Gross
Margin
Gross Margin
Mix
Gross
Margin £’m % £’m % %
Aftersales1 227.0 8.0 123.4 39.4 44.6
Used cars 1,037.5 36.8 100.7 32.1 9.7
New car retail and Motability 909.4 32.2 68.3 21.8 7.5
New fleet and commercial 648.7 23.0 21.1 6.7 3.3
2,822.6 100.0 313.5 100.0 11.1 1. margin in aftersales expressed on internal and external revenue.
Revenues in the Period fell by 0.9% (£26.5m) to £2,796.1m (2017: £2,822.6m). This included the full year impact of
prior year acquisitions which grew by £39.5m more than offset by closed operations contributing a year on year
revenue reduction of £60.8m. Group like-for-like revenues were flat at £2,569.9m (2017: £2,572.1m) despite a
significant fall in new retail vehicle sales.
The Group saw an increased proportion of revenues and gross profits generated by its higher margin aftersales and
used car operations. These operations contributed 46.4% (2017: 44.8%) of revenues and 72.3% (2017: 71.5%) of
gross profit. This reflected declining volumes in the new car retail and Motability channel.
Gross margins in the Group remained stable at 11.0% (2017: 11.1%). The positive effect of the higher aftersales and
used car sales mix was offset by pressure in the used car channel on margins. Used car margins fell from 9.7% to
9.2% and falls were particularly apparent in the premium franchises. This was reflective of the market dynamics
previously described.
Aftersales
The Group’s aftersales operations, which comprise servicing, supply of parts, accident repairs, smart repair and
forecourt activity, form a vital element of the Group’s business model, since significantly higher returns are
generated from these activities than those achieved in vehicle sales. While aftersales represents 8.2% of Group
revenues, it accounts for 40.4% of gross margin, so management focus on maintaining and improving performance
in this area is crucial to the Group’s overall results. The market for service and repair, in particular, has expanded
with the vehicle parc as new vehicle sales have grown over recent years and this momentum is expected to continue
for a period. The Group has substantial opportunities to grow the volume of the higher margin activities due to this
parc growth and self-help strategies to increase customer retention. The rapid development of new technology in

vehicles is further helping to improve customer retention into franchised dealerships as customers become
increasingly aware of the expertise and factory connectivity required to service modern connected vehicles.
During the Period the Group has made significant progress in developing and expanding the resource base which
underpins this key part of the business. A number of successful initiatives have been implemented in the aftersales
area:
• Earnings packages for both technicians and service advisors have been enhanced, both in terms of basic pay and
bonus earnings potential. This has helped a major recruitment campaign which has substantially reduced the
number of technician vacancies.
• The Group has recruited 138 apprentices into the aftersales arena during the Period to secure the future growth
in the business and will continue to invest heavily in this area.
• The Group has also established an innovative degree apprenticeship scheme in partnership with Northumbria
University to recruit service advisors who will develop into our aftersales leaders of the future. The first nine
colleagues recruited to this five year programme joined the Group in August and a further cohort of 12 is
planned to be recruited in the coming months. A Business Management Degree is studied for as part of the
Programme, funded by the Apprenticeship Levy.
• As part of the Group’s ongoing programme of capital investment in the dealership infrastructure, each
refurbishment or redevelopment project undertaken has sought to improve and maximise the productive
capacity of the aftersales departments. Service departments have been extended and restructured to increase
the number of ramps available and to enhance efficiency.
• The Group has introduced further initiatives to increase workshop capacity through shift patterns, longer
opening hours (including weekends), mobile van servicing and two technicians per ramp initiatives.
This focus on increasing the Group’s ability to meet customer demand for vehicle servicing in flexible ways is essential
as customers are seeking and expecting a more flexible “on demand” vehicle servicing experience, which is more
convenient for them. In addition, fast “while you wait” servicing is also likely to increase in scope. While customers
find franchised dealerships good value for money and expert on the product, leakage does occur to the independent
aftermarket which can be perceived as more local and more convenient in terms of opening hours.
The table below sets out the Group’s like-for-like aftersales revenues and margins, including both internal and
external revenue:
2018 2017 Growth
£’m £’m
Service revenue 102.8 98.2 4.7%
Parts and accident repair revenue 145.8 143.8 1.4%
Like-for-like aftersales revenue 248.6 242.0 2.7%
Service gross margin 76.4% 77.3%
Parts and accident repair gross margin 23.0% 23.1%
Like-for-like aftersales gross margin 45.1% 45.1%
Like-for-like margins were stable at 45.1% assisted by an increase in the mix of higher margin service revenues, and
like-for-like gross profits grew by a significant £3.0m (2.7%) in the Period. Service revenues rose 4.7% on a like-for-
like basis, representing the eighth successive year of growth in this key high margin area. Like-for-like service
margins fell slightly to 76.4% (2017: 77.3%) due to the impact of higher salary levels for technicians and lower
efficiency as inefficient diagnostic and warranty work increased at a faster rate than more efficient routine servicing
revenues. Increased service revenues are the result of the significant focus in the Group on driving operational

excellence in service to enhance financial performance, the delivery of excellent customer experiences to increase
customer loyalty and the success of the service plan retention strategy.
Supply of Manufacturer parts continues to be a vital part of the retailer model. Parts revenues rose 1.6% on a like-
for-like basis while margins strengthened to 21.4% (2017: 21.3%).
Vehicle sales The table below shows the volumes of vehicles sold on a like-for-like basis:
2018
2018
2018
2017
2017
Like-for- Like
%
Total
% Like-for-
Like Acquired1 Total Like-for-
Like Total Variance Variance
Used retail vehicles 79,052 769 79,821 79,445 81,636 (0.5%) (2.2%) New retail cars 34,811 601 35,412 40,157 41,525 (13.3%) (14.7%) Motability cars 10,650 120 10,770 11,127 11,396 (4.3%) (5.5%) Fleet and commercial vehicles 34,555 297 34,852 36,235 36,741 (4.6%) (5.1%)
Total New vehicles 80,016 1,018 81,034 87,519 89,662 (8.6%) (9.6%)
159,068 1,787 160,855 166,964 171,298 (4.73%) (6.1%)
1 relates to businesses acquired or developed subsequent to 1 March 2016 with businesses included within like-for-like once they have been in the Group for over 12 months
Used retail vehicles
During the Period the Group increased both total and like-for-like used vehicle revenues by 3.0%. This was driven
by price increases as like-for-like average sales prices rose in the Period by 4.0% from £12,445 to £12,945.
Following six years of consecutive like-for-like volume growth in used vehicle sales, the Group recorded a 0.5% like-
for-like volume decline during the Period. The decline in volume occurred during the second half of the Period in
line with the market trends recorded by the SMMT. The supply side factors influencing this included lower levels of
pre-registration stocks held by the Group due to less supply push from manufacturers, and hitting new car targets
without the need for self-registrations which are then sold as used cars. The demand side factors related to the
weaker consumer environment during the pre-Christmas period. In these circumstances the Group elected not to
sacrifice margin in the pursuit of volume, as evidenced by the higher gross profit per unit in the second half of the
year of £1,278 (2017 H2 : £1,222). Higher average sales prices in the Period had a significant impact on diluting gross
margin percentages from 9.7% to 9.2%. Margin erosion was particularly apparent in the Group’s premium franchises
where nearly new product was oversupplied in the market place and highly competitive new car offers had a
depressing impact on the sales prices that could be achieved on used product.
Like-for-like used car gross margins actually increased from 9.5% in the first half to 9.6% in the second half. The
impact of these margin trends across the Period was that the gross profit generated from like-for-like used vehicle
sales fell by £2.6m; £2.1m of this decline was in H1 and £0.5m in H2.

New retail cars and Motability Changes in new vehicle sales volumes during the Period were as follows:-
Increase/(decrease) year-on-year
Total %
Like-for-Like %
SMMT Registrations
% Volumes: New retail vehicles (14.7) (13.3) (7.6) Motability vehicles (5.5) (4.3) (2.7) Fleet new cars (6.0) (5.0) (5.7) Commercial new vehicles (4.1) (4.2) (3.5)
During the Period the Group’s like-for-like new car retail volumes reduced by 13.3% and the UK private new retail
registrations declined by 7.6% (SMMT) as shown in the table below. As a consequence the Group lost market share
in the Period reflecting the decline of the Group’s volume manufacturers in the period compared to the market as a
whole.
Volumes: Six months ended 31 August 2017
Six months ended 28 February 2018
12 months ended 28 February 2018
% % % SMMT registrations (Private) (6.4) (9.0) (7.6) Group new retail cars (14.7) (11.7) (13.3)
The Group’s trends in new retail car sales more closely mirrored the trends in the SMMT registrations in the second
half of the Period since the distorting impact of self-registrations included in the SMMT data (but not Group new
retail car sales volumes) reduced. This corresponded with the reduction in supply to the UK in volumes franchises
described earlier as a consequence of weaker Sterling.
The Motability new car market declined by 2.7% during the Period due to some volume Manufacturers reducing
supply into this low margin channel, and the impact of Government welfare reforms. Motability continues to be a
major strength of the Group and a major driver of servicing demand since Motability supplied vehicles have a three
year servicing plan linked to them that retains them to the supplying retailer. The Group saw like-for-like Motability
vehicle sales decline by 4.3%.
During the Period like-for-like selling prices increased by 4.8% as Manufacturers passed on an element of the impact
of the currency weakness. The Group maintained strong pricing disciplines and continued to achieve Manufacturer
volume targets at high levels during the Period resulting in an increase in gross margins to 7.7% (2017: 7.5%) and a
reduction in the Group’s self-registration activity.
Fleet & Commercial new vehicle sales During the Period the Group saw like-for-like selling prices in the fleet and commercial segment increase by 7.2% as
the major volume Manufacturers sought to protect their margins and increase prices in these channels. The Group’s
like-for-like sales volumes reduced by 4.6%, slightly better than the market which fell by 5.2% (SMMT). This reflected
a stronger volume performance in the second half of the Period as the Group took more market share. While gross
profit per unit remained strong at £582 (2017: £560) the higher selling prices resulted in slightly lower gross profit
margin at 3.2% (2017: 3.3%).

Exceptional Items
On 31 August 2017 the Group undertook a sale and leaseback transaction realising £14.2m on a recently acquired
and redeveloped dealership property (Jaguar Land Rover Leeds) with a book value of £10m. The lease commitment
was for 15 years, the initial rent was at open market value and the terms of the periodic rent reviews contain
appropriate protection against future increases. This transaction demonstrates both the quality and value of the
property portfolio.
During January 2018 the Group disposed of its former Volkswagen dealership in Boston, Lincolnshire. The disposal
included a freehold dealership property which realised a loss on disposal of £0.5m, and a further £0.1m of goodwill
was also written off resulting in a loss on disposal of £0.6m. This loss has been offset against the profit of £4.1m on
the disposal of the property referred to above, resulting in a net exceptional property gain of £3.5m.
Managing Operating Expenses
In an inherently low margin business, it is vital that a disciplined framework of cost control is in place and that this
is a core competency for operational management. This is even more important than ever in the current
environment of softer new vehicle volumes and cost pressure evident across the UK retail sector. The Group’s cost
control framework is built around a highly detailed business planning approach which is undertaken annually for all
dealerships, profit centres and cost centres. Once the business plans are established, costs are benchmarked on a
monthly basis for every dealership against the business plans, prior year levels, internal benchmarks and recognised
industry key performance indicators to maintain control and to identify opportunities for additional cost or efficiency
improvements. The Group’s central purchasing function also pursues cost efficiencies and scale purchasing benefits
in the procurement and monitoring of utilities and other goods not-for-resale.
The Group is also focused on driving productivity and efficiency into the business to enhance cash profits and offset
cost headwinds. A committee chaired by the CEO has been in place for the last two years with a remit to identify
and execute these productivity gains and these have borne fruit. Colleagues are incentivised to identify bureaucracy,
costs and processes that do not add value via a “You Suggest” scheme, which has also yielded some excellent areas
for action. Several more medium term projects are also in place to increase operational efficiencies and to reduce
costs. Projects are assessed to achieve a cash payback within two years and often payback is shorter.
Total operating expenses in the period fell from £281.5m to £280.1m and like-for-like operating expenses grew by
£3m or 1.2%. This represents a significant result in the current environment. All of the growth on a like-for-like basis
arose in the second half of the Period. As a percentage of revenues, operating expenses remained flat at 10.0%
(2017: 10.0%). This demonstrates the significant focus which the Group has continued to place upon cost control.
The action taken to fix, re-franchise, sell or close underperforming dealerships has removed unproductive cost bases
from the business, and the continued search for productivity improvements has minimised the significant impact of
increases in taxes and other Government imposed costs (business rates, apprenticeship levy, minimum wage) as well
as other inflationary impacts upon the Group’s trading results.
The increase in like-for-like operating expenses includes:-
• higher (non-cash) depreciation as a consequence of increased capital investment levels over the last two years
(£1.0m)
• higher business rates on dealership properties (£0.3m)
• the recruitment of technician, parts and service adviser apprentices (£0.3m)
• the recruitment of additional service advisors, and enhancements to service advisor packages (£0.7m)
• higher vehicle cleaning costs reflecting increased resources required as service demand grew and increased pay
rates (£0.7m)
• the recruitment of additional colleagues to support the development of the Group’s internet and digital
marketing activities (£1.1m)
• higher spend in the final quarter of the Period on TV advertising to support the Group’s new car sales in March
2018 (£0.4m)
These increases have been offset by headcount and other cost savings achieved in the sales departments as vehicle
sales volumes have declined.
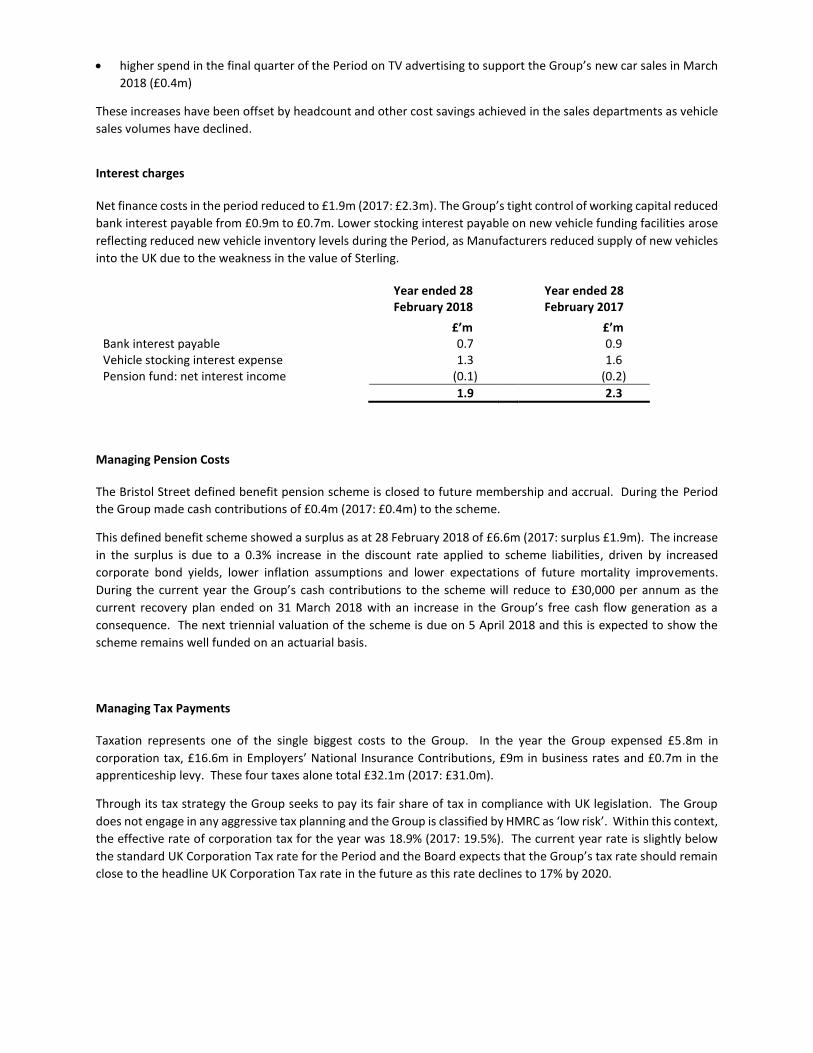
Interest charges Net finance costs in the period reduced to £1.9m (2017: £2.3m). The Group’s tight control of working capital reduced
bank interest payable from £0.9m to £0.7m. Lower stocking interest payable on new vehicle funding facilities arose
reflecting reduced new vehicle inventory levels during the Period, as Manufacturers reduced supply of new vehicles
into the UK due to the weakness in the value of Sterling.
Year ended 28 February 2018
Year ended 28 February 2017
£’m £’m Bank interest payable 0.7 0.9 Vehicle stocking interest expense 1.3 1.6 Pension fund: net interest income (0.1) (0.2)
1.9 2.3
Managing Pension Costs
The Bristol Street defined benefit pension scheme is closed to future membership and accrual. During the Period
the Group made cash contributions of £0.4m (2017: £0.4m) to the scheme.
This defined benefit scheme showed a surplus as at 28 February 2018 of £6.6m (2017: surplus £1.9m). The increase
in the surplus is due to a 0.3% increase in the discount rate applied to scheme liabilities, driven by increased
corporate bond yields, lower inflation assumptions and lower expectations of future mortality improvements.
During the current year the Group’s cash contributions to the scheme will reduce to £30,000 per annum as the
current recovery plan ended on 31 March 2018 with an increase in the Group’s free cash flow generation as a
consequence. The next triennial valuation of the scheme is due on 5 April 2018 and this is expected to show the
scheme remains well funded on an actuarial basis.
Managing Tax Payments
Taxation represents one of the single biggest costs to the Group. In the year the Group expensed £5.8m in
corporation tax, £16.6m in Employers’ National Insurance Contributions, £9m in business rates and £0.7m in the
apprenticeship levy. These four taxes alone total £32.1m (2017: £31.0m).
Through its tax strategy the Group seeks to pay its fair share of tax in compliance with UK legislation. The Group
does not engage in any aggressive tax planning and the Group is classified by HMRC as ‘low risk’. Within this context,
the effective rate of corporation tax for the year was 18.9% (2017: 19.5%). The current year rate is slightly below
the standard UK Corporation Tax rate for the Period and the Board expects that the Group’s tax rate should remain
close to the headline UK Corporation Tax rate in the future as this rate declines to 17% by 2020.

Capital Structure
The Group has an ungeared balance sheet with shareholders’ funds of £264.4m (2017: £246.4m), representing net
assets per share of 68.9p (2017: 62.3p) as at 28 February 2018. The Group has tangible net assets of £174.3m (2017:
£156.1m) and the balance sheet is underpinned by a freehold and long leasehold property portfolio, including assets
held for resale, of £183.8m (2017: £182.0m). The Group has a robust tangible net assets per share value of 45.4p as
a result. The Board believes that a strong balance sheet backed by property assets used in the business, and where
debt taken on is long term in nature rather than short term, is in the interests of the business’s owners. This
approach reduces the Group’s exposure to interest rate and rent increases and makes the business highly resilient
in the event of a cyclical downturn in activity.
The Group finances its operations by a mixture of shareholders’ equity, bank borrowings and trade credit from
suppliers and Manufacturer partners. On 28 February 2018, the Group extended its five year acquisition facility with
Barclays Bank plc and Royal Bank of Scotland plc for a further year. This facility, which now matures on 27 February
2023, provides the Group with £40m of committed borrowing capacity with the potential to add a further £30 million
which is currently uncommitted. £10 million of this facility was drawn as at 28 February 2018. Interest is payable
on this facility at LIBOR plus a rate between 1.3% and 2.1% depending upon the ratio of net debt to EBITDA. In order
to reduce the Group’s exposure to interest rate risk, the Board entered into a three year interest rate swap on 31
July 2017, maturing on 31 July 2020 in respect of the £10m drawn on the loan facilities. This swap fixes the
underlying LIBOR rate payable at 0.675%.
In addition to conventional bank borrowing, the Group also utilises used car stocking loans on a very limited basis.
These loans with third party banks are subject to interest at 1.5% above LIBOR and are secured on the related
vehicles. As at 28 February 2018, these borrowings amounted to £12.8m (2017: £8.7m) representing 14.5% of the
value of the Group’s used vehicles (2017: 11.7%). The Group considers such borrowings as debt and includes such
amounts in the calculation of gearing and net debt (cash). These facilities are short term in nature and can be called
to be repaid on demand. As a consequence, these facilities are not extensively utilised to fund long term assets.
The Group operated with cash balances for much of the year and additional facilities are utilised to fund significant
peak working capital requirements following plate change months and quarter ends. The Group has £73m of
overdraft and other money market facilities. On the overdraft, interest was paid on drawn amounts at 1.1% above
Base Rate, and on the money market facilities interest was paid at 1.1% above LIBOR. As at 28 February 2018, the
Group had cash balances of £41.7m (2017: £39.8m) and, as a consequence, net cash of £19.3m (2017: net cash
£21.0m).
During the period, the Group comfortably complied with all of the financial covenants in respect of its borrowing
facilities, which include net debt to EBITDA and interest and lease costs to EBITDAR.
The cash position at 28 February 2018 reflects the seasonal reduction in working capital, typical of the industry,
which arises at the month end prior to a plate change month. As a result of the normal seasonal movements in
working capital the year-end cash position is higher than the normalised cash balances throughout the remainder of
the year by approximately £20m.
Capital Allocation
Consideration of capital allocation is central to the Board’s decision making. The Board proactively believes that the
Group’s funding structure should remain highly conservative and that the application of the Group’s debt facilities
to fund activities or acquisitions which meet the Group’s hurdle rates for investment, will enhance return on equity
and increase cash profits in the future.
The Board seeks to balance the dealership portfolio between freehold and leasehold premises to ensure appropriate
capital allocation. During the financial year the Group undertook the sale and leaseback of the recently redeveloped

Jaguar Land Rover Leeds dealership property, realising £14.2m of cash, against the book value of the property of
£10m. This transaction demonstrated both the quality and value of the Group’s property portfolio and the Board’s
consideration of capital allocation in its willingness to be flexible as to operating with either freehold or leasehold
properties, on the right terms. The Board adopts a conservative approach to the terms of leases, favouring lease
breaks to provide flexibility and open market value rent reviews to manage rent increase risks. The lease
commitment under the sale and leaseback transaction was for a period of 15 years, the initial rent was at open
market value and the terms of the periodic rent reviews contain appropriate lessee protection against future
increases. As at 28 February 2018, freehold locations represented 52% of the Group’s property portfolio (2017:
53%).
The Group commenced its Share Buy-back Programme in July 2017 and as at 8 May 2018, 18.0m shares, representing
4.53% of the issued share capital, have been purchased at an average price of 43.8p, had been acquired for
cancellation for a total of £7.9m. The Board believes that this is an appropriate use of capital and we expect share
Buy-backs to form a relevant element of our returns to our shareholders, alongside dividend payments at interim
and full year. The consequence of the Buy-back Programme to date will be to reduce future dividend payments,
based on 1.5p per share, equating to an annual saving of £270,000 cash. Since the Group commenced dividend
payments in 2011, our dividend has increased by 200% in absolute terms, including the 7.1% increase this year. The
Board will seek to renew approval to repurchase 10% of the issued share capital at the forthcoming Annual General
Meeting.
In common with most sector participants, the Group continues a programme of major capital investment to increase
the capacity in existing dealerships and to meet revised Manufacturer franchise standards. In particular, significant
sums are being invested in increasing capacity and enhancing the retail environment of the Jaguar Land Rover
dealerships with the implementation of the “Arch” concept and similar developments are planned to improve certain
of the Group’s dealerships representing the Mercedes-Benz franchise. These were as envisaged at the time of the
Greenoaks acquisition. The bulk of these projects will be completed in the current financial year, after which the
Group’s allocation of capital to the existing dealership portfolio will significantly decrease as set out in the next
section. The Board critically evaluates all proposed capital expenditure to ensure it makes sense from a capital
allocation and shareholder return perspective, and has chosen not to undertake a number of prospective projects
following such reviews where it believes appropriate returns may not be generated.
The Group regularly reviews its capital allocation within its existing dealership and property portfolio. The
importance of property arrangements within an automotive retail business should not be underestimated. The
Property Committee, chaired by the CEO and including external advisors, meets monthly to formally review and
actively manage the Group’s property portfolio. The management of the Group’s property portfolio to maximise
cash returns from surplus assets is an important driver of both cash flows to the Group over time and ensuring
appropriate capital allocation. The Board balances the need to recycle surplus assets into cash as quickly as possible
with the requirement to maximise the ultimate cash generation from taking advantage of planning consents. Surplus
assets arise from the ‘pruning’ of poor performing dealerships, the relocation of businesses and the sale of surplus
land acquired in the development of new dealerships and from acquisitions. During the Period, this process recycled
£1.2m of property and £1.6m of working capital from marginal or loss-making businesses closed or disposed of in
the Period to activities generating higher returns.
As at the date of this report the Group is actively engaged in the marketing of a number of surplus freehold assets.
The Group sold one such surplus property subsequent to 28 February 2018, generating cash proceeds of £2.0m,
compared to the £1.4m book value.

Capital Expenditure
The cash impact of capital expenditure and disposals during the Period, along with the anticipated spend in future
years, is set out below:
Actual Estimate
FY FY FY FY FY
2016 2017 2018 2019 2020
£'m £'m £'m £'m £'m
Purchase of property 6.3 5.3 4.3 1.6 -
New dealership build 1.8 10.4 4.3 4.6 2.5
Existing dealership capacity increases 4.5 5.9 8.2 13.1 4.4 Manufacturer-led refurbishment projects 3.2 2.4 3.0 9.9 4.6
IT and other ongoing capital expenditure 5.1 4.8 4.9 4.8 4.0
Movement on capital creditor (0.4) 0.7 (0.6) - -
Cash outflow from capital expenditure 20.5 29.5 24.1 34.0 15.5 Proceeds from sale and leaseback and property sales (1.1) (1.0) (14.3) (4.6) -
Net cashflow from capital investment 19.4 28.5 9.8 29.4 15.5
During the Period the Group purchased the freehold interest in its leased Bradford Land Rover dealership at a cost
of £3.6m. The passing rent under the lease was £190,000 per annum, with a rent review due at the time of purchase.
This acquisition will allow the Group greater flexibility over the site configuration as the dealership is redeveloped
under the Land Rover ‘Arch’ concept in 2020. In addition, £0.7m was invested in additional land for vehicle storage
in Bradford to improve the efficiency of the retail operation.
During the year the main project in the new dealership build category was the commencement of construction of
the ‘Arch’ concept Jaguar Land Rover dealership in Bolton. This £8.3m project, managed by the Group’s in-house
team of project managers and surveyors, will be completed in July 2018, bringing together in one flagship freehold
location, the Land Rover and Jaguar outlets currently operating from leasehold premises in Bury and Bolton. The
new dealership utilises surplus land adjacent to another of the Group’s dealerships so maximising returns from the
Group’s freehold property portfolio.
Major projects to increase the capacity of the existing dealerships during the year included the extension and
refurbishment of Bolton Ford to create a ‘Ford Store’ as well as the redevelopment of the showroom facilities at the
Shirley Ford dealership, following the relocation of aftersales activities offsite. Shirley is one of the Group’s top
performing new and used car outlets and the customer experience, for used sales in particular, will be enhanced by
this investment. Offsite aftersales and pre-delivery inspection facilities were also developed for the Chesterfield and
Nelson Land Rover dealership to facilitate the future development of these locations under the ‘Arch’ concept.
In the year ending 28 February 2019, major projects are being undertaken to increase existing dealership capacity.
These will include redevelopments of Reading and Slough Mercedes-Benz, Nelson, Chesterfield and Guiseley Land
Rover and Bradford Jaguar Land Rover. These developments will deliver operations with greater capacity for sales
and service and will underpin the Group’s future profitability and cash generation.
The Board is confident that the significant reduction in future capital spend anticipated in FY2020 will deliver
enhanced free cash flow from the business. By the end of the year practically all the dealership estate will have been
redeveloped updated to the latest manufacturer standards in recent years.
Managing Working Capital

The Group has generated cash from operating activities of £27.3m from an operating profit of £32.3m. Working
capital absorbed £13.3m in the year following a number of years of positive working capital movements generating
cash. All of the working capital absorption arose during the first half of the Period.
The Group has significant levels of working capital in the form of inventory, receivables and payables. These are
subject to significant, yet predictable, seasonal fluctuations which coincide with plate change months and quarterly
Manufacturer new car campaigns. In addition, Manufacturer new vehicle supply levels and financing changes can
also impact working capital patterns over time. The Group benefits from VAT reclaimed on new vehicle inventory
invoiced from the Manufacturer which has yet to be paid for in cash. At the beginning of the Period, these inventory
levels declined, resulting in a VAT cash outflow in the first half of the Period of £16.8m. This partially reversed in the
second half of the Period. During the final quarter of the Period the value of this inventory and corresponding
creditor increased to above prior year levels, resulting in a £10.2m increase in VAT receivable in the February 2018
balance sheet when compared to February 2017. This cash was received in April 2018 so reducing working capital
levels at that point.
Lower new vehicle sales in September 2017 and March 2018 were expected to generate lower part exchange supply
for the Group’s used car operations, hence the Group decided to increase used vehicle inventory going into
September and March to compensate. In addition, average value per used vehicle increased year on year. As a
consequence, total used car stock levels increased to £88.3m at the end of February 2018 (2017: £74.0m). Partially
offsetting this working capital absorption is a reduction in fully paid new vehicle stock and a £4m increase in the
value of cash held in respect of the Group’s warranty and service plan products.
Free cashflow to equity
The Board regularly measures the long term free cashflow (operating cashflow less interest, capital expenditure and
tax, before acquisitions and dividends) as a return on the shareholders’ cash invested capital (capital raised plus
after-tax operating profits less dividends). This measure, when compared to the cost of capital, provides an
indication of the extent to which cash, hence value, is being created in the long term. This measure stands at 10.6%
over the 11 years since the Group’s formation (2017: 12.1% over 10 years). This return compares favourably to the
Group’s weighted average cost of capital of 8%. The reduction in the recent Period indicated above is a result of the
high level of cash deployed on capital investment in the Period. As set out above, we expect this level of capital
investment to increase in the current financial year before declining in 2020, when the free cashflow to equity metric
should begin to increase.
Dividends
During the six year period since the Group commenced payment of dividends to its owners in 2011, over £23.1m has
been returned to the owners of the business through dividends, with the dividend per share increasing by 200% over
the same period. The dividend has been funded from cash generated from operations, without any negative impact
on ongoing capital expenditure programmes nor funding of suitable acquisitions.
The Board has proposed an increase in the final dividend for 2018, payable on 30 July 2018 subject to approval at
the AGM, to 0.95 pence per share (2017: 0.9p), which, when taken together with the interim dividend paid in January
2018 of 0.55 pence per share (2017: 0.5p), provides a total dividend for the year of 1.50 pence per share (2017:
1.40p). This represents an increase of 7.1% and a dividend cover of 3.9 times (2017: 4.7 times) based upon adjusted
earnings per share. The ex-dividend date will be 21 June 2018 and the associated record date 22 June 2018.
The proposed full year dividend of 1.50 pence represents an annualised cash dividend, based on the number of
shares in issue at 28 February 2018, of £5.7m (2017: £5.5m). The implementation of the share buyback programme
has, of course, reduced the cash impact of dividend increases in the Period. The distributable reserves in the parent
company balance sheet as at 28 February 2018 were £72.2m (2017: £58.9m). At this level of pay-out the Board does
not consider there to be any significant risks to the Group’s ability to continue to pay dividends other than those
risks listed in the annual report.

Robert Forrester Michael Sherwin Chief Executive Officer Chief Financial Officer CONSOLIDATED INCOME STATEMENT (AUDITED) For the year ended 28 February 2018
2018 2017
Note £’000 £’000
Revenue 2,796,068 2,822,589
Cost of sales (2,487,176) (2,509,049)
Gross profit 308,892 313,540
Operating expenses (before exceptional items) (280,086) (281,466)
Exceptional items 3,539 -
Operating profit 32,345 32,074
Amortisation of intangible assets 614 614
Exceptional items 2 (3,539) -
Share based payments charge 1,031 1,082
Operating profit before amortisation, exceptional items and share based payments charge
30,451
33,770
Finance income 3 66 261
Finance costs 3 (1,964) (2,515)
Profit before tax 30,447 29,820
Amortisation of intangible assets 614 614
Exceptional items 2 (3,539) -
Share based payments charge 1,031 1,082
Profit before tax, amortisation, exceptional items and share based payments charge
28,553
31,516
Taxation 4 (5,766) (5,800)
Profit for the year attributable to equity holders 24,681 24,020
Basic earnings per share (p) 5 6.31 6.14
Diluted earnings per share (p) 5 6.21 6.04

CONSOLIDATED STATEMENT OF COMPREHENSIVE INCOME (AUDITED) For the year ended 28 February 2018
2018 2017 £’000 £’000 Profit for the year 24,681 24,020 Other comprehensive income / (expense) Items that will not be reclassified to profit or loss:
Actuarial gains / (losses) on retirement benefit obligations
4,422
(4,687)
Deferred tax relating to actuarial (gains) / losses on retirement benefit obligations (752) 937
Items that may be reclassified subsequently to profit or loss:
Cash flow hedges (93) - Deferred tax relating to cash flow hedges 18 -
Other comprehensive income / (expense) for the year, net of tax 3,595 (3,750)
Total comprehensive income for the year attributable to equity holders 28,276 20,270

CONSOLIDATED BALANCE SHEET (AUDITED) As at 28 February 2018
2018 2017 £’000 £’000 Non-current assets Goodwill and other indefinite life assets 94,381 94,595 Other intangible assets 1,316 1,518 Retirement benefit asset 6,551 1,884 Property, plant and equipment 198,004 197,545
Total non-current assets 300,252 295,542
Current assets Inventories 558,386 506,470 Trade and other receivables 66,272 52,545 Cash and cash equivalents 41,709 39,845
666,367 598,860
Property assets held for sale 2,449 -
Total current assets 668,816 598,860
Total assets 969,068 894,402
Current liabilities Trade and other payables (663,404) (610,317) Deferred consideration - (1,572) Current tax liabilities (3,304) (3,840) Borrowings (12,811) (8,671)
Total current liabilities (679,519) (624,400)
Non-current liabilities Borrowings (9,585) (10,166) Derivative financial instruments (92) - Deferred consideration (100) (236) Deferred income tax liabilities (6,477) (5,555) Deferred income (8,877) (7,616)
Total non-current liabilities (25,131) (23,573)
Total liabilities (704,650) (647,973)
Net assets 264,418 246,429
Capital and reserves attributable to equity holders of the Group
Ordinary share capital 38,552 39,727 Share premium 124,934 124,932 Other reserve 10,645 10,645 Hedging reserve (75) - Treasury share reserve (690) (756) Capital redemption reserve 1,175 - Retained earnings 89,877 71,881
Shareholders’ equity 264,418 246,429

CONSOLIDATED CASH FLOW STATEMENT (AUDITED) For the year ended 28 February 2018
2018 2017 Note £’000 £’000 Cash flows from operating activities Operating profit 32,345 32,074 Profit on sale of property, plant and equipment (3,529) (285) Amortisation of other intangible assets 614 614 Depreciation of property, plant and equipment 9,714 8,665 Impairment charges 513 - Movement in working capital (13,332) 16,040 Share based payments charge 954 1,015
Cash generated from operations 27,279 58,123 Tax received 350 359 Tax paid (6,468) (6,103) Finance income received 14 34 Finance costs paid (2,321) (2,447)
Net cash generated from operating activities 18,854 49,966
Cash flows from investing activities Acquisition of businesses, net of cash and overdrafts acquired (1,181) (49,962) Acquisition of freehold and long leasehold land and buildings
(4,346)
(4,456)
Purchases of intangible assets (411) (460) Purchases of other property, plant and equipment (19,802) (25,092) Proceeds from disposal of business (net of cash and overdrafts)
1,528
875
Proceeds from sale and leaseback transaction 14,150 - Proceeds from disposal of property, plant and equipment 165 950
Net cash outflow from investing activities (9,897) (78,145)
Cash flows from financing activities Net proceeds from issuance of ordinary shares - 33,631 Proceeds from borrowings 7 4,140 10,831 Repayment of borrowings 7 (166) (14,000) Sale / (purchase) of treasury shares 62 (1,000) Repurchase of own shares (5,451) - Dividends paid to equity holders 6 (5,678) (5,353)
Net cash (outflow) / inflow from financing activities (7,093) 24,109
Net increase / (decrease) in cash and cash equivalents 1,864 (4,070) Cash and cash equivalents at beginning of year 39,845 43,915
Cash and cash equivalents at end of year 41,709 39,845

CONSOLIDATED STATEMENT OF CHANGES IN EQUITY (AUDITED) For the year ended 28 February 2018
Ordinary
share capital
Share premium
Other reserve
Hedging Reserve
Treasury
share reserve
Capital
redemption reserve
Retained earnings
Shareholders’ equity
£’000 £’000 £’000 £’000 £’000 £’000 £’000 £’000 As at 1 March 2017 39,727 124,932 10,645 - (756) - 71,881 246,429 Profit for the year - - - - - - 24,681 24,681 Actuarial gains on retirement benefit obligations - - - - - - 4,422 4,422 Tax on items taken directly to equity - - - 18 - - (752) (734) Fair value losses - - - (93) - - - (93)
Total comprehensive income for the year - - - (75) - - 28,351 28,276
Sale of treasury shares - 2 - - 66 - (6) 62 Repurchase of own shares - - - - - - (5,625) (5,625) Cancellation of repurchased shares (1,175) - - - - 1,175 - - Dividend paid - - - - - - (5,678) (5,678) Share based payments charge - - - - - - 954 954
As at 28 February 2018 38,552 124,934 10,645 (75) (690) 1,175 89,877 264,418
The repurchase of own shares in the year was made pursuant to the share buyback programme announced on 26 July 2017. Ordinary shares to the value of £5,441,000 had been repurchased in the year ended 28 February 2018, of which £174,000 was unpaid at 28 February 2018. 11,745,322 of the repurchased shares had been cancelled at 28 February 2018 and accordingly, the nominal value of these shares has been transferred to the capital redemption reserve. During the year, the Group repurchased £166,000 of cumulative preference shares for £350,000. The excess over the nominal value of the preference shares of £184,000 is included in “Repurchase of own shares” above. The other reserve is a merger reserve, arising from shares issued for shares as consideration to the former shareholders of acquired companies.

For the year ended 28 February 2017 Ordinary
share capital
Share
premium
Other
reserve
Treasury share
reserve
Retained earnings
Shareholders’ equity
£’000 £’000 £’000 £’000 £’000 £’000 As at 1 March 2016 34,127 96,901 10,645 - 56,186 197,859 Profit for the year - - - - 24,020 24,020 Actuarial losses on retirement benefit obligations - - - - (4,687) (4,687) Tax on items taken directly to equity - - - - 937 937
Total comprehensive income for the year - - - - 20,270 20,270
New ordinary shares issued 5,600 29,400 - - - 35,000 Cost of issuance of ordinary shares - (1,369) - - - (1,369) Purchase of treasury shares - - - (1,000) - (1,000) Treasury shares issued - - - 244 (237) 7 Dividend paid - - - - (5,353) (5,353) Share based payments charge - - - - 1,015 1,015
As at 28 February 2017 39,727 124,932 10,645 (756) 71,881 246,429

NOTES
For the year ended 28 February 2018
1. Basis of preparation
Vertu Motors plc is a Public Limited Company which is listed on the AiM market and is incorporated and domiciled in England. The address of the registered office is Vertu House, Fifth Avenue Business Park, Team Valley, Gateshead, Tyne and Wear, NE11 0XA. The registered number of the Company is 05984855.
The Group prepares financial information under International Financial Reporting Standards (IFRS) issued by the IASB and as adopted by the European Union (EU) and on the same basis as in 2017. Further information in relation to the Standards adopted by the Group is available on the Group’s website www.vertumotors.com.
Whilst the financial information included in this announcement has been computed in accordance with International Financial Reporting Standards (IFRS’s), this announcement does not itself contain sufficient information to comply with IFRS’s. The Group published full financial statements that comply with IFRS’s today and these are available on the Group’s website, www.vertumotors.com.
The financial information presented for the years ended 28 February 2018 and 28 February 2017 does not constitute the Company’s statutory accounts as defined in Section 434 of the Companies Act 2006, but is derived from those financial statements. The auditors’ reports on the 2018 and 2017 financial statements were unqualified. A copy of the statutory accounts for 2017 has been delivered to the Registrar of Companies. Those for 2018 will be delivered following the Company’s annual general meeting, which will be convened on 25 July 2018.
Accounting policies
The annual consolidated financial statements of Vertu Motors plc are prepared in accordance with IFRS’s as adopted by the European Union. The annual report has been prepared on the going concern basis under the historical cost convention, as modified by the revaluation of financial assets and liabilities (including derivative financial instruments) at fair value through profit or loss.
The accounting policies adopted in this annual report can be found on our website, www.vertumotors.com, and are consistent with those of the Group’s financial statements for the year ended 28 February 2017.
Segmental information
The Group adopts IFRS 8 “Operating Segments” which determines and presents operating segments based on information provided to the Group’s Chief Operating Decision Maker (“CODM”), Robert Forrester, Chief Executive. The CODM receives information about the Group overall and therefore there is one operating segment.
The CODM assesses the performance of the operating segment based on a measure of both revenue and gross margin. However, to increase transparency, the Group has included below an additional voluntary disclosure analysing revenue and gross margin within the reportable segment.
Year ended 28 February 2018
Revenue
Revenue
Mix
Gross
Margin
Gross Margin
Mix
Gross
Margin £’m % £’m % %
Aftersales * 228.2 8.2 124.7 40.4 44.5
Used cars 1,068.9 38.2 98.7 31.9 9.2
New car retail and Motability 836.5 29.9 64.1 20.8 7.7
New fleet and commercial 662.5 23.7 21.4 6.9 3.2
2,796.1 100.0 308.9 100.0 11.0
Year ended 28 February 2017

Revenue
Revenue
Mix
Gross
Margin
Gross Margin
Mix
Gross
Margin £’m % £’m % %
Aftersales * 227.0 8.0 123.4 39.4 44.6
Used cars 1,037.5 36.8 100.7 32.1 9.7
New car retail and Motability 909.4 32.2 68.3 21.8 7.5
New fleet and commercial 648.7 23.0 21.1 6.7 3.3
2,822.6 100.0 313.5 100.0 11.1
*margin in aftersales expressed on internal and external turnover
2. Exceptional items
2018 2017 £’000 £’000 Profit on disposal of freehold property 4,149 - Loss on disposal of Boston Volkswagen (610) -
3,539 -
On 31 August 2017 the Group completed the sale and operating lease back of the freehold property operated by the Group’s Jaguar Land Rover dealership in Leeds, West Yorkshire. This transaction realised £14,150,000 of cash proceeds and £4,149,000 profit on disposal.
On 4 January 2018, the Group disposed of the trade and certain assets of its Volkswagen dealership in Boston. The Group received sales proceeds of £1,200,000 in respect of the freehold property from which the dealership operated, incurring a loss on disposal of £610,000 representing a loss on freehold property of £510,000 and loss on goodwill of £100,000. All other assets and liabilities disposed of with this transaction recovered their carrying value.
3. Finance income and costs
2018 2017 £’000 £’000 Interest on short-term bank deposits 18 34 Net finance income relating to defined benefit pension schemes
48
227
Finance income 66 261
Bank loans and overdrafts (673) (876) Vehicle stocking interest (1,291) (1,639)
Finance costs (1,964) (2,515)
4. Taxation
2018 2017

£’000 £’000 Current tax Current tax charge 5,861 6,468 Adjustment in respect of prior years (281) (227)
Total current tax 5,580 6,241 Deferred tax Origination and reversal of temporary differences 512 (70) Adjustment in respect of prior years (256) (112) Rate differences (70) (259)
Total deferred tax 186 (441)
Income tax expense 5,766 5,800
2018 2017 £’000 £’000 Profit before taxation from continuing operations 30,447 29,820 Profit before taxation multiplied by the rate of corporation tax in the UK of 19.1% (2017: 20.0%) 5,815 5,964 Non-qualifying depreciation 499 357 Non-deductible expenses 174 267 Effect on deferred tax balances due to rate change (70) (259) Property adjustment (63) (168) Permanent benefits (52) (22) Adjustments in respect of prior years (537) (339)
Total tax expense included in the income statement 5,766 5,800
The Group’s effective rate of tax is 18.94% (2017: 19.45%).
The standard rate of Corporation Tax in the UK is 19% with effect from 1 April 2017. Accordingly, the Group’s profits for this accounting period are taxed at a rate of 19.1%.

5. Earnings per share
Basic and diluted earnings per share are calculated by dividing the earnings attributable to equity shareholders by the weighted average number of ordinary shares during the year or the diluted weighted average number of ordinary shares in issue in the year.
The Group only has one category of potentially dilutive ordinary shares, which are share options. A calculation has been undertaken to determine the number of shares that could have been acquired at fair value (determined at the average annual market price of the Group’s shares) based on the monetary value of the subscription rights attached to the outstanding share options.
The number of shares calculated, as set out above, is compared with the number of shares that would have been issued assuming the exercise of the share options.
Adjusted earnings per share is calculated by dividing the adjusted earnings attributable to equity shareholders by the weighted average number of ordinary shares in issue during the year.
2018 2017 £’000 £’000 Profit attributable to equity shareholders 24,681 24,020 Amortisation of intangible assets 614 614 Exceptional items (3,539) - Share based payments charge 1,031 1,082 Tax effect of adjustments (119) (119)
Adjusted earnings attributable to equity shareholders 22,668 25,597
Weighted average number of shares in issue (‘000s) 391,317 391,116 Potentially dilutive shares (‘000s) 5,948 6,800
Diluted weighted average number of shares in issue (‘000s) 397,265 397,916
Basic earnings per share 6.31p 6.14p
Diluted earnings per share 6.21p 6.04p
Basic adjusted earnings per share 5.79p 6.54p
Diluted adjusted earnings per share 5.71p 6.43p
6. Dividends per share
Dividends of £5,678,000 were paid in the year to 28 February 2018 (2017: £5,353,000), 1.45p per share (2017: 1.35p). A final dividend in respect of the year ended 28 February 2018 of 0.95p per share, is to be proposed at the annual general meeting on 25 July 2018. The ex-dividend date will be 21 June 2018 and the associated record date 22 June 2018. This dividend will be paid, subject to shareholder approval, on 30 July 2018 and these financial statements do not reflect this final dividend payable. The last date for shareholders to elect for the Dividend Re-Investment Plan (DRIP) will be 6 July 2018 (or such other date as the Group may specify). A facility is provided by Link Market Services Trustees Limited in conjunction with the Group's registrars, Link Asset Services, for any Group shareholders who wish to re-invest dividend payments in the Group. Under this facility, cash dividends may be used to purchase additional ordinary shares. Any shareholder requiring further information should call Link Asset Services on 0871 664 0300 (Calls cost 12p per minute plus your phone company's access charge. Calls outside the United Kingdom will be charged at the applicable international rate. Lines are open between 09:00 - 17:30, Monday to Friday excluding public holidays in England and Wales. Overseas shareholders are best to use: +44 371 664 0300 Calls outside the United Kingdom will be charged at the applicable international rate) or visit www.linkassetservices.com.

7. Reconciliation of net cash flow to movement in net cash
2018 2017 £’000 £’000 Net increase / (decrease) in cash and cash equivalents 1,864 (4,070) Cash inflow from proceeds of borrowings (4,140) (10,831) Cash outflow from repayment of borrowings 166 14,000
Cash movement in net cash (2,110) (901) Borrowings acquired - (1,085) Capitalisation of loan arrangement fees 501 107 Amortisation of loan arrangement fees (86) (261)
Non-cash movement in net cash 415 (1,239)
Movement in net cash (1,695) (2,140) Opening net cash 21,008 23,148
Closing net cash 19,313 21,008
8. Disposals
On 31 March 2017, the Group disposed of the trade and certain assets of its Peugeot dealership in Chesterfield.
On 4 January 2018, the Group disposed of the trade and certain assets of its Volkswagen dealership in Boston.
Total consideration received for the disposals was £1,528,000 and was settled in cash.
9. Post balance sheet events
On 19 March 2018, the Group disposed of surplus land, held in property assets held for resale at 28 February 2018, at Newcastle under Lyme realising £2,000,000 of cash and a £630,000 profit on disposal.


![Nokia Vertu v1.0[1]](https://static.fdocuments.us/doc/165x107/5525665f550346986e8b47df/nokia-vertu-v101.jpg)


