VERTU Motors plc vertumotors.com ... motor retail businesses ... the Chief Executive’ Review and...
121
...built on trust VERTU Motors plc vertumotors.com ANNUAL REPORT & FINANCIAL STATEMENTS For the year ended 28 February 2015
-
Upload
phungnguyet -
Category
Documents
-
view
220 -
download
3
Transcript of VERTU Motors plc vertumotors.com ... motor retail businesses ... the Chief Executive’ Review and...

...built on trust
VERTUM o t o r s p l c
vertumotors.com
ANNUAL REPORT & FINANCIAL STATEMENTSFor the year ended 28 February 2015
Contents Table of Contents Page
Strategic Report
- Chairman’s Statement
- Chief Executive’s Review
- Finance Director’s Review
2
5
9
21
Main Board Directors 25
Advisors 26
Corporate and Social Responsibility Report 27
Directors’ Report 31
Corporate Governance Report 35
Remuneration Committee Report 45
Directors’ Remuneration Report 53
Independent Auditors’ Report (Consolidated Financial Statements) 58
Consolidated Income Statement 60
Consolidated Statement of Comprehensive Income 61
Consolidated Balance Sheet 62
Consolidated Cash Flow Statement 63
Consolidated Statement of Changes in Equity 64
Notes to the Consolidated Financial Statements 65
Independent Auditors’ Report (Company Financial Statements) 105
Company Balance Sheet 107
Notes to the Company Financial Statements 108
Financial Diary
Annual General Meeting
23 July 2015
Interim Results 2015/16 14 October 2015
Final Results 2015/16 May 2016
Vertu Motors plc Mission Statement
“To deliver an outstanding customer motoring experience through honesty and trust”
1
Vertu Motors plc

Strategic Report The Directors present their strategic report on the affairs of the Group and Company, for the year ended 28 February 2015.
Business Review and Future Developments
The review of the business for the year is contained in the Chairman's Report, Chief Executive's Review and Finance Director’s Review. This includes details of acquisitions and likely future developments. It remains your Board's intention to deliver shareholder value and develop the Group through strategic acquisitions supplemented by the focused organic growth of its existing businesses.
The Group has a number of Key Performance Indicators (“KPI’s”) by which it monitors its business. These include sales and gross margins by channel; an analysis of these KPI’s is set out in the Chief Executive’s Review on page 9.
Principal Risks and Uncertainties
There are certain risk factors which could result in the actual results of the Group differing materially from expected results. These factors, as set out below, are not an exhaustive list of all the potential risks and uncertainties that could adversely impact the Group’s results: STRATEGY
Description of risk Impact Mitigation
Failure to deliver on the strategic goal of the Group to acquire and consolidate UK motor retail businesses
Stalled growth of the Group and associated shareholder returns Reputation risk
• Maintain strong relationships with manufacturer partners to ensure that the Group is considered within their own distribution network reviews
• Availability of resources to fund expansion ensured through both committed bank facilities and positive cash generation within the Group
• Thorough reviews of acquisition opportunities to ensure Group investment hurdles are met
• Established process for swift integration of acquired businesses into the Group
BRAND PARTNERS AND REPUTATION
Description of risk Impact Mitigation
Inability to maintain current high quality relationships with manufacturer partners
Impact on our ability to retain existing contracts and to take on new opportunities for growth
• Group vision and values set the tone from the top to deliver strong service to our Group stakeholders
• Constant focus on improvement in performance and effective communication with our manufacturer partners to ensure that our objectives are closely matched to theirs
ECONOMIC, POLITICAL AND ENVIRONMENTAL
Description of risk Impact Mitigation
Economic conditions impacting trading
Volume and margin are effected particularly in vehicle sales
• Close monitoring of UK and European economic conditions
• Maintain close relationships with manufacturer partners
• Focus on retention initiatives particularly in aftersales
Market may drive fluctuation in used vehicle values
Used vehicle margin is effected and value of used vehicle inventory may decline
• Daily monitoring of used vehicle market to detect pricing movements
• Real time inventory management and control to enable the Group to react quickly to pricing declines
2
Vertu Motors plc

Strategic Report (continued) Principal Risks and Uncertainties (continued)
LEGAL AND REGULATORY
Description of risk Impact Mitigation
Litigation and regulatory risk in an environment of ever increasing regulatory scrutiny
Litigation or breaching regulations could have a financial impact or reputational impact
• Policies and procedures are in place to ensure compliance with relevant regulations, adherence to which is overseen by the Compliance Committee
• Risk management programme in place aimed at preventing issues in the first instance but also providing appropriate response to any issues that do arise
• Continuation of Group focus on customer experience and a partnership approach with its manufacturer partners, to minimise impact of Block Exemption regulation changes
Failure to comply with Health and Safety (H&S) Policy
Injury to customers or colleagues
• Group has a dedicated H&S Manager • Group H&S Committee monitors compliance and
recommends any corrective or preventative actions • Training for all colleagues • Specific H&S dashboard developed, monitoring KPI’s • Independent external H&S audits carried out
PEOPLE
Description of risk Impact Mitigation
Failure to attract, develop and retain talent
Unable to deliver on business plans Colleagues who lack motivation and engagement
• Annual colleague satisfaction survey and action planning based upon the results
• Significant investment in formalised training and development programmes delivered by in-house training department and external trainers as appropriate
• Talent review and succession plans in place
SYSTEMS AND TECHNOLOGY
Description of risk Impact Mitigation
Failure of Group Information or telecommunication systems
Business is interrupted
• Robust business continuity process has been developed
• Operation of this process is regularly tested, reviewed and updated as necessary
3
Vertu Motors plc

Strategic Report (continued) Principal Risks and Uncertainties (continued)
FINANCE AND TREASURY
Description of risk Impact Mitigation
Availability of credit and vehicle financing
Inability to secure funding impacting on distribution sales or expansion opportunities
• Detailed working capital cash flow monitoring in place • Maintain relationships with key banks, financing
arrangements in place until 30 March 2019 • Leverage Group relationship with OEM finance
companies and retail finance providers
Use of estimates Variance in accounting judgement impacts profitability
• Key accounting judgements are reviewed on a regular basis to ensure these remain appropriate
• Regular review of changes in accounting standards framework to assess any likely impact on the Group
Currency risk Fluctuation in exchange rates impact the profitability of our manufacturer partners which may change their prices or support packages to the dealer network
• Portfolio of manufacturer partners spreads potential risk
• No material foreign exchange transactions are undertaken directly by the Group
Financial position and performance A comprehensive analysis of the business during the year and the position at the year end is contained within the Chairman’s Statement, the Chief Executive’ Review and the Finance Director’s Review.
4
Vertu Motors plc

Strategic Report (continued) Chairman’s Statement Since joining the Board in January 2015, three features of the Group have become crystal clear to me: Firstly, the Group is set for growth. This includes organic growth from the core business as increases in vehicle sales volumes in recent periods are converted into repeat business and customers are retained into the Group’s higher margin aftersales activities. The growth strategy also includes acquisition related growth both from the integration, and in some cases turnaround, of acquired businesses and from future acquisitions. The Group has significant upside profit potential from improving businesses within its current dealership portfolio. Secondly, the Group is well positioned with Manufacturer partners, both those who the Group already represent and those not currently in the portfolio. The Group and its respected management team have developed a reputation for delivering for Manufacturers through adopting a partnership approach. Manufacturer objectives on volume, customer experience and investment in brand representation standards are taken very seriously by management. As a consequence, Manufacturer support is a vital element which will underpin future growth. Thirdly, the Group’s financial position is very healthy. Strong cash flow generation, an asset backed balance sheet and the recently expanded borrowing facilities provide substantial financial firepower for the Group to continue to grow. The Group currently has net cash balances. In this statement, the Board is reporting a further year of strong growth, generating record levels of revenue, operating profit, earnings per share and, in particular, dividends. Importantly, the growth has come from both like-for-like operations and acquisitions made over the last few years. The Board has maintained a consistent strategy since flotation in December 2006 to grow a scaled automotive retail group initially through acquiring principally volume franchised dealerships and, more recently, by adding premium franchised dealerships. The Group will continue to acquire dealerships across the volume and premium spectrum as the Board continues its growth strategy. The Board currently believe that capital can be invested in additional dealerships to deliver significant return on investment to shareholders in the short and medium term. The fragmented nature of the UK automotive retail sector means that significant growth potential remains through continued acquisitions. The addition of further dealerships and franchise partners to the Group’s portfolio will help to deliver the Board’s goal of mirroring the market share of Manufacturers in the UK in the Group’s portfolio of franchised dealerships. The Group’s strategy is to deliver enhanced business performance from acquired dealerships through the implementation of consistent business processes and systems. Many of the Group’s acquisitions are turnaround opportunities and a number are new start-up dealerships sharing similar characteristics. These opportunities rely heavily on strong, quality management teams in order to deliver the required returns over time. The recruitment, development and retention of high performing motor retail professionals is, therefore, of paramount importance and the Group has developed a culture which seeks to attract and retain top performers. As the Group expands, the management capacity and bandwidth to allow further controlled expansion is continually assessed by the Board. In addition to management, the Group has invested in significant systems and central functions at its support centre in Gateshead in the North East of England. This provides significant benefits to the Group from scale, engaging in extensive sales and aftersales marketing and customer experience enhancing activities. The Board believe these functions and teams provide significant operational benefits to the Group, a competitive advantage and a strong foundation from which to further scale the business.
5
Vertu Motors plc
Strategic Report (continued) Chairman’s Statement (continued) The Group’s Mission Statement is “to deliver an outstanding customer motoring experience through honesty and trust”. Achieving this Mission should secure significant gains in vehicle sales and market share in our local territories. The resultant increase in each local vehicle parc, coupled with high levels of customer retention, is designed to deliver higher aftersales activity levels, thereby allowing the Group to grow profitability over time. This strategy is being executed with the Group tending to deliver above national average new vehicle market share for Manufacturers in our territories and seeing year on year rises in aftersales volumes and profits. These key performance indicators, in addition to colleague and customer satisfaction scores, are the key drivers for management at all levels. The Board is pleased to note a significant majority of dealerships deliver above average customer satisfaction scores in sales and service, as measured by our Manufacturer partners. Used car customer satisfaction is now measured in every dealership and 93% of used car customers would recommend the Group to friends and family. Colleague satisfaction scores, measured in July each year, are very strong and reflect a significant consistency in culture across the business. The Group was also recognised within the Honda and Hyundai franchises for having amongst the very best UK dealerships in those brands for customer service in 2014. In addition, the Group’s Darlington Nissan outlet has recently won the best large dealership award in the Nissan franchise for customer service quality. The success of the Group’s strategy is evidenced by the fast pace of growth since the first acquisition in 2007 and the turnaround and integration of acquired dealerships to date. Many of the acquisitions undertaken in recent periods have still to reach maturity in terms of performance enhancement and this provides the Group with further opportunity to deliver improved margins and grow organic profit over the medium term. The Group continually reviews all operations to ensure they will deliver shareholder value in the medium term. Operations deemed not to be able to meet return on investment hurdles in the medium term are identified and are either closed, disposed of or refranchised to ensure shareholder value is generated. In accordance with this discipline, the Group closed a dealership and disposed of one other during the year itself and ceased operations in three sales outlets shortly after the year-end. We have a first rate, scalable and highly motivated operational team and I would like to take this opportunity to thank every colleague for their dedication and hard work during the year. This has been very evident to me in the visits I have made to over 50 dealerships since I joined the Board. The team have created a unique culture, which is in place consistently across the businesses, and have delivered record profitability. Dividends As the Group’s earnings have continued to grow strongly and the Group matures, the Board has reviewed its dividend strategy. This review recognised the vital role of dividends in delivering total shareholder return. The Group’s strong balance sheet, its reliable cash generation and the continuing investment requirements of the Group’s growth strategy have all been considered. Consequently, the Board intends to increase the dividend and adopt a dividend cover moving closer to four times. The Board has proposed an increase in the final dividend, payable on 28 July 2015, to 0.7 pence per share (2014 : 0.5p), which, taken together with the interim dividend paid in January 2015 of 0.35 pence per share (2014 : 0.3p), provides a total dividend for the year of 1.05 pence (2014 : 0.8p), an increase of 31.3%.
6
Vertu Motors plc

Strategic Report (continued) Chairman’s Statement (continued) Current trading and outlook The Group has traded ahead of the current year financial plan as well as significantly ahead of the prior year in March and April (“the post year-end period”). Improving sales volumes and aftersales contributions, together with an increased contribution from recently acquired dealerships have enabled the Group to drive profits forward again. The post year-end period includes March which remains the most significant month for the profitability of UK automotive retail as a consequence of the plate change and its impact on new car demand and the seasonality of servicing. March 2015 saw the highest UK new car market in terms of registrations of any month this century and April registrations were the strongest for a decade. In the post year-end period, the Group’s new retail sales volumes on a like-for-like basis rose 4.3% against a 2.7% growth in UK new car registrations to private buyers, hence the Group outperformed and gained market share. New vehicle like-for-like gross margins were stable. Increased volume delivered an overall increase in the Group’s new vehicle total gross profit on a like-for-like basis. Group fleet and commercial new vehicle sales delivered improved profitability due to strengthening margins, and the market continues to show significant growth in volumes year on year. The Group’s like-for-like used retail volumes were up 6.2% in the post year-end period despite the impact of cheaper, finance-led new car offers leading to some used car customers buying new cars. Used car supply is increasing as the new car market grows and part exchange levels coming into the used car market rise. This leads to a potential for lower used car margins, but also for higher used car volumes. The Group reacted early to these changing market conditions and implemented rigorous stock management and pricing disciplines. Like-for-like used car margins declined from 10.8% to 10.4% as expected and the successful drive to increase volume led to overall record levels of used car profitability. Group aftersales profitability increased on a like-for-like basis in the post year-end period due to higher revenues and margins. Overall aftersales margins rose from 44.9% to 46.0% with service, accident repair centres and parts all showing revenue and margin increases. Petrol forecourt sales declined due to falling fuel prices but margin again increased. Service like-for-like revenues rose 7.2% in the post year-end period and continued to benefit from the successful customer retention initiatives being executed by the Group. The Group now has over 71,000 customers paying monthly for service and MOT service plan packages and this, together with a growing 0-3 year old vehicle parc, is leading to increased revenues in the higher margin service channel. Profitability was also improved by the dealerships acquired last year for which this was their first March within the Group. Given trading in March and April and the encouraging improvements we are seeing in the acquired businesses, the Board is confident the Group will grow both profits and the business this year.
7
Vertu Motors plc

Strategic Report (continued) Chairman’s Statement (continued) Board changes One of my key roles as Chairman is to ensure that the composition of the Board is continually reviewed to ensure that it provides the Group with the strategic oversight, vision and governance that it needs in order to deliver a sustainable long term return for shareholders. Going forward, it is my intention to ordinarily rotate non-executives every six years in line with current Corporate Governance best practice. Today, I am pleased to announce that Ken Lever will join the Board on 1 June 2015. Ken will bring a wealth of City, technology and finance experience to the Group having held senior roles as both CEO and Finance Director in several major listed companies. He is currently the CEO of Xchanging plc and is a former member of the Accounting Council of the Financial Reporting Council. David Forbes has been on the Board for six years and today we announce that he will not be seeking re-election at the forthcoming Annual General Meeting. David has been on the Board during a transformation in the scale of the Group in the last six years. He has been invaluable in the phase of the Group’s growth which involved the raising of fresh equity twice and the Group has benefitted from his extensive corporate finance background and skills. I would like to thank David for this contribution to the company over the last six years. P. Jones Non-Executive Chairman
8
Vertu Motors plc
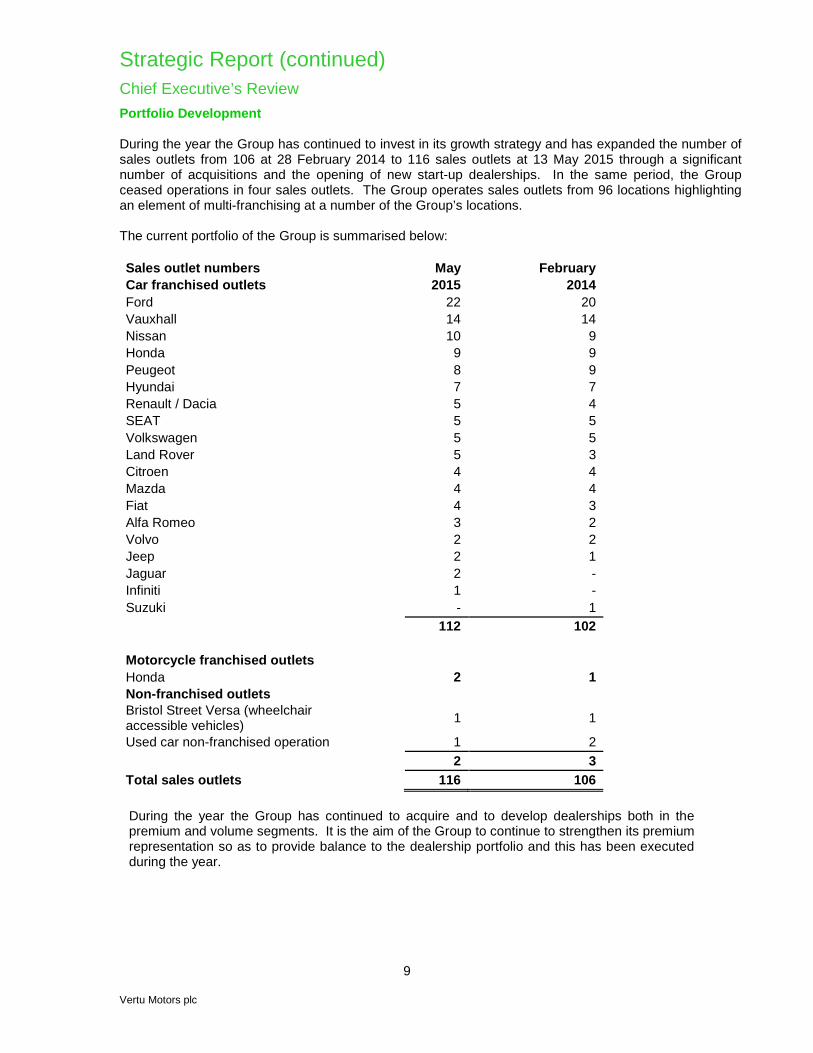
Strategic Report (continued) Chief Executive’s Review Portfolio Development During the year the Group has continued to invest in its growth strategy and has expanded the number of sales outlets from 106 at 28 February 2014 to 116 sales outlets at 13 May 2015 through a significant number of acquisitions and the opening of new start-up dealerships. In the same period, the Group ceased operations in four sales outlets. The Group operates sales outlets from 96 locations highlighting an element of multi-franchising at a number of the Group’s locations. The current portfolio of the Group is summarised below: Sales outlet numbers May February Car franchised outlets 2015 2014 Ford 22 20 Vauxhall 14 14 Nissan 10 9 Honda 9 9 Peugeot 8 9 Hyundai 7 7 Renault / Dacia 5 4 SEAT 5 5 Volkswagen 5 5 Land Rover 5 3 Citroen 4 4 Mazda 4 4 Fiat 4 3 Alfa Romeo 3 2 Volvo 2 2 Jeep 2 1 Jaguar 2 - Infiniti 1 - Suzuki - 1 112 102 Motorcycle franchised outlets Honda 2 1 Non-franchised outlets Bristol Street Versa (wheelchair accessible vehicles) 1 1
Used car non-franchised operation 1 2 2 3 Total sales outlets 116 106 During the year the Group has continued to acquire and to develop dealerships both in the premium and volume segments. It is the aim of the Group to continue to strengthen its premium representation so as to provide balance to the dealership portfolio and this has been executed during the year.
9
Vertu Motors plc

Strategic Report (continued) Chief Executive’s Review (continued) Portfolio Development (continued) Jaguar and Land Rover expansion In May 2014, the Group acquired Lancashire-based Hillendale Group Limited which comprised a Land Rover and a Jaguar business in Nelson and Bolton respectively for consideration of £8.0m. The acquired territory is contiguous to the Group’s Farnell Land Rover dealerships in Yorkshire and this acquisition added the Jaguar franchise to the Group’s portfolio for the first time. The acquired businesses now operate under the Farnell banner and management structure, and have been fully integrated into the Group. Subsequent to the year-end, the Group has announced further expansion of the Jaguar Land Rover operation of Farnell in the North of England with two separate acquisitions. Bury Land Rover has been purchased from the Pendragon group for £7.0m including goodwill of £7.0m. This highly profitable and established dealership mirrors the same geographical territory for Land Rover as that operated by the Group’s Bolton Jaguar operation and significant operational benefits will accrue in the medium term from this. Similarly, the acquisition of Bradford Jaguar from the Jardine Motor group for estimated consideration of £0.9m including goodwill of £0.75m complements the Group’s existing Bradford Land Rover operation and brings the number of Jaguar dealerships operated by the Group to two. This is an exciting time for the Jaguar franchise with the launch of the new XE model this year and the F-Pace SUV in 2016. These important product launches should provide enhanced revenues and profits for the franchise. The Group’s representation of the Land Rover franchise in Leeds will be significantly enhanced in the coming year. In September 2014, the Group acquired freehold dealership premises in the city for £5.2m, which are currently leased to the BMW franchise retailer. The Group expects to obtain vacant possession in August 2015 so allowing a major refurbishment to take place and the Group’s Leeds Land Rover business to be relocated to this larger, landmark dealership. In addition, a significant re-development of the Group’s highly successful Guiseley Land Rover dealership in Yorkshire is also planned this year to enhance brand representation and customer experience. Ford – our largest franchise partner Ford is the Group’s largest franchise partner both in profit terms and number of outlets with 22 sales outlets operated. The Group is the third largest Ford dealer in the UK. Ford has been the market leader in terms of car and commercial vehicle volumes in the UK for decades. In November 2014, the Group undertook a substantial acquisition with the Ford franchise, acquiring four Lancashire businesses from Gordons of Bolton for £11.0m including four freehold properties. The acquired businesses comprise a major Ford operation in Bolton, which represents a significant turnaround opportunity to increase profits in the medium term. Another significant dealership was acquired in Wigan and relocated in May 2015 from old leased premises to a brand new £2.1m freehold dealership that has been developed by the Group since the acquisition. Two small satellite operations in Horwich and Walkden were also acquired as part of the wider transaction and both have subsequently been closed except for petrol forecourt operations at Horwich. The petrol forecourt at Walkden has been disposed of for £0.7m (which equates to book value) subsequent to the year end and the dealership and petrol forecourt at Horwich is now being marketed and is anticipated to be sold for in excess of £1.0m.
10
Vertu Motors plc

Strategic Report (continued) Chief Executive’s Review (continued) Portfolio Development (continued) Ford is currently rolling out 65 Ford Stores in the UK which will be large scale dealerships selling the full range of Ford product including Vignale premium product and the iconic Mustang. The Group will in due course open its initial Ford Stores in redeveloped existing dealerships in Orpington, Kent (due to complete in May 2015), Birmingham, Gloucester and Bolton with others in the pipeline. The Group completed the rebuilding of its Durham Ford dealership in February 2015. This £2.3m investment significantly increased the sales potential of the dealership particularly on used cars. Further significant redevelopments are planned in 2015 at the Group’s Birmingham Ford, Shirley Ford and West Bromwich Ford locations. These dealerships have seen significant growth in sales in recent years and further growth will be possible following the capital investment. Nissan The Nissan franchise represents an increasing proportion of Group profitability with the Group now operating 10 sales outlets making Nissan our third largest franchise partner. In November 2014, the business of Halifax Nissan was acquired complementing the Group’s Nissan operation in neighbouring Bradford. Consideration for this leasehold dealership was £0.3m. Following changes in Nissan franchise representation in Scotland, from 1 April 2015 the Group is now the sole franchise partner for Nissan in Glasgow. Nissan sales outlets in the city were reduced from four sales outlets to two, being the Group’s existing purpose built Glasgow South dealership together with an outlet in the north of the city. The Group is currently operating the Glasgow North Nissan sales outlet from temporary facilities, and plans to build a landmark Nissan dealership in the coming eighteen months. This expansion of the Group’s Macklin Motors brand is an exciting development for the Group. In December 2014, the Group disposed of its Nissan dealership in Altrincham for £0.8m to Nissan’s own retail arm. Volkswagen In the past two years, the Group has acquired five Volkswagen dealerships in the East Midlands forming a contiguous territory. Capital investment in these dealerships to expand showroom capacity and implement latest manufacturer standards is ongoing. Lincoln and Boston were completed in 2014 with the remaining three dealerships in Nottingham and Mansfield due to be completed in 2015. Hyundai The Group currently operates a multi-franchised Renault/Dacia and Hyundai dealership in Exeter. The Group has successfully grown sales volumes in both of these franchises and, in order to maximise further market opportunities, the Group will relocate the Hyundai franchise to a separate freehold dealership. Contracts for this purchase have been exchanged with completion expected in the summer and the relocation will be completed by the end of 2015 following a refurbishment. The freehold property purchase consideration will be £2.3m.
11
Vertu Motors plc

Strategic Report (continued) Chief Executive’s Review (continued) Portfolio Development (continued) Other developments In August 2014, the Group acquired the Alfa Romeo and Jeep franchise from Benfield in Newcastle. These businesses were relocated to excellent leasehold premises on Scotswood Road, Newcastle and augmented with the Fiat franchise to create a new Fiat Group brand centre in Newcastle. In September 2015, the Group opened the North East’s only Infiniti dealership in Newcastle. This fledgling premium brand owned by Nissan will see the new higher volume Q30 model manufactured from late 2015 in Sunderland in close proximity to this Infiniti outlet. During the year, the Group also saw the purchase and lease of additional properties adjacent to the Group’s successful Waltham Cross Vauxhall operation at a cost of £1.1m. This expansion is facilitating a wider redevelopment of the dealership providing additional showroom, workshop and used car sales display capacity. The development will be complete in time for the September 2015 market. January 2015 saw the Group open two new outlets at one location in Nottingham. From leased premises, the Group now operates the city’s Renault/Dacia outlet and a state of the art Honda motorcycle outlet. The Group now operates six outlets in Nottingham and has more dealerships in the East Midlands than any other region. Franchise related refurbishments As noted already above, the Group is investing in franchise related property enhancements across a number of franchises to meet both increased capacity requirements and enhanced Manufacturer standards. This programme is set to continue to the end of 2016 and involves almost every franchise the Group represents. The coming together of manufacturer required investment at the same time across the sector for different Manufacturers is unusual and reflects the fact that such investment was not requested during the recent financial crisis. Group capital expenditure is currently therefore running at high levels and will fall back to much lower levels in due course. This is covered further in the Finance Director’s Review. Disposals and closures In order to ensure the business is structured to deliver shareholder value, the portfolio is continually reviewed by the Board to ensure franchise representation is optimal and dealerships can generate appropriate returns. During the year, a number of changes were made to the portfolio following such reviews and the Group will continue to identify future opportunities to make such changes over time to maximise return on investment and ensure Group operations are successful. The two satellite Ford operations acquired with the Gordons of Bolton acquisition have been closed. This process not only generates cash to invest in other opportunities, but enhances volumes of sales and service in the main dealership hubs operated by the Group in the area, so improving operational gearing. The Group operated a single Suzuki sales outlet in Mansfield. Whilst a successful operation, the Group is keen to have relationships of scale with Manufacturers. It was mutually agreed with Suzuki that the Group would cease this Suzuki franchise operation on 1 April 2015. The outlet is currently being refurbished so as to open an additional Renault/Dacia outlet in the summer. This outlet will complement the Group’s existing Renault/Dacia outlets in Nottingham and Derby.
12
Vertu Motors plc

Strategic Report (continued) Chief Executive’s Review (continued) Portfolio Development (continued) On 1 April 2015, the Group ceased operation of a loss-making Peugeot dealership in Ilkeston in Derbyshire. The Group ceased operation of its last Motor Nation used car supermarket in Birmingham in September 2014. This closure freed up the premises to be used as an additional vehicle compound for the Group’s growing Ford commercial fleet activities, which are adjacent. The closure brought to an end the operation by the Group of non-franchised used car operations under the Motor Nation brand and allows the Group to concentrate on its core activity of operating franchised dealerships. Other ancillary businesses In addition to its franchised dealership businesses, the Group has a number of successful ancillary businesses, notably its What Car Leasing operation in partnership with Haymarket Publishing, and Bristol Street Versa, a converter of wheelchair accessible vehicles. In November 2014, another business was added to this list with the acquisition of Glasgow-based Taxi Centre Limited for net total consideration of £1.0m. This growing business specialises in the sale of taxis to private taxi operators with finance provided via third party finance companies. In the 12 months ended 28 February 2015, the Taxi Centre sold 847 cars and going forward the vast majority of these vehicles will be supplied by the fleet operations of the Group’s franchised dealerships. It is the Group’s strategy to expand the scale and scope of these and other ancillary businesses, as the opportunity arises, to the extent that they generate shareholder value and complement the Group’s core franchised dealership operations. Other infrastructure investment The Group has developed a significant support centre and contact centre facility in Gateshead which operates activities including inbound and outbound service booking, sales enquiry management and customer experience activities which are key to the Group’s customer relationship management and retention strategies. Support centre and contact centre activities are currently spread across three separate rented office locations, and in December 2014 the Group acquired a single office building in the same vicinity for consideration of £1.5m. This purchase, made from the liquidator of the previous owner’s assets, will enable the Group to vacate the various rented offices so simplifying and reducing total service and occupation costs. This will be achieved by the end of June 2015. Shareholders will have the opportunity to see this new support centre, since it will host the forthcoming Annual General Meeting.
13
Vertu Motors plc
Strategic Report (continued) Chief Executive’s Review (continued) Digital marketing and environment It is clear that customers now expect the physical property assets deployed in the automotive retail sector to be matched by effective and engaging on-line assets. The Group continues to invest in its digital resources and designs and creates all on-line assets in-house through a team of dedicated web designers and software programmers. This allows constant innovation to be undertaken quickly as the digital competitive environment develops and, in particular, as the shift to mobile platforms continues. The online environment is increasingly important throughout the entire customer motoring experience: in purchasing a car and in having it serviced. Customers expect us to be joined up between departments and also with our Manufacturer partners. An example of this is the need to have an effective Live Chat function to respond quickly to a vast array of customer enquiries and queries late into the night. The Group has successfully developed a dedicated Live Chat team and this is now adding significant value to the business, including facilitating incremental vehicle sales and service bookings. The Group operates a significant number of websites in a webfarm centred round bristolstreet.co.uk as its core trading brand. In terms of website visits, the Group has consistently ranked in the top two performers for the total number of visits for sales and aftersales in the UK automotive retail franchised sector in 2014 (Source: Google Hitwise). In addition, the Group operates the successful What Car Leasing business, a car leasing consumer website, in partnership with Haymarket Publishing. In terms of vehicle sales, the Group directly sold 15,046 vehicles (2014: 11,410) from email and phone leads from on-line assets representing 15% (2014: 13%) of retail new and used vehicle sales volumes. All such enquiries are centralised in a contact centre which is open 7 days a week with extended hours. The importance of the internet for sales generation and customer research is now self-evident and is likely to strongly influence customers who contact or visit dealerships directly having researched on the web. As a result, Group marketing activities are now reflective of the digital revolution and email marketing, pay for click campaigns and search engine optimisation are all now as core to the Group as traditional press and radio campaigns. The latter, however, still remain important. Marketing investments of a digital and traditional nature must generate a substantial return on investment and these returns are monitored every six months to ensure this is the case. Within the dealership environment, it is clear that the customer expects a seamless transition from the on-line experience to that in the showroom. Over the coming months, the Group will replace several paper-based elements of its vehicle sales process such as collecting information from and presenting offers to customers with a tablet-based system which will further enable this transition and enhance the customer experience. The new processes and systems should also increase the productivity of our sales teams. The Group is also implementing technology to enable videos to be sent to both service and sales customers, to augment the customer experience and enhance sales conversion.
14
Vertu Motors plc

Strategic Report (continued) Chief Executive’s Review (continued) Operating review Market dynamics Market conditions in terms of new vehicle sales volumes to consumers continued their run of improvement driven by a buoyant consumer environment in the UK, a consistent flow of excellent new cars and attractive consumer finance offers from Manufacturers. As anticipated, the double digit growth of recent years has subsided to single figure growth of UK private new car registrations. In the second half of the year it became evident, as a result of this slowing growth, that the market was becoming characterised by higher levels of self-registration by retailers creating a disconnect between the actual sales of vehicles to private customers by retailers and vehicles registered as “retail” as measured by the SMMT. Retailers are financially motivated to self-register new vehicles in order to either achieve volume targets set by Manufacturers or to take advantage of bulk purchasing deals on offer. These cars are then sold into the retail market as used cars. The strength of registrations is explained by the combined effects of the weakness of the wider European market particularly Russia, the strength of Sterling versus the Euro, and attractive finance deals, combined with the comparatively robust business and consumer confidence in the UK. The majority of new vehicles sold in the UK are supplied by the European sales operations of global Manufacturers, who are also responsible for making sales on the Continent. The UK is currently their market of choice. Lower fuel prices, enhanced fuel efficiency, low rate finance deals and affordable service plan packages are all contributing to lowering the cost of motoring in the UK. As a result of these factors, the UK private retail market rose 8.4% in the financial year. In a reversal of last year’s trend, premium franchises outperformed volume franchises in the UK private retail sector, with registrations up 10.0% in premium franchises and 7.5% in volume franchises. New car fleet registrations in the UK rose by 9.8% in the year. The significant growth in the fleet market, particularly in the second half of the year, has been partly driven by the same supply push actions from Manufacturers as noted above for the private retail market and an increasingly fast growth UK economy. The light commercial vehicle market, comprising vans, saw strengthening demand throughout the year as business confidence remained robust and the economy expanded. In particular, the growth of internet shopping at the expense of the High Street, has led to a continued demand for vans for home deliveries and this trend is expected to continue. UK van market registrations rose by 12.1% as a consequence. The used car market in the UK saw limited growth in the period with substitution of traditional used car customers into new cars evident as low monthly payments on new car personal contract purchase (“PCP”) offers had an impact. To some extent, this was offset in the market by self-registered cars being sold through the used car channel and the rise of used car PCP offers which are increasingly making used cars more affordable against new car offers. The increase in supply into the used car market from additional part exchanges taken in by retailers has led to softer used car prices from September 2014 onwards in the wholesale markets. This feeds through into potentially lower used car margins in the market place, but also provides retailers with the ability to grow used car volumes compared to recent years when supply was very much more constrained. The market for service, parts and accident repair services saw growth in the period arising from the impact of successive years of rising new car sales. The 0-3 year vehicle parc is once again building and this cohort of car owners is very loyal to franchised dealer networks for servicing. Increased service loyalty to franchised dealers is also raising service revenues due to more customers having service plans typically of three years in duration. These plans are largely monthly payment schemes which lock in prices for customers to a fixed monthly amount making servicing budgetable and affordable.
15
Vertu Motors plc

Strategic Report (continued) Chief Executive’s Review (continued) Operating review (continued) Market dynamics (continued) The sector is also witnessing a continued decline in the number of dealerships each year as many franchises trim outlet numbers in order to provide operational gearing benefits to the remaining retailers. Investment requirements in larger and refurbished outlets are moving in tandem with these trends. Sales and profit per sales outlet are therefore likely to increase as a consequence. Revenues, margins and profitability Revenues in the year increased by 23.2% (£390.4m) to £2,074.9m (2014: £1,684.5m). This reflected the impact of acquisitions made during the year (£68.1m) and the full year impact of prior year acquisitions (£164.4m). Closed operations resulted in a £14.8m year on year revenue reduction. Like-for-like revenues grew by 11.4% (£172.7m) reflecting higher volumes of vehicle sales and growth in service, parts and accident repair centre activities. The Group delivered over 140,000 new and used vehicles in the year. Overall gross margin fell to 11.0% (2014: 11.4%) due to the increase in the mix of vehicle sales which outstripped the growth in higher margin aftersales operations in the period. There is a lag effect in the growth of aftersales revenues in the years following rises in vehicle sales as the latter takes time to feed into significant changes to the size and shape of the wider vehicle parc. This dynamic reflects the more defensive nature of aftersales revenues and profits and usually works in a positive manner in the event of a vehicle sales slowdown. Overall vehicle revenues grew by 24.0% in the year and amounted to 91.9% of total revenues (2014: 91.3%), whereas total aftersales revenues grew by 14.3% and amounted to 8.1% of total revenues (2014: 8.7%). This does not reflect under performance in aftersales by the Group since aftersales revenues will continue to grow in the coming years on the back of the vehicle sales growth already experienced. Adjusted1 EBITDA increased by 21.6% to £28.7m in the year ended 28 February 2015 (2014: £23.6m). Adjusted1 operating profit grew by 26.8% to £22.7m (2014: £17.9m) due to both like-for-like growth in the core dealerships and, significantly, the turnaround in profitability of the dealerships acquired over recent years. This improvement provides further evidence of the effectiveness of the Group’s business model in improving the profitability of underperforming businesses acquired. No exceptional items arose in the current period (2014: charge £1.2m). Adjusted1 profit before tax rose by 25.7% to £22.0m (2014: £17.5m). 1. adjusted for exceptional charges, amortisation of intangible assets and share based payments charge. No
exceptional items arose in the year ended 28 February 2015
16
Vertu Motors plc

Strategic Report (continued) Chief Executive’s Review (continued) Operating review (continued) Vehicle unit sales analysis
2015
2015
2015
2014
Total
%
Like-for-Like
% Core Acquired2 Total Total3 Variance Variance
New retail cars 32,269 3,590 35,859 30,625 17.1% 6.4% Motability cars 9,651 898 10,549 8,747 20.6% 10.9% Fleet and commercial vehicles 29,371 1,256 30,961 25,760 20.2% 16.0% Total New vehicles 71,291 5,744 77,369 65,132 18.8% 10.8% Used retail vehicles 58,362 5,084 63,446 54,411 16.6% 9.2% 129,653 10,828 140,815 119,543 17.8% 10.1% 2. relates to businesses acquired or developed subsequent to 1 March 2014 with businesses migrating into core once they have
been in the Group for over 12 months 3. 2014 volumes include businesses acquired in the year ended 28 February 2014
Revenue and Margins
Year ended 28 February 2015
Revenue
Revenue
Mix
Gross
Margin
Gross Margin
Mix
Gross
Margin £’m % £’m % %
New car retail and Motability 679.4 32.7 50.9 22.3 7.5 New fleet and commercial 498.5 24.0 12.3 5.4 2.5 Used cars 728.9 35.2 75.5 33.1 10.4 Vehicle sales 1,906.8 91.9 138.7 60.8 7.3
Aftersales4 168.1 8.1 89.4 39.2 43.5
2,074.9 100.0 228.1 100.0 11.0
Year ended 28 February 2014
Revenue
Revenue Mix
Gross
Margin
Gross Margin
Mix
Gross
Margin £’m % £’m % %
New car retail and Motability 534.4 31.7 40.8 21.2 7.6
New fleet and commercial 420.4 25.0 10.2 5.3 2.4 Used cars 582.6 34.6 63.2 32.9 10.8 Vehicle sales 1,537.4 91.3 114.2 59.4 7.4
Aftersales4 147.1 8.7 78.0 40.6 43.1 1,684.5 100.0 192.2 100.0 11.4 4. margin in aftersales expressed on internal and external turnover.
17
Vertu Motors plc

Strategic Report (continued) Chief Executive’s Review (continued) Operating review (continued) Vehicle sales New retail car volumes sold (excluding Motability Scheme sales) rose by 6.4% in the year on a like-for-like basis. This compared to an increase of 8.4% in UK private new car registrations and 8.2% for those franchises which the Group represents. The Group’s operations performed strongly in the period and the Board considers that the shortfall between the Group’s like-for-like sales volume growth and the registration data is explained by the registration data reported by the SMMT including self-registered vehicles by retailers and manufacturers when the Group’s sales volumes exclude them. Volumes of sales on the Motability Scheme rose by 10.9% on a like-for-like basis against a 6.3% growth in UK Motability registrations. This outperformance was helped by an increase in focus in the dealerships on this key customer category and is reflected in the fact that the Group was awarded Motability Dealer Group of the year 2014 by Motability themselves. Motability sales have near 100% retention into service operations in the three years following sale so this growth in sales should auger well for future servicing profitability. Gross profit per unit increased in new car retail and Motability sales due to the Group’s higher mix of premium sales. Margin percentages declined to 7.5% (2014: 7.6%) reflecting higher average sales prices driven by increased premium franchise sales and rising vehicle prices in the volume sector as advantageous PCP offers allow consumers to purchase higher specification models. Average sales prices on new vehicle sales rose from £13,342 in H1 (2014: £12,170) to £13,639 in H2 (2014: £12,950). The Group benefitted from the rise in new car fleet registrations during the year. The Group has significant fleet operations and the Group benefits disproportionately when the fleet market rises due to its size, expertise and infrastructure. The Group’s like-for-like car fleet volumes rose by 16.0%. The story was similar in the light commercial vehicle sales arena. The Group’s like-for-like volumes of commercial vehicles increased by 16.1% during the year reflecting continued market share gains against registrations in the UK up 12.1%. The Group’s margins in fleet and commercial sales improved to 2.5% (2014: 2.4%). Increased numbers of dealership based local business specialists are helping to deliver these gains in volume and margin and, in addition, acquisitions undertaken in recent years have enriched the mix of fleet business undertaken. Overall, in the year the Group delivered over 30,000 fleet and commercial units for the first time.
The Group’s used vehicle volumes grew by 16.6% in total and by 9.2% on a like-for-like basis. The UK used car market was reported to be stable during the first half of the year with constrained supply resulting in stable prices and margins. In the second half of the year the market returned to a more typical seasonal depreciation cycle. These revised market conditions were a consequence of retailer self-registration and an increase in the supply of “nearly new” late plate vehicles which compete head on with highly competitive finance-led new vehicle offers. In addition, rising new car sales increased the general supply of used cars into the market. The used car market is no longer supply constrained as it has been since 2009. These trends tended to reduce used car margins achieved in the second half of the year.
The Group’s total used car gross margin fell to 10.4% (2014: 10.8%), whilst gross profit per unit strengthened slightly to £1,190 (2014: £1,161). These margin trends at the Group level were impacted by the increasing premium mix of the Group with franchises such as Jaguar and Land Rover having higher sales prices and higher gross profit per unit but lower margin percentages. On a like-for-like basis, used vehicle gross margins increased from 11.5% to 11.6% with the first half being the period of margin growth. The Group increased like-for-like used car gross profits by £8.1m in the period representing an increase of 14%.
18
Vertu Motors plc

Strategic Report (continued) Chief Executive’s Review (continued) Operating review (continued) Vehicle sales (continued)
The strong like-for-like growth in used vehicle volumes of 9.2% in the period was ahead of the market. Whilst sales of self-registered cars aided this growth, there was clear substitution of used car customers into new cars in the period due to the availability of excellent finance offers on new cars and the need of the Group to hit stretching Manufacturer new car targets. The strong reported growth by the Group in used car volume comes on the back of three years of like-for-like growth and reflects the inherent strength of the Group in used cars through sales and stock management processes. This growth in used vehicle volume and underlying margin represents an excellent result. With supply constraints on used cars now relaxing, further volume growth should be possible.
Aftersales The Group’s aftersales operations, which comprise servicing, supply of parts and accident repairs, represent a vital element of the Group’s business model since significantly higher returns are generated than those achieved in vehicle sales. The strategy of the Group is to increase customer retention in the higher margin service arena through the consistent execution of a number of core strategies. Driving service revenues has an additional positive benefit in enhancing parts sales through the Group’s workshops. Core retention strategies include a focus on driving increased vehicle sales to build a local vehicle parc (as opposed to distance sales where customers are unlikely to return to the dealership), marketing via a sophisticated customer relationship management process using the Group’s dedicated contact centre in Gateshead and technology such as email reminders, SMS and on-line service booking facilities. Further retention is driven through the extensive sale of service plans and delivering an outstanding customer experience when customers visit. The latter is aided by extensive training programmes and is monitored by a significant commitment to mystery shops to the service department. The Group continues to make progress in each of these areas. For example, the Group now has over 71,000 customers paying monthly for service and MOT (where appropriate) via the Group’s three year service plan product (2014: 55,397). In addition, significant numbers of service plans operated by Manufacturers are also in place. These plans are helping the Group to take market share from the independent aftersales market in the service area and drive consistent servicing revenue growth. The Group saw like-for-like revenues in all aftersales activities increase by 2.6% and like-for-like gross profits grow by £2.3m (3.3%) in the period. It should be noted that like-for-like aftersales revenues, excluding petrol forecourts operated by the Group, rose 3.3%. Service revenues rose 3.5% on a like-for-like basis, representing the fifth successive year of growth in this area. Overall aftersales margins strengthened to 43.5% (2014: 43.1%) and aftersales generated 39.2% of Group gross profits. An increased focus on technician’s efficiency, the impact of higher volumes and the Group’s vehicle health check (VHC) process have contributed to the strengthening in aftersales margin. The latter seeks to ensure that all customer vehicle visiting the Group’s dealerships are given a full mechanical health check by a fully qualified technician which identifies any service work which may be required and presents the customer with a clear and costed explanation of any such work identified. The performance of this process is monitored daily to ensure that the Group’s customers are given the best opportunity to enjoy a trouble-free motoring experience. The increased car parc of cars sold by the Group in recent periods augurs well for the future of the Group’s aftersales business.
19
Vertu Motors plc

Strategic Report (continued) Chief Executive’s Review (continued) Operating review (continued) Aftersales (continued) The accident repair centre sector experienced a further year of stabilisation, and there is increasing evidence that industry capacity reductions have led to a greater balance in supply and demand in this sector. The Group’s accident repair centre revenues grew 5.5% on a like-for-like basis and margins improved further to 65.8% (2014: 65.6%). The Group now operates nine accident repair centres. Supply of Manufacturer parts continues to be a vital part of the franchised dealer model. Parts revenues rose 2.9% on a like-for-like basis with margins stable. Parts represents 26.8% (2014: 27.5%) of total aftersales gross profitability. The Group operates a number of petrol forecourts with total revenues in the period of £14.2m. The fall in fuel prices resulted in a 5.4% fall in like-for-like petrol forecourt revenues in the period whilst stronger margins saw gross profits rise by £0.1m. The fall in revenues in the forecourts resulted in lower overall aftersales revenue growth in the period than may have been anticipated, particularly in the second half. Robert Forrester Chief Executive
20
Vertu Motors plc
Strategic Report (continued) Finance Director’s Review Operating expenses
Cost control is a key discipline in UK automotive retail given the tight margins and the highly competitive trading environment. Strong cost control is essential both to achieve the benefits of operational gearing from growing sales activity in the core Group, and in the turning round of underperforming businesses acquired by the Group. The Group adopts a highly detailed business planning approach for all dealerships, profit centres and cost centres. This involves both annual zero based plans created for existing businesses and similar plans established for new acquisitions. Costs are benchmarked on a monthly basis for every dealership against internal benchmarks and recognised industry key performance indicators to identify opportunities for profit improvement. In addition, our central purchasing function has continued to pursue and achieve savings and efficiencies in the procurement of all goods and services not-for-resale, to ensure that scale economies are maximised without compromising on the customer experience. Operating expenses rose from £174.3m to £205.3m, but as a percentage of revenues reduced to 9.9% (2014: 10.3%) demonstrating operational gearing benefits and enhancing overall profitability and return levels. Underlying operating expenses rose £9.1m (5.8%) year on year. Nearly two thirds of this increase relates to employment costs due to:
• increased commissions and other variable incentives payable as a result of higher levels of sales and improved profitability at department, dealership and Group level;
• increases in vehicle sales departments’ headcount to ensure the Group takes full advantage of higher sales volume levels as the market opportunity grows; and
• further investment in contact centres and other central functions to support the Group’s growth and customer experience.
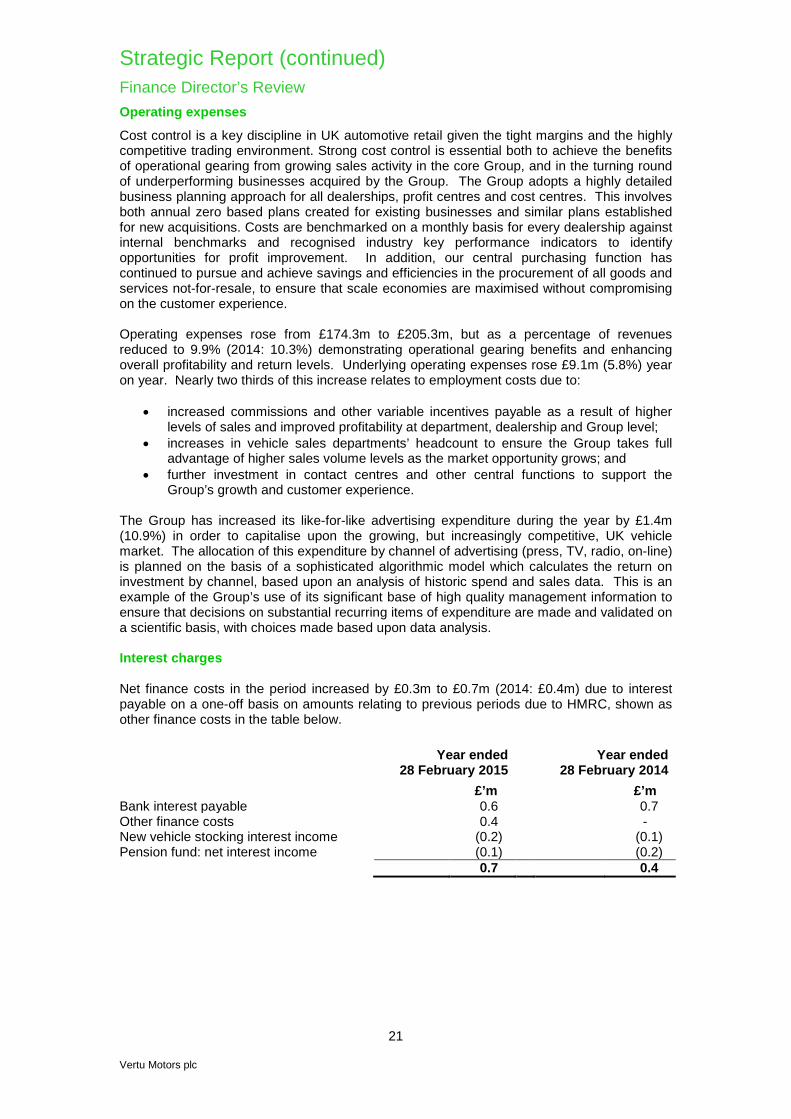
The Group has increased its like-for-like advertising expenditure during the year by £1.4m (10.9%) in order to capitalise upon the growing, but increasingly competitive, UK vehicle market. The allocation of this expenditure by channel of advertising (press, TV, radio, on-line) is planned on the basis of a sophisticated algorithmic model which calculates the return on investment by channel, based upon an analysis of historic spend and sales data. This is an example of the Group’s use of its significant base of high quality management information to ensure that decisions on substantial recurring items of expenditure are made and validated on a scientific basis, with choices made based upon data analysis. Interest charges Net finance costs in the period increased by £0.3m to £0.7m (2014: £0.4m) due to interest payable on a one-off basis on amounts relating to previous periods due to HMRC, shown as other finance costs in the table below. Year ended
28 February 2015 Year ended
28 February 2014 £’m £’m Bank interest payable 0.6 0.7 Other finance costs 0.4 - New vehicle stocking interest income (0.2) (0.1) Pension fund: net interest income (0.1) (0.2) 0.7 0.4
21
Vertu Motors plc
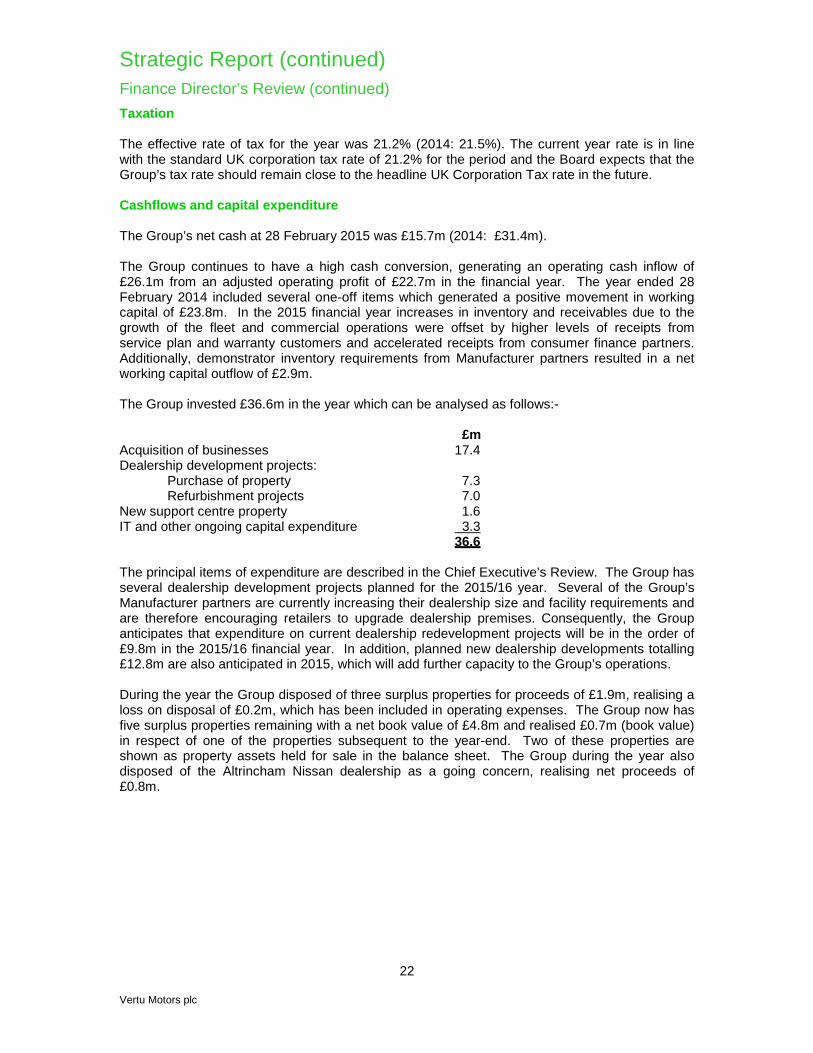
Strategic Report (continued) Finance Director’s Review (continued) Taxation The effective rate of tax for the year was 21.2% (2014: 21.5%). The current year rate is in line with the standard UK corporation tax rate of 21.2% for the period and the Board expects that the Group’s tax rate should remain close to the headline UK Corporation Tax rate in the future. Cashflows and capital expenditure The Group’s net cash at 28 February 2015 was £15.7m (2014: £31.4m). The Group continues to have a high cash conversion, generating an operating cash inflow of £26.1m from an adjusted operating profit of £22.7m in the financial year. The year ended 28 February 2014 included several one-off items which generated a positive movement in working capital of £23.8m. In the 2015 financial year increases in inventory and receivables due to the growth of the fleet and commercial operations were offset by higher levels of receipts from service plan and warranty customers and accelerated receipts from consumer finance partners. Additionally, demonstrator inventory requirements from Manufacturer partners resulted in a net working capital outflow of £2.9m. The Group invested £36.6m in the year which can be analysed as follows:- £m Acquisition of businesses 17.4 Dealership development projects: Purchase of property 7.3 Refurbishment projects 7.0 New support centre property 1.6 IT and other ongoing capital expenditure 3.3 36.6 The principal items of expenditure are described in the Chief Executive’s Review. The Group has several dealership development projects planned for the 2015/16 year. Several of the Group’s Manufacturer partners are currently increasing their dealership size and facility requirements and are therefore encouraging retailers to upgrade dealership premises. Consequently, the Group anticipates that expenditure on current dealership redevelopment projects will be in the order of £9.8m in the 2015/16 financial year. In addition, planned new dealership developments totalling £12.8m are also anticipated in 2015, which will add further capacity to the Group’s operations. During the year the Group disposed of three surplus properties for proceeds of £1.9m, realising a loss on disposal of £0.2m, which has been included in operating expenses. The Group now has five surplus properties remaining with a net book value of £4.8m and realised £0.7m (book value) in respect of one of the properties subsequent to the year-end. Two of these properties are shown as property assets held for sale in the balance sheet. The Group during the year also disposed of the Altrincham Nissan dealership as a going concern, realising net proceeds of £0.8m.
22
Vertu Motors plc

Strategic Report (continued) Finance Director’s Review (continued) Financial Position The Group has a strong balance sheet with shareholders’ funds of £179.6m (2014: £163.4m), representing net assets per share of 52.7p (2014: 48.5p). Tangible net assets per share were 38.3p (2014: 36.4p). The balance sheet is underpinned by a freehold and long leasehold property portfolio of £126.6m (2014: £105.6m). The Board continues to seek to balance those dealerships in freehold and leasehold premises and to be conservative in terms of the lease terms entered into, favouring lease breaks and open market value rent reviews. As at 28 February 2015, freehold locations represented 50% of locations (2014: 50%). The Group finances its operations by a mixture of shareholders’ equity, bank borrowings and trade credit from suppliers and Manufacturer partners. As at 28 February 2015, the Group had in place a bank loan of £3.5m repayable on an amortising basis by October 2015, and an acquisition facility of £15.0m available until September 2016 which was undrawn at 28 February 2015. Interest is payable on these facilities at LIBOR plus 2.25% and LIBOR plus 1.70% respectively. During the period, the Group comfortably complied with all of the financial covenants in respect of these borrowings, which include loan to value, net debt to EBITDA and interest and lease costs to EBITDAR. In addition to these loan facilities, the Group had £30m of overdraft and other money market facilities with Barclays Bank. On the overdraft, interest was paid on drawn amounts at 1.5% above Base Rate, and on the money market facilities interest was paid at 1.35% above LIBOR. The Group operated with cash balances for much of the year and these additional facilities are utilised to fund significant peak working capital requirements following plate change months. As at 28 February 2015, the Group had cash balances of £19.3m (2014: £36.9m) and, as a consequence, net cash of £15.7m (2014: net cash of £31.4m). The cash position at 28 February 2015 reflects the seasonal reduction in working capital, typical of the industry, which arises at the month end prior to a plate change month. Consequently, the year-end cash position is higher than the normalised cash balances throughout the remainder of the year by approximately £20m. The Group refinanced its banking facilities shortly after the year end as set out below. The Group’s cash balances, on-going cash generation and the acquisition loan facility will be used to fund the Group’s on-going acquisition strategy. Pensions The Bristol Street defined benefit pension scheme, which is accounted for on the basis of IAS 19 (revised), showed a surplus as at 28 February 2015 of £3.0m (2014: £3.1m). During the year, and in line with the funding programme agreed with the Trustees in 2013, the Group made cash contributions to the scheme of £0.4m (2014: £0.4m). This scheme is closed to future membership and accrual.
23
Vertu Motors plc

Strategic Report (continued) Finance Director’s Review (continued) Post balance sheet events On 30 March 2015, the Group refinanced its borrowing facilities, converting the £15.0m acquisition facility (available until September 2016) into a committed £20.0m acquisition facility which can be increased to £40.0m (extension currently uncommitted) and available until 31 March 2019. The overdraft and other money market facilities of £35m were increased to £45m and are available until 31 March 2016. The interest rates and other terms on these refinanced facilities are all more favourable to the Group than those on the former facilities as set out above. On 31 March 2015, the Group closed a small sales outlet representing Suzuki in Mansfield and one of the peripheral sales outlets of the Bolton Ford business acquired in November 2014. On 10 April 2015, the Group also closed a small Peugeot sales outlet in Ilkeston. There were no significant costs associated with these closures. On 24 April 2015, the Group disposed of the second peripheral freehold sales outlet acquired with the Bolton Ford business in November 2014, for a consideration of £0.7m, which equates to the net book value of this property. On 30 April 2015 the Group exchanged contracts to acquire the business and certain assets of Bradford Jaguar from a subsidiary of Jardine Motors Group. The estimated consideration for this leasehold acquisition is £0.9m including goodwill of £0.75m. On 30 April 2015 the Group acquired the business and certain assets of Bury Land Rover from a subsidiary of Pendragon PLC. The total consideration for this leasehold acquisition was £7.0m including goodwill of £7.0m. The consideration for both of these acquisitions has been settled from the Group’s existing resources. Michael Sherwin Finance Director 13 May 2015
24
Vertu Motors plc
Main Board Directors The Board currently comprises the Directors outlined below.
Peter Jones – Non-Executive Chairman
Peter (58) has extensive industry background including his joint ownership of the successful independent motor group Bramall and Jones Ltd; Commercial Director at Inchcape Retail; CEO of C.D. Bramall plc and Commercial Director of Rover Cars UK & Ireland. From 2008 to 2013, Peter served as an Executive Director of Lookers plc including the CEO role from October 2009 to the end of December 2013.
William Teasdale – Non-Executive Director
Bill (72) is a Non-Executive Director of a number of private companies including British Engines Limited and Bedmax Limited. He was Non-Executive Director and Chairman of the Audit Committee at Reg Vardy plc between 2002 and 2006. Prior to this, he was the Senior Partner at the Newcastle upon Tyne office of PricewaterhouseCoopers LLP. Bill has substantial experience of corporate transactions and within the quoted company environment.
David Forbes – Non-Executive Director
David (55) is a former Managing Director at Rothschild where he developed his career over 22 years. Prior to that he qualified as a Chartered Accountant in 1984 and worked for a number of organisations in corporate finance roles. His areas of expertise include mergers, acquisitions, corporate strategy and corporate finance, involving both debt and equity. He is also Non-Executive Chairman at entu (UK) plc and Non-Executive Director and Chairman of the remuneration committee at both Boohoo.com plc and Renew Holdings plc.
Nigel Stead - Non-Executive Director
Nigel (65) was previously CEO of Lex Autolease, the UK’s largest contract hire and leasing group and a Director of the British Vehicle Rental and Leasing Association. He has also been a Non-Executive Director of Motability Operations Group plc and Universal Salvage plc. Nigel is currently a Non-Executive Director of Prohire plc and Merrion Fleet Management Limited.
Robert Forrester – Chief Executive
Robert (45) was a Director of Reg Vardy plc between 2001 and 2006 where he held the roles of Finance Director and Managing Director. Robert qualified as a chartered accountant with Arthur Andersen. He is also a member of the Economic Growth Board of the Confederation of British Industry.
Michael Sherwin – Finance Director
Michael (56) has extensive retail, transactional and public market experience. From 1999 to 2008, Michael was Group Finance Director of Games Workshop Group PLC, a FTSE listed consumer goods company. Michael is a qualified Chartered Accountant having trained with Price Waterhouse, where he held positions in the UK, Paris and Sydney. He was also Non-Executive Director of Plusnet plc, an AIM listed internet business, from 2004-2007.
25
Vertu Motors plc
Advisors Nominated Advisor and Broker
Liberum Capital Limited Ropemaker Place 25 Ropemaker Street London EC2Y 9LY
Solicitors
Bond Dickinson LLP St Ann’s Wharf 112 Quayside Newcastle upon Tyne NE1 3DX
Independent Auditors
PricewaterhouseCoopers LLP Chartered Accountants and Statutory Auditors Benson House 33 Wellington Street Leeds LS1 4JP
Tax Advisors
Deloitte LLP One Trinity Gardens Broad Chare Newcastle upon Tyne NE1 2HF
Registrars
Capita Asset Services The Registry 34 Beckenham Road Beckenham Kent BR3 4TU
Financial PR Advisors
Camarco 107 Cheapside London EC2V 6DN
Company Secretary
Karen Anderson Registered office To 26 May 2015 Vertu Motors plc Vertu House Kingsway North Team Valley Gateshead NE11 0JH
Broker
Zeus Capital Limited 82 King Street Manchester M2 4WQ
From 26 May 2015 Vertu Motors plc Vertu House Fifth Avenue Business Park Team Valley Gateshead NE11 0XA
26
Vertu Motors plc
Corporate and Social Responsibility Report Introduction
Corporate and Social Responsibility (“CSR”) is at the very core of our Group’s culture and values and the CSR strategy falls into four main areas:
o Health and Safety o Environmental Management o Colleagues o Vertu in the Community
1. Health and Safety
The environmental impact of the main automotive retail business is comparatively low; however, our focus on responsible policies with regards to Health & Safety, energy and the environment is high.
A consistent Group-wide approach is taken with regards to Health and Safety and environmental matters. We have recently instigated a complete review of our Health and Safety policy which has now been revised and includes a proactive management system, and this is being implemented across the Group. This includes the development of a Health and Safety Dashboard within our management information systems which will help us ensure that required activities are carried out consistently at the appropriate times. Independent external audits to assess the practical implementation of the revised policy have been procured and this process will begin in the second half of 2015.
A Health and Safety committee, chaired by the Commercial Director and including the CEO as a member, meets monthly to consider all aspects of our Health and Safety performance, including reviewing any incidents, and considering how to spread best practice across the Group. All line managers receive comprehensive, externally provided training to ensure they understand relevant legislation and the scope of their responsibility in this critical area.
There are clear lines of responsibility which are communicated to all colleagues. The General Manager is the main responsible individual at each dealership for all Health and Safety matters supported by a dealership Health and Safety Co-ordinator. A Group Health and Safety Manager is responsible for; monitoring compliance with Health and Safety systems, providing support and advice to the General Managers, monitoring and auditing the effectiveness of Health and Safety training across the Group, as well as continually assessing the quality of our systems, outputs and recommending improvements. The Health and Safety Committee also reports monthly to the Board, and key findings are communicated regularly to Senior and General Managers to retain a focus on Health and Safety matters.
2. Environmental Management
The Group’s strategy on environmental matters is to ensure legal and regulatory compliance as well as seeking to manage costs through effective resource allocation. The licences required to operate the businesses are obtained from the relevant authorities and controls are in place in relation to substances that may harm the environment including:
o Substances that may be hazardous to health are logged and recorded on sites together with written assessments of precautions necessary while in use.
o Waste from sites is disposed of by authorised carriers in accordance with the Environmental Protection Act 1990. Relevant hazardous waste producing licences are in place where required and waste transfer notes are logged.
o Water based paints are used by our bodyshops and the Group does not use paints containing isocyanates.
o Paint spray booths are examined and serviced annually with filters being replaced at the manufacturer recommended intervals.
o All redundant and end of life hardware and electrical items are disposed of in accordance with the Waste Electrical and Electronic Equipment Directive (WEEE Directive) regulations.
A great deal of importance is placed on environmental matters during the due diligence process for acquisitions, with external environmental consultants reviewing and assessing environmental risks. Assessments may include site and soil surveys, reviews of environmental management systems and reviews of compliance with laws and regulations. Appropriate warranties and indemnities are then sought from vendors where possible.
27 Vertu Motors plc

Corporate and Social Responsibility Report (continued) 2. Environmental Management (continued)
We have a comprehensive waste and recycling strategy and we recycled 82% of all waste we produced in this 12 month period. Our aim is to continue to seek ways to increase our recycling performance and this remains core to our environmental objectives.
Vertu Motors plc comply with the Environmental Agency Carbon Reduction and Energy savings schemes. All data submissions and declarations are completed in accordance with the relevant scheme rules.
We are committed to ongoing energy and utilities reduction and have incorporated energy management training into our new manager induction module, all senior Line Mangers, General Managers and Accountants receive direct energy management training. This training is supported by specialist in-house energy audit and property professionals looking at building and plant efficiency.
The Group seeks to establish long term partnerships with a small number of like-minded core suppliers who can provide evidence that they hold all of the relevant licences and accreditations required to operate their business. Suppliers must also be able to demonstrate their corporate and social responsibility policies and internal processes to support these policies.
3. Colleagues
The Group seeks to fulfil the career aspirations and potential of all colleagues. The Board seeks that every colleague enjoys coming to work, feels motivated in everything that they do and takes pride in their contribution to the Group. The enthusiasm and dedication of colleagues is a vital factor in the Group’s success. In order to develop a culture that is positive and contributes to the Group performance, a number of core values are used extensively in the business to signpost desired behaviours. These are set out below:
• Values
o Passion
We are proud of our Company and dedicated to its purpose. We are enthusiastic, enjoy challenges and are eager for success.
o Respect
We are friendly and courteous in all our relationships with colleagues, customers and suppliers.
o Professionalism
We are reliable and consistent and we excel in the standards and presentation of our people, products and premises.
o Integrity
We are trustworthy and honest in all that we say and do and take responsibility for our own actions.
o Recognition
We appreciate the endeavours of our colleagues. We praise their achievements and enjoy celebrating their success.
o Opportunity
We have a vision of what can be achieved and provide colleagues with personal development, supportive training and exciting career progression.
o Commitment
We are all determined to achieve total customer satisfaction by providing a service built on trust.
28 Vertu Motors plc
Corporate and Social Responsibility Report (continued) 3. Colleagues (continued)
• Employment Policies
The Group's aim is to attract and retain the best people in the automotive retail sector while observing best practice in employment policies and procedures through a commitment to:
o Offering equal opportunities in recruitment and promotion;
o The continuous development of all colleagues;
o Encouraging internal promotion;
o Using progressive, consistent and fair selection methods;
o Offering family friendly policies and ensuring colleagues are treated with respect and dignity in an environment where no form of intimidation or harassment is tolerated.
All appointments are made solely on the basis of a person's suitability for a particular post and without reference to gender, sexual orientation, age, ethnic origin, religion or disability (except when there is a genuine occupational requirement). The principle of equality also applies to career development opportunities and training.
Employment of disabled people is considered on merit with regard only to the ability of the applicant to carry out the function required. Arrangements to enable disabled people to carry out the function required will be made if it is reasonable to do so. A colleague becoming disabled would, where appropriate, be offered retraining and support to continue in their role where possible.
The Group pays attractive salaries and additional benefits to dedicated people. Every permanent colleague is offered entry into the Group's pension scheme. The Group encourages colleagues to become shareholders in the Company through participation in the Group's share schemes; including an all-colleague Share Incentive Plan.
• Communication
The Group is committed to providing colleagues with information on matters of concern to them on a regular basis. Individual achievement is recognised publicly and privately to reinforce behaviours in line with the Group’s Values and Mission Statement. ‘Working together’ as teams is also vital and at the heart of this is good communication. The Group utilises many formal and informal channels to achieve this, for example, the Chief Executive produces a blog several times a week, regular news updates are posted onto a Group wide intranet site and printed Group newsletters are produced three times a year. Each General Manager undertakes a monthly Team Brief, updating colleagues in small groups on relevant issues impacting the Group and the dealership, these meetings seek to reinforce the Group’s values and contribute to the creation of a Group culture.
The Group operate several award schemes covering all colleagues. These schemes are intended to recognise and reward talented and committed individuals throughout the Group. For example, the CEO Awards are announced each December whereby a number of managers are recognised for their performance. The Group also launched in 2011, ‘The Masters’ Club Awards, whereby a number of high performing non-management colleagues from across the Group are recognised for their performance. The recipients range from sales executives, service advisors and technicians to drivers, cleaners, valeters and receptionists. These award programmes are designed to reward and reinforce behaviours underpinning both Group financial performance and other strategic objectives such as the delivery of an outstanding customer experience.
29 Vertu Motors plc

Corporate and Social Responsibility Report (continued) 4. Vertu in the Community
The scope of our involvement in the community includes both charity and community support.
• Charity Support The Group is proud to work with a diverse and broad range of national charities and local projects. Since 2009 the Group has raised over £140,000 for Children in Need. This year the Group supported the following charities: - BEN (Motor and Allied Trades Benevolent Fund) - Children in Need - St. Oswald’s Hospice Newcastle
• Community Support
As the Group has expanded so has the scope of the Group’s involvement in the community as part of our wider corporate and social responsibility strategy. The projects chosen to be supported reflect the diversity and depth within the business and the desire of colleagues to be an active part of the communities the dealerships serve. Our community support initiatives include Dunston Silver Band, Solihull Barons ice hockey team, Newcastle Eagles Basketball Club, Northampton Town Football Club Academy teams plus a variety of youth sports clubs across the country.
30 Vertu Motors plc

Directors’ Report The Directors present their annual report and the audited financial statements on the affairs of the Group and Company, for the year ended 28 February 2015.
Principal Activities
The principal activity of the Group is the sale of new cars, motorcycles and commercial vehicles and used vehicles, together with related aftersales services. The principal activity of the Company is the provision of management services to all subsidiary statutory entities.
Business Review and Future Developments
The review of the business for the year is contained in the Chairman’s Report, Chief Executive’s Review and Finance Director’s Review. This includes details of acquisitions and likely future developments. It remains your Board’s intention to deliver shareholder value and develop the Group through strategic acquisitions supplemented by the focused organic growth of its existing businesses.
Results and Dividends
The results for the year are set out in the consolidated income statement on page 60. The Group’s profit from ordinary activities after taxation for the year was £16,539,000 (2014: £12,428,000).
The dividend paid in the year to 28 February 2015 was £2,895,000 (0.85p per share) (2014: £2,526,000 (0.75p per share)). A final dividend in respect of the year ended 28 February 2015 of 0.7p per share, is to be proposed at the annual general meeting on 23 July 2015. The ex dividend date will be 25 June 2015 and the associated record date 26 June 2015. The dividend will be paid on 28 July 2015, and these financial statements do not reflect this final dividend payable.
Company Number
The registered number of the Company is 5984855.
Directors and Their Interests
Brief particulars of the Directors are listed on page 25. Further details of the Board composition are contained in the Corporate Governance Report and details of Directors' service contracts are contained in the Remuneration Committee Report. The Directors who served during the year ended 28 February 2015 and up to the date of signing the financial statements were:
P Jones (appointed 1 January 2015) P R Williams (resigned 31 December 2014) R T Forrester M Sherwin W M Teasdale D M Forbes N Stead
The Directors retiring at the Annual General Meeting are P Jones, M Sherwin, W M Teasdale and D Forbes. D Forbes will leave the Board at the 2015 Annual General Meeting and does not offer himself for re-election. All other retiring Directors, being eligible, offer themselves for re-election.
31 Vertu Motors plc

Directors’ Report (continued) Directors and Their Interests (continued)
The Directors who held office at 28 February 2015 and their connected persons had interests in the issued share capital of the Company as at 28 February 2015 as follows:
28 February 28 February 2015 2014 Ordinary
Shares Ordinary
Shares P Jones 1,000,000 - R T Forrester 6,612,754 6,545,204 M Sherwin 348,687 327,988 D M Forbes 352,600 352,600 W M Teasdale 616,450 616,450 N Stead 56,500 56,500
Details of related party transactions, which include transactions between Directors and Group companies, are given in note 36.
Derivatives and Financial Instruments
The Group’s treasury activities are operated within policies and procedures approved by the Board, which include defined controls on the use of financial instruments managing the Group’s risk. The major financial risks faced by the Group relate to interest rates and funding. The policies agreed for managing these financial risks are summarised below.
The Group finances its operations by a mixture of shareholders’ equity funds and bank borrowings and trade credit from both suppliers and manufacturer partners. To reduce the Group’s exposure to movements in interest rates, the Group seeks to ensure that it has an appropriate balance between fixed and floating rate borrowings. The Group uses interest rate swaps in order to manage its exposure to interest rate risk; all such arrangements are approved by the Board in line with its treasury policies. The Group applied hedge accounting under IAS 39 ‘Financial Instruments’ in respect of its interest rate swap arrangements.
The Group has ensured continuity of funding by entering into a five year funding agreement with Barclays Bank on 15 October 2010, comprising a £10m term loan repayable over 5 years. On 30 March 2015 the Group refinanced its revolving credit facilities, converting a £15m acquisition facility (available until September 2016) into a committed £20m acquisition facility which can be extended to £40m (extension currently uncommitted). These new facilities are available until 30 March 2019. Short-term flexibility is achieved through the Group’s overdraft and short term committed money market loan facilities. These annual facilities were renewed on 30 March 2015 and were increased from £35m to £45m. At 28 February 2015 the Group held an interest rate hedge in respect of the outstanding balance on the term loan, which matures together with the interest rate swap in October 2015.
The Group manages liquidity risk by maintaining adequate reserves, banking facilities and other reserve borrowing facilities, by continuously monitoring forecast and actual cash flows and matching the maturity profiles of financial assets and liabilities.
Colleagues
The policies of the Group on equal opportunities, including those of disabled colleagues and colleague involvement, are set out in the Corporate and Social Responsibility Report on pages 27 to 30.
Health and Safety
The policies of the Group on health and safety, as well as goals and controls in place are set out in the Corporate and Social Responsibility Report on pages 27 to 30.
32 Vertu Motors plc

Directors’ Report (continued) Directors’ statement as to disclosure of information to Auditors
In the case of each person who was a Director of the Group at the date when this report was approved:
• so far as each of the Directors is aware, there is no relevant audit information of which the Group’s auditors are unaware, and;
• each of the Directors has taken all the steps that he ought to have taken as a Director in order to make himself aware of any relevant audit information and to establish that the Group’s auditors are aware of that information.
The auditors, PricewaterhouseCoopers LLP, have indicated their willingness to continue in office, and a resolution concerning their reappointment will be proposed at the Annual General Meeting.
Statement of Directors' Responsibilities
The Directors are responsible for preparing the Annual Report and the financial statements in accordance with applicable law and regulations.
Company law requires the Directors to prepare financial statements for each financial year. Under that law the Directors have prepared the Group financial statements in accordance with International Financial Reporting Standards (IFRSs) as adopted by the European Union, and the parent Company financial statements in accordance with United Kingdom Generally Accepted Accounting Practice (United Kingdom Accounting Standards and applicable law).
Under company law the Directors must not approve the financial statements unless they are satisfied that they give a true and fair view of the state of affairs of the Group and the Company and of the profit or loss of the Group for that period.
In preparing these financial statements, the Directors are required to:
• select suitable accounting policies and then apply them consistently; • make judgements and estimates that are reasonable and prudent; • state whether IFRSs as adopted by the European Union and applicable UK Accounting
Standards have been followed, subject to any material departures disclosed and explained in the Group and parent Company financial statements respectively; and
• prepare the financial statements on the going concern basis unless it is inappropriate to presume that the Company will continue in business.
The Directors are responsible for keeping adequate accounting records that are sufficient to show and explain the Company’s transactions and disclose with reasonable accuracy at any time the financial position of the Company and the Group and enable them to ensure that the financial statements comply with the Companies Act 2006. They are also responsible for safeguarding the assets of the Company and the Group and hence for taking reasonable steps for the prevention and detection of fraud and other irregularities.
The Directors are responsible for the maintenance and integrity of the Company’s website (www.vertumotors.com). Legislation in the United Kingdom governing the preparation and dissemination of financial statements may differ from legislation in other jurisdictions.
33 Vertu Motors plc

Directors’ Report (continued) Statement of Directors' Responsibilities (continued)
Each of the Directors, whose names and functions are listed in the Main Board Directors section of this Annual Report, confirms that, to the best of their knowledge:
• the Group financial statements, which have been prepared in accordance with IFRSs as adopted by the EU, give a true and fair view of the assets, liabilities, financial position and profit of the Group; and
• the Directors’ and Strategic Reports include a fair review of the development and performance of the business and the position of the Group, together with a description of the principal risks and uncertainties that it faces.
By order of the Board Karen Anderson Company Secretary 13 May 2015
34 Vertu Motors plc

Corporate Governance Report The UK Corporate Governance Code
This Corporate Governance Report (the ‘Report’) is intended to give shareholders an understanding of the Group’s governance procedures. As an AIM listed Company, Vertu Motors plc does not have to comply with the UK Corporate Governance Code (2012) (the ‘Code’) published by the Financial Reporting Council. However, the Board embraces the principles of good corporate governance. Although the Group does not choose to voluntarily comply with the Code in full, the Report describes how the relevant principles and provisions set out in the Code were applied to the Company and Group during the financial year and will continue to be relevant for the forthcoming financial year. The Company does not yet comply with all of the Code requirements relating to ‘effectiveness’ or ‘remuneration’ but complies with all other areas.
Board Composition
Board composition is continually reviewed to ensure that it provides the Group with the strategic oversight, vision and governance that it needs in order to deliver a sustainable long term return for shareholders. It is the Board’s intention that going forward, Non-Executive Directors will ordinarily rotate every six years, in line with current corporate Governance best practice.
Paul Williams retired on 31 December 2014 after heading the Board as Chairman since the Group’s initial acquisition of Bristol Street Group in March 2007. The Board would like to thank Paul for his valued advice and assistance over the last seven years. Peter Jones was formally appointed as Chairman of the Board on 1 January 2015. Peter brings a wealth of operational experience to the Board and his full biography can be found on page 25.
Ken Lever joins the Board on 1 June 2015 as a Non-Executive Director. Ken brings a wealth of City, technology and finance experience to the Group having held senior roles as both CEO and Finance Director in several major listed companies. He is currently the CEO of Xchanging plc and is a former member of the Accounting Council of the Finance Reporting Council.
David Forbes, who has served as Non-Executive Director for six years will not be seeking re-election at the forthcoming Annual General Meeting. David has served during a period of transformation in the scale of the Group and has been invaluable during this phase of growth. The Board thanks David for this valued contribution.
During the year under review, the Board was made up of six members comprising two Executive Directors and four Non-Executive Directors. W M Teasdale is the Senior Independent Director. Details of all directors can be found on page 25.
The Board and its Committees
The role of the Board is to have responsibility for generating shareholder value over the long term by setting the Group’s strategy, ensuring that appropriate resources are available to enable the Group to meet its objectives and to monitor the delivery of those objectives within an effective framework of internal controls. The Board has a defined set of responsibilities which are formalised into a Schedule of Matters Reserved for the Board and these include:
• Strategy and management – responsibility for long-term success of the Company and Group, commercial strategy, and approval of the expansion of the Group through acquisition or any significant disposals
• Financial reporting and controls – review and approval of the annual business plan and capital budget, major capital expenditure projects and any significant changes to these, all trading or results statements and the annual financial statements
• Internal controls – reviewing the effectiveness of internal control processes to support strategy
• Risk – approval of the Group’s appetite, determining the nature and extent of significant risks the Group is willing to take to achieve its objectives
Executive Management have limits on the decisions delegated to them by the Board.
35 Vertu Motors plc

Corporate Governance Report (continued) The Board and its Committees (continued)
Key Areas of Board Focus During the Year
STRATEGY FINANCIAL PERFORMANCE GOVERNANCE SHAREHOLDER
ENGAGEMENT RISK
Approval of acquisitions completed during the financial year
Group strategy review
Business development
Reviewing M&A opportunities
Approval of annual business plan and capex budget
Interim and final dividend
Approval of the FY2014 full year results and FY2015 interim results
Monthly management accounts
Long range forecast and funding requirement planning
Appointment of Peter Jones as Chairman
Re-appointment of auditors
FCA application (for consumer credit activities)
Established Compliance and Health and Safety Committees
Annual General Meeting
Meetings with key shareholders on results roadshows
Annual review of key Group risks and mitigating controls
Board Meetings The Board meetings are structured to allow the Board sufficient time to discuss and review financial performance, achievement of objectives, development of the Group’s strategy, operational performance and risk and internal controls. Standing agenda items are discussed at each Board meeting, which include:
• Chief Executive’s Report – update on performance, strategic opportunities, property matters and management
• Finance Director’s Report – includes the latest financial information for the Group
• Health and Safety Report – Summary of training undertaken throughout the Group plus commentary on any reported incidents
• Compliance Report – summary of regulatory developments and minutes of the latest Compliance Committee meeting
• Investor Relations (‘IR’) Report – update on market trends, share register movements and summary of IR activity
36 Vertu Motors plc

Corporate Governance Report (continued) Committees Responsibilities
The table below shows the key committees and their responsibilities. AUDIT
COMMITTEE REMUNERATION COMMITTEE
NOMINATIONS COMMITTEE
CEO COMMITTEE COMPLIANCE COMMITTEE
HEALTH AND SAFETY COMMITTEE
Delegated authorities
• Financial reporting
• Financial risk management
• Internal control
• Remuneration policy
• Incentive plans • Performance
targets
• Balance of the Board
• Leadership of the Group
• Review, communication, delivery and management of Group strategy and day to day operations
• Compliance with laws and regulations (excluding Health & Safety and environmental)
• Whistleblowing procedures
• Communication with regulators where required
• Compliance with Health & Safety and environmental law and regulations
• Developing Group best practices
Reviews • Full year and half year results
• Accounting policies
• Terms of engagement of auditors
• Internal audit
• Achievement of performance targets for short and long term incentives
• Senior management pay
• Composition of the Board
• Skills, knowledge & experience on the Board
• Diversity
• Group HR and IT strategy
• Allocation of resources (financial and colleague)
• Group performance
• Adequacy and effectiveness of Group policies in response to current law and regulation
• Licences and consents required
• Internal audit
• Health & Safety policies and procedures
• Health & Safety audits
• Accident statistics and causes
Recommends • Re-appointment of auditors
• Audit tender • Auditors’
remuneration
• Level and structure of Executive remuneration
• Remuneration policy
• Appointments to the Board
• Election/re-election of Directors at Annual General Meeting
• Annual business plan to the Board
• Acquisition opportunities to the Board
• Group Vision
• Training • Policy change • Remedial or pre-
emptive action
• Training • Policy change • Remedial or pre-
emptive action
Monitors • Integrity of financial statements
• Effectiveness of internal controls and risk management
• Internal audit function
• Legal & regulatory requirements
• Appropriateness of Remuneration policy
• Independence of Non-Executive Directors
• Succession planning
• Performance against key performance indicators, plans and prior year
• Compliance with group risk management strategy, policy and procedures
• Appropriate retail finance metrics
• Indicators of non-compliance with policy
• Any relevant complaints
• Legal and regulatory developments
• Accidents and near misses
• Changes to law and regulations
• New sites to the Group and redevelopments
• Other changes in working practice
Approves • Statements in Annual report concerning internal controls and risk management
• Remuneration policy
• Remuneration packages for Executive Directors
• Design of long term incentive plans
• External appointments for Executive Directors
• Skills profile for Non-Executive Directors
• Appointments to dealership management positions
• Performance related remuneration of dealership colleagues
• Operational process and changes
• Reports to the Board
• Submissions to relevant authorities
• Changes to relevant policies and processes
• Training programmes
• Whistleblowing procedures
• Reports to the Board
• Changes to relevant policies
• Training programmes
37 Vertu Motors plc

Corporate Governance Report (continued) Leadership
During the financial year the Board met 8 times in person and on other occasions by telephone. The number of meetings attended by each Director was as follows:
Board Meetings
Audit Committee Meetings
Nominations Committee Meetings
Remuneration Committee Meetings
Scheduled Attended Scheduled Attended Scheduled Attended Scheduled Attended
P Jones* 1 1 - - - - - P R Williams** 7 7 - 1 1 3 3 R T Forrester 8 8 - - - - - W M Teasdale 8 7 3 3 2 2 3 3 D M Forbes 8 8 3 3 2 2 3 3 M Sherwin 8 8 - - - - - - N Stead 8 8 3 3 2 2 3 3
* Peter Jones was appointed on 1 January 2015 ** Paul Williams resigned on 31 December 2014 The Board seeks to ensure that the necessary financial and human resources are in place for the Group to be able to meet its objectives, to review management performance and to ensure that its obligations to its shareholders are understood and met. Whilst the executive responsibility for running the Group rests with the Chief Executive (R T Forrester) and the Finance Director (M Sherwin), the Non-Executive Directors fulfil an essential role in ensuring that the strategies proposed by the Executive Directors are fully discussed and critically examined prior to adoption. They also scrutinise the performance of management in meeting agreed goals and objectives and monitor the reporting of performance, both financial and non-financial.
All Directors appointed by the Board must retire and seek election at the first Annual General Meeting following their appointment. One third of the other Directors are then required to retire and submit themselves for re-election each year so that all Directors are required to retire and submit themselves for re-election at least once in every three years. P Jones, M Sherwin and W M Teasdale are to retire and submit themselves for re-election at the 2015 Annual General Meeting. D M Forbes is to retire from the Board at the 2015 Annual General Meeting. The Board is satisfied that plans are in place for orderly succession for appointments to the Board and senior management, so as to maintain an appropriate balance of skills and experience within the Company and on the Board.
Risk Management Process
CHIEF EXECUTIVE’S (CEO) COMMITTEE Key day to day risk oversight is managed through the CEO Committee which is chaired by
the Group Chief Executive
INTERNAL AUDIT
Responsibility for reviewing financial and operational controls, monitoring risk capture and mitigating actions, reporting to the Audit Committee
HEALTH AND SAFETY COMMITTEE
Delegated responsibilities for compliance with Health & Safety
and Environmental law and regulations
COMPLIANCE COMMITTEE Delegated responsibility from the
Board for Compliance and Whistleblowing
AUDIT COMMITTEE
Delegated responsibility from the Board for risk management and
Internal Controls
THE BOARD Responsibility for identifying significant risks, determining the Group’s risk appetite and oversight of the
principal risks to the Group’s strategic objectives
38 Vertu Motors plc

Corporate Governance Report (continued) ACCOUNTABILITY
Financial and Business Reporting
The Board is responsible for presenting a fair, balanced and understandable assessment of the Group’s position and prospects. A statement of the Directors’ responsibilities for preparing the Annual Report and financial statements is set out on pages 33 and 34. The statement by the auditors about their reporting responsibilities is given on page 59.
Risk Management and Internal Controls
The Board is responsible for establishing and maintaining adequate internal controls over regular financial reporting for the Group, including the consolidation process. There is a comprehensive system of internal controls in place, including the Annual Business Plan (“Plan”) which is reviewed and approved by the Board. Monthly actual results are reviewed by management against both the Plan and prior year results. All data to be consolidated in the Group’s financial statements is reviewed thoroughly by management to ensure that it complies with relevant accounting policies and the financial reporting gives a true and fair reflection of the financial position of the Group.
The Board has overall responsibility for risk management and is advised of key risks facing the Group on a regular basis with a formal review of the most significant risks annually, or more frequently if required. The Board takes a proactive approach to the management of all forms of risk, and views risk management as a vital constituent of its commitment to provide value protection and growth for its various stakeholders. The internal controls system is designed to manage, rather than eliminate, the risk of failure to achieve the Group's objectives and can, therefore, only provide reasonable, rather than absolute, assurance against material misstatement or loss. The Board regularly reviews the risks to which the Group is exposed, as well as the operation and effectiveness of the system of internal controls.
A Compliance Committee was established as a committee of the Board during the year ended 28 February 2015. The day to day responsibility for compliance and certain regulatory activities has been delegated to the Compliance Committee. This includes the Group’s compliance with regulation under the requirements of the Financial Conduct Authority (FCA), the Advertising Standards Authority, the Trading Standards Institute, the Data Protection Act and all other applicable regulations.
In addition, a Health and Safety Committee was also established during the financial year. Oversight of health and safety and environmental regulatory risk is delegated to the Health and Safety Committee.
The Board's approach involves identification of major risks that may restrict the Group's ability to meet its objectives, the assessment of these risks in terms of impact, likelihood and control effectiveness, and the establishment of risk management strategies. For some key risks, where it is considered necessary, specialist advice is sought from external agencies and professional advisers.
The principal risks facing the Group can be found on pages 2 to 4.
AUDIT COMMITTEE AND AUDITORS
The Board has delegated responsibility for risk management and internal controls to the Audit Committee. Details of the Committee’s activities during the year can be found on pages 41 to 44.
REMUNERATION
The Remuneration Committee has responsibility for developing the Company’s remuneration policy and monitoring its implementation. Details of the Committee’s activities along with the Remuneration Report can be found on pages 45 to 57.
39 Vertu Motors plc

Corporate Governance Report (continued) RELATIONS WITH SHAREHOLDERS
The Board understands that effective communication is essential to enable shareholders to gain a clear understanding of the Group’s strategy and business model. The Chief Executive and the Finance Director are in regular communication with institutional investors throughout the year and keep in close contact with the Company’s corporate brokers who play an important role in ensuring shareholders’ views are heard. The Board reviews a report of shareholder activity at each board meeting and receives regular updates on all communications between major shareholders and any director or the Company’s NOMAD.
Shareholders are also kept informed of Company performance through regular press releases. These are made available to the London Stock Exchange and on the Company’s website. Presentations were held for analysts at the Group’s full year and half year announcements and several investors and analysts visited certain Group dealerships with management during the course of the year.
Annual General Meeting (“AGM”)
The 2015 AGM will take place on 23 July 2015. The AGM gives all shareholders an opportunity to meet the Board and ask any questions they have regarding the Group. The Board encourages participation of private shareholders at the AGM, however, the Board understands that it is not always possible for shareholders to attend. For this reason a prepaid reply form is sent to shareholders to enable them to give their views should they be unable to attend the AGM in person. Details of voting on resolutions at the AGM are made available on the Company’s website.
By order of the Board Karen Anderson Company Secretary 13 May 2015
40 Vertu Motors plc
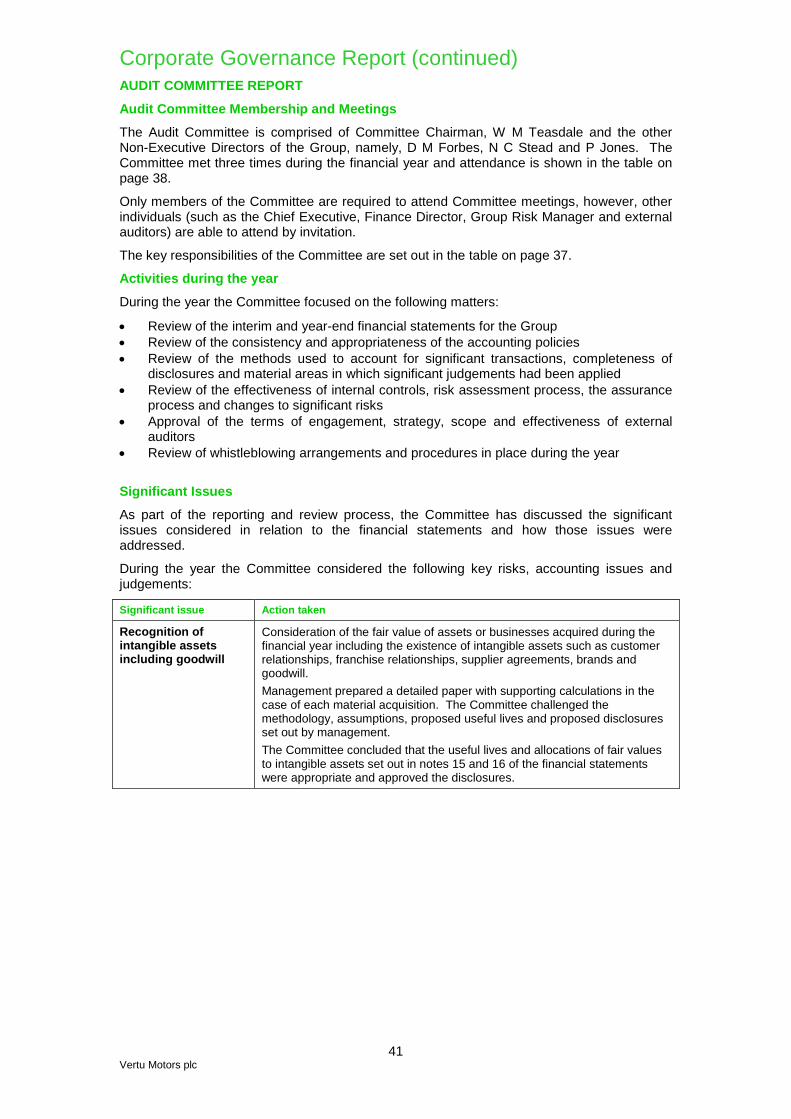
Corporate Governance Report (continued) AUDIT COMMITTEE REPORT
Audit Committee Membership and Meetings
The Audit Committee is comprised of Committee Chairman, W M Teasdale and the other Non-Executive Directors of the Group, namely, D M Forbes, N C Stead and P Jones. The Committee met three times during the financial year and attendance is shown in the table on page 38.
Only members of the Committee are required to attend Committee meetings, however, other individuals (such as the Chief Executive, Finance Director, Group Risk Manager and external auditors) are able to attend by invitation.
The key responsibilities of the Committee are set out in the table on page 37.
Activities during the year
During the year the Committee focused on the following matters:
• Review of the interim and year-end financial statements for the Group • Review of the consistency and appropriateness of the accounting policies • Review of the methods used to account for significant transactions, completeness of
disclosures and material areas in which significant judgements had been applied • Review of the effectiveness of internal controls, risk assessment process, the assurance
process and changes to significant risks • Approval of the terms of engagement, strategy, scope and effectiveness of external
auditors • Review of whistleblowing arrangements and procedures in place during the year
Significant Issues
As part of the reporting and review process, the Committee has discussed the significant issues considered in relation to the financial statements and how those issues were addressed.
During the year the Committee considered the following key risks, accounting issues and judgements:
Significant issue Action taken
Recognition of intangible assets including goodwill
Consideration of the fair value of assets or businesses acquired during the financial year including the existence of intangible assets such as customer relationships, franchise relationships, supplier agreements, brands and goodwill. Management prepared a detailed paper with supporting calculations in the case of each material acquisition. The Committee challenged the methodology, assumptions, proposed useful lives and proposed disclosures set out by management. The Committee concluded that the useful lives and allocations of fair values to intangible assets set out in notes 15 and 16 of the financial statements were appropriate and approved the disclosures.
41 Vertu Motors plc

Corporate Governance Report (continued) AUDIT COMMITTEE REPORT (continued)
Significant Issues (continued)
Significant issue Action taken
Impairment of goodwill, other intangibles and tangible assets
Management performed a detailed impairment review on the goodwill in the financial statements of the Group. The Committee challenged the methodology, assumptions, and sensitivity analysis used by management. The Committee also consider the independent review by the external auditors. The Committee concluded that the carrying amounts shown in notes 15, 16 and 18 of the financial statements were appropriate and approved the disclosures.
Going concern Management have reviewed the Group’s current financial position and have prepared detailed financial projections. The projections assume that profits earned from new and used car sales will remain stable throughout 2015/16; the aftersales business and recent acquisitions will continue to show growth; UK interest rates will remain static at current rates; manufacturer partners will remain in production and supply on normal terms of trade, and there will be no significant downturn in the global economic environment. These projections, even after allowing for sensitivity analysis to accommodate a reasonable downside scenario (including weaker trading and adverse movements in interest rates), indicate that the Group would be able to manage its operations so as to comfortably remain within its current funding facilities and in compliance with its banking covenants. The Committee challenged the assumptions used and also considered the review conducted by the external auditors. The Committee concluded that the Board is able to make the Going Concern statement on page 33 of the Directors’ Report.
Share based payments
Management have ascribed a fair value to share options issued during the financial year. This is estimated using a fair value model, populated with a number of assumptions. The Committee reviewed and challenged these assumptions and also considered the review conducted by the external auditors. The Committee concluded that the assumptions applied and resultant fair value were appropriate.
Pension benefits Obligations under the “Bristol Street Pension Scheme”, which is a defined benefit scheme in which accrual ceased on 31 May 2003, are recognised in the balance sheet. The value recognised is the present value of the obligations calculated by independent actuaries. The Committee reviewed the assumptions applied in calculating these obligations (set out in note 29) at 28 February 2015 and confirmed that these were appropriate.
Manufacturer bonus income
A significant proportion of revenue is received from manufacturer partners in the form of rebates and volume related bonuses. A Group wide revenue recognition policy is in place in respect of this income. Management allocate responsibility to Divisional Finance Directors, as nominated ‘franchise experts’ to ensure bonus programmes are fully understood and communicated to Dealership teams. The Group’s internal audit function reviews the treatment of manufacturer bonus income recognition on a dealership by dealership basis. The Committee concluded that it was satisfied with the revenue recognition policy, and with the appropriateness of the controls currently in operation, over manufacturer bonus income recognition.
Financial and Business Reporting
The Committee is responsible for monitoring the integrity of the financial statements including the Group’s annual and half-yearly results and ensuring they are fair, balanced and understandable.
The external auditors also provide an auditors’ report to the members providing an independent opinion on the truth and fairness of the Group’s financial statements. This report can be found on pages 58 and 59.
42 Vertu Motors plc

Corporate Governance Report (continued) AUDIT COMMITTEE REPORT (continued)
Risk Management and Internal Controls
The Group has well established risk management and internal control processes. These are regularly subject to audit and the results are reported to the Audit Committee and the Board for their review.
Day to day management of risk is delegated to the Chief Executive’s Committee, which consists of the Chief Executive, the Finance Director, the General Counsel and the seven Divisional Operations Directors of the Group.
The Audit Committee confirms that the effectiveness of the system of internal control, covering all material controls including financial, operational and compliance controls and risk management systems, has been reviewed during the year under review and up to the date of approval of the Annual Report.
Internal Audit
The Group Risk Manager reports regularly on the audits carried out in each dealership which, for the financial year ended 28 February 2015, covered both balance sheet and sales process audits. The Group Risk Manager and his team met with the Committee without the presence of management.
External Audit
The Audit Committee has recommended to the Board that a resolution be put to shareholders at the Annual General Meeting to reappoint PricewaterhouseCoopers LLP as auditors of the Company for a further year subject to their continued satisfactory performance. PricewaterhouseCoopers LLP have been appointed as auditors to the Company for the previous eight financial years. In accordance with ethical standards requirements the audit partner responsible for the engagement was subject to rotation after five years. No tender has been conducted. The Committee reviewed the effectiveness, independence and objectivity of the external auditors and no matters of concern were raised during the financial year to 28 February 2015.
The external auditors attend some of the Committee meetings and the Committee meets with the external auditors without management present.
Independence of the Independent Auditors
Both the Audit Committee and the Independent Auditors have in place safeguards to avoid the Independent Auditors' objectivity and independence being compromised. The Group's policy with regard to services provided by the Independent Auditors, PricewaterhouseCoopers LLP, is as follows:
• Statutory audit services
The Independent Auditors, who are appointed annually by the shareholders, undertake this work. The Independent Auditors also provide regulatory services and formalities relating to shareholder and other circulars. The Committee reviews the Independent Auditors' performance on an ongoing basis.
• Further assurance services (this includes work relating to acquisitions and disposals)
The Group's policy is to appoint PricewaterhouseCoopers LLP to undertake this work where their knowledge and experience is appropriate for the assignment. The Board reviews their independence and expertise on every assignment. Other professional services firms are employed in certain cases on acquisition and disposal related assignments.
43 Vertu Motors plc

Corporate Governance Report (continued) AUDIT COMMITTEE REPORT (continued)
Independence of the Independent Auditors (continued)
• Other non-audit services
The Independent Auditors are not permitted to provide internal audit, risk management, litigation support, remuneration advice and information technology services. The provision of other non-audit services, is assessed on a case by case basis, depending on which professional services firm is best suited to perform the work. These safeguards, which are monitored by the Committee, are regularly reviewed and updated to ensure they remain appropriate. The appointment of PricewaterhouseCoopers LLP to provide non-audit services requires Board approval for any assignment with fees above a set financial limit. The Independent Auditors report to the Committee on the actions they take to comply with the professional and regulatory requirements and best practice designed to ensure their independence, including the rotation of key members of the audit team. PricewaterhouseCoopers LLP have formally confirmed this to the Board. The disclosure of non-audit fees paid to PricewaterhouseCoopers LLP during the year is included in note 7 to the consolidated financial statements.
W M Teasdale Chairman of Audit Committee 13 May 2015
44 Vertu Motors plc

Remuneration Committee Report
ANNUAL STATEMENT FROM THE CHAIRMAN OF THE REMUNERATION COMMITTEE
Introduction
On behalf of your Board, I am pleased to present our Directors’ Remuneration Report for the year ended 28 February 2015. This Directors’ Remuneration Report has been prepared on behalf of the Board by the Remuneration Committee (the Committee) in accordance with the spirit, principles and, as far as is reasonably practical, the requirements of the Companies Act 2006, the Quoted Companies Alliance Remuneration Guidance, the Investment Association’s principles of Remuneration and the Large and Medium-sized Companies and Groups (Accounts and Reports) (Amendment) Regulations 2013, notwithstanding that, as the Company is listed on AIM, these regulations do not all strictly apply. This report is split into two sections; • the directors’ remuneration policy sets out the Company’s intended policy on directors’
remuneration from 1 March 2015; and • the annual report on remuneration sets out payments and awards made to the directors and
details the link between Company performance and remuneration for the year to 28 February 2015 and is subject to an advisory shareholder vote at this year’s AGM.
The information in the Directors’ Remuneration Report set out on pages 53 to 55 highlighted as being subject to audit has been audited by the Group’s auditors.
Remuneration outcomes for the year to 28 February 2015
Annual bonus opportunities are based both on the achievement of adjusted profit before tax targets including adjustments to reflect the contribution from operating units acquired or disposed of during the year, and the Group’s relative position in customer satisfaction indices. Bonuses of 105% of basic salary have been awarded to the executive directors in respect of profit related bonus for the year ended 28 February 2015, which reflects the financial results of the Group for the year relative to expectations at the beginning of the financial year.
The long-term incentives awards made to Executive Directors under the Long Term Incentive Plan (“LTIP”) during the year ending 28 February 2015, detailed later in this report, may vest in May 2017. These awards took the form of £Nil value share options where the vesting is subject to targets based on the achievement of absolute growth in the Company’s total shareholder return (‘TSR’), and relative growth in TSR against FTSE small cap index (excluding investment trusts).
Key remuneration decisions for the year to 29 February 2016
The Committee considered current trends in the market in which the Company is operating and in particular, the high level of salary control being imposed by Senior Management on the rest of the Group. The Executive Directors proposed and the Remuneration Committee agreed that the Directors receive no increase in basic salary with effect from 1 March 2015.
Furthermore, the annual bonus structure agreed for the year commencing 1 March 2015, is identical to that adopted for the previous year save that the profit targets for bonus earnings have been increased to reflect anticipated trading results for the coming year.
In developing the remuneration policy for Executive Directors for the year to 29 February 2016, the Committee considered the form and level of awards to be made under the LTIP. In summary, the Committee decided that these awards will again be £Nil cost share options under the LTIP subject to absolute and relative growth in TSR over the next three years. The awards for the forthcoming year have yet to be finalised.
45 Vertu Motors plc

Remuneration Committee Report (continued) ANNUAL STATEMENT FROM THE CHAIRMAN OF THE REMUNERATION COMMITTEE (CONTINUED)
Conclusion
The directors’ remuneration policy which follows this annual statement sets out the Committee’s principles on remuneration for the future and the annual report on remuneration provides details of remuneration for the year ended 28 February 2015. The Committee will continue to be mindful of shareholder views and interests, and we believe that our directors’ remuneration policy continues to be aligned with the achievement of the Company’s business objectives. Material changes to remuneration policy will only be made after consultation with major shareholders. We hope that we can rely on your votes in favour of the annual report on remuneration. By Order of the Board: David M. Forbes Chairman of Remuneration Committee 13 May 2015
46 Vertu Motors plc

Remuneration Committee Report (continued) REMUNERATION POLICY The policy of the Committee is to ensure that the Executive Directors are fairly rewarded for their individual contributions to the Group’s overall performance and to provide a competitive remuneration package to Executive Directors, including long-term incentive plans, to attract, retain and motivate individuals of the calibre required to ensure that the Group is managed successfully in the interests of shareholders. In addition, the Committee’s policy is that a substantial proportion of the remuneration of the Executive Directors should be performance related consistent with the balance of remuneration paid to Directors and Senior Management in the automotive retail sector.
Future Policy Table
The main elements of the remuneration package of Executive Directors are set out below : Purpose and link to strategy
Operation Maximum potential value Performance metrics
BASIC SALARY Attract and retain high calibre Executive Directors to deliver strategy
Paid in 12 equal monthly instalments during the year.
Reviewed annually to reflect role, responsibility and performance of the individual and the Group, and to take into account rates of pay for comparable roles in similar companies. When selecting comparators, the Committee has regard to, inter alia, the Group’s revenue, profitability, market worth and business sector. There is no prescribed maximum increase. Annual rates are set out in the annual report on remuneration for the current year and the following year.
None
BENEFITS Provide benefits consistent with role
Currently these consist of the option of a company car, or access to an employee car ownership scheme, health insurance, life assurance premiums and the opportunity to join the Company’s savings related share option scheme (“SAYE”). The Committee reviews the level of benefit provision from time to time and has the flexibility to add or remove benefits to reflect changes in market practices or the operational needs of the Group.
The cost of providing benefits is borne by the Company and varies from time to time.
None
47 Vertu Motors plc
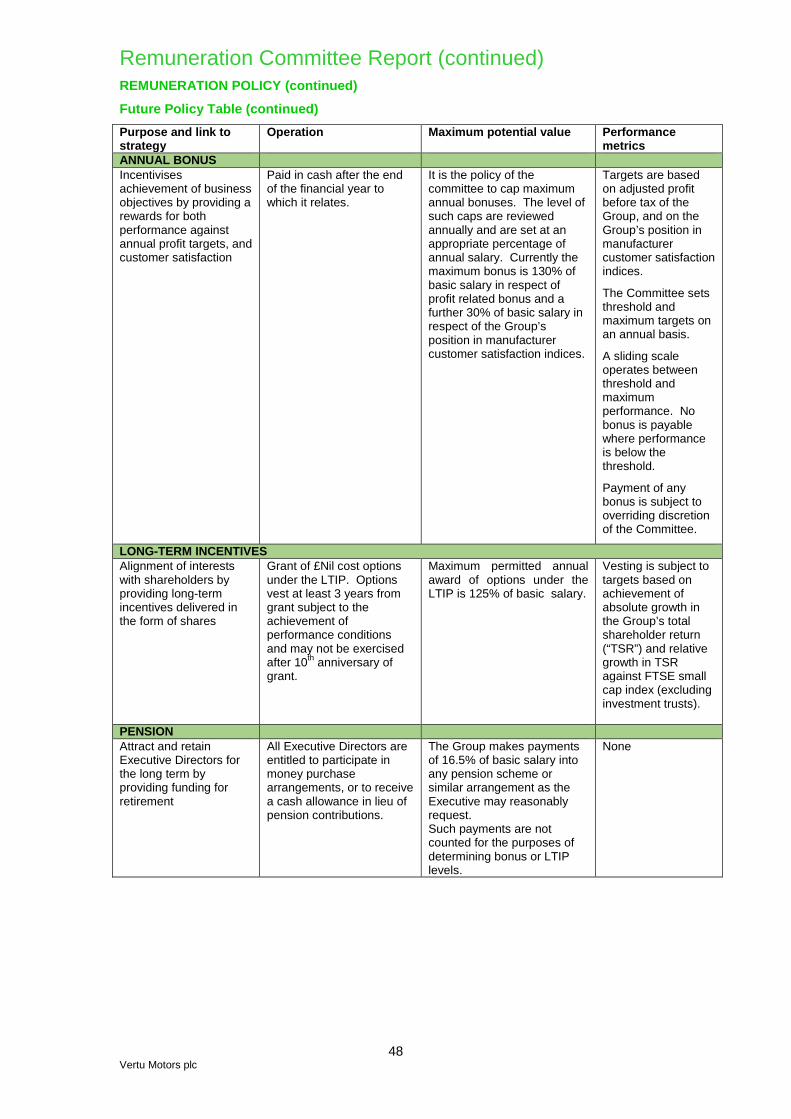
Remuneration Committee Report (continued) REMUNERATION POLICY (continued)
Future Policy Table (continued) Purpose and link to strategy
Operation Maximum potential value Performance metrics
ANNUAL BONUS Incentivises achievement of business objectives by providing a rewards for both performance against annual profit targets, and customer satisfaction
Paid in cash after the end of the financial year to which it relates.
It is the policy of the committee to cap maximum annual bonuses. The level of such caps are reviewed annually and are set at an appropriate percentage of annual salary. Currently the maximum bonus is 130% of basic salary in respect of profit related bonus and a further 30% of basic salary in respect of the Group’s position in manufacturer customer satisfaction indices.
Targets are based on adjusted profit before tax of the Group, and on the Group’s position in manufacturer customer satisfaction indices.
The Committee sets threshold and maximum targets on an annual basis.
A sliding scale operates between threshold and maximum performance. No bonus is payable where performance is below the threshold.
Payment of any bonus is subject to overriding discretion of the Committee.
LONG-TERM INCENTIVES Alignment of interests with shareholders by providing long-term incentives delivered in the form of shares
Grant of £Nil cost options under the LTIP. Options vest at least 3 years from grant subject to the achievement of performance conditions and may not be exercised after 10th anniversary of grant.
Maximum permitted annual award of options under the LTIP is 125% of basic salary.
Vesting is subject to targets based on achievement of absolute growth in the Group’s total shareholder return (“TSR”) and relative growth in TSR against FTSE small cap index (excluding investment trusts).
PENSION Attract and retain Executive Directors for the long term by providing funding for retirement
All Executive Directors are entitled to participate in money purchase arrangements, or to receive a cash allowance in lieu of pension contributions.
The Group makes payments of 16.5% of basic salary into any pension scheme or similar arrangement as the Executive may reasonably request. Such payments are not counted for the purposes of determining bonus or LTIP levels.
None
48 Vertu Motors plc

Remuneration Committee Report (continued) Notes to the Policy Table
Performance conditions
The Committee selected the performance conditions as they are central to the Group’s strategy and are the key metrics used by the Executive Directors to oversee the operations of the business. The performance targets for the annual bonus are determined annually by the Committee, with maximum bonus typically requiring a substantial out performance of the Company’s financial target. The initial performance target for the annual bonus is based on adjusted profit before tax. This target takes account of both the Group’s budget for the year and of market expectations after taking account of the pre-close update issued at the end of the previous year. For the year ending 29 February 2016 the initial performance target is £23.5m and is adjusted during the year to reflect the impact of acquisitions and disposals. The performance target for the LTIP is based on both absolute growth in the Company’s total shareholder return (‘TSR’) and relative growth in the TSR against the FTSE small cap index (excluding investment trusts).
Differences from remuneration policy for all employees
All employees of the Company are entitled to base salary and many other colleague benefits. The opportunity to earn a bonus is made available to all management colleagues in the Group. The maximum opportunity available is based on the seniority and responsibility of the role. Share options are only granted under the LTIP to selected Senior Executives and Executive Directors.
Statement of consideration of employment conditions of employees elsewhere in the Group
The Committee receives reports on an annual basis on the level of any pay rises awarded across the Group and takes these into account when determining salary increases for Executive Directors. In addition, the Committee receives regular reports on the structure of remuneration for Senior Management in the tier below the Executive Directors and uses this information to ensure a consistency of approach for the most senior Managers in the Group. The Committee also approves the award of any long-term incentives. The Committee does not specifically invite colleagues to comment on the Directors’ remuneration policy, but it does take note of any comments made by colleagues.
Statement of consideration of shareholder views
The Chairman of the Committee consults with major shareholders from time to time or where any significant remuneration changes are proposed, in order to understand their expectations with regard to Executive Directors remuneration and reports back to the Committee. The last time the Committee consulted with certain major shareholders was in relation to the introduction of the LTIP in July 2013. Any other concerns raised by individual shareholders are also considered, and the Committee also takes into account emerging best practice and guidance from major institutional shareholders. Overall, no significant concerns were raised by the Group’s main shareholders in relation to remuneration over the last twelve months.
49 Vertu Motors plc

Remuneration Committee Report (continued) Approach to recruitment remuneration The Committee’s approach to recruitment remuneration is to offer a market competitive remuneration package sufficient to attract high calibre candidates who are appropriate to the role but without paying any more than is necessary. Any new Executive Director’s regular remuneration package would include the same elements and be in line with the policy table set out earlier in this directors’ remuneration policy, including the same limits on performance related remuneration. Where an internal candidate is promoted to the Board the original grant terms and conditions of any bonus or share award made before that promotion will continue to apply, as will membership of any of the Group’s pension arrangements. Reasonable relocation and other similar expenses may be paid if appropriate.
Directors’ service contracts, notice periods and termination payments
Provision Policy Details
Notice periods in Executive Directors’ service contracts
12 months by Company or Executive Director Executive Directors may be required to work during the notice period.
Compensation for loss of office
No more than 12 months’ basic salary and benefits (including company pension contributions).
Treatment of annual bonus on termination
Bonuses which have already been declared are payable in full. In the event of termination by the Company (except for cause) pro-rated bonus to the end of the notice period is payable at the discretion of the Remuneration Committee.
Treatment of unvested LTIP awards
Good leavers may exercise their options within 12 months of cessation. Options of other leavers including those dismissed for fraud, dishonesty or misconduct will lapse.
Good leavers circumstances comprise death, illness, injury, disability, retirement or transfer of employing business outside Group. Performance conditions may be waived for good leavers, at the discretion of the Remuneration Committee, but the number of options that can be exercised is reduced pro-rata to reflect the proportion of the vesting period completed before cessation.
Exercise of discretion
Intended only to be relied upon to provide flexibility in exceptional or inequitable circumstances.
The Committee’s determination will take into account the particular circumstances of the Executive Director’s departure and the recent performance of the company and will be detailed in the next published Remuneration Committee Report.
Outside appointments
Subject to approval Board approval must be sought.
Non-Executive Directors
Re-election All Non-Executives are subject to re-election every three years. No compensation payable if required to stand down.
50 Vertu Motors plc

Remuneration Committee Report (continued) Directors’ service contracts, notice periods and termination payments (continued)
In the event of the negotiation of a compromise or settlement agreement between the Company and a departing Director, the Committee may make payments it considers reasonable in settlement of potential legal claims. Such payments may also include reasonable reimbursement of professional fees in connection with such agreements. The Committee may also include the reimbursement of fees for professional or outplacement advice in the termination package, if it considers it reasonable to do so. It may also allow the continuation of benefits for a limited period.
Date of service contracts/letters of appointment
DIRECTOR
Date of service contract/ letter of appointment
P. Jones 1 January 2015 R. T. Forrester 20 December 2006 M. Sherwin 4 January 2010 N. Stead 8 December 2011 W. M. Teasdale 17 November 2006 D. M. Forbes 10 August 2009 Copies of Directors’ service contracts and letters of appointment are available for inspection at the Company’s registered office. Total 2015/16 remuneration opportunity The chart below illustrates the remuneration that would be paid to each of the Executive Directors under three different performance scenarios: (i) Minimum; (ii) On-target; and (iii) Maximum. The elements of remuneration have been categorised into three components: (i) Fixed; (ii) Annual variable (annual bonus awards); and (iii) Multiple year (LTIP awards) which are set out in the future policy table above. There is no element for multiple year (LTIP Awards) in this table this year as no options (under the LTIP or otherwise) are capable of vesting in the financial year to 29 February 2016, as the earliest vesting date for such outstanding options is 20 August 2016. R.T. Forrester
51 Vertu Motors plc

Remuneration Committee Report (continued) Total 2015/16 remuneration opportunity (continued) M. Sherwin
Each element of remuneration is defined in the table below: Element
Description
Fixed Base salary for the 2015/16 financial year plus pension and benefits Annual Bonus Annual bonus awards based on both adjusted profit before tax and
the Group’s relative position in manufacturer customer satisfaction indices.
The on-target scenario assumes that for the annual bonus, adjusted profit is in line with financial targets and 65% of the Group’s sales and service outlets achieve above national average scores measured by manufacturer customer satisfaction indices for sales and service.
Non-Executive Directors’ fee policy
The policy for the remuneration of the Non-Executive Directors is as set out below. Non-Executive Directors are not entitled to a bonus, they cannot participate in the Company’s share option scheme and they are not eligible for pension arrangements.
Purpose and link to strategy Operation Maximum potential value Performance metrics
NON-EXECUTIVE DIRECTOR FEES (‘NED’) To attract NEDs who have a broad range of experience and skills to oversee the implementation of our strategy
NED fees are determined by the Board within the limits set out in the Articles of Association Paid in 12 equal monthly instalments during the year.
Annual rate set out in the annual report on remuneration for the current year and the following year. No prescribed maximum annual increase.
None
52 Vertu Motors plc

Directors’ Remuneration Report Information subject to audit
Single total figure of remuneration
The remuneration of the Directors who served during the period from 1 March 2014 to 28 February 2015 is as follows: Basic
Salary
Fees
Benefits Annual
Bonuses
Total £’000 £’000 £’000 £’000 £’000 Executive Directors R T Forrester 250 - 2 267 519 M Sherwin 190 - 2 203 395 Total 440 - 4 470 914 Non-Executive Directors P Jones - 18 - - 18 P. R. Williams - 58 - - 58 D M Forbes - 35 - - 35 W M Teasdale - 50 - - 50 N Stead - 35 - - 35 Total - 196 - - 196 Aggregate directors emoluments 440 196 4 470 1,110
The remuneration of the Directors who served during the year from 1 March 2013 to 28 February 2014 is as follows:
Basic
Salary
Fees
Benefits Annual
Bonuses
Total £’000 £’000 £’000 £’000 £’000 Executive Directors R T Forrester 240 - 7 312 559 M Sherwin 180 - 26 234 440 Total 420 - 33 546 999 Non-Executive Directors P R Williams - 70 - - 70 D M Forbes - 35 - - 35 W M Teasdale - 50 - - 50 N Stead - 35 - - 35 Total - 190 - - 190 Aggregate directors emoluments 420 190 33 546 1,189 The benefits above include items such as company cars, relocation allowance, vehicle insurance cover, medical and life assurance premiums.
53 Vertu Motors plc

Directors’ Remuneration Report (continued) Annual bonus
Bonuses are earned by reference to the financial year and paid following the end of the financial year. The target adjusted profit before tax (adjusted, inter alia, to reflect the contribution from operating units acquired or disposed of during the financial year) was £19.3m. The bonuses accruing to the Executive Directors in respect of the year ended 28 February 2015 are shown below: Threshold
performance required
Maximum performance
required Actual
performance Bonus as a % of salary
R Forrester M Sherwin Max Actual Max Actual Adjusted profit before tax (£’000) 17,100 24,000 22,048 130% 105% 130% 105% Bonus receivable 40% 130% 105% £262,500 £199,500 (% of basic salary)
In addition to the profit related bonus shown above, a maximum 30% of basic salary was available as a bonus if the Group achieved stretching targets in respect of customer satisfaction. To earn maximum bonus, 85% of Group sales and service departments had to achieve above national average customer satisfaction (CSI), as measured by our manufacturer partners. R Forrester received £4,167 and M Sherwin received £3,167 in respect of such bonus out of potential maximum CSI bonus for the financial year of £75,000 and £57,000 respectively.
Directors' Pension Entitlements
The Company has paid £41,250 (2014: £39,600) in contributions to the defined contribution Bristol Street Pension Scheme during this financial year in respect of R T Forrester and £31,350 (2014: £29,700) in respect of M Sherwin.
Directors' Share Options
The movement in share options held by the directors during the year ended 28 February 2014 is as follows:
Number at 1 March
2014 Lapsed in Year Granted in Year Number at 28
February 2015 R T Forrester 285,204 - 508,475 793,679 M Sherwin 213,904 - 381,356 595,260
Details of share options granted during the year are as follows:
Scheme Date of Grant
Earliest Exercise Date
Expiry Date
Exercise price (pence)
Market value on
date of grant
(pence)
Number of options granted
R T Forrester
LTIP 16 May 2014
16 May 2017
16 May 2024
Nil 59.0 508,475
M Sherwin LTIP 16 May 2014
16 May 2017
16 May 2024
Nil 59.0 381,356
Vesting of LTIP Options granted during the financial year ended 28 February 2015 is dependent upon the total shareholder return (“TSR”) achieved by the Company over a three year period commencing on 1 March 2014.
54 Vertu Motors plc

Directors’ Remuneration Report (continued) Directors' Share Options (continued)
Vesting of one half of the LTIP options is dependent on absolute growth in the Company's TSR, and the other half dependent on the Company's TSR performance as compared to the TSR achieved by the FTSE small cap index (excluding investment trusts). All TSR calculations will be based on the average of opening and closing share prices over a 10 Business Day period prior to the commencement and end of the performance period.
The absolute TSR growth target for the options granted in the year ended 28 February 2015 require the Company's TSR over the three year performance period to have grown by more than 25%. For TSR growth between 25% and 100% over the three year period, the half of the options subject to the absolute TSR growth target will vest on a straight-line basis, from nil vesting at 25% or less growth to 100% vesting at 100%.
The relative TSR performance condition, applying to the other half of the LTIP options granted to date, will be as follows:
Ranking of Company TSR* Proportion of award vesting
Below median 0%
Above 90th percentile 100%
Between median and 90th percentile Straight line vesting 0 – 100%
*Based on FTSE small cap index (excluding investment trusts)
55 Vertu Motors plc

Directors’ Remuneration Report (continued) Information not subject to audit
Statement of directors’ shareholding
The Directors who held office at 28 February 2015 and their connected persons had interests in the issued share capital of the Company as at 28 February 2015 as follows:
Number of shares held (including by
connected persons) Unvested share options subject to
performance conditions2 28 February 28 February 28 February 28 February 2015 2014 2015 2014 R T Forrester 6,612,754 6,545,204 793,679 285,204 M Sherwin 348,687 327,988 595,260 213,904 P Jones 1,000,000 - - - D M Forbes 352,600 352,600 - - W M Teasdale 616,450 616,450 - - N Stead 56,500 56,500 - -
2 The Directors hold no vested but unexercised share options.
Performance graph
The chart below shows the Company’s five-year annual Total Shareholder Return (“TSR”) performance against the FTSE small cap index (excluding investment trusts), which is considered to be an appropriate comparison to other public companies of a similar size.
0
50
100
150
200
250
300
350
400
450
500
Vertu Motors FTSE Small cap excl. investment trusts
The middle market price of the shares as at 28 February 2015 was 58.9p (28 February 2014: 64.0p) and the range during the financial year was 51.8p to 65.0p (2014: 38.4p to 66.1p).
56 Vertu Motors plc

Directors’ Remuneration Report (continued) Change in remuneration of Chief Executive
The following table sets out the change in the Chief Executive’s salary, benefits and bonus between the years ended 28 February 2014 and 2015 compared with the average percentage change in each of those components for the employees of the Group.
Increase in Base
Salary Change in benefits Change in bonus CEO 4.2% (71.4%) (14.4%) Employees 3.6% - 3.1%
Relative importance of spend on pay
The table below sets out the total spend on pay in the years ended 28 February 2014 and 2015 compared with other disbursements from profit (i.e. the distributions to shareholders).
Spend in the year ended 28
February 2015 £’000
Spend in the year ended 28
February 2014 £’000 % change
Spend on remuneration (including directors) 129,601 110,470 17.3% Profit distributed by way of dividend 2,895 2,526 14.6%
Implementation of remuneration policy for the year ending 29 February 2016
The annual salaries and fees to be paid to directors in the year ending 29 February 2016 are set out in the table below, together with any increase expressed as a percentage.
Annual Salary/fees 29 February 28 February 2016
£’000 2015
£’000 Increase
% R T Forrester 250 250 - M Sherwin 190 190 - P Jones 70 70 - D M Forbes 35 35 - W M Teasdale 50 50 - N Stead 35 35 -
The basis for determining annual bonus payments for the year to 29 February 2016 is set out in the future policy table in the Remuneration Committee Report (page 48).
The Committee intends to grant options under the LTIP in 2015/16. These options will be £Nil cost options over a value of shares subject to a maximum of 125% of salary where the vesting is subject to targets based on the achievement of absolute growth in the Company’s total shareholder return (“TSR”) and relative growth in TSR against FTSE small cap index (excluding investment trusts), measured over a three year period from 1 March 2015.
Consideration by the directors of matters relating to directors’ remuneration
The Committee
The Committee is responsible for reviewing and recommending the framework and policy for remuneration of the Executive Directors. The Committee’s terms of reference are available from the Company Secretary. The members of the Committee during the financial year were D M Forbes (Chairman), W M Teasdale, P Jones and N Stead. It has been announced that at the forthcoming Annual General Meeting, D M Forbes will stand down as a Non-Executive Director of the Company and also as Chairman of the Remuneration Committee. Nigel Stead, will be appointed to Chairman of the Remuneration Committee at the forthcoming Annual General Meeting.
57 Vertu Motors plc

Independent Auditors’ Report to the members of Vertu Motors plc Report on the group financial statements
Our opinion
In our opinion, Vertu Motors plc’s group financial statements (“the Financial Statements”):
• give a true and fair view of the state of the group’s affairs as at 28 February 2015 and of its profit and cash flows for the year then ended;
• have been properly prepared in accordance with International Financial Reporting Standards (IFRSs) as adopted by the European Union; and
• have been prepared in accordance with the requirements of the Companies Act 2006.
What we have audited
Vertu Motor plc’s Financial Statements comprise:
• the Consolidated Balance Sheet as at 28 February 2015;
• the Consolidated Income Statement and Consolidated Statement of Comprehensive Income for the year then ended;
• the Consolidated Cash Flow Statement for the year then ended;
• the Consolidated Statement of Changes in Equity for the year then ended; and
• the notes to the Financial Statements, which include a summary of significant accounting policies and other explanatory information.
Certain required disclosures have been presented elsewhere in the Annual Report and Financial Statements, rather than in the notes to the Financial Statements. These are cross referenced from the Financial Statements and are identified as audited.
The financial reporting framework that has been applied in the preparation of the Financial Statements is applicable law and IFRSs as adopted by the European Union.
In applying the financial reporting framework, the directors have made a number of subjective judgements, for example in respect of significant accounting estimates. In making such estimates, they have made assumptions and considered future events.
Opinion on other matter prescribed by the Companies Act 2006
In our opinion, the information given in the Strategic Report and the Directors’ Report for the financial year for which the Financial Statements are prepared is consistent with the Financial Statements.
Other matters on which we are required to report by exception
Adequacy of information and explanations received
Under the Companies Act 2006 we are required to report to you if, in our opinion, we have not received all the information and explanations we require for our audit. We have no exceptions to report arising from this responsibility.
Directors’ remuneration
Under the Companies Act 2006 we are required to report to you if, in our opinion, certain disclosures of directors’ remuneration specified by law are not made. We have no exceptions to report arising from this responsibility.
58 Vertu Motors plc

Independent Auditors’ Report to the members of Vertu Motors plc (continued) Responsibilities for the financial statements and the audit
Our responsibilities and those of the directors
As explained more fully in the Statement of the Directors’ Responsibilities set out on pages 33 and 34, the directors are responsible for the preparation of the Financial Statements and for being satisfied that they give a true and fair view.
Our responsibility is to audit and express an opinion on the Financial Statements in accordance with applicable law and International Standards on Auditing (UK and Ireland) (“ISAs (UK & Ireland)”). Those standards require us to comply with the Auditing Practices Board’s Ethical Standards for Auditors.
This report, including the opinions, has been prepared for and only for the company’s members as a body in accordance with Chapter 3 of Part 16 of the Companies Act 2006 and for no other purpose. We do not, in giving these opinions, accept or assume responsibility for any other purpose or to any other person to whom this report is shown or into whose hands it may come save where expressly agreed by our prior consent in writing.
What an audit of financial statements involves
We conducted our audit in accordance with ISAs (UK & Ireland). An audit involves obtaining evidence about the amounts and disclosures in the financial statements sufficient to give reasonable assurance that the financial statements are free from material misstatement, whether caused by fraud or error.
This includes an assessment of:
• whether the accounting policies are appropriate to the group’s circumstances and have been consistently applied and adequately disclosed;
• the reasonableness of significant accounting estimates made by the directors; and
• the overall presentation of the financial statements.
We primarily focus our work in these areas by assessing the directors’ judgements against available evidence, forming our own judgements, and evaluating the disclosures in the financial statements.
We test and examine information, using sampling and other auditing techniques, to the extent we consider necessary to provide a reasonable basis for us to draw conclusions. We obtain audit evidence through testing the effectiveness of controls, substantive procedures or a combination of both.
In addition, we read all the financial and non-financial information in the Annual Report and Financial Statements to identify material inconsistencies with the audited Financial Statements and to identify any information that is apparently materially incorrect based on, or materially inconsistent with, the knowledge acquired by us in the course of performing the audit. If we became aware of any apparent material misstatements or inconsistencies we consider the implications for our report.
Other matter
We have reported separately on the parent company financial statements of Vertu Motors plc for the year ended 28 February 2015.
Randal Casson (Senior Statutory Auditor)
for and on behalf of PricewaterhouseCoopers LLP
Chartered Accountants and Statutory Auditors
Leeds
13 May 2015 59
Vertu Motors plc

Consolidated Income Statement For the year ended 28 February 2015
2015 2014 Note £’000 £’000 Revenue Continuing operations 2,006,849 1,684,532 Acquisitions 68,063 - 2,074,912 1,684,532 Cost of sales Continuing operations (1,785,542) (1,492,335) Acquisitions (61,301) - (1,846,843) (1,492,335) Gross profit Continuing operations 221,307 192,197 Acquisitions 6,762 - 228,069 192,197 Operating expenses Continuing operations (197,912) (174,293) Acquisitions (7,422) - 6 (205,334) (174,293)
Operating profit before amortisation, share based payments charge and exceptional charges
Continuing operations 23,395 17,904 Acquisitions (660) - 22,735 17,904
Amortisation of intangible assets (405) (293) Share based payments charge (645) (195) Exceptional charges 8 - (1,180) Operating profit 21,685 16,236 Finance income 11 353 331 Finance costs 11 (1,040) (725)
Profit before tax, amortisation, share based payments charge and exceptional charges
22,048 17,510
Amortisation of intangible assets (405) (293) Share based payments charge (645) (195) Exceptional charges 8 - (1,180)
Profit before tax 20,998 15,842 Taxation 12 (4,459) (3,414) Profit for the year attributable to equity holders 16,539 12,428 Basic earnings per share (p) 13 4.87 4.15 Diluted earnings per share (p) 13 4.78 4.11 Basic adjusted earnings per share (p) 13 5.15 4.69
60 Vertu Motors plc

Consolidated Statement of Comprehensive Income For the year ended 28 February 2015 2015 2014 Note £’000 £’000 Profit for the year 16,539 12,428 Other comprehensive (expense) income Items that will not be reclassified to profit or loss:
Actuarial losses on retirement benefit obligations 29 (461) (1,558) Deferred tax relating to actuarial losses on retirement benefit obligations 29 97 450
Items that may be reclassified subsequently to profit or loss:
Cash flow hedges 31 49 102 Deferred tax relating to cash flow hedges 31 (10) (25)
Other comprehensive expense for the year, net of tax (325) (1,031) Total comprehensive income for the year attributable to equity holders 16,214 11,397
61 Vertu Motors plc
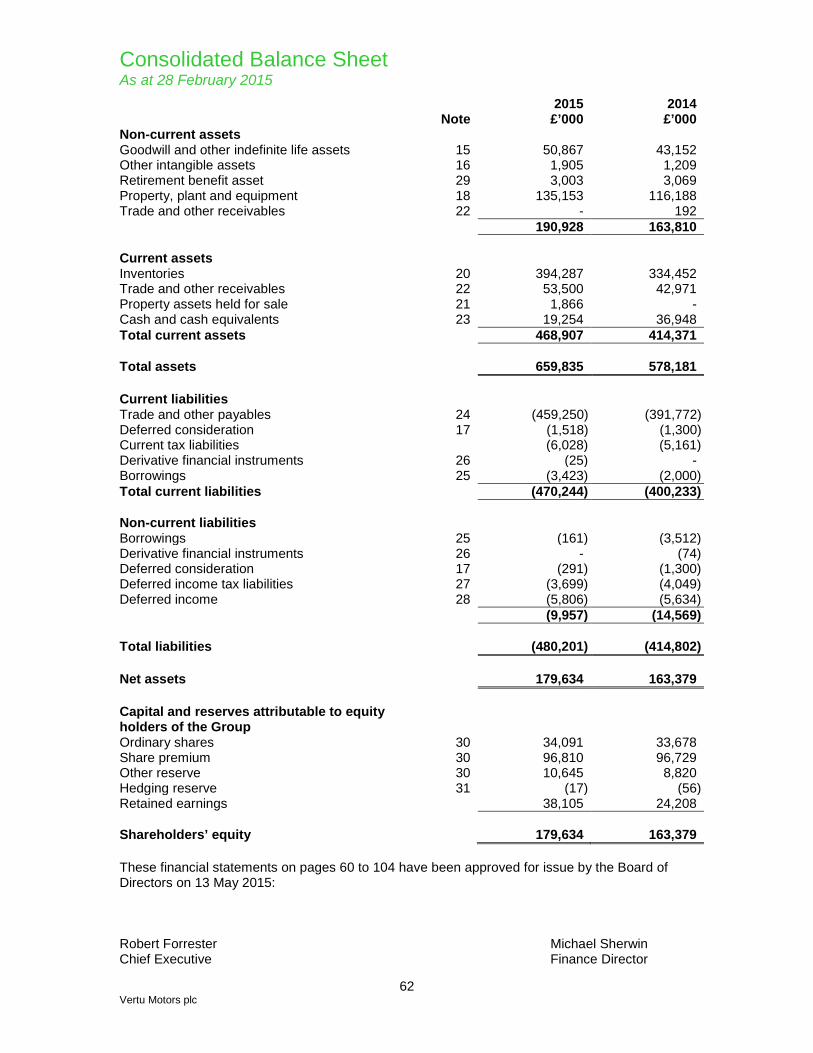
Consolidated Balance Sheet As at 28 February 2015 2015 2014 Note £’000 £’000 Non-current assets Goodwill and other indefinite life assets 15 50,867 43,152 Other intangible assets 16 1,905 1,209 Retirement benefit asset 29 3,003 3,069 Property, plant and equipment 18 135,153 116,188 Trade and other receivables 22 - 192 190,928 163,810 Current assets Inventories 20 394,287 334,452 Trade and other receivables 22 53,500 42,971 Property assets held for sale 21 1,866 - Cash and cash equivalents 23 19,254 36,948 Total current assets 468,907 414,371 Total assets 659,835 578,181 Current liabilities Trade and other payables 24 (459,250) (391,772) Deferred consideration 17 (1,518) (1,300) Current tax liabilities (6,028) (5,161) Derivative financial instruments 26 (25) - Borrowings 25 (3,423) (2,000) Total current liabilities (470,244) (400,233) Non-current liabilities Borrowings 25 (161) (3,512) Derivative financial instruments 26 - (74) Deferred consideration 17 (291) (1,300) Deferred income tax liabilities 27 (3,699) (4,049) Deferred income 28 (5,806) (5,634) (9,957) (14,569) Total liabilities (480,201) (414,802) Net assets 179,634 163,379 Capital and reserves attributable to equity holders of the Group
Ordinary shares 30 34,091 33,678 Share premium 30 96,810 96,729 Other reserve 30 10,645 8,820 Hedging reserve 31 (17) (56) Retained earnings 38,105 24,208 Shareholders’ equity 179,634 163,379 These financial statements on pages 60 to 104 have been approved for issue by the Board of Directors on 13 May 2015: Robert Forrester Michael Sherwin Chief Executive Finance Director
62 Vertu Motors plc

Consolidated Cash Flow Statement For the year ended 28 February 2015 2015 2014 Note £’000 £’000 Cash flows from operating activities Operating profit 21,685 16,236 Loss on sale of property, plant and equipment 6 186 40 Amortisation of other intangible assets 16 405 293 Depreciation of property, plant and equipment 18 5,915 5,670 Impairment of freehold property 18 - 1,180 Impairment of preference shares receivable 22 192 - Movement in working capital 33 (2,887) 23,778 Share based payments charge 617 195 Cash generated from operations 26,113 47,392 Tax received 182 35 Tax paid (4,653) (2,385) Finance income received 219 137 Finance costs paid (933) (658) Net cash generated from operating activities 20,928 44,521 Cash flows from investing activities Acquisition of businesses, net of cash, overdrafts and borrowings acquired 17 (17,437) (39,438) Acquisition of freehold and long leasehold land and buildings
(8,929) (4,509)
Purchases of intangible assets (347) (443) Purchases of property, plant and equipment (9,849) (9,577) Proceeds from disposal of business (net of cash, overdrafts and borrowings) 17
752
1,926
Proceeds from disposal of property, plant and equipment 1,964 82 Net cash outflow from investing activities (33,846) (51,959) Cash flows from financing activities Net proceeds from issuance of ordinary shares 119 47,672 Repayment of borrowings 32 (2,000) (8,000) Dividends paid to equity holders (2,895) (2,526) Net cash (outflow) inflow from financing activities (4,776) 37,146 Net (decrease) increase in cash and cash equivalents 32
(17,694)
29,708
Cash and cash equivalents at beginning of year 36,948 7,240 Cash and cash equivalents at end of year 23 19,254 36,948
63 Vertu Motors plc
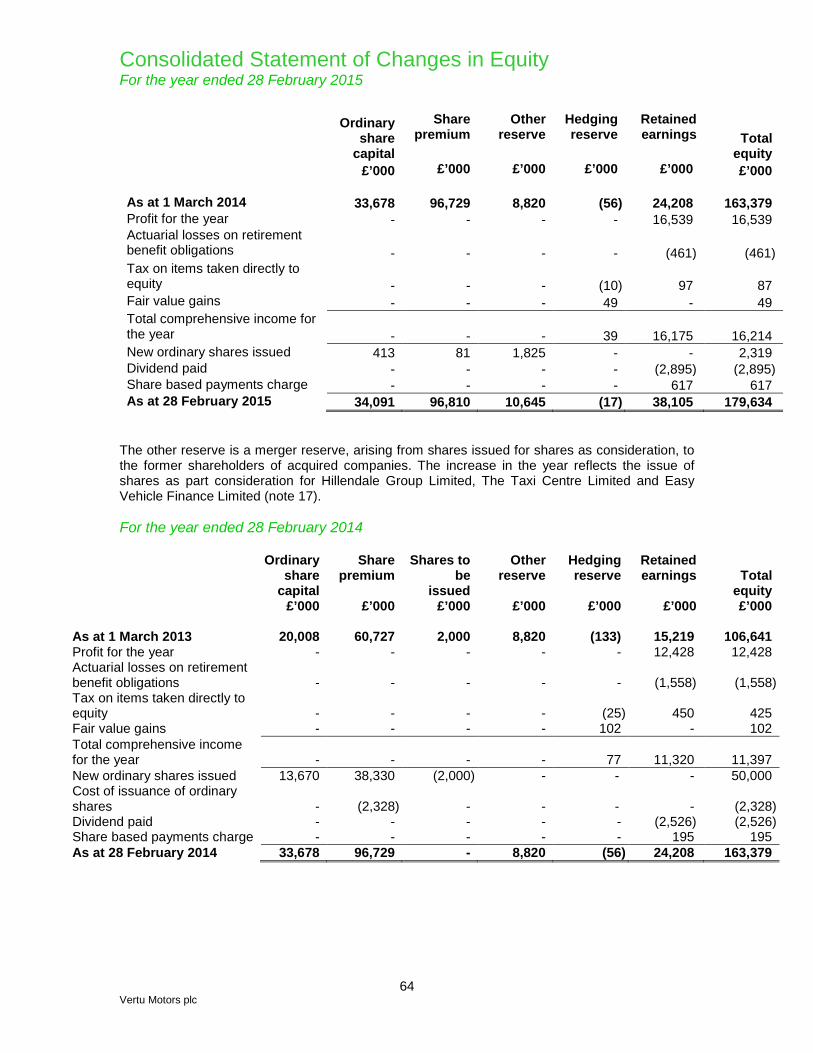
Consolidated Statement of Changes in Equity For the year ended 28 February 2015 Ordinary
share capital
Share premium
Other reserve
Hedging reserve
Retained earnings Total
equity £’000 £’000 £’000 £’000 £’000 £’000 As at 1 March 2014 33,678 96,729 8,820 (56) 24,208 163,379 Profit for the year - - - - 16,539 16,539 Actuarial losses on retirement benefit obligations - - - - (461) (461) Tax on items taken directly to equity - - - (10) 97 87 Fair value gains - - - 49 - 49 Total comprehensive income for the year - - - 39 16,175 16,214 New ordinary shares issued 413 81 1,825 - - 2,319 Dividend paid - - - - (2,895) (2,895) Share based payments charge - - - - 617 617 As at 28 February 2015 34,091 96,810 10,645 (17) 38,105 179,634
The other reserve is a merger reserve, arising from shares issued for shares as consideration, to the former shareholders of acquired companies. The increase in the year reflects the issue of shares as part consideration for Hillendale Group Limited, The Taxi Centre Limited and Easy Vehicle Finance Limited (note 17). For the year ended 28 February 2014
Ordinary share
capital
Share premium
Shares to be
issued
Other reserve
Hedging reserve
Retained earnings Total
equity £’000 £’000 £’000 £’000 £’000 £’000 £’000 As at 1 March 2013 20,008 60,727 2,000 8,820 (133) 15,219 106,641 Profit for the year - - - - - 12,428 12,428 Actuarial losses on retirement benefit obligations - - - - - (1,558) (1,558) Tax on items taken directly to equity - - - - (25) 450 425 Fair value gains - - - - 102 - 102 Total comprehensive income for the year - - - - 77 11,320 11,397 New ordinary shares issued 13,670 38,330 (2,000) - - - 50,000 Cost of issuance of ordinary shares - (2,328) - - - - (2,328) Dividend paid - - - - - (2,526) (2,526) Share based payments charge - - - - - 195 195 As at 28 February 2014 33,678 96,729 - 8,820 (56) 24,208 163,379
64 Vertu Motors plc

Notes to the Consolidated Financial Statements 1. Accounting Policies
Basis of Preparation
Vertu Motors plc is a Public Limited Company which is listed on the Alternative Investment Market (AiM) and is incorporated and domiciled in the United Kingdom. The address of the registered office is Vertu House, Kingsway North, Team Valley, Gateshead, Tyne and Wear, NE11 0JH. The registered number of the Company is 05984855.
The consolidated financial statements of Vertu Motors plc have been prepared in accordance with International Financial Reporting Standards as adopted by the European Union (IFRSs as adopted by the EU), International Financial Reporting Standards Interpretations Committee ("IFRS-IC") interpretations and the Companies Act 2006 applicable to companies reporting under IFRS.
The consolidated financial statements have been prepared on the going concern basis under the historical cost convention, as modified by the revaluation of financial assets and liabilities (including derivative financial instruments) at fair value.
The consolidated financial statements include the results of all subsidiaries wholly owned by Vertu Motors plc as listed on pages 112 and 113 of the annual report. Certain of these subsidiaries, which are listed below, have taken the exemption from an audit for the year ended 28 February 2015 by virtue of s479A of Companies Act 2006. Certain other subsidiaries, which are also listed below, have taken the exemption from preparing individual accounts for the year ended 28 February 2015 by virtue of s394A of Companies Act 2006. In order to allow these subsidiaries to take the audit exemption or exemption from the preparation of individual accounts (as appropriate), the parent company Vertu Motors plc has given a statutory guarantee of all the outstanding liabilities as at 28 February 2015 of the subsidiaries listed below, further details of which are provided in note 34.
The subsidiaries which have taken an exemption from an audit for the year ended 28 February 2015 by virtue of s479A Companies Act 2006 are:
Bristol Street Commercials (Italia) Limited Macklin Property Limited Bristol Street First Investments Limited Tyne Tees Finance Limited Bristol Street Fourth Investments Limited Grantham Motor Company Limited Brookside (1998) Limited Vertu Motors (Property) Limited Newbolds Garage (Mansfield) Limited Albert Farnell Limited Nottingham TPS LLP
The subsidiaries which have taken an exemption from the preparation of individual accounts in respect of the year ended 28 February 2015 by virtue of s394A of Companies Act 2006 are:
Blake Holdings Limited National Allparts Limited Bristol Street (No.1) Limited Peter Blake (Chatsworth) Limited Bristol Street (No.2) Limited Peter Blake (Clumber) Limited Bristol Street Fifth Investments Limited Peter Blake Limited Bristol Street Fleet Services Limited Typocar Limited Bristol Street Group Limited Vertu Fleet Limited Bristol Street Limited Vertu Motors (Finance) Limited BSH Pension Trustee Limited Vertu Motors (Retail) Limited Merifield Properties Limited Boydslaw 103 Limited Motor Nation Car Hypermarkets Limited Vertu Motors (Pity Me) Limited Dunfermline Autocentre Limited Widnes Car Centre Limited Widnes Car Centre (1994) Limited Vertu Motors (Durham) Limited Compare Click Call Limited Dobies (Carlisle) Limited K C Motability Solutions Limited Vertu Motors (AMC) Limited
65 Vertu Motors plc

Notes to the Consolidated Financial Statements (continued) 1. Accounting Policies (continued)
Basis of Preparation (continued)
The preparation of financial statements in conformity with IFRS requires the use of certain critical accounting estimates. It also requires management to exercise its judgement in the process of applying the Group’s accounting policies. The estimates and assumptions that have a significant risk of causing a material adjustment to the carrying amounts of assets and liabilities are set out in note 4.
The directors consider that the accounting policies set out below are the most appropriate and have been consistently applied.
Standards and interpretations adopted by the Group in the year ended 28 February 2015
• IFRS 10, ‘Consolidated financial statements’ – This standard builds on existing principles by identifying the concept of control as the determining factor in whether an entity should be included within the consolidated financial statements.
• IFRS 11, ‘Joint arrangements’ – This standard provides for a more realistic reflection of joint arrangements by focusing on the rights and obligations of the arrangement, rather than its legal form. Proportional consolidation of joint ventures is no longer allowed.
• IFRS 12, ‘Disclosure of interests in other entities’ – This standard includes the disclosure requirements for all forms of interests in other entities, including joint arrangements, special purpose vehicles and other off-balance-sheet vehicles.
• IAS 27 (revised 2011) ‘Separate financial statements’ – This standard includes the provision on separate financial statements that are left after the control provisions of IAS 27 have been included in the new IFRS 10.
• Amendment to IAS 36, ‘Impairment of assets’ on recoverable amount disclosures – These amendments address the disclosure of information about the recoverable amount of impaired assets if that amount is based on fair value less costs of disposal.
• IFRIC 21, ‘Levies’ – This interpretation is on IAS 37, ‘Provisions, contingent liabilities and contingent assets’. IAS 37 sets out criteria for the recognition of a liability. The interpretation clarifies that the obligating event that gives rise to a liability to pay a levy is the activity described in the relevant legislation that triggers the payment of the levy.
The adoption of the new standards and amendments above have had no significant impact on the financial statements of the Group.
New standards and interpretations issued but not yet effective and not early adopted
Amendment to IAS 19 regarding defined benefit plans
Amendment to IAS 27, ‘Separate financial statements’ on the equity method
Amendment to IAS 1, ‘Presentation of financial statements’ on the disclosure initiative
IFRS 15 ‘Revenue from contracts with customers’
The Directors anticipate that the adoption of these standards and interpretations in future periods will have no material impact on the financial statements of the Group.
66 Vertu Motors plc
Notes to the Consolidated Financial Statements (continued) 1. Accounting Policies (continued)
Measurement period adjustment
The Group assesses the fair value of assets acquired and finalises purchase price allocation within the measurement period following acquisition and in accordance with IFRS3. This includes an exercise to search for other material separately identifiable intangible assets such as brand value, supplier agreements, franchise relationships and customer relationships.
The finalisation of the purchase price allocation may result in a change in the fair value of assets acquired.
In accordance with IFRS3, measurement period adjustments are reflected in the financial statements as if the final purchase price allocation had been completed at the acquisition date.
Basis of consolidation
The consolidated financial statements comprise the financial statements of Vertu Motors plc and its subsidiary undertakings. Subsidiaries are all entities over which the Group has the power to govern the financial and operating policies, generally accompanying a shareholding of more than 50 per cent of the voting rights. Subsidiaries are consolidated from the date at which control is transferred to the Group and they are excluded from the consolidated financial statements from the date that control ceases.
Inter-company transactions, balances and unrealised gains on transactions between Group companies are eliminated. Unrealised losses are also eliminated. Accounting policies of subsidiaries have been changed where necessary to ensure consistency with the accounting policies adopted by the Group.
Business combinations and goodwill
Business combinations are accounted for using the purchase method of accounting. This involves recognising identifiable assets (including intangible assets not previously recognised by the acquiree) and liabilities (including contingent liabilities) of acquired businesses at fair value. Goodwill acquired in a business combination is initially measured at cost being the excess of the cost of the consideration over the Group’s interest in the net fair value of the acquiree’s identifiable assets, liabilities and contingent liabilities. Where the net fair value of the acquired identifiable assets, liabilities and contingent liabilities exceeds the consideration, the excess or “negative goodwill” is recognised immediately in the income statement. Following initial recognition, goodwill is measured at cost less any accumulated impairment losses. For the purpose of impairment testing, goodwill acquired in a business combination is, from the acquisition date, allocated to each of the Group’s cash generating units.
Each cash generating unit (“CGU”) or group of cash generating units to which the goodwill is allocated represents the lowest level within the Group at which the goodwill is monitored for internal management purposes. Gains and losses on the disposal of a business component are calculated on a basis which incorporates the carrying amount of goodwill relating to the business sold. Acquisition related costs are expensed to the income statement as incurred.
Other intangible assets
Intangible assets, when acquired separately from a business combination, comprise computer software and are carried at cost less accumulated amortisation and any impairment losses. Amortisation is provided on a straight-line basis to allocate the cost of the asset over its estimated useful life, which in the case of computer software is between four and six years.
Intangible assets, for example, franchise relationships acquired as part of a business combination, are capitalised separately from goodwill if the asset is separable and if the fair value can be measured reliably on initial recognition. Such assets are stated at fair value less accumulated amortisation. Amortisation is provided on a straight line basis over their expected useful lives. Intangible assets with an indefinite useful life are tested annually for impairment.
67 Vertu Motors plc

Notes to the Consolidated Financial Statements (continued) 1. Accounting Policies (continued)
Property, plant and equipment
Property, plant and equipment are stated at cost less accumulated depreciation and any impairment in value. Cost includes expenditure that is directly attributable to the acquisition of the asset. Assets’ residual values, useful lives and methods of depreciation are reviewed, and adjusted if appropriate, at each financial year end. Land is not depreciated. Depreciation is provided at rates calculated to write off the cost of property, plant and equipment less their estimated residual values, on a straight-line basis over their estimated useful lives, as follows:
Freehold buildings 2% Long leasehold buildings Lease term Short leasehold properties Lease term (under 25 years) Franchise standards property improvements 20% Vehicles and machinery 20% Furniture, fittings and equipment 20% - 50%
An asset’s carrying amount is written down immediately to its recoverable amount if the asset’s carrying amount is greater than its estimated recoverable amount. Gains and losses on disposals are determined by comparing the proceeds with the carrying amount and are recognised within ‘operating expenses’ in the consolidated income statement.
Inventories
Inventories are stated at the lower of cost and net realisable value. Cost for parts is determined using the first-in, first-out (FIFO) method. Costs incurred in bringing each product to its present location and condition are included and cost is based on price including delivery costs less specific trade discounts. Net realisable value is based on estimated selling price less further costs to be incurred to disposal. Provision is made for obsolete, slow-moving or defective items where appropriate.
The timing of recognition of new vehicle inventory as an asset of the Group is dependent on the terms of the purchase which vary by manufacturer. Some manufacturers invoice on release from their factory, although the vehicle may not be physically present at a Group location, title has passed and therefore the vehicle is recognised in inventory upon receipt of the invoice. Some manufacturers operate traditional consignment stock arrangements where unpaid vehicles may be physically present at dealerships however title is retained by the manufacturer. If the vehicle consignment is unsold after a period of time it begins to accrue interest from the manufacturer and at the point interest starts to accrue, the vehicle is recorded as an asset with a corresponding creditor, to reflect the asset and funding element of the transaction. This is in order to record the economic substance of the transaction rather than just the legal form. Other vehicle inventory is recognised upon title passing to the Group, typically on physical receipt. Trade receivables
Trade receivables are recognised initially at fair value and subsequently measured at amortised cost using the effective interest method, less provision for impairment. A provision for impairment of trade receivables is established when there is objective evidence that the Group will not be able to collect all amounts due according to the original terms of the receivables. Significant financial difficulties of the debtor, probability that the debtor will enter bankruptcy or financial reorganisation, and default or delinquency in payments (more than 30 days overdue) are considered indicators that the trade receivable is impaired. The amount of the provision is the difference between the asset’s carrying amount and the present value of estimated future cash flows, discounted at the original effective interest rate. The carrying amount of the asset is reduced through the use of an allowance account, and the amount of the loss is recognised in the consolidated income statement within operating expenses.
When a trade receivable is uncollectible, it is written off against the allowance account for trade receivables. Subsequent recoveries of amounts previously written off are credited against operating expenses in the income statement.
68 Vertu Motors plc

Notes to the Consolidated Financial Statements (continued) 1. Accounting Policies (continued)
Trade payables
Trade payables are recognised at fair value initially and subsequently measured at amortised cost using the effective interest method.
Deferred income
Deferred income relates to warranty product income. The Group sells used vehicle warranty policies which are in house products that can be taken out over 12, 24 or 36 months with income received on inception of the policy. The policy covers replacement of mechanical and electrical parts which have suffered a mechanical breakdown, the cost of labour to fit failed parts and breakdown assistance for the period of the warranty.
When the income is received it is recognised initially as deferred income and is released to the income statement on a straight-line basis over the life of each warranty policy.
Impairment of financial and non-financial assets
The Group assesses at each balance sheet date whether a financial asset or group of financial assets are impaired.
If there is objective evidence that an impairment loss on loans and receivables at amortised cost has been incurred, the amount of the loss is measured as the difference between the asset’s carrying amount and the present value of estimated future cash flows discounted at the financial asset’s original effective interest rates. The amount of the loss is recognised in the income statement.
At each reporting date, the Group assesses whether there is an indication that an asset may be impaired. If any such indication exists, or when annual impairment testing for an asset is required, the Group makes an estimate of the asset’s recoverable amount. An asset’s recoverable amount is the higher of an asset’s fair value less costs to sell and its value in use. Where fair value cannot be determined then the recoverable amount will be determined by reference to value in use. Value in use is determined for an individual asset, unless the asset does not generate cash flows that are largely independent of those from other assets or groups of assets. Where the carrying amount of an asset exceeds its recoverable amount, the asset is considered impaired and is written down to its recoverable amount.
In assessing value in use, the estimated future cash flows of separately identifiable cash generating units (“CGU’s”) are discounted to their present value using a post-tax discount rate that reflects current market assessments of the time value of money and the risks specific to the CGU. In determining fair value less costs to sell, an appropriate valuation model is used.
Impairment losses of continuing operations are recognised in the income statement in the expense category consistent with the function of the impaired asset.
For assets excluding goodwill, an assessment is made at each reporting date as to whether there is any indication that previously recognised impairment losses may no longer exist or may have decreased. If such indication exists, the Group makes an estimate of any amount recoverable. A previously recognised impairment loss is only reversed if there has been a change in the estimates used to determine the asset’s recoverable amount since the impairment loss was recognised.
69 Vertu Motors plc

Notes to the Consolidated Financial Statements (continued) 1. Accounting Policies (continued)
Taxation
Current tax
Current income tax assets and liabilities are measured at amounts expected to be paid (or recovered) using the tax rates and laws that have been enacted or substantively enacted at the balance sheet date.
Deferred tax
Deferred tax is provided using the liability method on temporary differences at the balance sheet date between the tax bases of assets and liabilities and their carrying amounts at the balance sheet date for financial reporting purposes. Deferred tax liabilities are recognised for all temporary differences, except:
a. where the deferred tax liability arises from the initial recognition of goodwill or of an asset or liability in a transaction that is not a business combination and, at the time of the transaction, affects neither the accounting profit nor taxable profit or loss; and
b. in respect of taxable temporary differences associated with investments in subsidiaries, where the timing of the reversal of the temporary difference can be controlled and it is probable that the temporary difference will not reverse in the foreseeable future.
Deferred tax assets are recognised for all temporary differences, carry forward of unused tax credits and unused tax losses, to the extent that it is probable that taxable profit will be available against which the temporary differences, and the carry forward of unused tax credits and unused tax losses can be utilised except:
a. where the deferred tax asset relating to the deductible temporary differences arises from the initial recognition of an asset or liability in a transaction that is not a business combination and, at the time of the transaction, affects neither the accounting profit nor taxable profit or loss; and
b. in respect of deductible temporary differences associated with investments in subsidiaries, deferred tax assets are only recognised to the extent that it is probable that the temporary difference will reverse in the foreseeable future and taxable profits will be available against which the temporary differences can be utilised.
Deferred tax is calculated using the enacted or substantively enacted rates that are expected to apply when the asset or liability is settled. Deferred tax is charged or credited to the income statement, except when it relates to items credited or charged direct to equity in which case the deferred tax is also credited or charged to equity.
Revenue
Revenue for the sale of goods and services is measured at the fair value of consideration receivable, net of value added tax, rebates (i.e. manufacturer bonuses) and any discounts. It excludes sales related taxes and intra Group transactions. Revenue is recognised to the extent that it is probable that the economic benefits will flow to the Group and the revenue can be reliably measured. In practice this means that revenue is recognised when vehicles or parts are invoiced and physically despatched or when a service has been undertaken. In the case of non vehicle specific related rebates from suppliers, these are recognised in the income statement upon achievement of the specific agreed supplier criteria. Revenue also comprises commissions receivable for arranging vehicle financing and related insurance products. Commissions are based on agreed rates and income is recognised at the time of approval of the vehicle finance by the finance provider. Where the Group is acting as agent on behalf of a principal, the commission earned is also recorded at an agreed rate when the transaction has occurred.
70 Vertu Motors plc

Notes to the Consolidated Financial Statements (continued) 1. Accounting Policies (continued)
Pension costs
The Group operates a trust based defined benefit pension scheme, which was closed to new entrants and future accrual in May 2003.
Typically defined benefit schemes define an amount of pension benefit that an employee will receive on retirement, usually dependent on one or more factors such as age, years of service and compensation.
The assets of the defined benefit scheme are held separately from the assets of the Group. The asset or liability recognised in the balance sheet in respect of the defined benefit pension plan is the present value of the defined benefit obligation at the balance sheet date less the fair value of plan assets. The defined benefit obligation is calculated annually by independent actuaries using the projected unit credit method. The present value of the defined benefit obligation is determined by discounting the estimated future cash outflows using interest rates of high-quality corporate bonds that are denominated in the currency in which the benefits will be paid, and that have terms to maturity approximating to the terms of the related pension liability.
Differences between the actual and expected return on assets, changes in the retirement benefit obligation due to experience and changes in actuarial assumptions are included in the statement of comprehensive income in full for the year in which they arise.
A Group personal pension arrangement under which the Group pays fixed contributions into an individual’s funds, is in place. The Group has no legal or constructive obligations to pay further contributions if the fund does not hold sufficient assets to pay employees the benefits relating to employee service in the current and prior years. Contributions into this scheme are charged to the Income Statement in the year in which they are payable.
Share based payments
The Group allows employees to acquire shares of the Company through share option schemes. The fair value of share options granted is recognised as an employee expense with a corresponding increase in equity. The Group operates a number of equity-settled, share-based compensation plans. The total amount to be expensed over the vesting year is determined by reference to the fair value of the options granted, excluding the impact of any non-market vesting conditions (for example, profitability and sales growth targets). Non-market vesting conditions are included in assumptions about the number of options that are expected to vest. At each balance sheet date, the entity revises its estimates of the number of options that are expected to vest. It recognises the impact of the revision to original estimates, if any, in the income statement, with a corresponding adjustment to equity.
The proceeds received net of any directly attributable transaction costs are credited to share capital (nominal value) and share premium when the options are exercised. Cash and cash equivalents
Cash and cash equivalents in the balance sheet comprise cash in hand, deposits held at call with banks and other short-term highly liquid investments with original maturities of three months or less.
Segmental reporting
Operating segments are reported in a manner consistent with the internal reporting provided to the Chief Operating Decision Maker (“CODM”), Robert Forrester, Chief Executive, who is responsible for allocating resources and assessing performance of the operating segment.
71 Vertu Motors plc

Notes to the Consolidated Financial Statements (continued) 1. Accounting Policies (continued)
Exceptional charges
The presentation of the Group’s results separately identifies the effect of the impairment of non-current assets, the cost of restructuring acquired businesses and the impact of one off events as exceptional items. Results excluding impairments, restructuring costs and one off items are used by management and are presented in order to provide readers with a clear and consistent presentation of the underlying operating performance of the Group’s ongoing business.
Leases
Leases in which a significant portion of the risks and rewards of ownership are retained by the lessor are classified as operating leases. Payments made under operating leases (net of any incentives received from the lessor) are charged to the income statement on a straight-line basis over the lifetime of the lease.
Share capital
Ordinary shares are classed as equity. Incremental costs directly attributable to the issue of new shares are shown in equity as a deduction, net of tax, from the proceeds.
Dividend distribution
Final dividends to the Company’s shareholders are recognised as a liability in the group’s financial statements in the period in which the dividends are approved by the Company’s shareholders. Interim dividends are recognised when they are paid.
Derivative financial instruments
The Group uses derivative financial instruments to reduce the exposure to interest rate movements. The Group does not hold or issue derivative financial instruments for speculative purposes.
Derivative financial instruments are initially recognised at fair value on the date a derivative contract is entered into and are subsequently remeasured at their fair value.
The Group documents at the inception of the transaction the relationship between hedging instruments and hedged items, as well as its risk management objectives and strategy for undertaking various hedging transactions. The Group also documents its assessment, both at hedge inception and on an ongoing basis, of whether the derivatives that are used in hedging transactions are highly effective in offsetting changes in fair values or cash flows of hedged items.
The fair values of derivative financial instruments used for hedging purposes are disclosed in note 26. Movements on the hedging reserve in shareholders’ equity are shown in note 31. The full fair value of a hedging derivative is classified as a non-current asset or liability when the remaining hedged item is more than 12 months and as a current asset or liability when the remaining maturity of the hedged item is less than 12 months. Any trading derivatives are classified as a current asset or liability.
72 Vertu Motors plc

Notes to the Consolidated Financial Statements (continued) 1. Accounting Policies (continued)
Derivative financial instruments (continued)
Cash flow hedges
The effective portion of changes in the fair value of derivatives that are designated and qualify as cash flow hedges is recognised in equity in the hedging reserve. Any gain or loss relating to the ineffective portion is recognised immediately in the income statement within finance income or costs.
Amounts accumulated in equity are recycled in the income statement in the years when the hedged item affects profit and loss. The gain or loss relating to the effective portion of interest rate swaps hedging variable rate borrowings is recognised in the income statement within ‘finance costs’.
When a hedging instrument expires or is sold, or when a hedge no longer meets the criteria for hedge accounting, any cumulative gain or loss existing in equity at that time remains in equity and is recognised when the forecast transaction is ultimately recognised in the income statement. When a forecast transaction is no longer expected to occur, the cumulative gain or loss that was reported within equity is immediately transferred to the income statement within finance income or costs.
2. Financial risk management
The Group’s activities expose it to a variety of financial risks, including the effects of changes in debt market prices and interest rates. The Group’s treasury management programme focuses on the unpredictability of financial markets and seeks to minimise potential adverse effects on the financial performance of the Group. The Group uses derivative financial instruments to reduce exposure to interest rate movements.
The use of financial derivatives is governed by the Group’s policies approved by the Board of Directors, which provide principles on interest rate risk, credit risk, the use of financial derivatives and non-derivative financial instruments and the investment of excess liquidity.
The Board adopts an ongoing process for identifying, evaluating and managing the significant risks faced by the Group.
Market Risk – Cash Flow Interest Rate Risk
The Group’s interest rate risk arises from long-term borrowings, which are issued at variable rates that expose the Group to cash flow interest rate risk. The Group’s borrowings are denominated in sterling.
The interest rate exposure of the Group is managed within the constraints of the Group’s business plan and the financial covenants under its facilities. The Group aims to reduce exposure to the effect of interest rate movements by hedging an appropriate amount of interest rate exposure. The impact of movements in interest rates is managed, where considered appropriate, through the use of interest rate swaps.
An interest rate swap was entered into on 29 November 2010 over an initial notional amount of £10m, which amortises in line with the repayments made on the underlying term loan, finally maturing on 15 October 2015.
The Group analyses its interest rate exposure. The Group has performed calculations to analyse its interest rate exposure taking into account refinancing, renewal of existing positions, alternative financing and hedging. Based on these scenarios, the Group calculates the impact on profit and loss of a defined interest rate shift. The scenarios are run only for liabilities that represent major interest-bearing positions.
Credit Risk
Credit risk arises from cash and deposits with banks as well as credit exposures to customers. Individual customer risk limits are set based on external credit reference agency ratings and the utilisation of these credit limits is regularly monitored. Further disclosure on credit exposure is given in note 22.
73 Vertu Motors plc

Notes to the Consolidated Financial Statements (continued) 2. Financial risk management (continued)
Liquidity Risk
Ultimate responsibility for liquidity risk rests with the Board of Directors, which has built an appropriate liquidity risk management framework for the management of the Group’s short, medium and long-term funding and liquidity management requirements. The Group manages liquidity risk by maintaining adequate reserves, banking facilities and reserve borrowing facilities by continuously monitoring forecast and actual cash flows and matching the maturity profiles of financial assets and liabilities. Disclosed within note 25 are the undrawn banking facilities that the Group has at its disposal, in order to further reduce liquidity risk.
The table below analyses the Group’s financial liabilities and derivative financial instruments into relevant maturity groupings based on the remaining period at the balance sheet date to contractual maturity date. The amounts disclosed in the table are the contractual undiscounted cash flows. All borrowings are denominated in sterling.
Less than one year
Between two and five years Total
£’000 £’000 £’000 Bank borrowings 3,574 - 3,574 Trade and other payables (excluding social security and other taxes) 455,122 - 455,122 At 28 February 2015 458,696 - 458,696
Less than one
year Between two
and five years Total £’000 £’000 £’000 Bank borrowings 2,183 3,574 5,757 Trade and other payables (excluding social security and other taxes) 387,922 - 387,922 At 28 February 2014 390,105 3,574 393,679 3. Capital risk management
The Group’s primary objective when managing capital is to safeguard the Group’s ability to continue as a going concern in order to provide returns for shareholders and benefits for other stakeholders.
The Group must ensure that sufficient capital resources are available for working capital requirements and meeting principal and interest payment obligations as they fall due.
Consistent with others in this industry, the Group monitors capital on the basis of the gearing ratio, which is calculated as net debt divided by total capital. Net debt is calculated as total borrowings (including current and non-current borrowings as shown in the consolidated balance sheet) less cash and cash equivalents. Total capital is calculated as total shareholders’ equity.
The Group had net cash of £15,670,000 at 28 February 2015 as disclosed in note 32 to the consolidated financial statements (2014: Net cash of £31,436,000).
Fair value estimation
Interest rate swap contracts have been marked to market based on valuations provided by the swap counterparty. The carrying value less impairment provision of trade receivables and payables are assumed to approximate their fair values. The fair value of long-term borrowings approximate to the carrying value reported in the balance sheet, as the majority are variable rate borrowings.
74 Vertu Motors plc

Notes to the Consolidated Financial Statements (continued) 4. Critical accounting estimates and judgements
The Group makes estimates and assumptions concerning the future. The resulting accounting estimates, will, by definition, seldom equal the related actual results. The estimates and assumptions that have a significant risk of causing a material adjustment to the carrying amounts of assets and liabilities are discussed below:
Valuation of goodwill
The valuation of goodwill acquired during the year has been performed in accordance with IFRS3 and is therefore based on provisional values ascribed within the measurement period subsequent to acquisition. Management judgement has been used in determining the existence and value of separately identifiable assets acquired as part of the business combination.
Valuation of other intangible assets
When a business combination takes place, the Group is required to assess whether there are any additional intangible assets arising separately from goodwill. Management judgement is required to determine whether an intangible asset can be separately identified, what fair value should be ascribed to the asset and its attributable useful life.
Impairment of goodwill and other indefinite life assets
The Group tests annually, or whenever events or changes in circumstances occur, to determine whether goodwill or other indefinite life assets have suffered any impairment, in accordance with the accounting policy stated above and in note 15. The recoverable amounts of cash-generating units have been determined based on value-in-use calculations. These calculations require the use of estimates.
Share based payments
Share options issued to certain employees are measured at fair value at the grant date using a fair value model, and are expensed on a straight-line basis over the vesting period based on an estimate of the number of options which will vest. The key assumptions of this model are disclosed in note 30.
Estimated useful life of intangibles, property, plant and equipment and impairment testing
The Group estimates the useful life and residual values of intangible assets, property, plant and equipment and reviews these estimates at each financial year end. The Group also tests for impairment when a trigger event occurs, or annually, as appropriate.
Pension benefits
The Group operates a contributory pension scheme, “Bristol Street Pension Scheme”, which has three defined benefit sections, in which accrual ceased on 31 May 2003. The obligations under this defined benefit scheme are recognised in the balance sheet and represent the present value of the obligations calculated by independent actuaries, with input from management. These actuarial valuations include assumptions such as discount rates, annual rates of return and mortality rates. These assumptions vary from time to time according to prevailing economic conditions. Details of the assumptions used in the year ended 28 February 2015 are provided in note 29.
5. Segmental information
The Group adopts IFRS 8 “Operating Segments”, which determines and presents operating segments based on information provided to the Group’s Chief Operating Decision Maker (“CODM”), Robert Forrester, Chief Executive. There has been no change in the Group’s one reportable operating segment, since the Group is operated and is managed on a dealership by dealership basis. Dealerships operate a number of different business streams such as new vehicle sales, used vehicle sales and after-sales operations. Management is organised based on the dealership operations as a whole rather than the specific business streams.
Dealerships are considered to have similar economic characteristics and offer similar products and services which appeal to a similar customer base. As such, the results of each dealership have been aggregated to form one reportable operating segment.
75 Vertu Motors plc

Notes to the Consolidated Financial Statements (continued) 5. Segmental information (continued)
The CODM assesses the performance of the operating segment based on a measure of both revenue and gross margin. Therefore, to increase transparency, the Group has included below an additional voluntary disclosure analysing revenue and gross margin within the reportable segment.
Year ended 28 February 2015
Revenue
Revenue
Mix
Gross
Margin
Gross Margin
Mix
Gross
Margin £’m % £’m % %
New car retail and Motability 679.4 32.7 50.9 22.3 7.5 New fleet and commercial 498.5 24.0 12.3 5.4 2.5 Used cars 728.9 35.2 75.5 33.1 10.4 Vehicle sales 1,906.8 91.9 138.7 60.8 7.3
Aftersales* 168.1 8.1 89.4 39.2 43.5
2,074.9 100.0 228.1 100.0 11.0
Year ended 28 February 2014
Revenue
Revenue Mix
Gross
Margin
Gross Margin
Mix
Gross
Margin £’m % £’m % %
New car retail and Motability 534.4 31.7 40.8 21.2 7.6
New fleet and commercial 420.4 25.0 10.2 5.3 2.4 Used cars 582.6 34.6 63.2 32.9 10.8 Vehicle sales 1,537.4 91.3 114.2 59.4 7.4 Aftersales* 147.1 8.7 78.0 40.6 43.1 1,684.5 100.0 192.2 100.0 11.4 * margin in after-sales expressed on internal and external turnover
6. Operating expenses
2015 2014
£’000
£’000
Wages and salaries excluding share based payments charges (note 9)
113,940
96,653
Depreciation on property, plant and equipment (note 18)
5,915
5,670
Loss on disposal of property, plant and equipment 186 40 Operating lease rentals – property 7,621 6,744 Operating lease rentals – plant and equipment 172 154 Operating lease rentals – vehicles 2,683 1,957 Auditors’ remuneration (note 7) 317 251 Rental income (467) (199) Other expenses 74,967 63,023 205,334 174,293
76 Vertu Motors plc

Notes to the Consolidated Financial Statements (continued) 7. Auditors’ remuneration
2015 2014 £’000 £’000 Fees payable to the Company’s auditors for the audit of the parent Company and consolidated financial statements 166 155 Fees payable to the Company’s auditors and its associates for other services:
- audit of Group’s subsidiaries 20 19 - Due diligence and other services 131 77 317 251
8. Exceptional charges
2015 2014 £’000 £’000 Impairment of fixed assets - 1,180 - 1,180
The impairment charge in the year to 28 February 2014 was in relation to the write down of four vacant properties to their estimated recoverable amount.
9. Employee benefit expense
2015 2014 £’000 £’000 Wages and salaries 116,179 99,169 Social security costs 11,397 9,688 Pension costs – defined contribution plans 2,025 1,613 129,601 110,470 Share based payments charge (note 30) 645 195 130,246 110,665
Employee benefit expense included in: 2015 2014 £’000 £’000 Operating expenses 113,940 96,653 Cost of sales 15,661 13,817 Share based payment charge 645 195 130,246 110,665
Details of the remuneration of the Directors who served during the year from 1 March 2014 to 28 February 2015 and the year from 1 March 2013 to 28 February 2014 are given in the Directors’ Remuneration Report on page 53 to 57.
77 Vertu Motors plc

Notes to the Consolidated Financial Statements (continued) 10. Average monthly number of people employed (including Directors)
Number Number 2015 2014 Sales and distribution 1,550 1,353 Service, parts and accident repair centres 1,519 1,348 Administration 941 787 4,010 3,488
To demonstrate the impact of acquisitions on the above figures, the actual year-end number of people employed is as follows:
Number Number 2015 2014 Sales and distribution 1,629 1,468 Service, parts and accident repair centres 1,560 1,462 Administration 988 863 4,177 3,793
11. Finance income and costs
2015 2014 £’000 £’000 Interest on short term bank deposits 50 55 Vehicle stocking interest 163 82 Net finance income relating to Group pension scheme (note 29)
140
194
Finance income 353 331 Bank loans and overdrafts (642) (703) Other finance costs (398) (22) Finance costs (1,040) (725)
‘Other finance costs’ in the year ended 28 February 2015 includes £383,000 in respect of interest payable relating to previous periods due to HMRC.
12. Taxation
2015 2014 £’000 £’000 Current tax Current tax charge 5,214 4,526 Adjustment in respect of prior years (96) 241 Total current tax 5,118 4,767 Deferred tax Origination and reversal of temporary differences (469) (148) Adjustment in respect of prior years (203) (666) Rate differences 13 (539) Total deferred tax (note 27) (659) (1,353) Income tax expense 4,459 3,414
2015 2014 £’000 £’000 Comprising: Taxation – excluding exceptional charges 4,459 3,414 Taxation – exceptional charges - - 4,459 3,414
78
Vertu Motors plc

Notes to the Consolidated Financial Statements (continued) 12. Taxation (continued)
2015 2014 £’000 £’000 Factors affecting taxation expense in the year: Profit before taxation and exceptional charges 20,998 17,022 Exceptional charges - (1,180) Profit before taxation from continuing operations 20,998 15,842 Profit before taxation multiplied by the rate of corporation tax in the UK of 21.17% (2014: 23.08%) 4,445 3,656 Non-qualifying depreciation 325 301 Non-deductible expenses 109 436 Effect on deferred tax balances due to rate change 13 (539) Small companies rate - (2) Property adjustment (76) 46 Permanent benefits (58) (51) Utilisation of unprovided deferred tax - (8) Adjustments in respect of prior years (299) (425) Total tax expense included in the income statement 4,459 3,414
The standard rate of Corporation Tax in the UK changed from 23% to 21% with effect from 1 April 2014, and from 21% to 20% with effect from 1 April 2015. Accordingly, the Group’s profits for this accounting period are taxed at an effective rate of 21.17%.
13. Earnings per share
Basic and diluted earnings per share are calculated by dividing the earnings attributable to equity shareholders by the weighted average number of ordinary shares during the year or the diluted weighted average number of ordinary shares in issue in the year.
The Group only has one category of potentially dilutive ordinary shares, which are share options. A calculation has been undertaken to determine the number of shares that could have been acquired at fair value (determined at the average annual market price of the Group’s shares) based on the monetary value of the subscription rights attached to the outstanding share options. The number of shares calculated, as set out above, is compared with the number of shares that would have been issued assuming the exercise of the share options.
Adjusted earnings per share is calculated by dividing the adjusted earnings attributable to equity shareholders by the weighted average number of ordinary shares in issue during the year.
79 Vertu Motors plc

Notes to the Consolidated Financial Statements (continued) 13. Earnings per share (continued)
2015 2014 £’000 £’000 Profit attributable to equity shareholders 16,539 12,428 Amortisation of intangible assets 405 293 Share based payments charge 645 195 Exceptional charges - 1,180 Tax effect of adjustments (86) (68) Adjusted earnings attributable to equity shareholders 17,503 14,028 Weighted average number of shares in issue (‘000s) 339,797 299,367 Potentially dilutive shares (‘000s) 6,410 3,263 Diluted weighted average number of shares in issue (‘000s) 346,207 302,630 Basic earnings per share 4.87p 4.15p Diluted earnings per share 4.78p 4.11p Basic adjusted earnings per share 5.15p 4.69p Diluted adjusted earnings per share 5.06p 4.64p
14. Dividends per share
The dividends paid in the year to 28 February 2015 were 0.85p per share in total (2014: 0.75p). A final dividend in respect of the year ended 28 February 2015 of 0.7p per share, is to be proposed at the annual general meeting on 23 July 2015. The ex dividend date will be 25 June 2015 and the associated record date 26 June 2015. This dividend will be paid, subject to shareholder approval, on 28 July 2015 and these financial statements do not reflect this final dividend payable. 15. Goodwill and other indefinite life assets
2015 Goodwill Franchise relationships
Total
£’000 £’000 £’000 Cost and net book value At 1 March 2014 35,779 7,373 43,152 Additions (note 17) 5,966 1,749 7,715 At 28 February 2015 41,745 9,122 50,867
2014
Goodwill Franchise relationships
Total
£’000 £’000 £’000 Cost and net book value At 1 March 2013 21,526 - 21,526 Additions 14,253 7,373 21,626 At 28 February 2014 35,779 7,373 43,152
80 Vertu Motors plc

Notes to the Consolidated Financial Statements (continued) 15. Goodwill and other indefinite life assets (continued)
Measurement period adjustment
On 12 June 2013 the Group acquired the entire issued share capital of Albert Farnell Limited. The Group recognised in the 2014 financial statements a provisional fair value for net assets acquired of £13,737,000 and a provisional fair value for goodwill of £17,439,000.
Within the measurement period following acquisition and in accordance with IFRS3, the purchase price allocation has been finalised. This included an exercise to search for other material separately identifiable intangible assets such as brand value, supplier agreements, franchise relationships and customer relationships. As a result of this, a value of £7,373,000 has been ascribed to franchise relationships reflecting the ability to sell manufacturer vehicles and to offer manufacturer standard aftersales services in a particular geographic area. This amount has been reclassified from goodwill to other indefinite life assets, and a corresponding deferred tax liability of £1,475,000 (note 27) has been recognised. The directors’ judgement is that this intangible asset has an indefinite useful life and therefore will be reviewed for impairment on an annual basis.
The finalisation of the purchase price allocation also resulted in a reduction in the fair value of tangible fixed assets acquired of £488,000 (note 18).
In accordance with IFRS3, the measurement period adjustment has been reflected in these financial statements as if the final purchase price allocation had been completed at the acquisition date. The impact of this was to increase the value of “Goodwill and indefinite life assets” by £1,963,000, decrease the value of ‘Property, plant and equipment’ by £488,000 and increase the value of ‘Deferred income tax liabilities’ by £1,475,000 from the figures previously reported at 28 February 2014.
Impairment
In accordance with IAS 36, ‘Impairment of Assets’, the Group tests the following assets for impairment annually:
• Goodwill • Other assets where there is any indication that the relevant asset may be impaired
In the years ended 28 February 2015 and 28 February 2014, the acquired goodwill and other indefinite life assets were tested for impairment, with no impairment charge deemed necessary. For the purposes of impairment testing of goodwill and other indefinite life assets, the Directors recognise the Group’s Cash Generating Units (“CGU”s) to be connected groupings of dealerships acquired together.
A summary of the goodwill purchased is presented below:
2015 2014 £’000 £’000 Bristol Street Group Limited 13,860 13,860 Albert Farnell Limited 12,029 12,029 Hillendale Group Limited 5,159 - The Taxi Centre Limited 807 - Other acquisitions 9,890 9,890 41,745 35,779
81 Vertu Motors plc
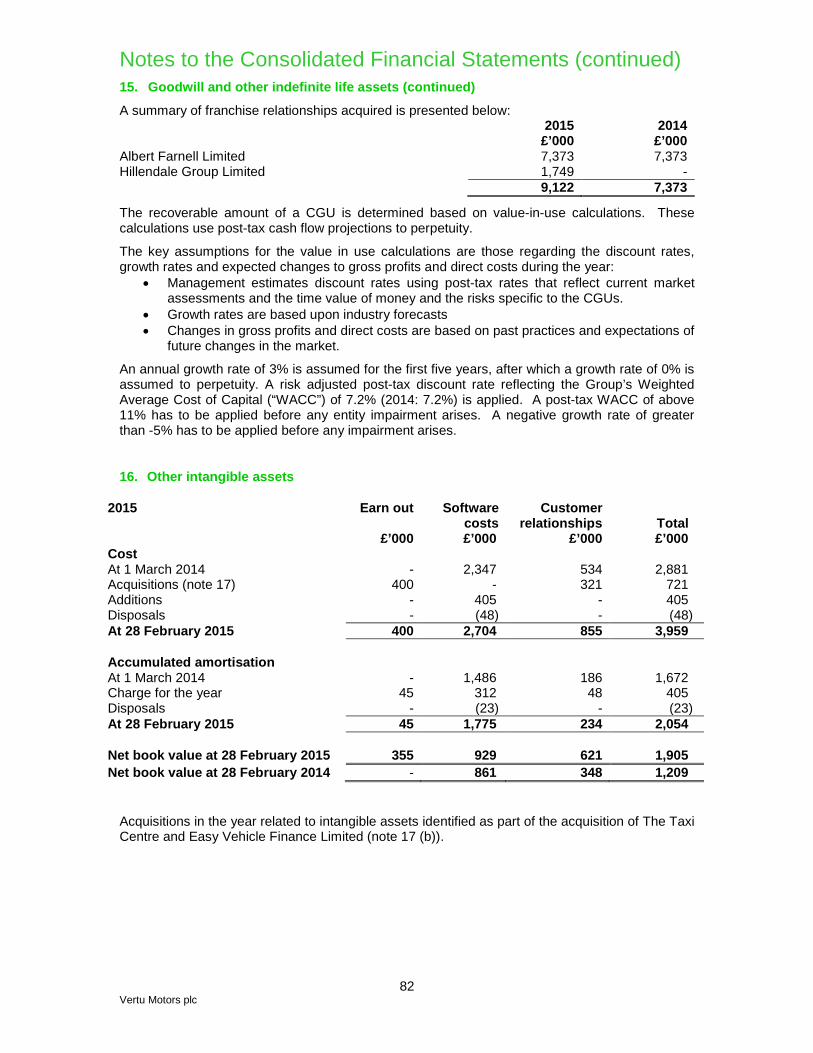
Notes to the Consolidated Financial Statements (continued) 15. Goodwill and other indefinite life assets (continued)
A summary of franchise relationships acquired is presented below: 2015 2014 £’000 £’000 Albert Farnell Limited 7,373 7,373 Hillendale Group Limited 1,749 - 9,122 7,373
The recoverable amount of a CGU is determined based on value-in-use calculations. These calculations use post-tax cash flow projections to perpetuity.
The key assumptions for the value in use calculations are those regarding the discount rates, growth rates and expected changes to gross profits and direct costs during the year:
• Management estimates discount rates using post-tax rates that reflect current market assessments and the time value of money and the risks specific to the CGUs.
• Growth rates are based upon industry forecasts • Changes in gross profits and direct costs are based on past practices and expectations of
future changes in the market.
An annual growth rate of 3% is assumed for the first five years, after which a growth rate of 0% is assumed to perpetuity. A risk adjusted post-tax discount rate reflecting the Group’s Weighted Average Cost of Capital (“WACC”) of 7.2% (2014: 7.2%) is applied. A post-tax WACC of above 11% has to be applied before any entity impairment arises. A negative growth rate of greater than -5% has to be applied before any impairment arises.
16. Other intangible assets
2015 Earn out Software costs
Customer relationships Total
£’000 £’000 £’000 £’000 Cost At 1 March 2014 - 2,347 534 2,881 Acquisitions (note 17) 400 - 321 721 Additions - 405 - 405 Disposals - (48) - (48) At 28 February 2015 400 2,704 855 3,959 Accumulated amortisation At 1 March 2014 - 1,486 186 1,672 Charge for the year 45 312 48 405 Disposals - (23) - (23) At 28 February 2015 45 1,775 234 2,054 Net book value at 28 February 2015 355 929 621 1,905 Net book value at 28 February 2014 - 861 348 1,209
Acquisitions in the year related to intangible assets identified as part of the acquisition of The Taxi Centre and Easy Vehicle Finance Limited (note 17 (b)).
82 Vertu Motors plc

Notes to the Consolidated Financial Statements (continued) 16. Other intangible assets (continued)
2014
Software costs
Customer relationships Total
£’000 £’000 £’000 Cost At 1 March 2013 1,904 534 2,438 Additions 443 - 443 At 28 February 2014 2,347 534 2,881 Accumulated amortisation At 1 March 2013 1,220 159 1,379 Charge for the year 266 27 293 At 28 February 2014 1,486 186 1,672 Net book value at 28 February 2014 861 348 1,209 Net book value at 28 February 2013 684 375 1,059
17. Business combinations
a) Acquisition of Hillendale Group Limited
On 6 May 2014 the Group acquired the entire issued share capital of Hillendale Group Limited which operates a Land Rover dealership in Nelson, Lancashire and a Jaguar dealership in Bolton, Lancashire, for consideration of £8,040,000. £2,000,000 of consideration was satisfied through the issue of 3,410,475 ordinary shares in the Company issued at 58.64p. The remaining £6,040,000 consideration was satisfied in cash from the Group’s existing cash resources.
Details of the fair value of the net assets acquired and goodwill arising are as follows:
Fair Value £’000 Intangible assets 1,749 Property, plant and equipment 2,032 Inventories 4,198 Trade and other receivables 1,057 Cash and cash equivalents 1,430 Trade and other payables (6,576) Corporation tax (143) Deferred tax (411) Borrowings (455) Net assets acquired 2,881 Goodwill 5,159 Consideration 8,040
- Satisfied through the issue of shares in the Company 2,000 - Satisfied in cash 6,040
Total consideration 8,040
Acquisition related costs (included in the consolidated income statement for the year ended 28 February 2015) totalled £307,000 in respect of this acquisition.
The goodwill arising on acquisition is attributable to the anticipated profitability of the distribution of the Group’s products through the acquired dealerships.
If the acquisition of Hillendale Group Limited had occurred on 1 March 2014, Group revenues would have been £12,419,000 higher and Group profit attributable to equity holders would have been £393,000 higher.
83 Vertu Motors plc

Notes to the Consolidated Financial Statements (continued) 17. Business combinations (continued)
b) Acquisition of The Taxi Centre Limited and Easy Vehicle Finance Limited
On 5 November 2014 the Group acquired the entire issued share capital of The Taxi Centre Limited and Easy Vehicle Finance Limited (together “the Taxi Centre Limited”) which source vehicles for private operators in the taxi sector and is located in Paisley, Scotland. Total consideration for the acquisition was £2,060,000. £200,000 of this consideration was satisfied through the issue of 343,053 ordinary shares in the Company, issued at a price of 58.30p. A further £400,000 has been included in consideration in respect of an earn out arrangement which specifies that a percentage of profit before tax for each of the three years following acquisition will be payable to the seller. The earn out arrangement has been ascribed a fair value based on a current estimate of the present value of future profitability of the business. £109,000 has been included in current ‘deferred consideration’ in respect of the estimated amount payable within one year and £291,000 has been included in non-current ‘deferred consideration’ in respect of the estimated amount payable in greater than one year. The remaining consideration has been met from the Group’s existing cash resources.
Details of the fair value of the net assets acquired and goodwill arising are as follows:
Fair Value £’000 Intangible assets 721 Property, plant and equipment 18 Inventories 39 Trade and other receivables 383 Cash and cash equivalents 1,012 Trade and other payables (862) Corporation tax (58) Net assets acquired 1,253 Goodwill 807 Consideration 2,060
- Satisfied through the issue of shares in the Company 200 - Earn out 400 - Satisfied in cash 1,460
Total consideration 2,060
Acquisition related costs (included in the consolidated income statement for the year ended 28 February 2015) totalled £60,000 in respect of this acquisition.
The goodwill arising on acquisition is attributable to the anticipated profitability of the distribution of the Group’s products through the acquired business.
If the acquisition of The Taxi Centre Limited had occurred on 1 March 2014, Group revenues would have been £8,349,000 higher and Group profit attributable to equity holders would have been £229,000 higher.
c) Trade and assets of Bolton, Wigan, Horwich and Walkden Ford
On 7 November 2014 the Group acquired the trade and certain assets of two Ford main dealerships in Bolton and Wigan, and two satellite operations in Walkden and Horwich from Gordons (Bolton) Limited for total consideration of £11,027,000, of which £10,918,000 was met from the Group’s existing cash resources. There is a further £109,000 deferred consideration payable on the first anniversary of the acquisition completion date.
84 Vertu Motors plc
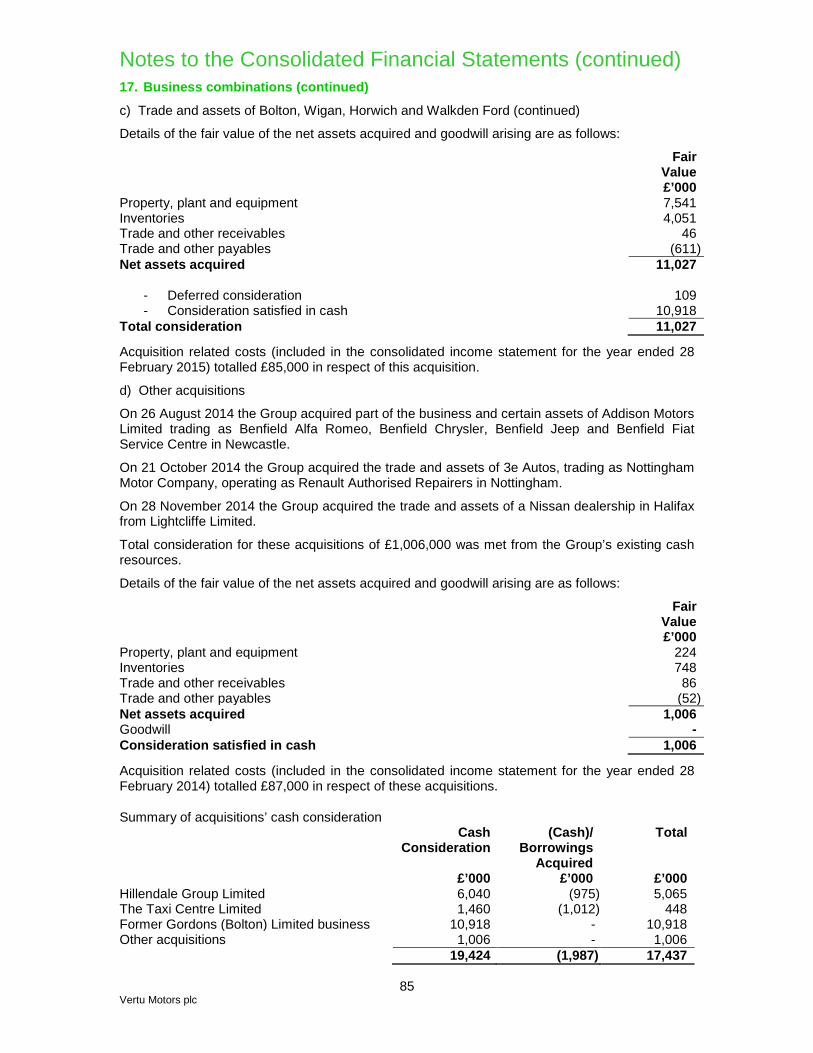
Notes to the Consolidated Financial Statements (continued) 17. Business combinations (continued)
c) Trade and assets of Bolton, Wigan, Horwich and Walkden Ford (continued)
Details of the fair value of the net assets acquired and goodwill arising are as follows:
Fair Value £’000 Property, plant and equipment 7,541 Inventories 4,051 Trade and other receivables 46 Trade and other payables (611) Net assets acquired 11,027
- Deferred consideration 109 - Consideration satisfied in cash 10,918
Total consideration 11,027
Acquisition related costs (included in the consolidated income statement for the year ended 28 February 2015) totalled £85,000 in respect of this acquisition.
d) Other acquisitions
On 26 August 2014 the Group acquired part of the business and certain assets of Addison Motors Limited trading as Benfield Alfa Romeo, Benfield Chrysler, Benfield Jeep and Benfield Fiat Service Centre in Newcastle.
On 21 October 2014 the Group acquired the trade and assets of 3e Autos, trading as Nottingham Motor Company, operating as Renault Authorised Repairers in Nottingham.
On 28 November 2014 the Group acquired the trade and assets of a Nissan dealership in Halifax from Lightcliffe Limited.
Total consideration for these acquisitions of £1,006,000 was met from the Group’s existing cash resources.
Details of the fair value of the net assets acquired and goodwill arising are as follows:
Fair Value £’000 Property, plant and equipment 224 Inventories 748 Trade and other receivables 86 Trade and other payables (52) Net assets acquired 1,006 Goodwill - Consideration satisfied in cash 1,006
Acquisition related costs (included in the consolidated income statement for the year ended 28 February 2014) totalled £87,000 in respect of these acquisitions.
Summary of acquisitions’ cash consideration Cash
Consideration (Cash)/
Borrowings Total
Acquired £’000 £’000 £’000 Hillendale Group Limited 6,040 (975) 5,065 The Taxi Centre Limited 1,460 (1,012) 448 Former Gordons (Bolton) Limited business 10,918 - 10,918 Other acquisitions 1,006 - 1,006 19,424 (1,987) 17,437
85 Vertu Motors plc

Notes to the Consolidated Financial Statements (continued) 17. Business combinations (continued)
Deferred consideration outstanding at 28 February 2015:
2015 2014 £’000 £’000 Former Co-operative Group Motor businesses 1,300 2,600 The Taxi Centre Limited (earn out) 400 - Former Gordons (Bolton) Limited businesses 109 - 1,809 2,600 Maturity of deferred consideration: Payable in less than 12 months 1,518 1,300 Payable in greater than 12 months 291 1,300 1,809 2,600
Summary of the fair value of net assets acquired
Hillendale Group
Limited
The Taxi Centre
Limited
Former Gordons (Bolton) Limited
business
Other
Acquisitions
Total £’000 £’000 £’000 £’000 £’000 Intangible assets 1,749 721 - - 2,470 Property, plant and equipment
2,032
18
7,541
224
9,815
Inventories 4,198 39 4,051 748 9,036 Trade and other receivables
1,057
383
46
86
1,572
Cash and cash equivalents
1,430
1,012
-
-
2,442
Trade and other payables (6,576) (862) (611) (52) (8,101) Corporation tax (143) (58) - - (201) Deferred tax (411) - - - (411) Borrowings (455) - - - (455) Net assets acquired 2,881 1,253 11,027 1,006 16,167
e) Disposal of Altrincham Nissan
On 16 December the Group disposed of the trade and certain assets of its Nissan operation in Altrincham to Nissan Motor (GB) Limited and Aprite (GB) Limited for total consideration of £802,000, including a retention of £50,000, included in other receivables at 28 February 2015.
Details of the fair value of the net assets disposed of are as follows:
Fair Value £’000 Property, plant and equipment 525 Inventories 262 Trade and other receivables 23 Trade and other payables (8) Net assets disposed of 802 Retention (50) Consideration satisfied in cash 752
Disposal related costs (included in the consolidated income statement for the year ended 28 February 2015) totalled £29,000 in respect of this disposal.
86 Vertu Motors plc

Notes to the Consolidated Financial Statements (continued) 18. Property, plant and equipment
2015
Freehold and long
leasehold land and
buildings*
Short leasehold
land and
buildings*
Vehicles and machinery
Furniture, fittings and equipment
Total £’000 £’000 £’000 £’000 £’000 Cost At 1 March 2014 113,641 3,828 4,188 8,326 129,983 Acquisitions** 16,567 - 209 452 17,228 Additions 8,702 704 1,103 1,716 12,225 Disposals (2,150) (619) (353) (835) (3,957) Reclassifications (1,872) - 133 (133) (1,872) At 28 February 2015 134,888 3,913 5,280 9,526 153,607 Accumulated depreciation and impairment
At 1 March 2014 7,998 1,080 1,375 3,342 13,795 Depreciation charge 2,114 505 1,200 2,096 5,915 Disposals - (183) (328) (739) (1,250) Reclassifications (6) - 22 (22) (6) At 28 February 2015 10,106 1,402 2,269 4,677 18,454 Net Book Value At 28 February 2015 124,782 2,511 3,011 4,849 135,153 At 28 February 2014 105,643 2,748 2,813 4,984 116,188
* Includes leasehold improvements and franchise standards property improvements.
** Acquisitions include those business combinations included in note 17 together with the purchase of freehold property to expand the capacity of the Group.
Included within Acquisitions is the purchase of two satellite operations purchased from Gordons (Bolton) Limited (note 17(c)). Following a post acquisition review of these operations, these freehold properties located in Walkden and Horwich, with a cost of £1,872,000 and accumulated depreciation of £6,000 were transferred into assets held for resale. This is reflected within ‘Reclassifications’. On 24 April the Walkden property was sold for its carrying value (note 37).
Depreciation expense of £5,915,000 has been charged in operating expenses (note 6).
In addition to the security provided for the Group’s bank borrowings, specific charges over freehold land and buildings with a cost of £10,900,000 (2014: £10,900,000) have been granted to manufacturer partners as security against consignment stocking lines. Furthermore specific charges over freehold land and buildings with a cost of £3,017,000 (2014: £3,017,000) have been granted to the Co-operative Group as security for deferred consideration on businesses acquired in earlier financial years. Deferred consideration of £1,300,000 remains outstanding in respect of this acquisition which is all due within one year.
87 Vertu Motors plc
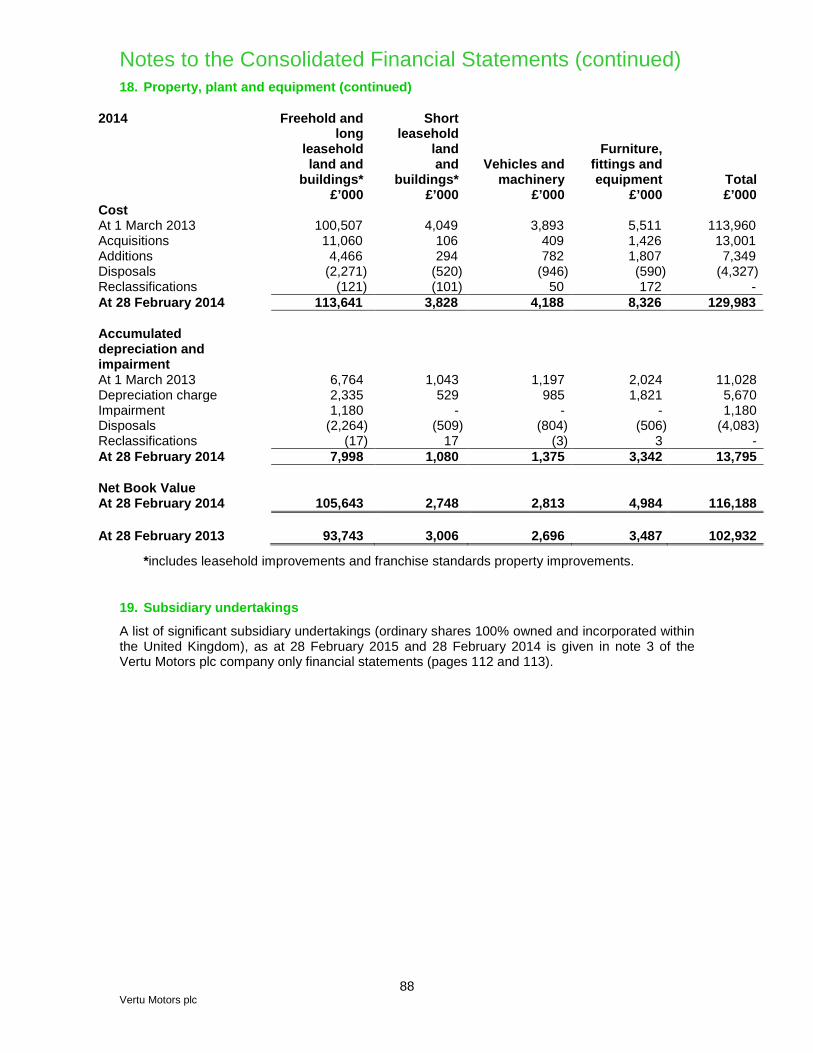
Notes to the Consolidated Financial Statements (continued) 18. Property, plant and equipment (continued)
2014
Freehold and long
leasehold land and
buildings*
Short leasehold
land and
buildings*
Vehicles and machinery
Furniture, fittings and equipment
Total £’000 £’000 £’000 £’000 £’000 Cost At 1 March 2013 100,507 4,049 3,893 5,511 113,960 Acquisitions 11,060 106 409 1,426 13,001 Additions 4,466 294 782 1,807 7,349 Disposals (2,271) (520) (946) (590) (4,327) Reclassifications (121) (101) 50 172 - At 28 February 2014 113,641 3,828 4,188 8,326 129,983 Accumulated depreciation and impairment
At 1 March 2013 6,764 1,043 1,197 2,024 11,028 Depreciation charge 2,335 529 985 1,821 5,670 Impairment 1,180 - - - 1,180 Disposals (2,264) (509) (804) (506) (4,083) Reclassifications (17) 17 (3) 3 - At 28 February 2014 7,998 1,080 1,375 3,342 13,795 Net Book Value At 28 February 2014 105,643 2,748 2,813 4,984 116,188 At 28 February 2013 93,743 3,006 2,696 3,487 102,932
*includes leasehold improvements and franchise standards property improvements.
19. Subsidiary undertakings
A list of significant subsidiary undertakings (ordinary shares 100% owned and incorporated within the United Kingdom), as at 28 February 2015 and 28 February 2014 is given in note 3 of the Vertu Motors plc company only financial statements (pages 112 and 113).
88 Vertu Motors plc

Notes to the Consolidated Financial Statements (continued) 20. Inventories
2015 2014 £’000 £’000 New vehicle stock 299,957 253,880 Used, demonstrator and courtesy vehicles 82,210 69,530 Parts and sundry stocks 12,120 11,042 394,287 334,452
The total value of new vehicle stock is comprised of the following:
2015 2014 £’000 £’000 Interest bearing consignment stock 12,177 9,436 Stock invoiced not yet paid held by Manufacturers to the order of the Group
259,190
221,472
Other new vehicle stock 28,590 22,972 299,957 253,880
A corresponding liability is held in trade payables in respect of stock invoiced not yet paid held by Manufacturers to the order of the Group and interest bearing consignment stock.
The cost of inventories recognised as expense and included within ‘cost of sales’ amounted to £1,905,414,000 (2014: £1,536,797,000).
21. Property assets held for resale
2015 2014 £’000 £’000 At beginning of year - - Transfers in from freehold property 1,866 - At end of year 1,866 -
22. Trade and other receivables
Non-current 2015 2014 £’000 £’000 Other receivables 192 192 Less provision for impairment of other receivables (192) - - 192
The non-current other receivables balance relates to redeemable preference shares received as part consideration for the disposal of the Group’s heavy truck business to Aquila Truck Centres (Italia) Limited in the year ended 28 February 2014.
Following a review of the recoverability of the preference shares during the year ended 28 February 2015, the balance is determined to have been impaired and therefore a provision has been made against the balance in full. The creation of the provision has been included in ‘other expenses’ within ‘operating expenses’ in the income statement (Note 6).
89 Vertu Motors plc
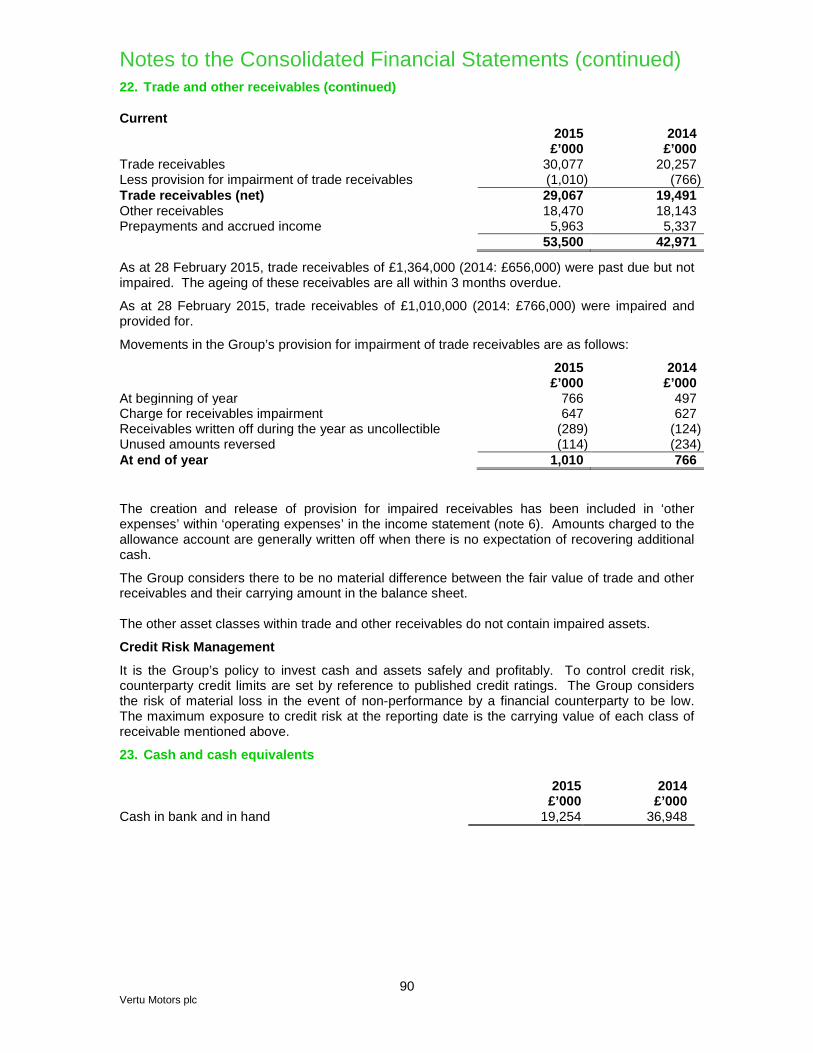
Notes to the Consolidated Financial Statements (continued) 22. Trade and other receivables (continued)
Current 2015 2014 £’000 £’000 Trade receivables 30,077 20,257 Less provision for impairment of trade receivables (1,010) (766) Trade receivables (net) 29,067 19,491 Other receivables 18,470 18,143 Prepayments and accrued income 5,963 5,337 53,500 42,971
As at 28 February 2015, trade receivables of £1,364,000 (2014: £656,000) were past due but not impaired. The ageing of these receivables are all within 3 months overdue.
As at 28 February 2015, trade receivables of £1,010,000 (2014: £766,000) were impaired and provided for.
Movements in the Group’s provision for impairment of trade receivables are as follows:
2015 2014 £’000 £’000 At beginning of year 766 497 Charge for receivables impairment 647 627 Receivables written off during the year as uncollectible (289) (124) Unused amounts reversed (114) (234) At end of year 1,010 766
The creation and release of provision for impaired receivables has been included in ‘other expenses’ within ‘operating expenses’ in the income statement (note 6). Amounts charged to the allowance account are generally written off when there is no expectation of recovering additional cash.
The Group considers there to be no material difference between the fair value of trade and other receivables and their carrying amount in the balance sheet. The other asset classes within trade and other receivables do not contain impaired assets.
Credit Risk Management
It is the Group’s policy to invest cash and assets safely and profitably. To control credit risk, counterparty credit limits are set by reference to published credit ratings. The Group considers the risk of material loss in the event of non-performance by a financial counterparty to be low. The maximum exposure to credit risk at the reporting date is the carrying value of each class of receivable mentioned above.
23. Cash and cash equivalents
2015 2014 £’000 £’000 Cash in bank and in hand 19,254 36,948
90 Vertu Motors plc

Notes to the Consolidated Financial Statements (continued) 24. Trade and other payables
2015 2014 £’000 £’000 Current Trade payables 399,147 342,102 Social security and other taxes 4,128 3,850 Accruals 32,610 25,632 Deferred income 3,865 2,688 Other payables 19,500 17,500 459,250 391,772
Other payables comprise non-interest bearing advance payments from the Group’s finance company partners.
Trade and other payables, excluding social security and other taxes, are designated as financial liabilities carried at amortised cost. Their fair value is deemed to be equal to their carrying value.
Accruals includes £6,844,000 (2014: £4,688,000) in respect of outstanding service plans.
25. Borrowings
2015 2014 £’000 £’000 Current Bank borrowings 3,423 2,000 Non-current Bank borrowings - 3,346 Other borrowings 161 166 161 3,512 3,584 5,512 Borrowings are repayable as follows:
2015 2014 £’000 £’000 6 months or less 958 1,000 6-12 months 2,465 1,000 1-5 years 161 3,512 3,584 5,512 a) Bank borrowings
The fair value of bank borrowings equals their carrying amount, as the impact of discounting is not significant. Bank borrowings are designated as financial liabilities carried at amortised cost.
During the year ended 28 February 2015, loans were subject to an interest rate of 2.25% above LIBOR. The Group’s £15,000,000 Revolving Credit Facility (“RCF”) was available throughout the year ended 28 February 2015 with an applicable interest rate of 1.70% above LIBOR. A rate of 1.25% above base rate has been applied in relation to overdrafts and a rate of 1.25% above LIBOR has been applied on the Group’s Committed Money Market Loan (“CMML”) facility. These facilities were refinanced on 31 March 2015. The RCF has been extended to £20,000,000 available until 31 March 2019 at an interest rate of between 1.10% and 1.90% above LIBOR depending on the value of the Group’s net debt to EBITDA ratio. A rate of 1.10% above base rate will be applied in relation to overdrafts and a rate of 1.10% above LIBOR will be applied to the CMML facility. The CMML facility has also been extended from £30,000,000 to £40,000,000 for four peak months of the year. The terms of the Group’s bank loans remain unchanged. The bank borrowings are secured on the assets of the Company and the Group.
91 Vertu Motors plc
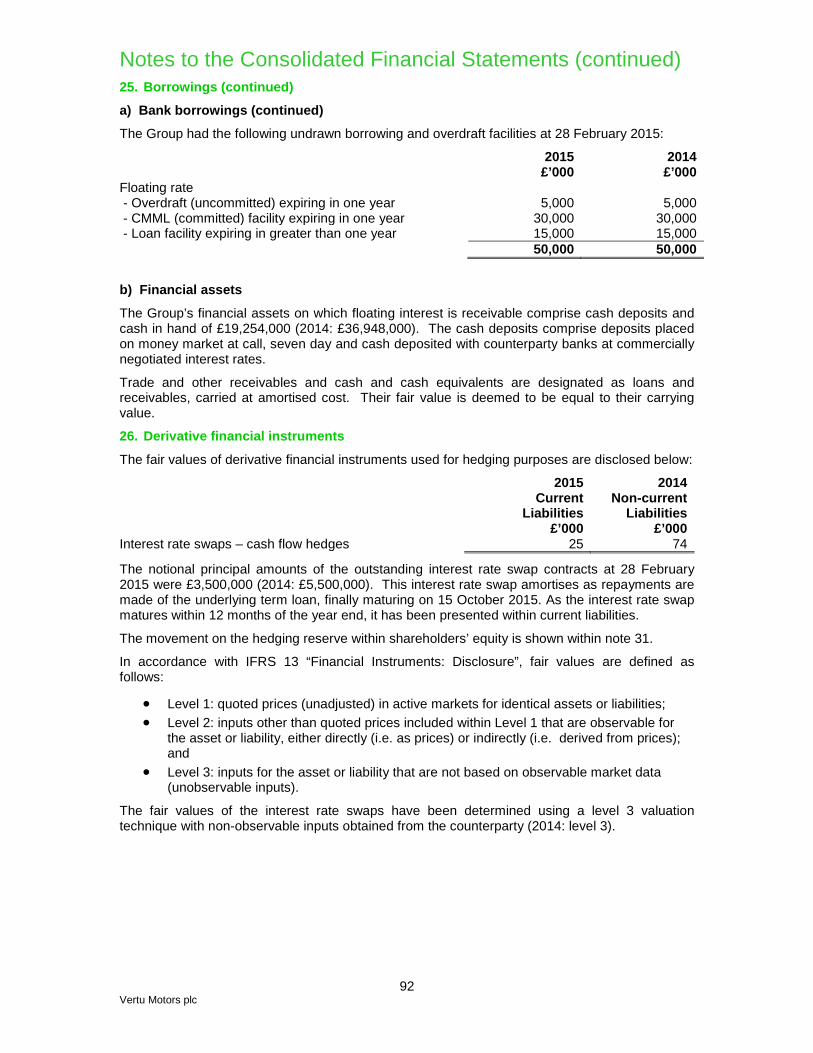
Notes to the Consolidated Financial Statements (continued) 25. Borrowings (continued)
a) Bank borrowings (continued)
The Group had the following undrawn borrowing and overdraft facilities at 28 February 2015:
2015 2014 £’000 £’000 Floating rate - Overdraft (uncommitted) expiring in one year 5,000 5,000 - CMML (committed) facility expiring in one year 30,000 30,000 - Loan facility expiring in greater than one year 15,000 15,000 50,000 50,000
b) Financial assets
The Group’s financial assets on which floating interest is receivable comprise cash deposits and cash in hand of £19,254,000 (2014: £36,948,000). The cash deposits comprise deposits placed on money market at call, seven day and cash deposited with counterparty banks at commercially negotiated interest rates.
Trade and other receivables and cash and cash equivalents are designated as loans and receivables, carried at amortised cost. Their fair value is deemed to be equal to their carrying value.
26. Derivative financial instruments
The fair values of derivative financial instruments used for hedging purposes are disclosed below:
2015 2014 Current Non-current Liabilities Liabilities £’000 £’000 Interest rate swaps – cash flow hedges 25 74
The notional principal amounts of the outstanding interest rate swap contracts at 28 February 2015 were £3,500,000 (2014: £5,500,000). This interest rate swap amortises as repayments are made of the underlying term loan, finally maturing on 15 October 2015. As the interest rate swap matures within 12 months of the year end, it has been presented within current liabilities.
The movement on the hedging reserve within shareholders’ equity is shown within note 31.
In accordance with IFRS 13 “Financial Instruments: Disclosure”, fair values are defined as follows:
• Level 1: quoted prices (unadjusted) in active markets for identical assets or liabilities; • Level 2: inputs other than quoted prices included within Level 1 that are observable for
the asset or liability, either directly (i.e. as prices) or indirectly (i.e. derived from prices); and
• Level 3: inputs for the asset or liability that are not based on observable market data (unobservable inputs).
The fair values of the interest rate swaps have been determined using a level 3 valuation technique with non-observable inputs obtained from the counterparty (2014: level 3).
92 Vertu Motors plc

Notes to the Consolidated Financial Statements (continued) 27. Deferred income tax liabilities
Deferred income tax assets and liabilities are offset when there is a legally enforceable right to offset current tax assets against current tax liabilities and when the deferred income taxes relate to the same fiscal authority. The amounts offset are as follows:
2015 2014 £’000 £’000 Deferred tax asset to be recovered after more than 12 months (1,283) (705) Deferred tax liabilities to be recovered after more than 12 months 4,982 4,754 Deferred tax liabilities (net) 3,699 4,049
The gross movement on the Group’s deferred income tax account is as follows:
2015
Deferred tax liabilities
Deferred tax assets Net
£’000 £’000 £’000 At 1 March 2014 4,754 (705) 4,049 Credited to income statement (note 12) (71) (588) (659) (Credited) charged directly to equity (97) 10 (87) Acquisitions 396 - 396 At 28 February 2015 4,982 (1,283) 3,699
2014
Deferred tax liabilities
Deferred tax assets Net
£’000 £’000 £’000 At 1 March 2013 4,623 (609) 4,014 Credited to income statement (note 12) (1,232) (121) (1,353) (Credited) charged directly to equity (450) 25 (425) Acquisitions 1,813 - 1,813 At 28 February 2014 4,754 (705) 4,049
2015 Accelerated tax
depreciation
Share based
payments Pensions
Other timing
differences Total £’000 £’000 £’000 £’000 £’000 At 1 March 2014 2,269 (85) 614 1,251 4,049 (Credited) charged to income statement (451) (167) 84 (125) (659) Acquisitions 46 - - 350 396 (Credited) charged directly to equity - - (97) 10 (87) At 28 February 2015 1,864 (252) 601 1,486 3,699
93 Vertu Motors plc
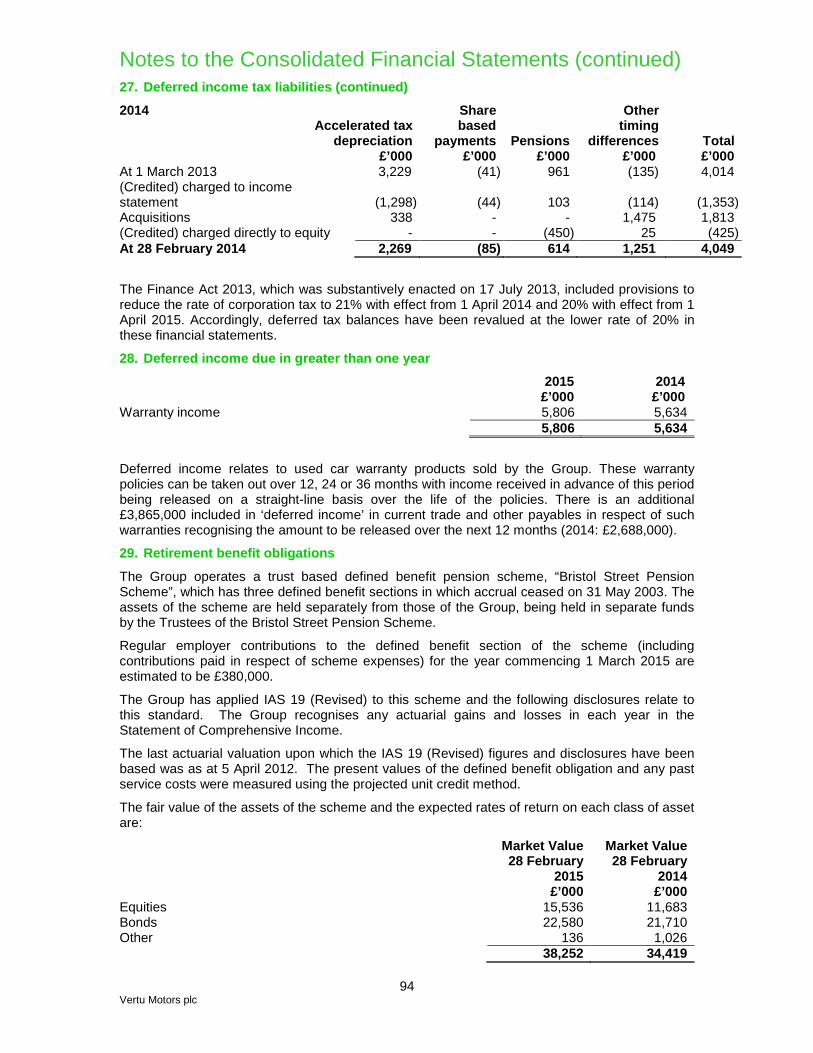
Notes to the Consolidated Financial Statements (continued) 27. Deferred income tax liabilities (continued)
2014 Accelerated tax
depreciation
Share based
payments Pensions
Other timing
differences Total £’000 £’000 £’000 £’000 £’000 At 1 March 2013 3,229 (41) 961 (135) 4,014 (Credited) charged to income statement (1,298) (44) 103 (114) (1,353) Acquisitions 338 - - 1,475 1,813 (Credited) charged directly to equity - - (450) 25 (425) At 28 February 2014 2,269 (85) 614 1,251 4,049
The Finance Act 2013, which was substantively enacted on 17 July 2013, included provisions to reduce the rate of corporation tax to 21% with effect from 1 April 2014 and 20% with effect from 1 April 2015. Accordingly, deferred tax balances have been revalued at the lower rate of 20% in these financial statements.
28. Deferred income due in greater than one year
2015 2014 £’000 £’000 Warranty income 5,806 5,634 5,806 5,634
Deferred income relates to used car warranty products sold by the Group. These warranty policies can be taken out over 12, 24 or 36 months with income received in advance of this period being released on a straight-line basis over the life of the policies. There is an additional £3,865,000 included in ‘deferred income’ in current trade and other payables in respect of such warranties recognising the amount to be released over the next 12 months (2014: £2,688,000).
29. Retirement benefit obligations
The Group operates a trust based defined benefit pension scheme, “Bristol Street Pension Scheme”, which has three defined benefit sections in which accrual ceased on 31 May 2003. The assets of the scheme are held separately from those of the Group, being held in separate funds by the Trustees of the Bristol Street Pension Scheme.
Regular employer contributions to the defined benefit section of the scheme (including contributions paid in respect of scheme expenses) for the year commencing 1 March 2015 are estimated to be £380,000.
The Group has applied IAS 19 (Revised) to this scheme and the following disclosures relate to this standard. The Group recognises any actuarial gains and losses in each year in the Statement of Comprehensive Income.
The last actuarial valuation upon which the IAS 19 (Revised) figures and disclosures have been based was as at 5 April 2012. The present values of the defined benefit obligation and any past service costs were measured using the projected unit credit method.
The fair value of the assets of the scheme and the expected rates of return on each class of asset are:
Market Value Market Value 28 February 28 February 2015 2014 £’000 £’000 Equities 15,536 11,683 Bonds 22,580 21,710 Other 136 1,026 38,252 34,419
94 Vertu Motors plc

Notes to the Consolidated Financial Statements (continued) 29. Retirement benefit obligations (continued)
In line with the requirements of IAS 19 (revised) for accounting periods commencing on or after 1 January 2013, the expected return on the assets as at 28 February 2014 was 4.3%. This is equal to the discount rate used in the calculation of the net interest income for the year ended 28 February 2015.
The overall net surplus between the assets of the Group’s defined benefit scheme and the actuarial liabilities of the scheme which have been recognised on the balance sheet is as follows:
2015 2014 £’000 £’000 Fair value of Scheme assets 38,252 34,419 Present value of funded obligations (35,249) (31,350) Asset on the balance sheet 3,003 3,069
The movements in the fair value of Scheme assets in the year are as follows:
2015 2014 £’000 £’000 Opening fair value of Scheme assets 34,419 34,177 Interest income 1,465 1,514 Actuarial gains (losses) 3,181 (188) Employer contributions 380 457 Benefits paid (1,068) (1,339) Expenses recognised in the income statement (125) (202) As at end of year 38,252 34,419
The movement in the present value of the defined benefit obligations of the Scheme in the year are as follows:
2015 2014 £’000 £’000 Opening fair value of Scheme liabilities 31,350 29,999 Interest cost 1,325 1,320 Actuarial losses 3,642 1,370 Benefits paid (1,068) (1,339) Closing fair value of Scheme liabilities 35,249 31,350
The amounts recognised in the income statement in the year are as follows:
2015 2014 £’000 £’000 Expenses 125 202 Net interest income (note 11) (140) (194) Total, included in income statement (15) 8
The actual returns on Scheme assets in the year are as follows:
2015 2014 £’000 £’000 Expected return on Scheme assets 1,465 1,514 Actuarial gains (losses) 3,181 (188) 4,646 1,326
The principal assumptions used by the independent qualified actuaries to calculate the liabilities under IAS 19 are set out below:
2015 2014 Discount rate 3.3% 4.3% Limited Price Indexation (“LPI”) pension increases 3.0% 3.2% Inflation rate 2.0% 2.3%
95 Vertu Motors plc
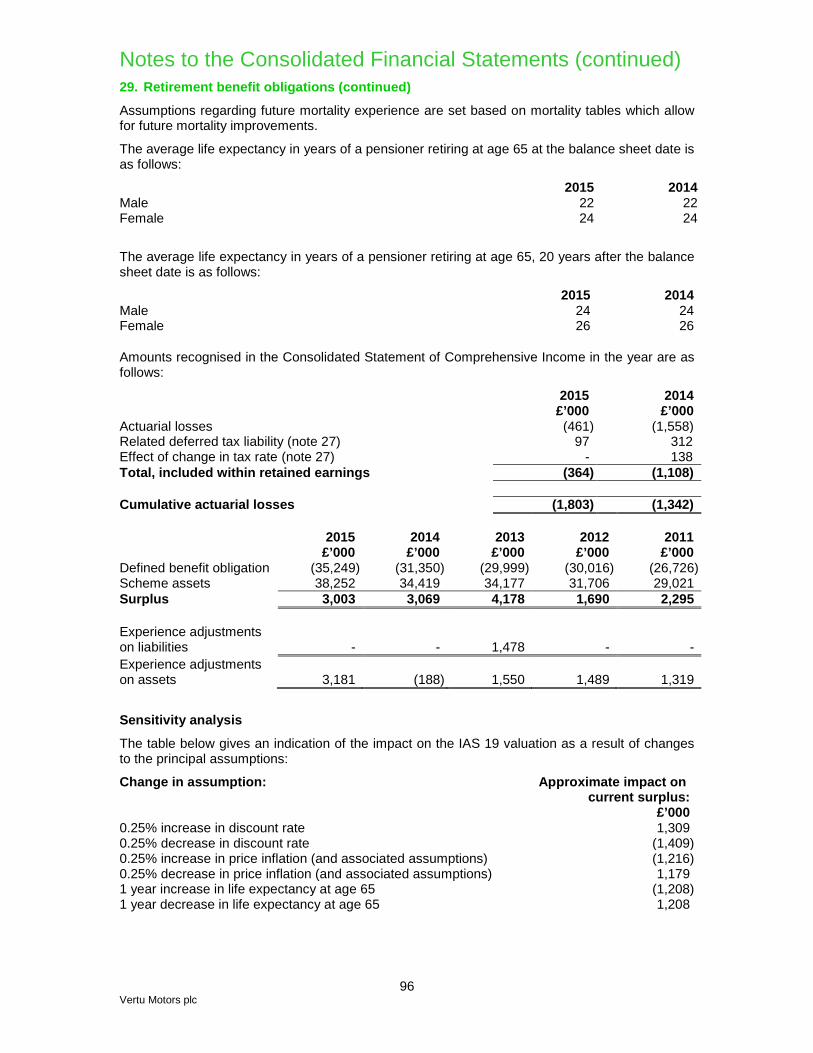
Notes to the Consolidated Financial Statements (continued) 29. Retirement benefit obligations (continued)
Assumptions regarding future mortality experience are set based on mortality tables which allow for future mortality improvements.
The average life expectancy in years of a pensioner retiring at age 65 at the balance sheet date is as follows:
2015 2014 Male 22 22 Female 24 24
The average life expectancy in years of a pensioner retiring at age 65, 20 years after the balance sheet date is as follows:
2015 2014 Male 24 24 Female 26 26
Amounts recognised in the Consolidated Statement of Comprehensive Income in the year are as follows:
2015 2014 £’000 £’000 Actuarial losses (461) (1,558) Related deferred tax liability (note 27) 97 312 Effect of change in tax rate (note 27) - 138 Total, included within retained earnings (364) (1,108) Cumulative actuarial losses (1,803) (1,342) 2015 2014 2013 2012 2011 £’000 £’000 £’000 £’000 £’000 Defined benefit obligation (35,249) (31,350) (29,999) (30,016) (26,726) Scheme assets 38,252 34,419 34,177 31,706 29,021 Surplus 3,003 3,069 4,178 1,690 2,295
Experience adjustments on liabilities
-
-
1,478
-
-
Experience adjustments on assets
3,181
(188)
1,550
1,489
1,319
Sensitivity analysis
The table below gives an indication of the impact on the IAS 19 valuation as a result of changes to the principal assumptions:
Change in assumption: Approximate impact on current surplus:
£’000 0.25% increase in discount rate 1,309 0.25% decrease in discount rate (1,409) 0.25% increase in price inflation (and associated assumptions) (1,216) 0.25% decrease in price inflation (and associated assumptions) 1,179 1 year increase in life expectancy at age 65 (1,208) 1 year decrease in life expectancy at age 65 1,208
96 Vertu Motors plc

Notes to the Consolidated Financial Statements (continued) 30. Ordinary shares, share premium and other reserves
2015 Ordinary shares of 10p each
Number of Shares
Ordinary shares
Share premium
Other reserve
Total
(‘000) £’000 £’000 £’000 £’000 At 1 March 2014 336,783 33,678 96,729 8,820 139,227 Shares issued during the year 371 38 81 - 119 Shares issued as consideration for business acquisitions 3,754 375 - 1,825 2,200 At 28 February 2015 340,908 34,091 96,810 10,645 141,546
The other reserve is a merger reserve, arising from shares issued for shares, as consideration to the former shareholders of acquired businesses.
2014 Ordinary shares of 10p each
Shares
Number of Shares
Ordinary shares
Share premium
to be issued
Other reserve
Total
(‘000) £’000 £’000 £’000 £’000 £’000 At 1 March 2013 200,076 20,008 60,727 2,000 8,820 91,555 Shares issued during the year 136,707 13,670 38,330 (2,000) - 50,000 Costs associated with issuance of ordinary shares - - (2,328) - - (2,328) At 28 February 2014 336,783 33,678 96,729 - 8,820 139,227 Share Option Schemes
Under the Group’s equity-settled share option schemes, share options are granted to Executive Directors and to selected employees. The exercise price of the granted CSOP options is equal to the market price of the shares on the date of the grant; £Nil in the case of options issued under the long term incentive plan (“LTIP”) Scheme. Options are conditional on the employee completing three years’ service (the vesting period). The options are exercisable starting three years from grant date, subject to the performance criteria set out below. The Group has no legal or constructive obligation to repurchase or settle the options in cash.
As disclosed in the Consolidated Income Statement on page 60 a share based payments charge of £645,000 (2014: £195,000) has been recognised during the year, in relation to the schemes as described below.
97 Vertu Motors plc
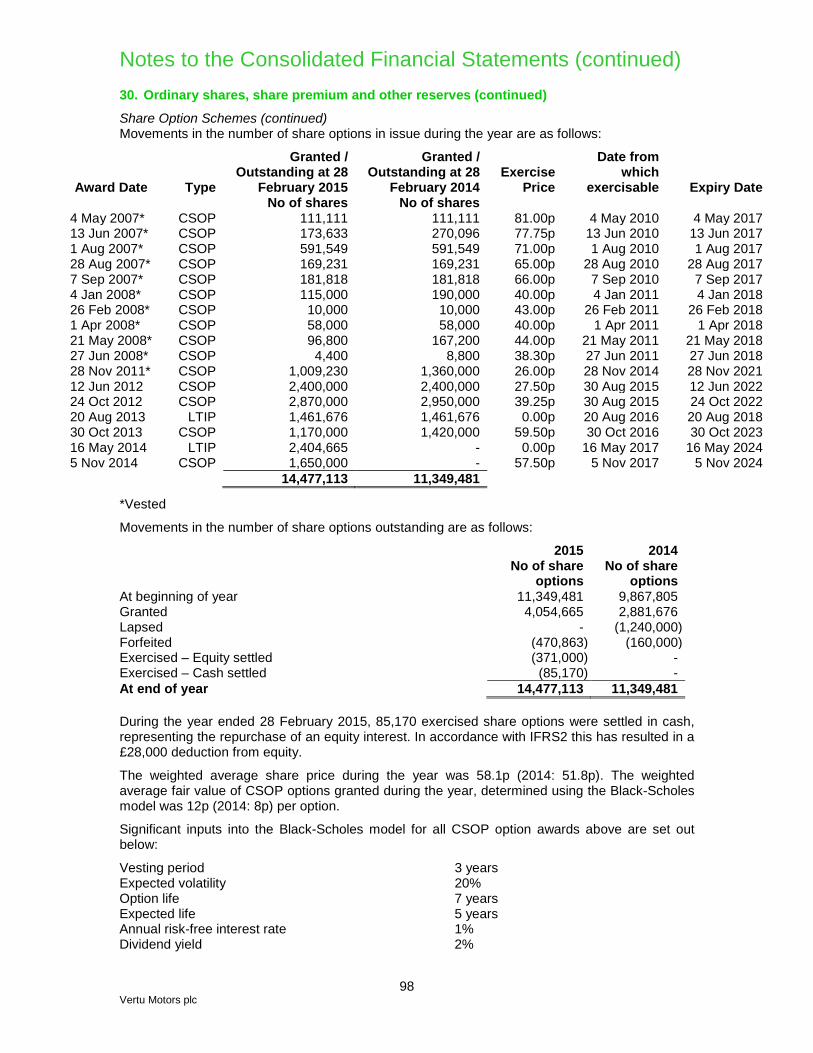
Notes to the Consolidated Financial Statements (continued) 30. Ordinary shares, share premium and other reserves (continued)
Share Option Schemes (continued) Movements in the number of share options in issue during the year are as follows:
Award Date
Type
Granted / Outstanding at 28
February 2015 No of shares
Granted / Outstanding at 28
February 2014 No of shares
Exercise
Price
Date from which
exercisable
Expiry Date
4 May 2007* CSOP 111,111 111,111 81.00p 4 May 2010 4 May 2017 13 Jun 2007* CSOP 173,633 270,096 77.75p 13 Jun 2010 13 Jun 2017 1 Aug 2007* CSOP 591,549 591,549 71.00p 1 Aug 2010 1 Aug 2017 28 Aug 2007* CSOP 169,231 169,231 65.00p 28 Aug 2010 28 Aug 2017 7 Sep 2007* CSOP 181,818 181,818 66.00p 7 Sep 2010 7 Sep 2017 4 Jan 2008* CSOP 115,000 190,000 40.00p 4 Jan 2011 4 Jan 2018 26 Feb 2008* CSOP 10,000 10,000 43.00p 26 Feb 2011 26 Feb 2018 1 Apr 2008* CSOP 58,000 58,000 40.00p 1 Apr 2011 1 Apr 2018 21 May 2008* CSOP 96,800 167,200 44.00p 21 May 2011 21 May 2018 27 Jun 2008* CSOP 4,400 8,800 38.30p 27 Jun 2011 27 Jun 2018 28 Nov 2011* CSOP 1,009,230 1,360,000 26.00p 28 Nov 2014 28 Nov 2021 12 Jun 2012 CSOP 2,400,000 2,400,000 27.50p 30 Aug 2015 12 Jun 2022 24 Oct 2012 20 Aug 2013
CSOP LTIP
2,870,000 1,461,676
2,950,000 1,461,676
39.25p 0.00p
30 Aug 2015 20 Aug 2016
24 Oct 2022 20 Aug 2018
30 Oct 2013 CSOP 1,170,000 1,420,000 59.50p 30 Oct 2016 30 Oct 2023 16 May 2014 LTIP 2,404,665 - 0.00p 16 May 2017 16 May 2024 5 Nov 2014 CSOP 1,650,000 - 57.50p 5 Nov 2017 5 Nov 2024 14,477,113 11,349,481
*Vested
Movements in the number of share options outstanding are as follows:
2015 2014 No of share
options No of share
options At beginning of year 11,349,481 9,867,805 Granted 4,054,665 2,881,676 Lapsed - (1,240,000) Forfeited (470,863) (160,000) Exercised – Equity settled (371,000) - Exercised – Cash settled (85,170) - At end of year 14,477,113 11,349,481 During the year ended 28 February 2015, 85,170 exercised share options were settled in cash, representing the repurchase of an equity interest. In accordance with IFRS2 this has resulted in a £28,000 deduction from equity.
The weighted average share price during the year was 58.1p (2014: 51.8p). The weighted average fair value of CSOP options granted during the year, determined using the Black-Scholes model was 12p (2014: 8p) per option.
Significant inputs into the Black-Scholes model for all CSOP option awards above are set out below:
Vesting period 3 years Expected volatility 20% Option life 7 years Expected life 5 years Annual risk-free interest rate 1% Dividend yield 2%
98 Vertu Motors plc

Notes to the Consolidated Financial Statements (continued)
30. Ordinary shares, share premium and other reserves (continued)
Share Option Schemes (continued) The weighted average fair value of LTIP options granted during the year, determined using the Black-Scholes model was 50p per option. Significant inputs into the Black-Scholes model for the LTIP option awards above are set out below:
Vesting period 3 years Expected volatility 20% Option life 2 years Expected life 5 years Annual risk-free interest rate 1% Dividend yield 2% The volatility measured at the standard deviation of continuously compounded share returns is based on statistical analysis of daily share prices since the admission of Vertu Motors plc to AiM. This is then adjusted for events not considered to be reflective of the volatility of the share price going forward. The performance conditions attaching to any share options issued to Executive Directors, Senior Management or colleagues of the Company are considered and set by the Remuneration Committee. The following share incentive schemes are operated by the Company: a) Share Incentive Plan (“SIP”)
The SIP was introduced in accordance with appropriate legislation and it allows colleagues to invest in partnership shares out of gross salary. A participant may withdraw from the SIP at any time but if he does so before the partnership shares have been held in trust for five years (except in certain specified circumstances such as redundancy or disability) he will incur an income tax liability. The Company currently do not supplement or match the partnership shares acquired by colleagues.
b) Company Share Option Plan (“CSOP”) Approved and Unapproved Share Option Schemes
The number of vested options issued prior to 28 November 2011, which remain outstanding are shown in the table on page 98.
The CSOP options issued on 12 June 2012 may only be exercised if the average share price of the Company over any continuous period of 30 days between 1 August 2015 and 31 July 2016 is above 38p. If the share price is between 38p and 45p then a pro-rata proportion of between 50% and 100% of the options vest. At an average share price of below 38p then none of the options are exercisable.
The CSOP options issued on 24 October 2012 may only be exercised if the average share price of the Company over any continuous period of 30 days between 1 August 2015 and 31 July 2016 is above 45p. If the share price is between 45p and 49p then a pro-rata proportion of between 50% and 100% of the options vest. At an average share price of below 45p then none of the options are exercisable
The CSOP options issued on 30 October 2013 may only be exercised if the average share price of the Company over at least one continuous period of 30 days between 1 August 2016 and 31 July 2017 is above 70p and then 100% of the options vest. At an average share price of below 70p none of the options are exercisable.
99 Vertu Motors plc

Notes to the Consolidated Financial Statements (continued) 30. Ordinary shares, share premium and other reserves (continued)
Share Option Schemes (continued)
b) Company Share Option Plan (“CSOP”) Approved and Unapproved Share Option Schemes (continued)
The following CSOP share options were issued during the financial year to 28 February 2015, none of these options were issued to the executive directors of Vertu Motors plc.
1,650,000 CSOP options were issued on 5 November 2014. These options may only be exercised if the average share price of the Company over at least one continuous period of 30 days between 1 August 2017 and 31 July 2018 is above 70p and then 100% of the options vest. At an average share price of below 70p none of the options are exercisable.
b) Long Term Incentive Plan (“LTIP”)
In August 2013 long-term incentive awards of 1,461,676 shares were made to Executive Directors and Senior Managers under the Long Term Incentive Plan (“LTIP”) which may vest in August 2016. During the year ended 28 February 2015, a further 2,404,665 long-term incentive awards were issued to Executive Directors and Senior Managers. The awards were granted on 16 May 2014 and may vest in May 2017.
Both tranches of awards took the form of £Nil value share options where the vesting is subject to targets based on the achievement of absolute growth in the Company’s total shareholder return (‘TSR’), and relative growth in TSR against FTSE small cap index (excluding investment trusts). Further detail on the vesting conditions is given in the Directors Remuneration Report on page 55 of the Financial Statements. 31. Hedging reserve
The hedging reserve comprises cash flow hedges in relation to interest rate swap derivatives. The movements on the hedging reserve are as follows:
2015 2014 £’000 £’000 At beginning of year (56) (133) Fair value gains on derivative financial instruments during the year 49 102 Deferred taxation on fair value gains during year (10) (25) At end of year (17) (56)
100 Vertu Motors plc
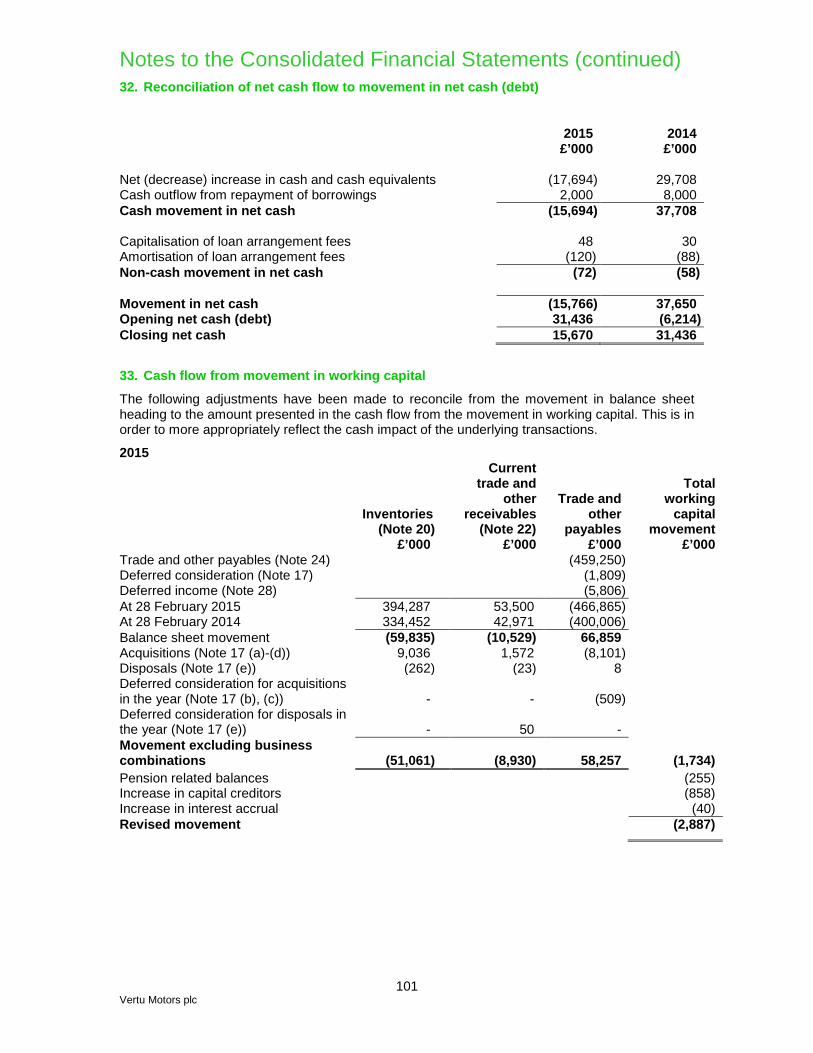
Notes to the Consolidated Financial Statements (continued) 32. Reconciliation of net cash flow to movement in net cash (debt)
2015 2014 £’000 £’000 Net (decrease) increase in cash and cash equivalents (17,694) 29,708 Cash outflow from repayment of borrowings 2,000 8,000 Cash movement in net cash (15,694) 37,708 Capitalisation of loan arrangement fees 48 30 Amortisation of loan arrangement fees (120) (88) Non-cash movement in net cash (72) (58) Movement in net cash (15,766) 37,650 Opening net cash (debt) 31,436 (6,214) Closing net cash 15,670 31,436
33. Cash flow from movement in working capital
The following adjustments have been made to reconcile from the movement in balance sheet heading to the amount presented in the cash flow from the movement in working capital. This is in order to more appropriately reflect the cash impact of the underlying transactions.
2015
Inventories (Note 20)
£’000
Current trade and
other receivables
(Note 22) £’000
Trade and other
payables £’000
Total
working capital
movement £’000
Trade and other payables (Note 24) (459,250) Deferred consideration (Note 17) (1,809) Deferred income (Note 28) (5,806) At 28 February 2015 394,287 53,500 (466,865) At 28 February 2014 334,452 42,971 (400,006) Balance sheet movement (59,835) (10,529) 66,859 Acquisitions (Note 17 (a)-(d)) 9,036 1,572 (8,101) Disposals (Note 17 (e)) (262) (23) 8 Deferred consideration for acquisitions in the year (Note 17 (b), (c))
-
-
(509)
Deferred consideration for disposals in the year (Note 17 (e))
-
50
-
Movement excluding business combinations
(51,061)
(8,930)
58,257
(1,734)
Pension related balances (255) Increase in capital creditors (858) Increase in interest accrual (40) Revised movement (2,887)
101 Vertu Motors plc
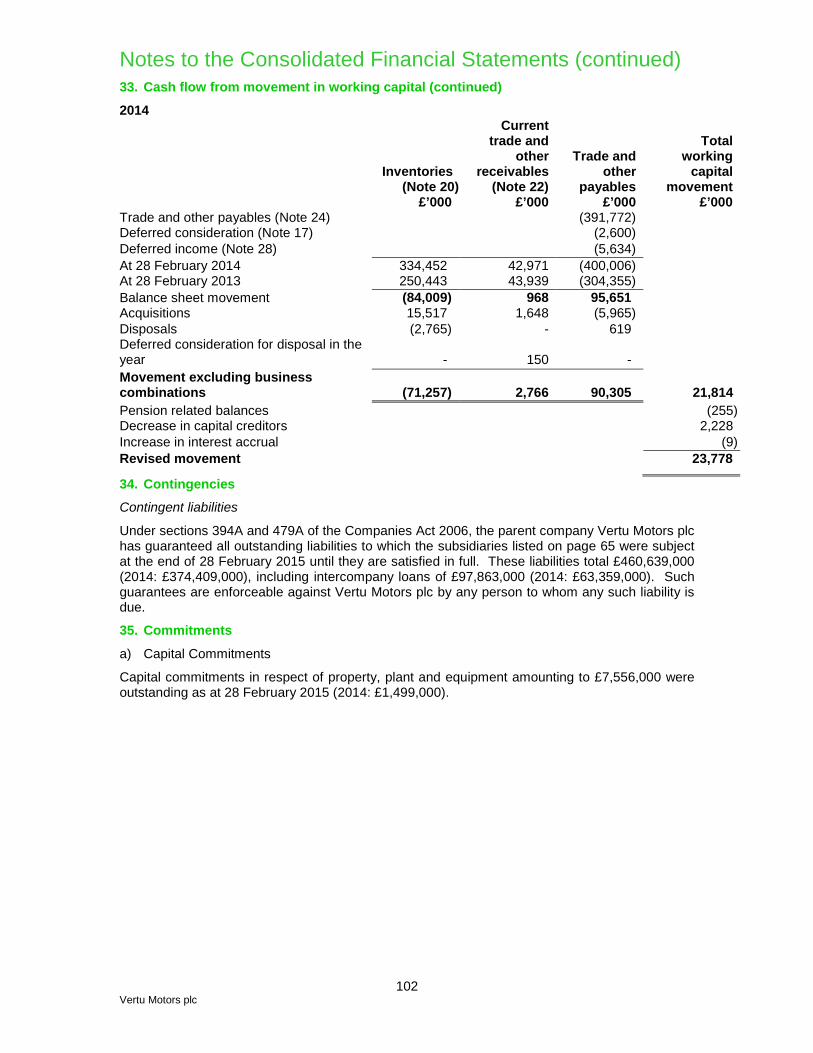
Notes to the Consolidated Financial Statements (continued) 33. Cash flow from movement in working capital (continued)
2014
Inventories (Note 20)
£’000
Current trade and
other receivables
(Note 22) £’000
Trade and other
payables £’000
Total
working capital
movement £’000
Trade and other payables (Note 24) (391,772) Deferred consideration (Note 17) (2,600) Deferred income (Note 28) (5,634) At 28 February 2014 334,452 42,971 (400,006) At 28 February 2013 250,443 43,939 (304,355) Balance sheet movement (84,009) 968 95,651 Acquisitions 15,517 1,648 (5,965) Disposals (2,765) - 619 Deferred consideration for disposal in the year
-
150
-
Movement excluding business combinations
(71,257)
2,766
90,305
21,814
Pension related balances (255) Decrease in capital creditors 2,228 Increase in interest accrual (9) Revised movement 23,778
34. Contingencies
Contingent liabilities
Under sections 394A and 479A of the Companies Act 2006, the parent company Vertu Motors plc has guaranteed all outstanding liabilities to which the subsidiaries listed on page 65 were subject at the end of 28 February 2015 until they are satisfied in full. These liabilities total £460,639,000 (2014: £374,409,000), including intercompany loans of £97,863,000 (2014: £63,359,000). Such guarantees are enforceable against Vertu Motors plc by any person to whom any such liability is due.
35. Commitments
a) Capital Commitments
Capital commitments in respect of property, plant and equipment amounting to £7,556,000 were outstanding as at 28 February 2015 (2014: £1,499,000).
102 Vertu Motors plc
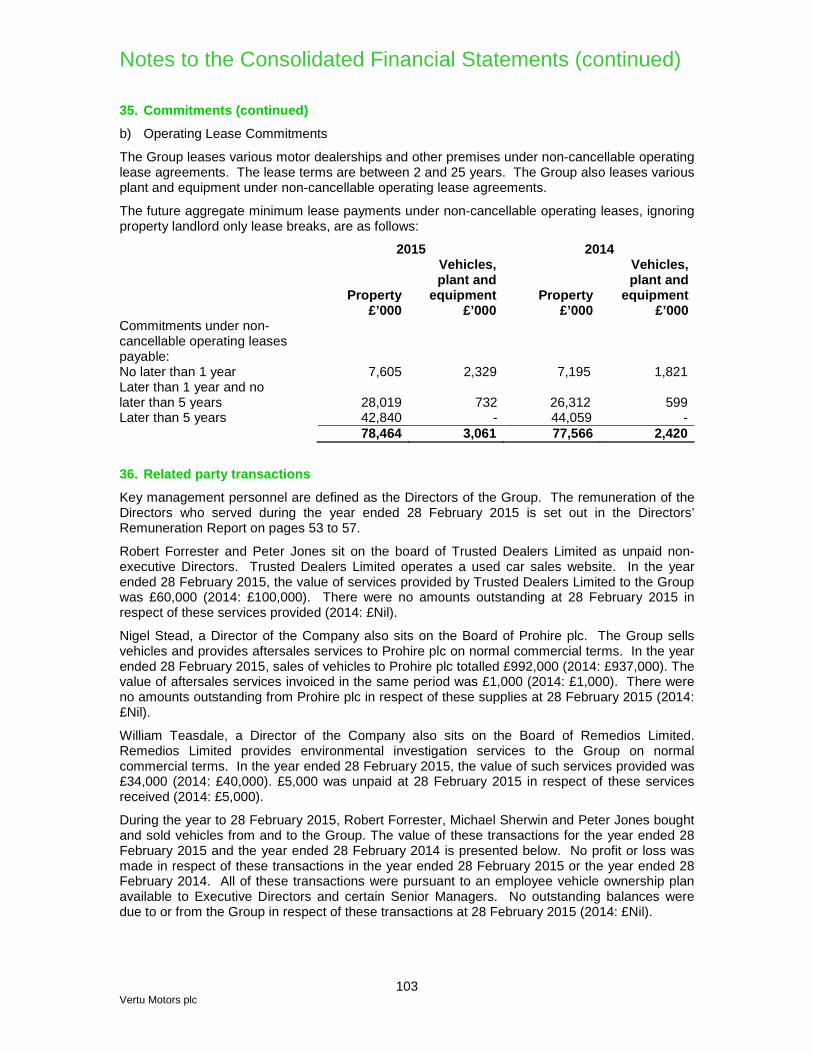
Notes to the Consolidated Financial Statements (continued)
35. Commitments (continued)
b) Operating Lease Commitments
The Group leases various motor dealerships and other premises under non-cancellable operating lease agreements. The lease terms are between 2 and 25 years. The Group also leases various plant and equipment under non-cancellable operating lease agreements.
The future aggregate minimum lease payments under non-cancellable operating leases, ignoring property landlord only lease breaks, are as follows:
2015 2014
Property
Vehicles, plant and
equipment
Property
Vehicles, plant and
equipment £’000 £’000 £’000 £’000 Commitments under non-cancellable operating leases payable:
No later than 1 year 7,605 2,329 7,195 1,821 Later than 1 year and no later than 5 years
28,019 732
26,312 599
Later than 5 years 42,840 - 44,059 - 78,464 3,061 77,566 2,420
36. Related party transactions
Key management personnel are defined as the Directors of the Group. The remuneration of the Directors who served during the year ended 28 February 2015 is set out in the Directors’ Remuneration Report on pages 53 to 57.
Robert Forrester and Peter Jones sit on the board of Trusted Dealers Limited as unpaid non-executive Directors. Trusted Dealers Limited operates a used car sales website. In the year ended 28 February 2015, the value of services provided by Trusted Dealers Limited to the Group was £60,000 (2014: £100,000). There were no amounts outstanding at 28 February 2015 in respect of these services provided (2014: £Nil).
Nigel Stead, a Director of the Company also sits on the Board of Prohire plc. The Group sells vehicles and provides aftersales services to Prohire plc on normal commercial terms. In the year ended 28 February 2015, sales of vehicles to Prohire plc totalled £992,000 (2014: £937,000). The value of aftersales services invoiced in the same period was £1,000 (2014: £1,000). There were no amounts outstanding from Prohire plc in respect of these supplies at 28 February 2015 (2014: £Nil).
William Teasdale, a Director of the Company also sits on the Board of Remedios Limited. Remedios Limited provides environmental investigation services to the Group on normal commercial terms. In the year ended 28 February 2015, the value of such services provided was £34,000 (2014: £40,000). £5,000 was unpaid at 28 February 2015 in respect of these services received (2014: £5,000).
During the year to 28 February 2015, Robert Forrester, Michael Sherwin and Peter Jones bought and sold vehicles from and to the Group. The value of these transactions for the year ended 28 February 2015 and the year ended 28 February 2014 is presented below. No profit or loss was made in respect of these transactions in the year ended 28 February 2015 or the year ended 28 February 2014. All of these transactions were pursuant to an employee vehicle ownership plan available to Executive Directors and certain Senior Managers. No outstanding balances were due to or from the Group in respect of these transactions at 28 February 2015 (2014: £Nil).
103 Vertu Motors plc

Notes to the Consolidated Financial Statements (continued) 36. Related party transactions (continued)
2015 Bought from the Group Sold to the Group
Number of
vehicles Purchase
price Number of
vehicles Sale price £’000 £’000 Robert Forrester 4 226 4 222 Michael Sherwin 4 203 3 157 Peter Jones 1 98 - - 2014 Bought from the Group Sold to the Group
Number of
vehicles Purchase
price Number of
vehicles Sale price £’000 £’000 Robert Forrester 4 192 2 81 Michael Sherwin 2 108 1 45 37. Post balance sheet events
On 30 March 2015, the Group refinanced its borrowing facilities, converting the £15.0m acquisition facility (available until September 2016) into a committed £20.0m acquisition facility which can be increased to £40.0m (extension currently uncommitted) and available until 31 March 2019. The overdraft and other money market facilities of £35m were increased to £45m and are available until 31 March 2016. The interest rates on these refinanced facilities are all more favourable to the Group than those on the former facilities. On 31 March 2015, the Group closed a small sales outlet representing Suzuki in Mansfield and one of the peripheral sales outlets of the Bolton Ford business acquired in November 2014. On 10 April 2015, the Group also closed a small Peugeot sales outlet in Ilkeston. There were no significant costs associated with these closures. On 24 April 2015, the Group disposed of the second peripheral freehold sales outlet acquired with the Bolton Ford business in November 2014, for a consideration of £0.7m, which equates to the net book value of this property. On 30 April 2015 the Group exchanged contracts to acquire the business and certain assets of Bradford Jaguar from a subsidiary of Jardine Motors Group. The estimated consideration for this leasehold acquisition is £0.9m including goodwill of £0.75m. On 30 April 2015 the Group acquired the business and certain assets of Bury Land Rover from a subsidiary of Pendragon PLC. The total consideration for this leasehold acquisition was £7.0m including goodwill of £7.0m. The consideration for both of these acquisitions has been settled from the Group’s existing cash resources.
104 Vertu Motors plc

Independent Auditors’ Report to the members of Vertu Motors Plc Report on the parent company financial statements
Our opinion
In our opinion, Vertu Motors plc’s parent company financial statements (the “Financial Statements”):
• give a true and fair view of the state of the parent company’s affairs as at 28 February 2015;
• have been properly prepared in accordance with United Kingdom Generally Accepted Accounting Practice; and
• have been prepared in accordance with the requirements of the Companies Act 2006.
What we have audited Vertu Motors plc’s Financial statements comprise:
• the company balance sheet as at 28 February 2015; and • the notes to the financial statements, which include a summary of significant accounting
policies and other explanatory information.
Certain required disclosures have been presented elsewhere in the Annual Report and Financial Statements, rather than in the notes to the Financial Statements. These are cross referenced from the Financial Statements and are identified as audited.
The financial reporting framework that has been applied in the preparation of the Financial Statements is applicable law and United Kingdom Accounting Standards (United Kingdom Generally Accepted Accounting Practice). In applying the financial reporting framework, the directors have made a number of subjective judgements, for example in respect of significant accounting estimates. In making such estimates, they have made assumptions and considered future events.
Opinion on other matter prescribed by the Companies Act 2006
In our opinion the information given in the Strategic Report and the Directors’ Report for the financial year for which the Financial Statements are prepared is consistent with the Financial Statement
Other matters on which we are required to report by exception
Adequacy of accounting records and information and explanations received Under the Companies Act 2006 we are required to report to you if, in our opinion:
• we have not received all the information and explanations we require for our audit; or • adequate accounting records have not been kept by the parent company, or returns
adequate for our audit have not been received from branches not visited by us; or • the Financial Statements are not in agreement with the accounting records and returns.
We have no exceptions to report arising from this responsibility.
Directors’ remuneration Under the Companies Act 2006 we are required to report to you if, in our opinion, certain disclosures of directors’ remuneration specified by law are not made. We have no exceptions to report arising from this responsibility.
105 Vertu Motors plc

Independent Auditors’ Report to the members of Vertu Motors Plc (continued) Responsibilities for the financial statements and the audit
Our responsibilities and those of the directors As explained more fully in the Statement of the Directors’ Responsibilities set out on page 33 and 34, the directors are responsible for the preparation of the Financial Statements and for being satisfied that they give a true and fair view.
Our responsibility is to audit and express an opinion on the Financial Statements in accordance with applicable law and International Standards on Auditing (UK and Ireland) (“ISAs (UK & Ireland)”). Those standards require us to comply with the Auditing Practices Board’s Ethical Standards for Auditors.
This report, including the opinions, has been prepared for and only for the company’s members as a body in accordance with Chapter 3 of Part 16 of the Companies Act 2006 and for no other purpose. We do not, in giving these opinions, accept or assume responsibility for any other purpose or to any other person to whom this report is shown or into whose hands it may come save where expressly agreed by our prior consent in writing.
What an audit of financial statements involves
We conducted our audit in accordance with ISAs (UK & Ireland). An audit involves obtaining evidence about the amounts and disclosures in the financial statements sufficient to give reasonable assurance that the financial statements are free from material misstatement, whether caused by fraud or error.
This includes an assessment:
• whether the accounting policies are appropriate to the parent company’s circumstances and have been consistently applied and adequately disclosed;
• the reasonableness of significant accounting estimates made by the directors; and
• the overall presentation of the Financial Statements.
We primarily focus our work in these areas by assessing the directors’ judgements against available evidence, forming our own judgements, and evaluating the disclosures in the financial statements.
We test and examine information, using sampling and other auditing techniques, to the extent we consider necessary to provide a reasonable basis for us to draw conclusions. We obtain audit evidence through testing the effectiveness of controls, substantive procedures or a combination of both.
In addition, we read all the financial and non-financial information in the Annual Report and Financial Statements to identify material inconsistencies with the audited Financial Statements and to identify any information that is apparently materially incorrect based on, or materially inconsistent with, the knowledge acquired by us in the course of performing the audit. If we became aware of any apparent material misstatements or inconsistencies we consider the implications for our report.
Other matter
We have reported separately on the Group financial statements of Vertu Motors plc for the year ended 28 February 2015. Randal Casson (Senior Statutory Auditor) for and on behalf of PricewaterhouseCoopers LLP Chartered Accountants and Statutory Auditors Leeds 13 May 2015
106 Vertu Motors plc

Company Balance Sheet As at 28 February 2015 2015 2014 Note £’000 £’000 Fixed assets Tangible assets 2 2,415 2,305 Investments 3 98,189 88,105 Loans to Group undertakings 4 - 3,000 100,604 93,410 Current assets Debtors
- due within one year 5 97,172 73,588 - due after one year 5 - 192
Cash at bank and in hand 30,483 39,930 Total current assets 127,655 113,710 Creditors: amounts falling due within one year 7 (55,217) (45,542) Net current assets 72,438 68,168 Total assets less current liabilities 173,042 161,578 Creditors: amounts falling due after more than one year 8 (6,098) (10,354) Net assets 166,944 151,224 Capital and reserves Called up share capital 11 34,091 33,678 Share premium account 11 96,810 96,729 Other reserve 11 10,645 8,820 Hedging reserve 12 (17) (56) Profit and loss account 13 25,415 12,053 Total shareholders’ funds 15 166,944 151,224 These financial statements, on pages 107 and 119, have been approved for issue by the Board of Directors on 13 May 2015: Robert Forrester Michael Sherwin Chief Executive Finance Director
107 Vertu Motors plc

Notes to the Company Financial Statements The separate financial statements of Vertu Motors plc, the parent undertaking, are presented as required by the Companies Act 2006. As permitted by that Act, the separate financial statements have been prepared in accordance with United Kingdom Generally Accepted Accounting Practice (UK GAAP).
1. Accounting Policies
Basis of preparation
The financial statements have been prepared on the going concern basis under the historical cost convention as modified by the revaluation of derivative financial instruments to fair value and in accordance with Companies Act 2006 and applicable accounting standards in the United Kingdom. The principal accounting policies, which have been consistently applied throughout the year, are set out below.
No profit and loss account is presented by the Company, as permitted under section 408 of the Companies Act 2006. The profit of the Company for the year ended 28 February 2015 was £15,640,000 (2014: £9,566,000).
The consolidated financial statements include the results of all subsidiaries wholly owned by Vertu Motors plc as listed on page 112 and 113 of these financial statements. Certain of these subsidiaries, which are listed below, have taken the exemption from an audit for the year ended 28 February 2015 by virtue of s479A of Companies Act 2006. Certain other subsidiaries, which are also listed below, have taken the exemption from preparing individual accounts for the year ended 28 February 2015 by virtue of s394A of Companies Act 2006. In order to allow these subsidiaries to take the audit exemption or exemption from the preparation of individual accounts (as appropriate), the Company has given a statutory guarantee of all the outstanding liabilities as at 28 February 2015 of the subsidiaries listed below, further detail of which is provided in note 34 to the consolidated financial statements on page 102.
The subsidiaries which have taken an exemption from an audit for the year ended 28 February 2015 by virtue of s479A Companies Act 2006 are:
Bristol Street Commercials (Italia) Limited Macklin Property Limited Bristol Street First Investments Limited Tyne Tees Finance Limited Bristol Street Fourth Investments Limited Vertu Motors (Property) Limited Brookside (1998) Limited Albert Farnell Limited Newbolds Garage (Mansfield) Limited Grantham Motor Company Limited Nottingham TPS LLP
The subsidiaries which have taken an exemption from the preparation of individual accounts in respect of the year ended 28 February 2015 by virtue of s394A of Companies Act 2006 are:
Blake Holdings Limited National Allparts Limited Bristol Street (No.1) Limited Peter Blake (Chatsworth) Limited Bristol Street (No.2) Limited Peter Blake (Clumber) Limited Bristol Street Fifth Investments Limited Peter Blake Limited Bristol Street Fleet Services Limited Typocar Limited Bristol Street Group Limited Vertu Fleet Limited Bristol Street Limited Vertu Motors (Finance) Limited BSH Pension Trustee Limited Vertu Motors (Retail) Limited Merifield Properties Limited Boydslaw 103 Limited Motor Nation Car Hypermarkets Limited Widnes Car Centre (1994) Limited Dunfermline Autocentre Limited Widnes Car Centre Limited Vertu Motors (Pity Me) Limited Compare Click Call Limited Vertu Motors (Durham) Limited Dobies (Carlisle) Limited Vertu Motors (AMC) Limited K C Mobility Solutions Limited
The auditors’ remuneration for audit and other services was £25,000 (2014: £25,000).
108 Vertu Motors plc

Notes to the Company Financial Statements (continued) 1. Accounting Policies (continued)
Tangible fixed assets
Tangible fixed assets are stated at cost less accumulated depreciation and any impairment in value. Cost includes expenditure that is directly attributable to the acquisition of the asset. Depreciation is provided at rates calculated to write off the cost of tangible fixed assets less their estimated residual values, on a straight-line basis over their estimated useful lives as follows:
Computer equipment 16.6% - 50% Office equipment 25% Investments
Investments in subsidiary undertakings are stated at cost, less provision for impairment.
Deferred taxation
Deferred tax is recognised in respect of all timing differences that have originated but not reversed at the balance sheet date where transactions or events that result in an obligation to pay more tax in the future or a right to pay less tax in the future have occurred at the balance sheet date. Timing differences are differences between the Company’s taxable profits and its results as stated in the financial statements that arise from the inclusion of gains and losses in tax assessments in years different from those in which they are recognised in the financial statements.
A net deferred tax asset is regarded as recoverable and therefore recognised only to the extent that, on the basis of all available evidence, it can be regarded as more likely than not that there will be sufficient taxable profits from which the future reversal of the underlying timing differences can be deducted.
Deferred tax is not recognised when fixed assets are sold and it is more likely than not that the taxable gain will be rolled over, being charged to tax only if and when the replacement assets are sold.
Deferred tax is measured at the average tax rates that are expected to apply in the years in which the timing differences are expected to reverse based on tax rates and laws that have been enacted or substantively enacted by the balance sheet date. Deferred tax is measured on a non-discounted basis.
Deferred income
Deferred income is in relation to vehicle warranty product income. The Group sells used vehicle warranty policies which are in house products that can be taken out over 12, 24 or 36 months with income received on inception of the policy. The policy covers replacement of mechanical and electrical parts which have suffered a mechanical breakdown, the cost of labour to fit failed parts and breakdown assistance for the period of the warranty. When the income is received it is recognised initially as deferred income and is released to the income statement on a straight-line basis over the life of each warranty policy.
109 Vertu Motors plc
Notes to the Company Financial Statements (continued) 1. Accounting Policies (continued)
Revenue
Revenue is recognised to the extent that it is probable that the economic benefits will flow to the Company and the revenue can be reliably measured. In practice this means that revenue is recognised when a service has been undertaken.
Share based payments
The Company allows employees to acquire shares of the Company through share option schemes. The fair value of share options granted is recognised as an employee expense with a corresponding increase in equity. The Company operates a number of equity-settled, share-based compensation plans. The total amount to be expensed over the vesting period is determined by reference to the fair value of the options granted, excluding the impact of any non-market vesting conditions (for example, profitability and sales growth targets).
Non-market vesting conditions are included in assumptions about the number of options that are expected to vest. At each balance sheet date, the entity revises its estimates of the number of options that are expected to vest. It recognises the impact of the revision to original estimates, if any, in the profit and loss account, with a corresponding adjustment to equity.
The proceeds received net of any directly attributable transaction costs are credited to share capital (nominal value) and share premium when the options are exercised.
Derivative financial instruments
The Company uses derivative financial instruments to reduce the exposure to interest rate movements. The Company does not hold or issue derivative financial instruments for speculative purposes.
Derivative financial instruments are initially recognised at fair value on the date a derivative contract is entered into and are subsequently remeasured at their fair value.
The Company documents at the inception of the transaction the relationship between hedging instruments and hedged items, as well as its risk management objectives and strategy for undertaking various hedging transactions. The Company also documents its assessment, both at hedge inception and on an ongoing basis, of whether the derivatives that are used in hedging transactions are highly effective in offsetting changes in fair values or cash flows of hedged items.
The fair values of derivative financial instruments used for hedging purposes are disclosed in note 9. Movements on the hedging reserve are shown in note 12. The full fair value of a hedging derivative is classified as a non-current asset or liability when the remaining hedged item is more than 12 months and as a current asset or liability when the remaining maturity of the hedged item is less than 12 months. Any trading derivatives are classified as a current asset or liability.
The Company is exempt from providing the required disclosures of FRS 29 (“Financial Instruments: Disclosures”) by virtue of the fact that the required disclosures are included in note 26 of the consolidated Group financial statements on page 92.
Cash flow hedges
The effective portion of changes in the fair value of derivatives that are designated and qualify as cash flow hedges is recognised in equity in the hedging reserve. Any gain or loss relating to the ineffective portion is recognised immediately in the profit and loss account within finance income or expense.
110 Vertu Motors plc

Notes to the Company Financial Statements (continued) 1. Accounting Policies (continued)
Derivative financial instruments (continued)
Cash flow hedges (continued)
Amounts accumulated in equity are recycled in the profit and loss account in the years when the hedged item affects profit and loss. The gain or loss relating to the effective portion of interest rate swaps hedging variable rate borrowings is recognised in the profit and loss account within ‘finance costs’. The gain or loss relating to the ineffective portion is recognised in the profit and loss account within finance income or expense.
When a hedging instrument expires or is sold, or when a hedge no longer meets the criteria for hedge accounting, any cumulative gain or loss existing in equity at that time remains in equity and is recognised when the forecast transaction is ultimately recognised in the profit and loss account. When a forecast transaction is no longer expected to occur, the cumulative gain or loss that was reported within equity is immediately transferred to the profit and loss account within finance income or expense.
Leases
Leases in which a significant portion of the risks and rewards of ownership are retained by the lessor are classified as operating leases. Payments made under operating leases (net of any incentives received from the lessor) are charged to the profit and loss account on a straight-line basis over the period of the lease.
2. Tangible assets
Computer equipment
Office equipment
Total
£’000 £’000 £’000 Cost At 1 March 2014 5,393 358 5,751 Additions 1,036 54 1,090 Disposals (19) - (19) Intercompany transfers 161 - 161 At 28 February 2015 6,571 412 6,983 Accumulated Depreciation At 1 March 2014 3,204 242 3,446 Depreciation charge 1,012 59 1,071 Disposals (14) - (14) Intercompany transfers 65 - 65 At 28 February 2015 4,267 301 4,568 Net Book Value At 28 February 2015 2,304 111 2,415 At 28 February 2014 2,189 116 2,305
111 Vertu Motors plc

Notes to the Company Financial Statements (continued) 3. Fixed asset investments
2015 £’000 Cost At 1 March 2014 90,505 Additions 10,084 At 28 February 2015 100,589 Accumulated impairment charges At 1 March 2014 2,400 Charge for the year - At 28 February 2015 2,400 Net Book Value At 28 February 2015 98,189 At 28 February 2014 88,105
Vertu Motors plc, the Company, as at 28 February 2015 and 28 February 2014, invested in 100% of the ordinary share capital of the following subsidiary undertakings, incorporated in the United Kingdom:
Company Principal activity Bristol Street First Investments Limited Motor retailer Bristol Street Fourth Investments Limited Motor retailer Vertu Motors (VMC) Limited Motor retailer Grantham Motor Company Limited Motor retailer Vertu Motors (Chingford) Limited Motor retailer Albert Farnell Limited Motor retailer Tyne Tees Finance Limited * Motor retailer Vertu Motors Third Limited Online advertising Macklin Property Limited Property company Vertu Motors (Property) Limited Property company BSH Pension Trustee Limited Pension scheme trustee Vertu Motors (Finance) Limited Finance company Boydslaw 103 Limited * Holding company (dormant subsidiaries) Vertu Motors (Durham) Limited * Holding company (dormant subsidiaries) Bristol Street Fifth Investments Limited * Holding company (dormant subsidiaries) Blake Holdings Limited * Holding company (dormant subsidiaries) Bristol Street Group Limited * Holding company Widnes Car Centre (1994) Limited * Holding company (dormant subsidiaries) Vertu Motors (Pity Me) Limited * Dormant company Bristol Street Commercials (Italia) Limited Dormant company Vertu Fleet Limited Dormant company Vertu Motors (Retail) Limited Dormant company Bristol Street Fleet Services Limited * Dormant company Vertu Motors (AMC) Limited Dormant company Motor Nation Car Hypermarkets Limited Dormant company Bristol Street Limited Dormant company Bristol Street (No. 1) Limited * Dormant company Bristol Street (No. 2) Limited * Dormant company National Allparts Limited * Dormant company Merifield Properties Limited * Dormant company Peter Blake Limited * Dormant company Peter Blake (Chatsworth) Limited * Dormant company
112 Vertu Motors plc

Notes to the Company Financial Statements (continued) 3. Fixed asset investments (continued)
Peter Blake (Clumber) Limited * Dormant company Dunfermline Autocentre Limited * Dormant company Typocar Limited Dormant company Widnes Car Centre Limited * Dormant company KC Mobility Solutions Limited * Dormant company Compare Click Call Limited Dormant company Dobies (Carlisle) Limited Dormant company Newbolds Garages (Mansfield) Limited * Dormant company Brookside (1998) Limited * Dormant company Nottingham TPS LLP* Dormant company Furthermore, the following subsidiary undertakings (ordinary shares 100% owned and incorporated within United Kingdom), were acquired in the year ended 28 February 2015:
Company Principal activity Hillendale Group Limited Holding company Hillendale LR Limited Motor retailer** The Taxi Centre Limited Motor retailer*** Easy Vehicle Finance Limited Vehicle finance company***
* Held indirectly by the Company.
** On 6 May 2014 the trade and assets of the Land Rover dealership in Nelson were transferred to other wholly owned subsidiaries of the Group, and on 30 September 2014 the trade and assets of the Jaguar dealership in Bolton were transferred to other wholly owned subsidiaries of the Group. Thereafter this subsidiary ceased to trade.
*** On 31 December 2014 the trade and assets of this subsidiary were transferred to other wholly owned subsidiaries of the Group, thereafter this subsidiary ceased to trade. The Directors believe that the carrying value of the investments is supported by their underlying net assets.
4. Loans to Group undertakings 2015 2014 £’000 £’000 Loans to Group undertakings - 3,000
Loans to Group undertakings are unsecured, accrue interest at Bank of England base rate plus 3% and are repayable on 31 August 2015, as such, this is presented within debtors falling due within one year at 28 February 2015 (note 5).
5. Debtors 2015 2014 £’000 £’000 Amounts falling due within one year: Trade debtors 1,254 697 Amounts owed by Group undertakings 87,384 68,150 Deferred tax asset (note 6) 794 462 Value Added Tax 1,519 1,651 Prepayments and accrued income 3,221 2,628 Loans to Group undertakings (note 4) 3,000 - 97,172 73,588 Amounts falling due after more than one year: Other debtors - 192 - 192
113 Vertu Motors plc

Notes to the Company Financial Statements (continued) 5. Debtors (continued)
Amounts owed by Group undertakings are unsecured, bear no interest and have no fixed repayment date.
Other debtors falling due after more than one year represents redeemable preference shares received as part consideration for the disposal of the Company’s heavy truck business to Aquila Truck Centres (Italia) Limited in the year ended 28 February 2014. Following a review of the recoverability of the preference shares during the year ended 28 February 2015, the balance is determined to have been impaired and therefore a provision has been made against the balance in full. 6. Deferred tax asset
2015 2014 £’000 £’000 At beginning of year 462 283 Credited to the profit and loss account 342 204 Charged directly to equity (10) (25) At end of year 794 462
The amounts recognised for deferred tax assets, calculated under the liability method at 20% are set out below:
2015 2014 £’000 £’000 Depreciation in excess of capital allowances 274 190 Other short term timing differences 520 272 Total 794 462
7. Creditors: amounts falling due within one year
2015 2014 £’000 £’000 Bank borrowings (note 8) 3,423 2,000 Trade creditors 4,234 3,568 Other creditors 19,500 17,500 Corporation tax 2,808 1,940 Deferred consideration 1,808 1,300 Other taxation and social security 3,217 3,016 Accruals 16,337 13,530 Deferred income 3,865 2,688 Derivative financial instruments (note 9) 25 - 55,217 45,542
Other creditors comprise non-interest bearing advance payments from the Group’s finance company partners.
Accruals includes £6,844,000 (2014: £4,688,000) in respect of outstanding service plans.
114 Vertu Motors plc
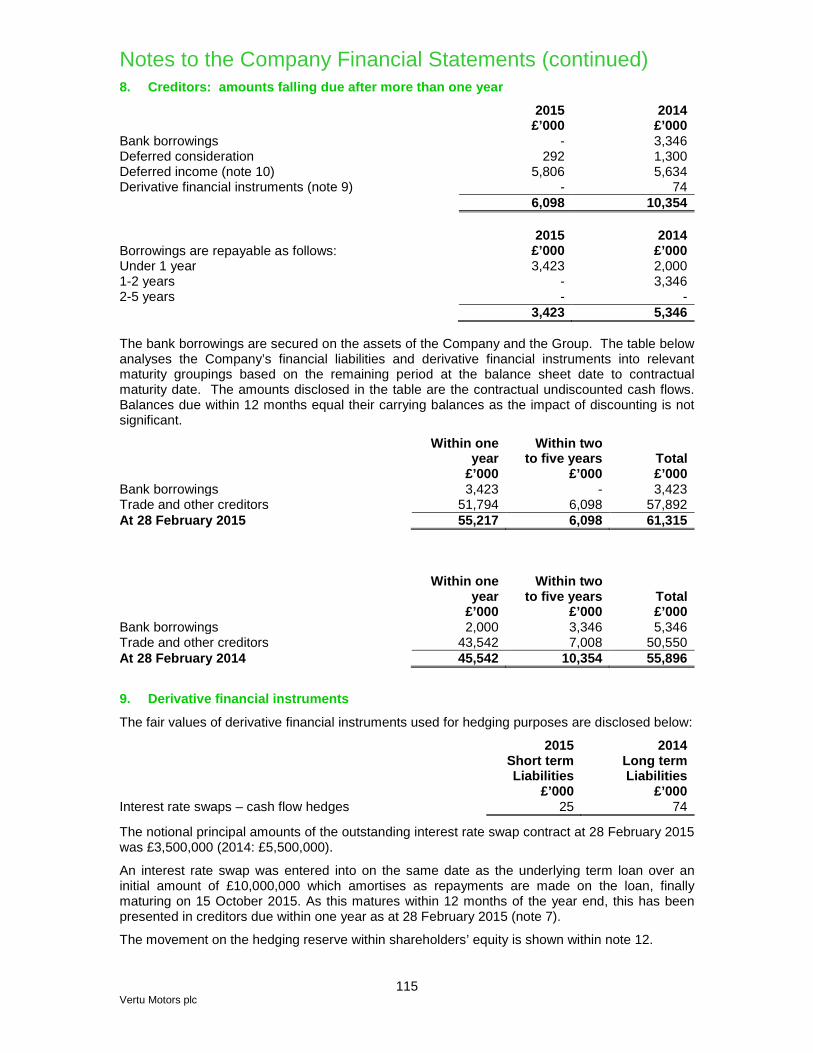
Notes to the Company Financial Statements (continued) 8. Creditors: amounts falling due after more than one year
2015 2014 £’000 £’000 Bank borrowings - 3,346 Deferred consideration 292 1,300 Deferred income (note 10) 5,806 5,634 Derivative financial instruments (note 9) - 74 6,098 10,354 2015 2014 Borrowings are repayable as follows: £’000 £’000 Under 1 year 3,423 2,000 1-2 years - 3,346 2-5 years - - 3,423 5,346 The bank borrowings are secured on the assets of the Company and the Group. The table below analyses the Company’s financial liabilities and derivative financial instruments into relevant maturity groupings based on the remaining period at the balance sheet date to contractual maturity date. The amounts disclosed in the table are the contractual undiscounted cash flows. Balances due within 12 months equal their carrying balances as the impact of discounting is not significant.
Within one year
Within two to five years Total
£’000 £’000 £’000 Bank borrowings 3,423 - 3,423 Trade and other creditors 51,794 6,098 57,892 At 28 February 2015 55,217 6,098 61,315
Within one year
Within two to five years Total
£’000 £’000 £’000 Bank borrowings 2,000 3,346 5,346 Trade and other creditors 43,542 7,008 50,550 At 28 February 2014 45,542 10,354 55,896
9. Derivative financial instruments
The fair values of derivative financial instruments used for hedging purposes are disclosed below:
2015 2014
Short term Liabilities
Long term Liabilities
£’000 £’000 Interest rate swaps – cash flow hedges 25 74
The notional principal amounts of the outstanding interest rate swap contract at 28 February 2015 was £3,500,000 (2014: £5,500,000).
An interest rate swap was entered into on the same date as the underlying term loan over an initial amount of £10,000,000 which amortises as repayments are made on the loan, finally maturing on 15 October 2015. As this matures within 12 months of the year end, this has been presented in creditors due within one year as at 28 February 2015 (note 7).
The movement on the hedging reserve within shareholders’ equity is shown within note 12.
115 Vertu Motors plc

Notes to the Company Financial Statements (continued) 10. Deferred income
Deferred income due in greater than one year comprise:
2015 2014 £’000 £’000 Warranty income 5,806 5,634 5,806 5,634
Deferred income relates to used car warranty products sold by the Group. These warranty policies can be taken out over 12, 24 or 36 months with income received in advance of this period being released on a straight-line basis over the life of the policies. There is an additional £3,865,000 included in ‘Accruals and deferred income’ in creditors: amounts falling due within one year, in respect of such warranties recognising the amount to be released over the next 12 months (2014: £2,688,000).
11. Called up share capital, share premium account and other reserves
2015 Ordinary shares of 10p each
Called up
Share
premium
Number of Share account Other Shares
(‘000) capital
£’000 account
£’000 Reserve
£’000 Total £’000
At 1 March 2014 336,783 33,678 96,729 8,820 139,227 Shares issued during the year 4,125 413 81 1,825 2,319 At 28 February 2015 340,908 34,091 96,810 10,645 141,546
All issued shares are fully paid-up.
The other reserve is a merger reserve, arising from shares issued for shares as consideration to the former shareholders of acquired businesses. The increase in the year reflects the issue of shares as part consideration for Hillendale Group Limited and The Taxi Centre Limited, as described in note 17 (a) and (b) of the consolidated financial statements.
2014 Ordinary shares of 10p each
Called up
Share
premium
Shares to
Number of Share account be Other Shares
(‘000) capital
£’000 account
£’000 Issued
£’000 Reserve
£’000 Total £’000
At 1 March 2013 200,076 20,008 60,727 2,000 8,820 91,555 Shares issued during the year 136,707 13,670 38,330 (2,000) - 50,000 Costs associated with issuance of ordinary shares - - (2,328) - - (2,328) At 28 February 2014 336,783 33,678 96,729 - 8,820 139,227
116 Vertu Motors plc

Notes to the Company Financial Statements (continued) 12. Hedging reserve
2015 2014 £’000 £’000 Cash flow hedges: At beginning of year (56) (133) Fair value gains on derivative financial instruments during the year 49 102 Deferred taxation on fair value gains during year (10) (25) At end of year (17) (56)
13. Profit and loss account
2015 2014 £’000 £’000 As at beginning of year 12,053 4,818 Profit for the financial year 15,640 9,566 Dividend paid (note 14) (2,895) (2,526) Share based payments adjustment (note 16) 617 195 As at end of year 25,415 12,053
14. Dividends per share
The dividends paid in the year to 28 February 2015 were 0.85p per share in total (2014: 0.75p). A final dividend in respect of the year ended 28 February 2015 of 0.7p per share, is to be proposed at the annual general meeting on 23 July 2015. The ex dividend date will be 25 June 2015 and the associated record date 26 June 2015. This dividend will be paid on 28 July 2015 and these financial statements do not reflect this final dividend payable.
117 Vertu Motors plc

Notes to the Company Financial Statements (continued) 15. Reconciliation of movements in shareholders’ funds
Called up share
capital
Share premium account
Other
reserve
Hedging reserve
Profit and loss account Total
£’000 £’000 £’000 £’000 £’000 £’000 As at 1 March 2014 33,678 96,729 8,820 (56) 12,053 151,224 Profit for the financial year - - - - 15,640 15,640 Dividend paid - - - - (2,895) (2,895) Tax on items taken directly to equity - - - (10) - (10) Share based payments charge - - - - 617 617 Fair value gains on derivative financial instruments - - - 49 - 49 New ordinary shares issued 413 81 1,825 - - 2,319 As at 28 February 2015 34,091 96,810 10,645 (17) 25,415 166,944
The other reserve is a merger reserve, arising from shares issued for shares, as consideration to the former shareholders of acquired businesses. The increase in the year reflects the issue of shares as part consideration for Hillendale Group Limited and The Taxi Centre Limited as described in note 17 (a) and (b) of the consolidated financial statements.
Called up
share capital
Share premium account
Shares to be issued
Other
reserve
Hedging reserve
Profit and loss account Total
£’000 £’000 £’000 £’000 £’000 £’000 £’000 As at 1 March 2013 20,008 60,727 2,000 8,820 (133) 4,818 96,240 Profit for the financial year -
- - - - 9,566 9,566
Dividend paid - - - - - (2,526) (2,526) Tax on items taken directly to equity (25) - (25) Share based payments charge - - - - - 195 195 Fair value gains on derivative financial instruments - - - - 102 - 102 Shares to be issued - New ordinary shares issued 13,670 38,330 (2,000) - - - 50,000 Costs associated with issuance of ordinary shares - (2,328) - - - - (2,328) As at 28 February 2014 33,678 96,729 - 8,820 (56) 12,053 151,224
118 Vertu Motors plc
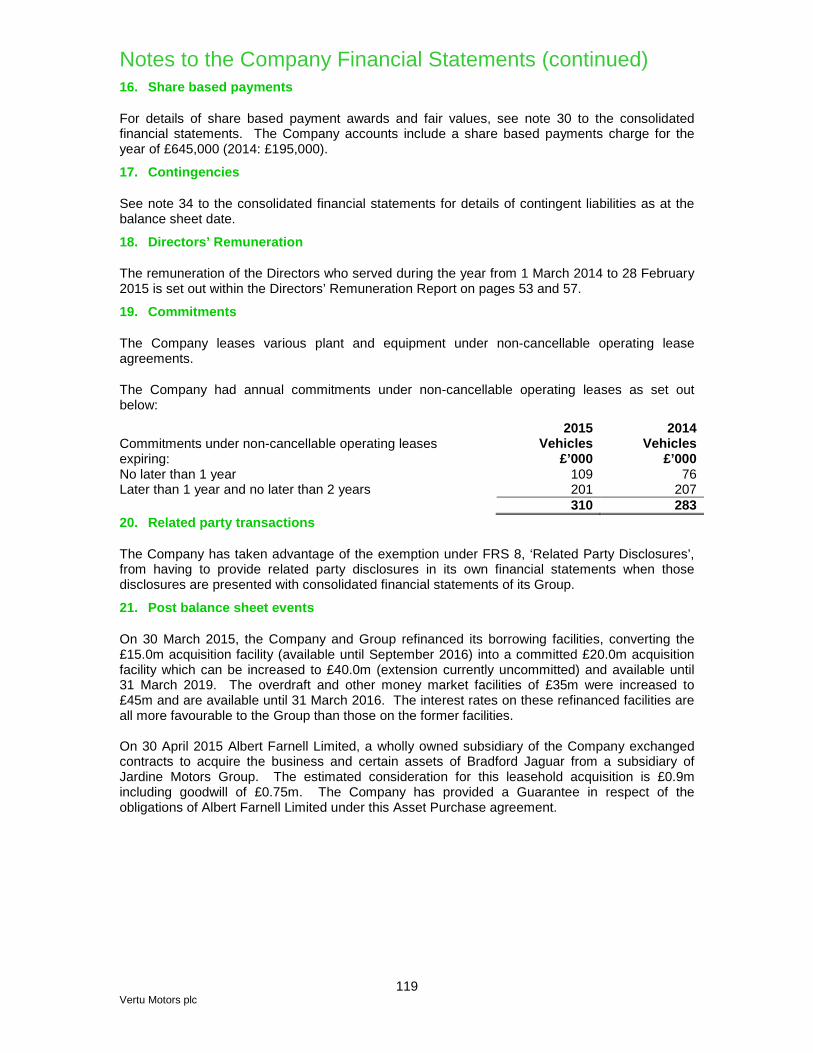
Notes to the Company Financial Statements (continued) 16. Share based payments
For details of share based payment awards and fair values, see note 30 to the consolidated financial statements. The Company accounts include a share based payments charge for the year of £645,000 (2014: £195,000).
17. Contingencies
See note 34 to the consolidated financial statements for details of contingent liabilities as at the balance sheet date.
18. Directors’ Remuneration
The remuneration of the Directors who served during the year from 1 March 2014 to 28 February 2015 is set out within the Directors’ Remuneration Report on pages 53 and 57.
19. Commitments
The Company leases various plant and equipment under non-cancellable operating lease agreements.
The Company had annual commitments under non-cancellable operating leases as set out below:
2015 2014 Commitments under non-cancellable operating leases expiring:
Vehicles £’000
Vehicles £’000
No later than 1 year 109 76 Later than 1 year and no later than 2 years 201 207 310 283 20. Related party transactions
The Company has taken advantage of the exemption under FRS 8, ‘Related Party Disclosures’, from having to provide related party disclosures in its own financial statements when those disclosures are presented with consolidated financial statements of its Group.
21. Post balance sheet events
On 30 March 2015, the Company and Group refinanced its borrowing facilities, converting the £15.0m acquisition facility (available until September 2016) into a committed £20.0m acquisition facility which can be increased to £40.0m (extension currently uncommitted) and available until 31 March 2019. The overdraft and other money market facilities of £35m were increased to £45m and are available until 31 March 2016. The interest rates on these refinanced facilities are all more favourable to the Group than those on the former facilities. On 30 April 2015 Albert Farnell Limited, a wholly owned subsidiary of the Company exchanged contracts to acquire the business and certain assets of Bradford Jaguar from a subsidiary of Jardine Motors Group. The estimated consideration for this leasehold acquisition is £0.9m including goodwill of £0.75m. The Company has provided a Guarantee in respect of the obligations of Albert Farnell Limited under this Asset Purchase agreement.
119 Vertu Motors plc

Registered Office:Vertu House, Kingsway North,
Team Valley, Gateshead, NE11 0JH.Company Number: 05984855
www.vertumotors.com
VERTUM o t o r s p l c
vertumotors.com