Vertical Sand Drains - Transportation Research...
47
HIGHWAY RESEARCH BOARD Bulletin 90 Vertical Sand Drains RESEAS National Academy of Sciences- National Research Council publication 326
Transcript of Vertical Sand Drains - Transportation Research...

H I G H W A Y R E S E A R C H B O A R D
Bulletin 90
Vertical Sand Drains
RESEAS
National Academy of Sciences-
National Research Council publication 326

H I G H W A Y R E S E A R C H B O A R D Officers and Members of the Executive Committee
1954
OFFICERS
G. DONALD KENNEDY, Chairman K . B . WOODS, Vice Chairman
F R E D BURGGBAP, Director
Executive Committee
F R A N C I S V . DU PONT, Commissioner, Bureau of Public Roads «
H A L H . H A L E , Executive Secretary, American Association of State Highway Officials
LOUIS JORDAN, Executive Secretary, Division of Engineering and Industrial Research, National Research Council
R . H . BALDOCK, State Highway Engineer, Oregon State Highway Commission
P Y K E JOHNSON, Consultant, Automotive Safety Foundation
G . DONALD K E N N E D Y , Executive Vice President, Portland Cement Association
0 , L , KiPP, Assistant Commissioner and Chief Engineer, Minnesota Department of Highways
BURTON W . MARSH, Director, Safety and Traffic Engineering Department, American Automobile Association
C . H . SCHOLER, Head, Applied Mechanics Department, Kansas State College
R E X M . W H I T T O N , Chief Engineer, Missouri State Highway Department
K . B . WOODS, Director, Joint Highway Research Project, Purdue University
Editorial Staff
F R E D BURGGRAF W . J . M I L L E R
2101 Constitution Avenue Washington 25, D . C.
The opinions and conclusions expiessed in this publication are those of the authors and not necessaiily those of the Highway Research Board.

Vertical Sand Drains

HIGHWAY RESEARCH BOARD BuUetin 90
Vertical Sand Drains P R E S E N T E D AT T H E
Thirty-Third Annual Meeting January 12-15, 1954
1954 Washington, D. C.

Department of Soils
Frank R. Olmstead, Chairman Supervising Highway Research Engineer
Bureau of Public Roads
COMMITTEE ON SURVEY AND TREATMENT OF MARSH DEPOSITS Olaf Stokstad, Chairman
Michigan State Highway Department
Dr. Walter C. Boyer, Assistant Professor of Civil Engineering, Johns Hopkins University
J. C. Carpenter, Coverdale and Colpitis Consulting Engineers, New York E. A. Henderson, Soils Engineer, New Jersey State Highway Department Raymond C. Hemer, Chief, Airport Division, Technical Development, and
Evaluation Center, Civil Aeronautics Administration, Indianapolis Philip Keene, Engineer of Soils Mechanics and Foundations, Connecticut State
Highway Department, State Office Building, Hartford, Connecticut R. A. Low, Trans Canada Highway, Norlite Building, Ottawa, Canada Lloyd H. Morgan, Supervising Highway Engineer, Washington Department of
Highways, Olympia, Washington John Piltz, Engineer of Road Design, State Highway Commission of Wisconsin A. W. Root, Chief, Soils and Foimdation Division, Materials and Research
Department, California Division of Highways Nicholas M. Sinacori, Associate Soils Engineer, Department of Public Works,
State Office Building, Bureau of Soil Mechanics, Albany John Walter, Assistant Chief Engineer of Construction, Department of Highways,
Parliament Buildings, Toronto Ray Webber, Assistant Construction Engineer, Oregon State Highway Commission Dr. Hans F. Winterkorn, Director, Soils Science Laboratory, Department of Civil
Engineering, Princeton University
IV

Contents CHECKING UP ON VERTICAL SAND DRAINS
William S. Housel 1 Discussion
L . A. Palmer 16
HAWAH'S EXPERIENCE WITH VERTICAL SAND DRAINS K. B. Hirashima 21
Appendix A, Cost Data on Vertical Sand Drains 30 Appendix B, Consolidation Due to Horizontal Flow. . . . 32 Appendix C 37

Checking up on Vertical Sand Drains WILLIAM S. HOUSEL, Professor of Civil Engineering, University of Michigan and Research Consultant, Michigan State Highway Department
• VERTICAL sand drains, or sand piles as they are sometimes called, have been more and more widely used in recent years. They represent an attempt to augment the consolidation of unstable saturated soils by providing vertical drainage outlets for the water presumed to be squeezed from the soil by the weight of the surcharge or f i l l . The objective of consolidation by such artificial means is to develop increased soil resistance and support for superimposed loads, usually consisting of earth f i l l s in highway or airport construction.
Whether or not sand drains are actually effective and do produce the results represented by the theory has been a debated question. The writer has always been skeptical of the theory of consolidation in principle and little impressed with its attempted application In practice. The consolidation theory conceives that settlement is caused by squeezing water out of the voids of a saturated soil under the applied pressure. This theory postulates that the movement of moisture is caused by pore-water pressure or a differential hydrostatic pressure as distinguished from the pressure components acting on the soil mass as a whole which results in shearing stress. It Ignores the fact that adsorbed moisture in fine-grained soils frequently exceeds the solids in volume and that the same molecular forces which must be overcome in order to force out the water are the source of cohesion or shearmg resistance of the soil. Under the situation most representative of saturated soUs in which the solid particles are dispersed in a semifluid medium, it has always been difficult for the writer to understand how the water could be forced out without carrying the solid particles with i t . In other words, in such soil masses as encountered in practice without artificial confinement, it would seem that displacement or shearing failure would take precedence over consolidation.
The consolidation theory as formulated cannot be applied to unsaturated soils in
which settlement, as observed in practice, differs only in magnitude from that taking place in saturated soils. Some of the uncertainty involved in its application to saturated clays are discussed by its foremost proponents who recognize some of its shortcomings (1.). In discussing an apparent lag in the reaction of clay to applied loads characteristic of plastic solids, it is stated in the reference that:
These delays in the reaction of clay to a change in stress, like the secondary time effect and the influence on cy (coefficient of consolidation) of the magnitude of the load increment, cannot be eiqilained by means of the simple mechanical concept on which the theory of consolidation is based. Their characteristics and conditions for occurrence can be investigated only by observation.
Its inaccuracy in application to practical conditions is likewise recognized as in the following statement:
It is obvious that the results of a settlement computation are not even approximately correct unless the assumed hydraulic boundary conditions are in accordance with the drainage conditions in the field. Every continuous sand or silt seam located within a bed of clay acts like a drainage layer and accelerates the consolidation of the clay, whereas lenses of sand and silt have no effect. If the test boring records indicate that a bed of clay contains partings of sand and silt, the engineer is commonly unable to find out whether or not these partings are continuous. In such instances the theory of consolidation can be used only for determining an upper and lower limiting value for the rate of settlement. The real rate remains unknown until it is observed.
The extension and elaboration of this uncertain theoretical concept to the design of a roadway f i l l or airport runway involving sand drains includes the calculation of several definite quantitative components of the completed facility. These include the spacing of sand drains, the height of surcharge required to produce a required degree of improvement, a specified consolidation period, and finally, a completed f i l l with a definite safe load. To the uninitiated client or to the con-

tractor who bids on the job, the precise evaluation of these items in plans and specifications as quantitative requirements or objectives to be accomplished not only implies but gives assurance that the whole subject of sand drains has been established beyond any reasonable doubt. Critical
In the few instances in which the writer has had the opportunity to investigate the effectiveness of sand drains on an actual construction project, the results have been definitely negative. Perhaps these were unfortunate coincidences, but this experience only reinforced some rather
Figure 1. F i l l settlement and s i Stations
examination of such evidence as has been presented indicates that application of the principles involved has scarcely progressed beyond an experimental stage and that the claims of successful application are seldom supported by more than fragmentary and inconclusive evidence.
Occasionally one hears of failures in connection with sand-drain installations, and if these failures are exhaustively investigated, they are seldom, if ever, so reported for public consumption. Accounts of supposedly successful installations which are more numerous usually presume that the lack of complete subsidence or failure has been accomplished by the sand drains. Generally, these claims are not supported by a factual stability analysis to demonstrate that the original bearing capacity was clearly deficient or that there was a definite improvement due to consolidation. Settlement is classified as consolidation settlement, but no clear demonstration is given as to how much was displacement and how much consolidation. The writer has yet to see in a published report a comprehensive set of reliable factual data on moisture content, soil density, or shearing resistance before and after consolidation from an actual full-scale sand-drain installation.
ide planes at north side runway 45-47. strong convictions expressed in this discussion with regard to the theoretical background of consolidation. It is possible that there are materials and stratified soil deposits in which vertical sand drains are of material benefit. The writer has not encountered such conditions and suspects that if they do exist, they are the exception rather than the rule.
Having a deep interest in the practical value of sand drains, the opportunity to conduct a comprehensive investigation of the results produced by an installation of sand drains on a major project came as a distinct opportunity. The project with which this investigation was concerned was the extension of a runway into a marshy area at the Norfolk Naval Air Station. The investigation was made for the Contractors, Ralph E . Mills Company of Salem, Virginia, and Blythe Brothers Company of Charlotte, North Carolina, and was made with the permission of the representatives of the Bureau of Yards and Docks of the U. S. Navy. The objective of the investigation was to determine the reason for a number of difficulties which had been encountered during the construction. This determination boiled down to whether or not these difficulties were the result of improper construction methods or were inherent in the design as presented by the

Figure 2. F i l l settlement and s i Stations
plans and specifications. The difficulties referred to which pre
sented some serious problems to both the Navy and the cont;ractor may be described briefly as follows:
First, due to slides and displacement of the softer strata near the surface, the amount of fill material being required was mounting up to.an excessive overrun involving increased cost beyond the funds which had been provided for this purpose.
Secondly, the slides and displacement destroyed the settlement platforms which had been placed for the purpose of determining the final volume of fill and made it necessary to establish some other method of determining the final pay quantity. In
ide planes at north side runway 45-47. other areas, the displacement of the soft materials took place as fast as the sand fill was placed, and it had been impossible to establish a working platform from which the settlement platforms could be placed.
Third, in other, more-stable areas, the contractor had been able to place the working platform, drive the sand drains, and place part and sometimes all of the surcharge called for by the plans and specifications. However, in several of these areas failures developed producing the most-extensive slides and mud waves that were encountered in the project. It should be noted in connection with this problem that the plans called for the full surcharge to be placed immediately after the sand drains
Figure 3. Mud waves on taxiway.

Figure 4. Mud waves on taxiway.
LOCATION PLAN
N SOIL AREA I
TAXIWAY t .
SOIL AREA SOIL AREA I
RUNWAY f .
SLIDE AREA
MUO WAVE A R E A
O ORISINAL BORINS
• C H E C K BORING
Figure 5.
had been completed and provided for a 90- in place until it was presumed that the day consolidation period. In such areas consolidation had been completed, after where it had been impossible to place the which the rest of the surcharge was placed, surcharge fill without serious failures de- Fourth, aside from the delays and in-veloping, the contractor was forced to place creased cost which somebody would have to the fill in small lifts which were then left bear, the continued excessive displacement

raised a serious question as to whether there was any consolidation being accomplished by the surcharge f i l l and whether a useable runway could ever be produced under the procedure called for by the plans and specifications.
Fifth, in certain areas after a consolidation period of from 2 to 5 months, it was presumed that the objectives of the design had been accomplished and the contractor was instructed to remove the surcharge and
blanket on top of the sand piles. This removal was also required in the final operation when the sand surcharge was to be removed and spread on either side of the finished runway and taxiway to form the final cross section. It had been the contractor's experience that the continuous removal of this mud wave in order to maintain temporary ditches continued to promote the excessive f i l l settlement and displacement. The question which this
LOG OF SOIL PROFILE 1 ORIGINAL BORINS STA.47.S0 - RUNWAY C
VOLUME OF SOLIDS a LIQUID CURVES. I LOO OF SOIL PROFILE • C H E C K B O R I N G N o e ISTA. 47*50 - RUNWAYt.
£ - 1 0 -
1 - I S -
" - 2 0 -
- s » -
- 4 0 -
SOFT SRAY SILTY CLAY
MRINO STOPKD.
1 4 0 • 0 1 n IOC
APPRC X SOL IDS LlOUlO
4
i •
^ -
\
y
O ORIGINAL HCRING
• CHECK BORING
O ORIGINAL HCRING
• CHECK BORING
•RAY aiLY, TMCC OF FINE aAHD
OmAHK MATTER,
FERCENT BY VOLUME OF SOLIDS • LIOUID
-15 I
- » 0 "
- «
- » 0
-SB
Figure 6. spread it in flat slopes on either side of the runway and taxiway. However, after the surcharge had been removed, i t was found that the settlement continued in the runway at such a sufficiently high rate that there was some question as to whether the contractor would be able to maintain-final grade for the paving operation within the tolerances laid down by the specifications.
Sucth, during the entire operation the contractor was required to remove the mud waves which had piled up on either side of the runway and taxiway and which were furnishing a counterweight tending to stabilize the f i l l . This removal was being required in order to provide temporary drainage to carry away the water which was supposed to be coming out of the porous
raised was whether or not this counterweight could be removed at any time without setting off a new series of slides.
To give some idea of the character and magnitude of the f i l l settlement and mud waves, there are presented the f i rs t four figures, photographs taken in the field in the early part of September 1951. Figure 1 and Figure 2 show the failure areas which were first encountered toward the west end of the runway. Figure 3 and Figure 4 show very clearly the mud waves caused by displacement of the soft clay during the placing of the working platform and the driving of the sand piles along the taxiway.
Obviously the most-essential part of an investigation of the enumerated problems was a comprehensive soil investigation.

LjQO OF SOILPROHLE ORIGINAL BORING S T A 6 5 - ^ 0 0 RUNWAT C.
SOTT Oiar 8ILTY OJtJ TRUE OF
OMrSaTYSAIIO TRACE OF ORAVEL
rRORINa STOPPED
VOUUME OF SOLIDS 8 LIQUID CURVES
PERCENT BT VOLUME OF MUDS • LIQUO
Figure 7.
. 1 . 1 1 1 PPROX. SOLIDS 1 T 1 -r 1 -1
, | , LIOUID ,
/ / r
( 1
{\
O ORieiNAL BORING
• C H E C K BORING
( [ O ORieiNAL BORING
• C H E C K BORING
LOG OF SOIL PROFLE C H E C K B O R I N G Na B STA.SS+OO RUNWAY C.
MEDIUM DROWN SAND, PILL,
MEDIUM SRAT SANDj LITTLE SILT
MEDIUM SRAV SANI a ORAY, SILTY VLKlX
SRAY-BROWN.SILTY CLAY, TRACE OP SAND
FINE SANDY, GRAY SILT, MEDIUM SREEN-BROm SAHO
FINE SRAY, SANDY SILT
FINE SRAY SANDY SILT, ORGANIC MATTER
FINE GRAY SAND, TRACE OF SILT
FINE GRATGANDb SHELLS, TRACE OF SILT
BORINS STDPPEO
^ S U R C H A R S E G R A D E S
LOO OF SOIL PROFILE ORIGINAL B O R I N G S1A S 3 < B 0 - RUNWAY t .
- 1 0 -
K - I S -
z ~ - e o -
g - S B -
• 1 - 3 0 -
MEDIUH BAND
VOLUME OF SOUDS B LIQUID CURVES
O ORIGINAL BORING
• C H E C K B O R I N G
LOO OF SOIL PRORLE DESIGN C H E C K B O R I N G NO S T A . S 3 ' S O - RUNWAY
— t w«rl J~|
H s i r ^ i b ^ R i
SAND B G R A V E L .
• e a SUY SAND B0RIN6 STOPPED
• 9 » * ' o o
1
- - I S
- -eo
PERCENT BY VOLUME OP SOUDS B LlOUlO
Figure 8.

including borings and all of the laboratory tests necessary to fully describe existing soil conditions. The original boring logs, which served as a basis for preparation of the plans and specifications, were available to the contractor being incorporated in the plans. Available data included moisture content m percent by dry weight, the dry weight per cubic foot in a general description of the soil. The predominant material was described as a gray silty clay, but there were several areas with sand or sandy soil both near the surface and at greater depths.
As a part of the contractor's investigation, there was a total of 45 check borings made, 11 of which were deep borings with undisturbed samples being taken for testing at the Soil Mechanics Laboratory at the University of Michigan. The remaining 34 borings were made primarily to determine the depth of penetration of the sand f i l l . The borings and undisturbed sampling were done by the Raymond Concrete Pile Company under the Michigan specifications requiring core samples 1% inches in diameter and approximately 7 inches long. A complete description of the sampling procedure is available elsewhere and wil l not be repeated in this discussion (2).
Figure 5 is a location plan which shows the general layout of the runway and taxiway extension and the location of borings and critical soil areas, which wil l be discussed further. The open circles alongthe center-line of the runway and taxiway are used to designate the original borings made prior to preparation of the plans and specifications. The solid circles designate the 11 check borings made as part of the contractor's investigation from which undisturbed samples were obtained. Borings 1, 2, 5, and 6, along the centerline of the runway, and Borings 8, 9, and 11, along the centerline of the taxiway, were taken in areas where the surcharge f i l l of varying height had been in place for consolidation periods varying from 2 to 5 months. Undisturbed samples of the saturated clay in these areas are presumed to represent the condition of the soil after it has been subjected to the prescribed consolidation periods. Borings 3, 4, and 7, in between the taxiway and runway in the open marsh area, were taken for the purpose of obtaining representative samples of the original soil in its unconsolidated state.
Boring 13 was taken outside of the runway area to compare with Boring 1 at a point where the soil conditions varied substantially from those over the greater portion of the runway and taxiway extension.
Selection of the location of the check borings was predicated on an analysis of the soil conditions as portrayed by the original borings. From these original data, areas which were presumed to represent the more-critical soil conditions were selected and have been designated on Figure 5 as soil area 1. In this area, the soil test data from the original borings indicated that there was gray silty clay of high moisture content from the surface of the ground to depths varying from 50 to 60 feet. This soil was originally described as very soft to soft silty clay with moisture contents varying from 65 to 95 percent by dry weight and 60 to 80 percent by volume. Tests performed as a part of the contractor' s soil investigation indicated that the predominant soil was a silty clay containing 30 to 35 percent clay and colloids, 30 to 50 percent silt and 20 to 30 percent sand. The plastic limit of this material varied from 20 to 30, the liquid limit f rom 50 to 60, with an average plasticity index of approximately 30. In general, the natural moisture content of this material varied from 10 to 20 percent above the liquid l imit , indicating that the soil should be classified as a flocculated clay.
In the vicinity of Borings 1 and 13, sand, substantially granular in character, was found from the surface to a depth of 20 to 25 feet, followed by a relatively thin body of the very soft silty clay approximately 15 feet in depth, underlain again by a body of sand which continued for the fu l l depth of the boring. In the vicinity of Boring 5, similar conditions existed, except that the depth of the soft silty clay between the surface sand and underlying sand was approximately 35 feet, somewhat more critical than in the case of the other sand area but presumably more stable than the critical areas designated as Area 1. Practically the entire length of the taxiway has been designated as a critical soil area with the soft silty clay extending from the surface to a depth of 60 to 70 feet. Near the east end of the widened taxiway in the vicinity of Boring 8, the same classification of soil is found in the original borings although the natural

LOO OF SOIL PROFILEl ORieiNAL BOillNe STASI iOSTAXIWAYt
VOLUME OF SOLIDS a UQUID CURVES
0-
-»-
K - . 0 .
i " a -"•
- s » -
111
SOFT S R W SILTY CLAY, T R A C E OF SAND AND O R -«ANIC HATCRIAL
• R A Y SANO.
BORINR S T O P P E D
' A PPROX' SOLIDS ' • ! • lIlOUID ' '• •
/ 1 / / f
[
O ORIOINAL BORING
• CHECK BORING
/ O ORIOINAL BORING
• CHECK BORING
LOG OF SOIL PROFILE CHECK BORING Na S S n . 6 2 + 0 0 TAXIWAYt
SANO F I L L
GRAT S ILTY SAND.
CDARSE SRAV SAND G S H E L L S
SRAY S I L T , T R A C E DP F I N E SAND
GRAY SILT, T R A C E OF F I N E SANO • ORGANIC H A T T E R
GRAV-SREEN CLAYE Y SILT, T R A C E OF F I N E SAND.
G R E E N S I L T Y SANO G Hia a««r SANO., BORING STOPPEI
P E R C E N T GY VOLUME O F GOLIDS B LIGUID
Figure 9. moisture content is substantially less than in the highly saturated clay indicating a more stable soil.
There is also shown (Fig. 5) the areas in which the major slides and displacements were encountered. In general, these areas agree with the classification of critical soil areas based upon the original soil test data and classification. This includes a major slide area in the vicinity of Boring 2, another similar area in the vicinity of Boring 6 and a continuous area of subsidence and displacement along the major portion of the taxiway from near Bormg 9 to past Boring 11.
As has been previously indicated in this discussion, the primary objective of the contractor's investigation was to obtain comprehensive, factual data on the moisture content and shearing resistance of the saturated clay soil in the critical soil areas before and after consolidation. This information was required in the f i rs t place to determine whether or not the unsatisfactory performance was inherent
in the existing soil conditions and the procedures called for by the plans and specifications and whether it was physically possible for the contractor to accomplish the objective set forth in these plans and specifications. Having accepted a contract to produce a completed facility planned by others, a contractor is frequently in the unfortunate position of having to accept the burden of proof when faced with the possible contention that the failure to achieve the planned objective is a matter of construction methods and his legal responsibility. Furthermore, from the standpoint of everybody concerned, the situation had reached a stage in which it was highly essential to establish whether it was physically possible to provide a completed runway which could be safely used by the Navy over a reasonable period of years.
The results of the tests to determine the degree of consolidation which had been produced by the sand piles and the surcharge f i l l which had been in place over periods varying from 2 to 5 months are

shown on a series of graphs presented by Figures 6 to 12 inclusive. Figures 6 through 11 present the moisture content before and after consolidation for individual borings. In F^ure 6, the boring log from the original boring is shown on the left-hand side of the figure and the log of the check bormg is shown on the right-hand side. At the top of the right-hand boring log is shown the surcharge grade, both as designed and as measured at the time the boring was made. The thickness and bottom elevation of the sand f i l l on the check boring can be compared with the ground-surface elevation on the original boring to indicate the depth to which the sand f i l l has settled. In Figure 6, the indicated settlement is approximately 4 feet.
The primary purpose of Figure 6 through 11 is to present the moisture content measurements in the central chart. Moisture contents and solids are shown in percent of the total volume with the moisture or liquid volume being shown on the right as the complementary percentage of the volume of solids which is shown on the
left-hand side of the chart. Results from the original test data are shown by the open circle, the results from the check boring by the solid circle. At the location of Boring 2 in Figure 6 in the original soil below the sand f i l l , moisture contents vary from 60 to 70 percent with the volume of solids varying from 30 to 40 percent. The moisture content in the sand f i l l is approximately 20 percent, corresponding to the percentage of voids in such a granular material when compacted. Particular attention is directed to the fact that there is no measurable change in moisture content for the entire depth of the original soft silty clay under discussion.
It may be noted, however, that the textural classification or description of this soil does vary from the original description of a soft, gray, silty clay to the textural classification of gray silt shown in the check boring. In the latter case, the descriptions of soil type are from visual examination by the boring crew superintendent. It is the practice in the Michigan laboratory not to alter the soil
LOO OF SOIL PROFILE ORIGINAL BORING STA S4>08-TAXIWAY I .
VOLUME OF SOLIDS a LIQUID CURVES rLDO OF SOIL PROFILE
18i£°B4*m-TAxraiff l
S-io-
_ - I S -
S - s s .
8AN0_a 0R9AHIC
APn lOX s OLIOS ~T" LIOUID
\ y \ \ i A
!
O ORISINAL BORING • CHECK BORING
/ f O ORISINAL BORING • CHECK BORING 1
1 SO PENDENT BY
M rauwE OP SI
10 DLIDS a LlOU n R
ID
MED BROUN SARD F I L L
SRAV SILT, SOME PINE SAHO
ORSAMC MATTER
SRAY SILT, TRACE OP ORSMIO MAT-
*
ORAY R N E SILTY SAND 1 MB) SRAY SREEN SAHDL TRACE OF SILT FINE SRAY SAND ' s W I V I 1 T U D B
m m " iu<l BCRINS SnPPEO. T " " ^
-8
-10
-40
-48
Figure 10.

10
description given by the boring contractor but to make a separate classification based on the meclianical analysis where such classification is required. As previously noted, the laboratory classification of the predominant saturated soil was a silty clay in substantial agreement with the original classification. A l l through the
apparent decrease in moisture content after the period of consolidation in the region from Elevation 0 to Elevation -10. However, this apparent decrease in moisture content is clearly related to the tex-tural differences which are shown due to the subsidence of the surface layer of sand under the surcharge f i l l .
LOO OF SOIL PROFIU ORIGINAL BORINGS STA4>40STAXI«Wr t STA 454 09 TAXItWY C
BLUE 8RAV Slav CLAY (BOTH
CLAYEY SAND BTA 4S4aBI
SAND (8n4S400l
VOLUME OF SOUOS a UOUlO CURVES
1 m 40 so AO ID ' 1
/ / I
•
/ \
O CMI8MU.B0mMG-S'n43+0B 0 OniQMAL B0RMB-STJL4540B • CHECK BORINS
O CMI8MU.B0mMG-S'n43+0B 0 OniQMAL B0RMB-STJL4540B • CHECK BORINS
T 7
c / /
1 4 0 A 6 < ' i
LOe OF SOIL PROnLE CHECK BORINS Nai . BTA.44 4 00 TAXIWAY 1
MAY SILT, SOME
RNE SRAY BLACK SAHO, TRACE OF
LITTLE SILT FlaE CRAY SARD • aWLLS, TRACE 0 F | SILT
BE OF
»ED-
- IS g .... » • -AD S
M • -SO
FERCENT SY VOLUME OF BOUDS • LIQUID
Fxgur comparative tests in the six figures under discussion, similar textural variation wi l l be in evidence and where these variations are of any particular significance, special comment wi l l be made.
Figure 7 is a similar chart for results from Boring 5. This area has not been classified as soil Area 1 although as previously noted the thickness of soft sUty clay beneath the surface stratum of sand is sufficient to raise some question as to the ultimate stability of this area. It may be noted that the height of surcharge as planned and measured is much less than in the previous case and the amount of settlement is somewhat less being only a little over 3 feet. Again there is no measurable change in moisture content in the silty clay at greater depth but there is an
e 11. Boring 6 shown in Figure 8 is in another
critical area where original soil conditions indicated more than 50 feet of unstable soil starting at the surface. There is, in this case, a marked difference in moisture content before and after consolidation, but there is also a marked textural change in the check boring. The reasons for this are quite clear, as the coarse, granular material encountered at the greater depth is obviously that used in the sand piles. Thus, the check boring happened to strike such a pile for part of its depth. At the only depths below the penetration of granular f i l l where the original soil appeared to be present, moisture contents are quite comparable before and after consolidation.
Boring 8 in Figure 9 is in the middle

11
portion of the widened taxiway and was des^nated as less c r i t i ca l based on o r ig inal soil test data. In the check boring, the textural classification is even more-definitely granular near the surface. This particular boring was beyond the general fa i lure area along the taxiway and the check boring indicates a smaller f i l l settlement. Moisture contents before and after consolidation are remarkably close together f o r the entire depth of the borings, even though the soil is more
f r o m above by subsidence of the f i l l . On this bormg between Elevation 0 and Elevation -15 is the only evidence of decreased moisture content after consolidation which is not clearly accounted f o r by a difference in soi l texture. However, such a result could very easily be produced by the ver t ica l displacement f r o m above of soil having lower moisture content. Unfortunately, no tests were reported f r o m the original borings above Elevation 0, a l though the trend toward lower moisture
COMPOSITE SOIL PROFILE
BEFORE PUUSINO FILL
F INE SMIDY S lWr OLT
F I L L j y E D I U H BROWN
VOLUME OF SOUPS 8 LIQUID CURVES ICOMPOSITE SOIL PROFILE
AFTER PLAOINS FILL
g -ts-
u -so-
OROANIC MATTER
BORINO STOPPED
1 1 1 1 APn
1 ox S O L I D S U Q U I D
1 • i 9 • <
pi e • • / a
4 8 O BEFORE CONSOUDATKIH " (ORIGINAL BORINS)
e B E F O R E eONSOUOATMMI (CHECK BORINS)
• A F T E R CONSOLIDATION
* e
O BEFORE CONSOUDATKIH " (ORIGINAL BORINS)
e B E F O R E eONSOUOATMMI (CHECK BORINS)
• A F T E R CONSOLIDATION 1
O BEFORE CONSOUDATKIH " (ORIGINAL BORINS)
e B E F O R E eONSOUOATMMI (CHECK BORINS)
• A F T E R CONSOLIDATION
e
• 1 ^ « \
• e
i
O ' ° e
i A
»
F I L L i H E D I U H BROWN
ORSANIO HATTER.
S^^nAcifsrLT^
OROANIS MATTER
B C R m S STOPPED
. - S O
s -tsE
--8S
--SO PERCENT BV VOLUME O F . S O L I D S a LIQUID
Figure 12
granular and presumably more permeable. Boring 9 in Figure 10 is at the point of
transition f r o m the wide to the narrow taxiway and is an area designated as c r i t i cal and where f i l l fai lures were general. In such areas, borings made along the centerline were generally in a portion of the soil mass and f i l l between the slide planes f r o m either side of the taxiway. Thus, they do not represent the deepest penetration of the f i l l in the actual slides but may be an area in which a mixture of original soi l and f i l l has been carr ied down
contents near the surface is indicated. Below Elevation -15 fo r the balance of the depth in the saturated clay, moisture contents are the same before and after consolidation.
Boring 11 in Figure 11 is midway between two of the original borings in one of the more-cr i t i ca l areas along the taxiway. F i l l settlement is approximately 15 feet. Below the f i l l in the depth of soft saturated soil above the underlying sand, moisture contents are in the same range before and after consolidation, although i t must be
12
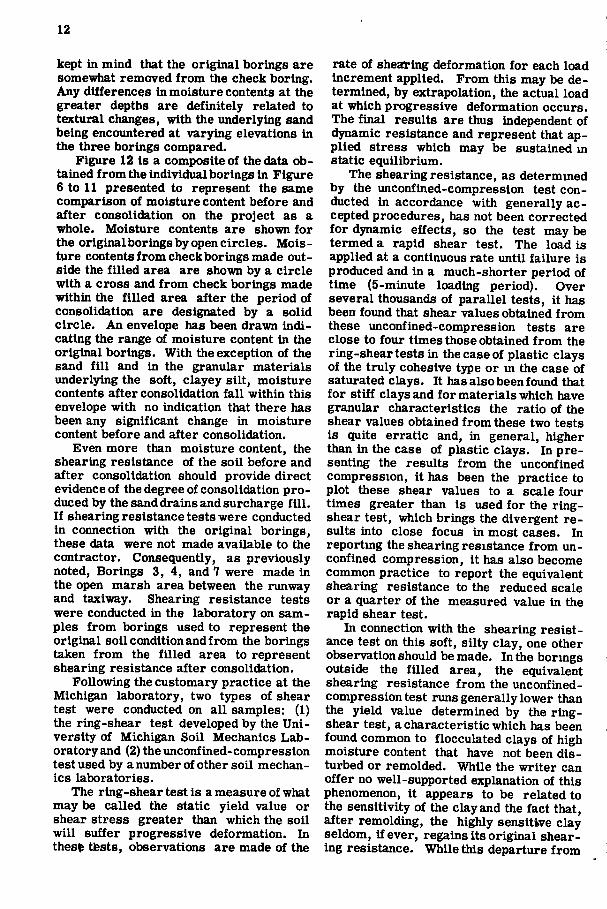
kept in mind that the original borings are somewhat removed f r o m the check boring. Any differences in moisture contents at the greater depths are definitely related to textural changes, with the underlying sand being encountered at varying elevations in the three borings compared.
Figure 12 is a composite of the data obtained f r o m the individual borings in Figure 6 to 11 presented to represent the same comparison of moisture content before and after consolidation on the project as a whole. Moisture contents are shown f o r the originalborings by open circles . Mois ture contents f r o m check borings made outside the f i l l e d area are shown by a c i rc le with a cross and f r o m check borings made within the f i l l e d area after the period of consolidation are designated by a solid c i rc le . An envelope has been drawn i n d i cating the range of moisture content in the original borings. With the exception of the sand f i l l and in the granular materials underlying the soft, clayey s i l t , moisture contents after consolidation f a l l within this envelope with no indication that there has been any significant change in moisture content before and after consolidation.
Even more than moisture content, the shearing resistance of the soi l before and after consolidation should provide direct evidence of the degree of consolidation p ro duced by the sand drains and surcharge f i l l . I f shearing resistance tests were conducted i n connection with the original borings, these data were not made available to the contractor. Consequently, as previously noted. Borings 3 , 4 , and 7 were made in the open marsh area between the rimway and taxiway. Shearing resistance tests were conducted in the laboratory on samples f r o m borings used to represent the original soi l condition and f r o m the borings taken f r o m the f i l l e d area to represent shearing resistance after consolidation.
Following the customary practice at the Michigan laboratory, two types of shear test were conducted on a l l samples: (1) the ring-shear test developed by the U n i versity of Michigan Soil Mechanics Laboratory and (2) the unconf ined-compression test used by a number of other soil mechanics laboratories.
The r ing-sheartest is a measure of what may be called the static yield value or shear stress greater than which the soil w i l l suffer progressive deformation. In thest tiests, observations are made of the
rate of shealring deformation f o r each load increment applied. From this may be determined, by extrapolation, the actual load at which progressive deformation occurs. The f ina l results are thus independent of dynamic resistance and represent that applied stress which may be sustained m static equil ibrium.
The shearing resistance, as determmed by the unconfined-compression test conducted in accordance with generally accepted procedures, has not been corrected f o r dynamic effects, so the test may be termed a rapid shear test. The load is applied at a continuous rate unti l fa i lure is produced and in a much-shorter period of time (5-minute loading period). Over several thousands of paral le l tests, i t has been found that shear values obtained f r o m these unconfined-compression tests are close to four times those obtained f r o m the ring-shear tests in the case of plastic clays of the t ru ly cohesive type or m the case of saturated clays. I t has also been found that f o r s t i f f clays and f o r materials which have granular characteristics the ratio of the shear values obtained f r o m these two tests is quite errat ic and, in general, higher than in the case of plastic clays. In pre-sent i i^ the results f r o m the unconfined compression, i t has been the practice to plot these shear values to a scale four times greater than is used f o r the r i n g -shear test, which brings the divergent r e sults into close focus in most cases. In reportmg the shearing resistance f r o m unconfined compression, i t has also become common practice to report the equivalent shearing resistance to the reduced scale or a quarter of the measured value in the rapid shear test.
In connection with the shearing resistance test on this soft, s i l ty clay, one other observation should be made. In the borings outside the f i l l e d area, the equivalent shearing resistance f r o m the vmconfined-compression test runs generally lower than the yie ld value determined by the r i n g -shear test, a characteristic which has been foimd common to flocculated clays of high moisture content that have not been disturbed or remolded. While the wr i te r can offer no well-supported explanation of this phenomenon, i t appears to be related to the sensitivity of the clay and the fact that, af ter remolding, the highly sensitive clay seldom, i f ever, regains i ts or iginal shearing resistance. While this departure f r o m

13
the usual ratio between shear values f r o m these two tests is apparent on most of the samples f r o m those borings, i t does not hold f o r the samples f r o m borings within the- f i l l e d area, where the results f r o m
in place f o r periods of t ime varying f r o m 2 to 5 months. Shear profi les of these two groups of borings have been combined to f o r m a composite shear prof i le f r o m which average shear values may be determined as
COMPOSITE SOIL PROFILE
BETORE PUKSINS FILL
F INE SANDY S R W SILT
SHEARING RESISTANCE CURVES
F I L L , MEDIUM B R O W N
GRAY SILT, T R A C E FINE SAND TO F INE SANDY
o u t mom C L A Y E Y SILT, SOME FINE SANO
O R S A N I C M A T T E R
R N E T O M E D I U M C R W O R S R E E N S A N O , S O M E S I L T T O S I L T Y . • O R W a S T O P P E D .
IfiS 4 0 0 _ j s s n o
ILBS P * R S O
A V E A O E . S H E A R I N G <)
t o o 4 0 0 s o o g o o i q o e
L B S . P t R 80
'AVERAte SHEtajNO
L B S F f e H S O l
tto 4 0 0 ibo B O O
T R A N S V E R S E S H E A R I N B R E S I S T A N C E I N L B S , P E R SaFT
IPOSITE SOtt. PROFILEl
AFTER PLMMS FILL
F I L L , M E D I U M
a M S I L T , T R A C E T O S O M E H N E S A N D .
C R O A N I G M A T T E R .
F I N E T O M E D I U M anW S A N D , T R A C E O F S I L T T O S I L T Y .
O R S A M I O M A T T E R .
B O R I N B S T O P P E O .
Figure 13. these two tests is close to the usual ratio of 4 to 1. In this connection, i t may be noted that in borings under the runways the soft, s i l ty clay may have been r e molded by pile driving and by displacement under the weight of the overload f i l l , f r o m which i t might be presumed that the unusual result obtained in the case of the undisturbed flocculated clay is a function of a flocculated structure.
In connection with the contractor's i n vestigation. Borings 3 , 4 , and 7 have been selected as representative of soil area 1 in i ts original condition before i t has been altered by construction operations. Borings 2 , 9 , and 11 have been selected as representative of the same soil area imder the runway and taxiway after the sand piles have been driven and the overload has been
representative of the soft s i l ty clay under discussion.
The comparison of shearing resistance before and after consolidation in terms of the transverse shearing resistance or r i n g -shear test is shown in Figure 13. Composite boring logs are indicated on the le f t fo r Borings 3, 4, and 7 and on the right f o r Borings 2, 9, and 11. The composite shear prof i l e fo r the original soi l in Area 1 is shown on the left-handportion of the central chart and the composite shear prof i le after consolidation is shown on the right-hand portion of the chart. Average shear values at several different depths have been ind i cated by the heavy dashed line. These shear values are shown to the nearest 5 lb . per sq. f t . and are based on the a r i t h metic average of shear test results f o r the

14
si l ty clay only. A l l shear test results are shown on the charts including those f r o m samples of sand and m the case of Boring 7, a more-highly consolidated chalky s i l t found only m that boring around Elevation -30. Such unrepresentative and exceptional test results were not included in the average shear curve shown by the heavy dashed line.
For the purposes of the present discussion, a comparison of shear values must be l imi ted to the original soi l below the depth to which the sand f i l l has penetrated and which has not been displaced by the superimposed load. I t should be noted in Borings 3, 4, and 7 on the left-hand portion of the central chart that the uppermost layer of clay down to approximately Elevation -10 has almost negligible shearing resistance and has, in a l l probability, been almost completely displaced by the sand f i l l . This soft, s i l ty clay sometimes would not even support the weight of the small steel r ing in the ring-shear test (which produces a shearing stress of approximately 4 lb . per sq. f t . ) and this is the value that has been reported fo r this material in a number of the tests. In the case of the unconfined-compression test on this softest clay when the 3-inch samples were extruded f r o m the l iner , the small cylinder slumped under its own weight and i t was impossible to apply any compression load.
Omitting comparisons in the softest clay strata above Elevation -10, which has largely been displaced by sand f i l l , i t may be seen that the average transverse shearing resistance in those borings representing the original soi l conditions varies f r o m 130 to 195 lb . per sq. f t . within the depths at which these tests were performed. The range in the average shearing resistance f o r these same depths f r o m the borings taken in the f i l l e d area after consolidation is f r o m 45 to 125 lb . per sq. f t . indicating a measurable loss in shearing resistance, due presumably to the disturbance caused by pile dr iving or other construction operations and not recovered during the consolidation period.
Figure 14 presents a s imi lar comparison based upon the results f r o m the unconfined-compression test. In this case, the unconfined-compression test on samples f r o m the borings representing original soi l conditions and undisturbed clay gave an equivalent shearing resistance f r o m 85 to
160 lb . per sq. f t . In those borings f r o m the f i l l e d area after the consolidation period, the equivalent shearing resistance f r o m unconfined compression varied f r o m 55 to 110 lb . per sq. f t . , again indicating a definite loss in shearing resistance, presumably due to remolding or other disturbance during the construction period which was not recovered by consolidation. I t should also be noted that the equivalent shearing resistance f r o m unconfined compression IS measurably less than the transverse shearing resistance in Borings 3, 4, and 7, representing the original soi l conditions and undisturbed clay, but this v a r i ation was not established by a s imi lar comparison for the remolded soi l .
While the direct comparison between moisture contents and shearing resistance before and after consolidation were the p r imary objectives of that part of the i n vestigation being presented in this paper, there were several other subjects studied in the contractor's investigation which are of passing interest in the present d is cussion. A stability analysis was made to determine the overload ratios imposed on the original soi l mass by the proposed heights of surcharge called f o r by the plans and specifications. This analysis indicated that the overload ratios with respect to the uppermost layer of softest clay were so high that i t was quite obvious that complete d is placement could be anticipated before the f u l l surcharge could be placed. Overload ratios were computed only fo r Area 1 which had been judged to be the most c r i t i ca l f r o m prel iminary investigations. However, such c r i t i ca l classification covered the major portion of the length of the taxiway, and a considerable portion of the length of the runway. In these areas, the marked correlation between high overload ratios, fa i lure areas, and points of maximum settlement lef t no doubt as to the source of excessive settlement and subsidence.
CONCLUSION
In summarizing the results of the soil investigation made by the contractors, the following conclusions are presented:
1. Laboratory tests on undisturbed sam -pies f r o m borings in the c r i t i ca l fa i lure area, designated as Area 1, identified the soft, s i l ty clay extendmg f r o m thei surface to a depth of approximately 60 feet as a flocculated clay of high sensitivity which

15
COMPOSITE SOILPROFHJ BEFORE PLACIN9 FILL
EQUIVALENT SHEARING RESISTANCE ICOMPOSITE SOIL PROFl.fl
9 fw 4QII tot w» H f g — ? y g w w m m "
C R O A N I C M A T T E R
F « E TO MEDIUM G R A Y
iSM%''l.lf^O*S!!.<rY
B O R M S S T O P P E D
L B S P a i SO Ft
ILBS PtR SO H T
I S d L B S P t E R S O i t T
toERAOt SMEA^INO W S W C E CUl
1
ILBS PfeR SO.
teVERAdE SHE^RINS RESISTANCE (URVE
LBS pan M qT
AFTER PLACma FILL
F I L L . M E D I U M B R O m S A N D
G R A Y S I L T , T R A C E T O S O M E F I N E S A N D
O R G A N I C M A T T E R
F I N E T O M E D I U M
O R G A N I C M A T T E R
B O R I N B S T O P P E D
0 S C O W O O 2 4 0 0 3 2 0 0 4 0 0 0 0 G O O M O O E 4 C 0 9 2 0 0 4 0 0 0 O N E - H A L F C O M P R E S S I O N S T R E N G T H I N L B S P E R S O F T
» EC«'lSLENT"?R.NlS?RSETHEllSSfG''RE.fB?ANCE'«S L B 1 ! » P E . « F T " ~
4 I S
4 1 0
Figure 14.
has been foimd to suffer a loss in shearing resistance upon being disturbed or r e molded.
2. Shearing-resistance tests on undisturbed samples f r o m borings outside the runway area representing the original soi l indicated that the yield value or static shearing resistance based on the average of three borings varied f r o m 30 to 195 lb . per sq. f t . in r ing shear and f r o m 25 to 160 lb . per sq. f t . in the unconfined-com-pression test. The flocculated clay on top in several cases was so soft that shear values were not measurable.
3. In the group of three borings taken along the centerline of the runway and t ax i -way in soi l Area 1, the softest clay on top had been largely displaced by the sand f i l l , and the shearing resistance in the lower strata, which had been disturbed and r e molded by driving of the sand piles, was definitely less than in the original state, even after having been subjected to periods of presumed consolidation by the overload
f i l l in place f o r periods of 2 to 5 months. In this case, the static shearing resistance, or yield value, f r o m the ring-shear test, based on the average of three borings, varied f r o m 45 to 125 lb . per sq. f t . , as compared to 130 to 195 lb . per sq. f t . in the undisturbed or original condition.
4. Comparison of moisture contents f r o m the present investigation between the undisturbed soi l and that which had p re sumably been consolidated f o r 2 to 5 months under the overload f i l l indicated that there had been no measurable change in moisture content due to consolidation. This conclusion was also confirmed by the comparison of moisture contents f r o m the original borings, in which there was s t r i k ing agreement f o r comparable samples betweenmoisture contents before and after consolidation.
5. The stability analysis made as part of this investigation showed that overload ratios in the c r i t i ca l soi l area investigated were fa r in excess of those certain to cause

16
soi l displacement. The coincidence between high overload ratios, fai lure areas where subsidence and mudwaves were observed, and points of maximum settlement leave l i t t l e question that excessive f i l l settlement was due to exceeding the supporting capacity of the soft subsoil.
6. Settlement of the f i l l was excessive following the consolidation period imt i l the f ina l paving was completed in the summer of 1952. This excessive settlement has continued and in approximately a year has amounted to a maximum of 1. 5 feet in the more-cr i t ica l areas which coincide with those designated by the contractor's i n vestigation. As a f ina l testimony to the ineffectiveness of the sand-drain piles under the soil conditions of the Norfolk project and impracticabil i ty under those
conditions of a design predicated on the general theory of consolidation, i t may be noted that the Navy, during the past f a l l , found i t necessary to arrange fo r the restoration of the runway extension which has been the subject of this discussion. Those most fami l ia r with the present status of the project anticipate that the maintenance of the runway w i l l be a serious problem f o r a long time to come.
REFERENCES
1. Terzaghiand Peck, "Soil Mechanics in Engineering Practice", John Wiley and Sons, 1948, p. 77, p. 241.
2. Procedures f o r Testing Soils - A m e r ican Society fo r Testing Materials , 1950.
Discussion
L . A . PALMER, Engineering Consultant, Soil Mechanics and Paving, Bureau of Yards and Docks, Department of the Navy — There have been instances of success in deep soil stabilization by ver t ical sand drains. A description of a notable i n stance of such success in Navy e}q>erience is found in the 1949 Transactions of ASCE in a paper; "Failure of Quay Wall at Mare Is land," by L . C. Coxe. There have been other instances of only par t ia l success and In a few instances, the installation of ver t ical sand drains has been entirely fu t i le in accomplishing any noticeable degree or extent of deep soil stabilization.
The Instance described by Housel tends to f a l l in the second category. The easterly end of the runway extension at NAS Norfolk has sunk at least 16 inches, following completion of construction, and indications are that the settlement w i l l continue.
This wr i t e r believes that mud waving sheared off a considerable number of the ver t ical sand drains in this case and that installation of the drains should have been accomplished after placing the excess surcharge over the site and not p r io r to this operation. The sequence of operations should have includedf i r s t the placing of the excess f i l l to drive the water out of the mud. This would cause mud waves which should have been allowed to reach an equilibrium condition and without removal of the displaced mud to displace such
equilibrium. Thereafter, the ver t ical sand drains could have been constructed without being sheared off by displacement of the soft, organic s i l t under pressure of the surcharge.
Any of us can be misled by technical publications whibh indicate that the speed of consolidation of the soft soi l by the sand drains can be predicted with a f a i r degree of accuracy. Since estimating the coefficient of permeability i n the horizontal direction is mostly guesswork, such a prediction is not possible. Af te r there is f u l l realization of the fact that one usually cannot obtain a reliable estimate of the rate of settlement after sand-drain i n stallation, one tends to proceed with more caution and prefers , whenever possible, to install the drains after and not before the surcharge loads are applied.
If i t were possible to now locate the points where sand drains were Installed and covered over with f i l l at NAS Norfolk, one could take borings down through the sand-drain locations. If this were done, i t would l ikely develop that the drains were broken off and displaced in shear by the flowing mud.
Usually, the purpose of sand drains is to accelerate the settlement and have the bulk of i t completed p r io r to construction. Where the soft soi l is deeply seated and located at appreciable depths below the proposed elevations of footings of a struc-

17
ture, this is the pr imary consideration. But when i t is necessary to build up bearing capacity in the soft soi l as wel l as to complete its consolidation before construction, then one must make a careful study of the remolding characteristics of the soil to be stabilized by sand drains. The disturbance, caused by the installation of sand drains at 8 to 12 feet, on centers, may weaken a soil much more than its subsequent drainage under load into sand drains can strengthen i t . This condition was observed by this wr i t e r at a proposed warehouse site in the Norfolk area that is about 3 to 4 miles f r o m the air station. The deep layer of organic s i l t at this site proved to be sensitive to remolding, and f o r this reason, sand drains were not recommended.
Neither are sand drains efficacious in peat soi l . This wr i t e r made an extensive study of the settlements of concrete barricades at Port Chicago, California. Here sand drains had been installed and overloaded with extra surcharge which, after several weeks, was cut back to finished grade with subsequent construction of the barricades. These have settled f r o m 4 to 9 feet or more since 1944. The soil in this case is disintegrated (not fibrous) peat with an organic content of more than 30 percent. In consolidation tests, the rate of strain was independent of the thickness of the sample. In other words, the rate of consolidation of peat (not peaty or peatlike soils) is not determined by the coeff icient of permeability, and hence i t is i n dependent of the distance of f low of the escaping water.
A thorough f i e l d investigation of sand drains under controlled conditions is long overdue. It is not a problem that can be worked out altogether in the laboratory. Much more basic and practical information should be made available before one can have a reasonable degree of confidence in the use of ver t ica l sand drains.
Basically, the theory of soi l consolidation is probably sound. However, there is much wrong with its use and application. One must be an irresponsible optimist to believe in the possibility of precise es t i mates of the subsidence of mill ions of cubic yards of soil on the basis of the observed laboratory behavior of a few pounds of the stuff. It is just as detrimental to the interest of the public to oversell the uti l i ty of soil mechanics as i t is to destroy
a l l confidence in its use. Water held by physiochemical forces
in fine-grained soi l , r e fe r red to by Housel as absorbed water, is probably never lost to any appreciable extent by normal conditions of loading. Also, the bulk of such adsorbed water is retained in the soil at the boiling temperature of water. But f ree water, lost on a i r drying, can and is released by the soil under external load application. The release of this mechanically held water into pervious layers that bound the layers of f ine grained soil is adequately described by the theory of consolidation, the mathematics of which is about identical to that f o r the unidirectional f low of heat in an insulated metal rod or the diffusion of a salt into a solvent. Diff icul t ies aries when one idealizes certain conditions, such as "previous boundaries," the continuity of stresses (due to external load) through multiple layers of diss imilar types of soi l , and the assumed homogeneity of large masses of fine-grained soil wi th respect to permeability. The near-ideal conditions do sometimes exist, and they lead to f a i r l y accurate settlement predictions which receive altogether too-much publicity.
W I L L I A M S. HOUSEL, Closure - The wri t ten discussion of this paper by Palmer was welcome, inasmuch as he had f i r s t hand knowledge of the particular sand-drain installation under discussion. The author was glad to have his somewhat-qualified confirmation of the conclusion that the sand drains were "entirely fu t i le in accomplishing any noticeable degree or extent of deep soi l s tabil ization." There were also a number of other points brought up by Palmer on which the author wishes to comment. The question of shearing off the sand drains by f i l l displacement is an example of only one of the important uncertainties about sand-drain installation which are a l l too frequently taken f o r granted without any real ef for t made to determine the f ina l result achieved. The continuity of the ver t ical sand drains is largely a matter of speculation, as i t is d i f f icu l t to determine by direct observation. It is quite probable that they have been sheared off where there has been excessive f i l l settlement. However, there are other areas where f i l l settlement has

18
not been excessive and, in fact , substant ia l ly less than anticipated f r o m assumed consolidation. In these areas, there is no reason to expect abnormal disturbance of the sand drains f r o m subsequent f i l l settlement. In locating the check borings, the attempt was made to obtain data i n some of these relatively undisturbed areas. The moisture content and shearing resistance data presented in the paper show the same lack of consolidation effects in a l l areas which is the essential consideration under discussion.
Shearing off of the sand drains is only one phase of soil disturbance in sand-drain installations. Disturbance due to placing of the sand drains is another reality which has been passed over too lightly. The steel pipe mandrel used in placing the ver t ical sand drains at Norfolk was 14 inches in diameter and, in a depth of 60 feet, involves a volume displacement of approximately 2.5 cu. yd. Years of pile dr iving experience has shown that piles driven in soft, saturated clay soils result in practically complete volume displacement. Specifications f o r heave and alignments of a l l piles recognize the serious nature of this volume displacement. Occasional collapse and damage to steel shells of cast-in-place concrete piles furn ish fur ther evidence of this phenomenon. In the light of a l l this accumulated experience, i t is something more than optimism not to recognize the probable damage to unsupported columns of sand without any structural continuity whatsoever. In the author's opinion, i t is extremely problematical that the ver t ical alignment of sand drains is sufficiently consistent to produce effective ver t ica l drainage aside f r o m a l l other questions raised as to their effectiveness.
Another aspect of soil disturbance due to installation of the sand drains which does not have to be lef t to speculation is the loss of shearing resistance due to the remolding effect on flocculated clays of high sensitivity. This point was brought up in the original paper and also emphasized by Palmer. The variation in shearing resistance before and after consolidation clearly established the de t r i mental effects and more permanent character of remolding under the soi l conditions at the Norfolk site. This led Palmer to place such soils in the classification in which ver t ical sand drains
would not be practical. He also adds peat to the soils not benefited by ver t ical sand drains which would appear to the author to leave only a restr icted range of rather exceptional so i l conditions f o r their effective use.
Palmer cites two sand drain projects in his discussion; the quay wal l at Mare Island, California and f i l l construction at Port Chicago, California, both in the San Francisco Bay area. By strange coincidence, the author was asked to investigate both of these projects during the period in which he was stationed in this area while serving with the Navy, Both projects were in some diff icul ty and the assignment was to make an evaluation of them and submit any suggestions which re sulted to the off icer i n charge.
It has always troubled the author to see Port Chicago included among the examples of sand-drain installations which are presumably cited as successful applications. ^ His evaluation of i t at the time of construction was not much d i f ferent f r o m that of the present Norfolk project, except that the f i l l displacements were not as extensive. No change in procedure was suggested as the project was then nearing completion. As now re called, the author summarized this p r o j ect as an unsuccessful attempt to make the so i l behave in accordance wi th a theory which did not represent a realistic concept of soil behavior. The results of the study which Palmer made some years later is rather surprising confirmation of this previous evaluation.
The quay wal l at Mare Island was only one of several perplexing problems in a di f f icul t area that was then under development. The author made no special study of i t , although i t was included under a suggested program of investigation which i n cluded undisturbed samples, shearing re sistance tests, and complete stability analyses. The author had no fur ther contact with these problems or knowledge of the quay wal l unti l the f ina l results were r e ported by Commander L . C. Coxe as part of the "Symposium on Lateral Earth Pressures on Flexible Retaining Walls" in the 1949 Transactions of the American Society of C i v i l Engineers. The essential phases of this project may be summarized as f o l -
' "Vertical Sand Drains Speed Consolidation "( Soft Water-Beanng Subsoil", Engineering Mews Record, 1941, Vol. 138 p. 386.

19
lows: The quay wal l and dock f i r s t fa i led under a superimposed load which exceeded the supporting capacity of the underlying "plastic clay mud. " I t was then rebuilt with certain changes in design which i n cluded both an anchorage system and ver t ical sand drains. As described in the ar t ic le , "Concrete anchors supported by wood, ver t ical and batter piles and connected to the quay walls by steel t ie rods 2 inches and 2. 5 inches in diameter were not included in the original design but were installed after fa i lure of the wal l . " Af te r the t ie rods were connected, there was s t i l l "appreciable movement" and sand drains were installed. The exact sequence of these several steps is not entirely clear and the "appreciable movement" was also influenced by the load of a s i n k i i ^ tug moored to the dock.
At any rate after the installation of both anchorage system and sand drains was complete, the movement was reduced to a more-acceptable magnitude. Data given in the paper up to 1946 indicate a maximum of additional ver t ical settlement of 0.43 feet or about 5 inches in 42 months p r i o r to that date. Graphs indicate a continued progressive settlement at some points of approximately a uniform rate of 1. 5 inches per year. There are several interesting statements in this connection which deserve special attention and may be quoted as follows:
The action of the sand drams and surcharge was very effective although no actual data as to the reduction in pore pressures are available. This method of stabilization combined with the anchored tie rods completely checked any further motion of the quay wall and effective stabilization was realized In December 1942, approximately two months after the sand drain installation was completed.
The statement that the movement of the quay wal l was "completely checked" is not borne out by subsequent data taken up unti l 1946 and noted in the previous paragraph. That the relative improvement was due to reduction in so-called pore pressure was an assumption unsupported by factual data. Without going into the hypothetical ramifications of pore pressure, i t might have been just as reasonable to suppose that the anchorage system that was added was the more responsible factor i n the reduction in movement of the wal l .
In the paper presented by the author.
the statement was made with respect to sand drains "that the claims of successf u l application are seldom supported by more than f r ^ m e n t a r y and inconclusive evidence." Af te r careful consideration of the description of the Mare Island quay wal l , i t would seem that i t might serve as a f a i r example of the fragmentary and i n conclusive evidence re fe r red to and in the author's opinion, this would be a very generous evaluation of that project.
Aside f r o m these areas of substantial agreement, there are several points brought up by Palmer which require either f u r ther c lar i f icat ion or represent points of some difference. Understanding that the pr imary purpose of ver t ica l sand drains is to permit the gradual consolidation of soft unstable so i l deposits without d i s placement, i t would seem that placing of the surcharge f i l l f i r s t would defeat the declared purpose of the sand drains. If as stated in the discussion the displacement under the surcharge f i l l was "allowed to reach equi l ib r ium," there would no longer be any point in having the ver t ical sand drains. In connection with this same discussion, i t would appear to the author that Palmer does not clearly differentiate between "p l ac i i ^ the excess f i l l to drive the water out of the mud" which is consolidation and allowing the mud waves to reach an equil ibrium which is clearly a function of shearing displacement.
In the original paper, the author de f i nitely questioned the validity of the theory of consolidation and would continue to hold that viewpoint. Actually, the difference in viewpoint is not too great when Palmer says, "Basically, the theory of consolidation is probably sound" and the author would say, "Basically, the theory of consolidation is probably not sound." Both positions leave room f o r an adjustment of ideas as additional evidence is presented. In supporting the negative position, the author would f a l l back on the definition of theory as a description of the results of observation and experiment and the contention that when theory andpractice disagree, the theory must give way. I t is certainly in this area that the theory is being questioned and the experimental data presented in the original paper are capable of standing on their own feet.
In the closing part of his discussion. Palmer brings up the important subject of adsorbed water and the conditions and

20
forces involved in its removal f r o m the soi l . His differentiation between f ree and adsorbed water by evaporation at the b o i l ing point would seem to be an over-s implif icat ion not liable to c la r i fy the confusion and misconceptions which may arise in a discussion of these phenomena. The author, on the other hand, would regard a l l moisture in a soft, saturated clay as being adsorbed to a varying degree, depending upon the magnitude of the forces of molecular attraction with which i t is held. Much of the water in such physical combination, sometimes called the water of placticity, may be subject to evaporation at the boiling point of water. The most-closely held water sometimes considered as chemically combined would be f a r beyond the effects of ordinary physical pressure and temperature less than the boiling
point of water. In the original paper, the attempt was
made to be quite specific on the probable range of consolidation effects involving applied pressure and its relation to shearing resistance which controls mass displacement. The only amplification of the view presented which appears to be required at this point is to acknowledge that pressure concentration which may be applied within the l i m i t of shearing displacement does represent a range of actual consolidation which might be achieved under practical conditions. To the author, this represents the only range within which the consolidation theory may be considered val id. It is f e l t that within this range, consolidation is too long and too l i t t l e to be of more than negligible value under practical conditions in the types of soil under discussion.

Hawaii's Experience with Vertical Sand Drains K. B . HIRASHII4A, Testing Engineer T e r r i t o r i a l Highway Department, Honolulu
Settlement observations taken on two sand-drain projects were plotted and compared with the estimated t ime rate of settlement. Settlement calculations were made by combining the separate percent consolidations due to the vert ical drainage and the radial drainage of the pore water. The coefficient of consolidation f o r the vert ical drainage of the pore water was determined by means of a laboratory consolidation test. The coefficient f o r the radial drainage of water was computed f r o m the results of f i e ld permeability tests and f r o m observations on the rate of settlement shortly after the installation of sand drains.
• VERTICAL sand drains to accelerate the settlement of highway embankments have been used on two recent projects i n the T e r r i t o r y of Hawaii: (1) Federal-Aid Project No. F 15(3) at the crossing of Kalanianaole Highway over Kahanaiki Swamp, and (2) Federal-Aid Secondary Project No. S 223(2), HaleiwaCutoff Road, across the K i i k i i Swamps.
The author is indebted to the pioneer work of O. J. Porter {V) and others in r e gard to design and construction methods involving ver t ical sand drains. Since these aspects of the subject have been competently and adequately covered by others and data are readily available, no extended discussion concerning them w i l l be attempted here. Instead, this paper w i l l attempt to deal with the more-technical phases of the subject about which there appears to be a paucity of information in the l i terature.
Both swamps refer red to above were formed of al luvial sediments washed in f r o m higher groimd mixed with some o r ganic material and occur over areas which, in the geologic past, were probably under sea level or, at least, close to the shore l ine, so that they are underlain by sandy material of marine or igin . By marine or igin is meant that the sand was either part of an ocean beach, or a sand dune in case the shore line was some distance out. I n the case of Kahanaiki Swamp on Project F 15(3) the entire material over the sand bottom was soft , so there was a drainage face at the bottom of the swamp. In the case of the K i i k i i Swamps on Project S 223(2), part of the al luvial deposits over the sand had consolidated or hardened suff ic ient ly so that, apparently, i t was uncom-pressible and relatively impervious to the f low of moisture. Ver t ica l drainage was considered to be only in an upward direc
tion. The existence of this hard layer was discovered during the soi l -prof i le invest i gations p r io r to construction. A cyl indr ical steel mandrel was used to place the sand drains, and during actual construction i t was possible, by means of the heavy pi le driving hammer used, to drive the steel mandrel through this hard layer, although with considerable ef for t . ^ The subsequent settlement data appeared to show that this hard layer is not consolidating under the weight of the embankment. Thus, the d r i v ing of the sand piles through this hard layer, although i l has done no harm, has not affected the settlement of the embankment, which is due entirely to the consolidation of the upper, softer layer.
WORKING T A B L E , CONSTRUCTION METHODS, SETTLEMENT DATA
A working table measuring approximately 2 feet 6 inches in thickness was f i r s t la id over the surface of the swamp so as to p ro vide a relatively stable surface over which equipment could be operated. Immediately after the working table was leveled off , holes wer^ dug through i t , settlement platforms installed over the top of the soft swamp layer, and the holes backfi l led.
The settlement platforms consisted of a base 3 feet by 3 feet built of heavy 2-inch planks with a length of H-lnch galvanized pipe attached at the center. As the em -bankment was buil t up, additional lengths of H-inch pipe were added as needed. Elevations were taken on the pipes as the work progressed and the results plotted to show the settlement with t ime. This w i l l be discussed later (see Figs. 5 and 6).
A paper on the subject was presented by the author at the June 1952 convention of the 'That IS relative to the effort required to penetrate the uDper softer layer.

22
Western Association of State Highway Off ic ia ls at Seattle, Washington, at which time one of the projects here discussed was s t i l l under construction. As of A p r i l 6, 1953,' Project F 15(3) has been completed and in service fo r 19 months. P r o j ect S 223(2) has been completed and in service fo r 7% months. Levels were taken on the finished pavement recently and compared to levels at the time of completion. The additional settlements under service thus observed are shown on the time-settlement curves (Figs. 5 and 6).
Placing of sand drains was begun as soon as the working table was ready to receive the necessary equipment.
Using a power auger, holes were dug through the working table to the top of the swamp. A steel mandrel was then driven through the soft, compressible layer to stable (noncompressible) material below. The mandrel was driven, without leads, by means of a regular pile driving hammer. I t was a simple matter to stand up the mandrel by letting i t f a l l of i ts own weight into the soft layer. Guy wires tied onto truck winches then kept the mandrel plumb. For the lengths of mandrels used on the two projects here reported, up to approximately 40 feet, the above method of driving without leads proved practicable. (Driving with leads was t r ied and found to be much slower.)
The mandrels on the two projects were both fabricated by the contractors f r o m heavy 18-inch-diameter steel pipe. An orange-peel arrangement, which resulted in a conical point when closed by means of an inside catch, was used for the driving end on Project F 15(3). Af te r driving to the necessary depth, the mandrel was f i l l e d with sand. A " f i sh l ine" extending down the inside of the mandrel to the point was pulled to open the orange peel. This a l lowed the sand to be deposited in the hole as the mandrel was slowly withdrawn. On the other project, the contractor used a solid, conical shoe hinged on one side foir his driving point. In dr iving, the r e sistance of the ground kept the shoe in the closed position. In raising the mandre l , the shoe dropped of i ts own weight to the open position, thus allowing the sand to run out.
One phenomenon that has to be guarded against is that of arching of the sand in the mandrel. To overcome this and to insure 'Date of this paper.
proper density of the sand in the hole, the mandrel was provided with a tight cover and compressed air was applied to the top of the sand when withdrawing the mandrel f r o m the hole. The pressure of the a i r and the rate of withdrawal of the mandrel have to be carefully regulated, otherwise there is danger of blowing and dispersing the sand into the swamp muck or of having a part ia l ly empty hole.
Cost data f o r the two Hawaii projects have been analyzed in Appendix A.
SOIL TESTS
Undisturbed samples were taken and consolidation tests were run. Due to a lack of deep sampling tools, the samples were obtained only f r o m relatively near the surface.
From the consolidation tests the f o l lowing data were obtamed: (1) the voids-ratio versus applied pressure relat ionship and (2) time-settlement relat ionship f o r the sample. From the t ime-settlement relationship f o r the sample, the coefficient of consolidation was calculated by the square root of time (Gilboy's) method.
Since the laboratory procedures in carrying out the above tests and the various empir ical rules f o r adjusting the laboratory data are wel l known, the subject w i l l not be considered fur ther here.
The pressures on the soft swamp mater i a l at various stations along the center-line prof i le , due to the highway embankment, were calculated and the corresponding voids-ratios estimated f r o m the voids-ratio versus pressure relationship developed by the consolidation tests. The total settlement was then estimated by means of the following formula:
ei - eo (1) " 1 - eo " where S = total settlement
ei = ultimate voids-ratio due to applied loads
eo = voids-ratio p r io r to application of loads
D = thickness of compressible layer
The voids-ratios eo and ei were taken as the average of the voids-ratios at the top and at the bottom of the compressible layer. The pressure at the bottom of the compressible layer due to the embankment

23
load was calculated by means of the f o l lowing formula:
_ 1 n
(B - I - sin B) (2)
q n B
where P = pressure at bottom of compressible layer at a point d i rectly below the center of the embankment section
•• intensity of surface loading : 3.1416 •• angle subtended by the width of the embankment at the point where P is estimated.
METHOD OF COMPUTING T M E -SETTLEMENT
In ordinary consolidation, the drainage of the pore water is in the ver t ical direction and takes place according to the f o l lowing differential equation, due to Ter -zaghi (2). ^
ap = V P at
whole depth of soft material in the case of Project S 223 (2)
The basic conception of the theory of consolidation is that when the hydrodynamic excess pressure P in the pore water r e duces to zero, the consolidation is complete and grain-to-grain contact of the soil results. Hence, (Pi - P ) /Pi is a measure of the state of consolidation and
Percent Consolidation = U % = P i - P ^ JQQ
(6)
The differential equation (Equation 3) has been completely solved f o r various boundary conditions and various tables and curves are available in the l i terature. For the boundary conditions here specified, the curve (Fig. 1) shows the relationship between the percent of consolidation and the nondimensional t ime factor T „ ,
kv (1 + e) a-y (4)
where P = hydrodynamic excess pressure of the pore water at any t ime, subsequent to t = 0, due to the embankment load
z = depth below surface at which the pressure P is measured,
t = time c = coefficient of consolidation f o r
^ ver t ica l drainage of the pore water
k^ = coefficient of permeability of the swamp material f o r ver t ical f low of the pore water
a = coefficient of compressibility of the swamp material
e = voids ratio y = density of the pore water
The boundary conditions appropriate to the present problem were taken as,
P = P i when t = O") P = 0 f o r z = 0 (5)
0 f o r z = H 3P az
T = ^ t V j j2
(7)
I f we know the values of Cy and H f o r the swamp, we can compute by Equation 7 the t ime factor Ty corresponding to any time t subsequent to the application of the embankment load onto the swamp, and thus f ind the corresponding percent of consolidation (U%) f r o m the curve of Figure 1. This percent of consolidation applied to the total ultimate settlement computed by Equation 1 is then the estimated settlement up to the t ime t .
where Pi= pressure due to the we^h to f the embankment, assumed to be uniform throughout the whole depth of the swamp
H = half-depth of soft-compressible layer f o r Project F 15(3) and the
0 4 0 6 0 8
T l m t Foctor ( T , )
Figure 1. Chart for determining percent of consolidation due to vertical drainage.
With the installation of sand drains the drainage of the pore water can take place

24
in horizontal radial directions as wel l as ver t ical . For this three-dimensional consolidation, the appropriate differential equation is
3P I T
cQ'p + a'p + a p) (8)
Transforming to cyl indrical coordinates, and making use of axial symmetry, Equation 8 becomes
i P = cO*p + 1 ap + a*p) at (a?" r ar a ? ) (9)
Equation 9 is based on the assumption that the coefficients of consolidation in the ver t ical and radial (horizontal) directions are the same. In general this is not the case so that instead of Equation 9 we w i l l have.
at a f P , aza Cr i
a'p (10)
where c.. ky(l+e) a r
1 ap i ^ ^ F a F J coefficient of consolidation f o r the ver t ical drainage of pore-water
k^ = coefficient of permeability f o r the ver t ica l f low of pore-water
c = k (1+e) = coefficient of consolidation ^ — ^ - — f o r the radial (horizontal)
* drainage of pore-water (10a)
k = coefficient of permeability f o r ^ the radial (horizontal) f low of
pore-water
Equation 10 can be solved as a whole or, more conveniently, i t can be split into two parts,
ap = , a'P (3)
ap at
a'p + 1 ap ar' r ar
(11)
Each part wi th appropriate boundary conditions is then solved separately and the corresponding percent of consolidation at a given t ime t computed f o r each. I t can be shown that these par t ia l percent consolidations can be combined according to the f o l lowing formula* to give the combined percent of consolidation applicable to equation 10.
100 - U% = (100 - Uy%)(100 - U^%) (1/100)
(12) 'see Reference 3.
where U% = combinedpercent consolidation U % = percent consolidation due to the
^ vert ical drainage of water U % = percent consolidation due to the
^ radial (horizontal) drainage of water
The part Uv% can be estimated easily by means of the curve in Figure 1. To calculate Ur% is not so easy, since published data on the subject are comparatively meager. The method of computing the percent of consolidation due to radial drainage, corresponding to Equation 11 is given in Appendix B. Numerous curves suitable f o r engineering use in connection with consolidation problems is given in a work by Barron (4).
Unlike the ver t ical percent of consolidat ion, the radial percent of consolidation depends not only on a t ime factor Tpbut also on a parameter b/a, where b is the radius of the area, assumed to be circular , drained by each sand drain and a is the radius of the sand drain itself. The sand drains were arranged in a hex^onal pattern as shown in Figure 2 and the values of b/a were 14. 2 and 11. 9 f o r Project F 15(3) and S 223(2), respectively.
I " T I
I p^San D |o in i -
r J -
'Hflxagonal Ar«o«
- 'Ci rc l i Eqliivalint in Ar io lo HHogon
Figure 2.
I Influmetd by I Sond Oroini
Figure 3 shows the relationship, computed as shown in Appendix B , of Ur% to the time factor T r where
c r t (13)
where Tj- = t ime factor f o r radial drainage of pore-water
t = t ime

25
C r = coefficient of consolidation f o r radial drainage of pore-water
b = radius of c i rcular area i n fluenced by each sand drain
If curves such as Figures 1 and 3 or corresponding tabular data are available, the problem reduces to the following steps: (1) For any t ime t , subsequent to the i n stant when the embankment load is applied, compute the corresponding time factors by Equations 7 and 13; (2) From the curves of Figures 1 and 3 f ind the corresponding percents of consolidation Uv% and Ur %; (3) Combine the above according to Equation 12; and (4) the combined percent of consolidation applied to the ultimate settlement as calculated by means of Equation 1 w i l l give the settlement up to the t ime t .
- b / o • 14 2
b/o • I I
T l i m Foctor tr,)
Figure 3. Percent of consolidation for radial (horizontal) drainage.
In the theory, i t is assumed that the total consolidating pressure is applied suddently at t ime t = 0. Physically this is impossible. The working table was laid in one l i f t , but the embankment was built up in layers and the work took many days to complete. Hence, the embankment load was actually applied gradually and not suddenly as assumed in the theory. Because of this fact , the settlement was computed by the method of superposition, which is val id because the differential equations are linear. The time when each convenient increment of load was applied was taken as a new zero of time in cbm-puting the settlement due to tliat particular increment. These par t ia l settlements f o r corresponding times on the t ime scales of Figures 5 and 6 were added to give the total
calculated settlements. The results were plotted as calculated t ime - settlement curves.
The consolidation due to ver t ical drainage begins as soon as work on the working table starts, but consolidation due to radial drainage does not begin unti l some time later when work on the sand drains begins. This introduces an e r ro r . However, the e r ro r is significant f o r small values of t only. For large values of t , that is f o r long t ime effects, the e r ro r is negligible.
In the determination of the time factors the only, unknown quantities are the two coefficients of consolidation. The f i r s t , C y , can be computed f r o m the laboratory consolidation test. Various techniques have been devised with this object in view and have been thoroughly discussed in the l i t erature so that additional comment at this t ime seems unnecessary.
The direct laboratory determination of C p , the coefficient of consolidation f o r radial drainage of pore water, is probably not possible. In the case of al luvial sediments, as in swamps, the deposit is s t rat i f ied. For use in the consolidation problem, the value of the coefficient of consolidation that is required is not that of the individual layers but of the deposit as a whole.
Referring to Equations 4 and 10(a), we see that cy and c r are proportional to the respective coefficients of permeability. The rat io of the permeabilities is therefore also the rat io of the coefficients of consolidation.
DETERMINATION OF THE PERMEABILITY RATIO
In theory we can obtain samples f r o m various strata and determine the coef f i cients of permeability of the various strata. For ver t ical f low, the permeabilities are in series and f o r horizontal flow they are in paral lel . Then following the electrical analogy of conductances in series and in paral le l , i t can be seen that the permeabi l i ty of the deposit as a whole in the horizontal direction is always greater than the permeability in the ver t ical d i rection. In practice, however, the method is cumbersome and uncertain due to the presence of poorly defined strata and lenses of different materials.
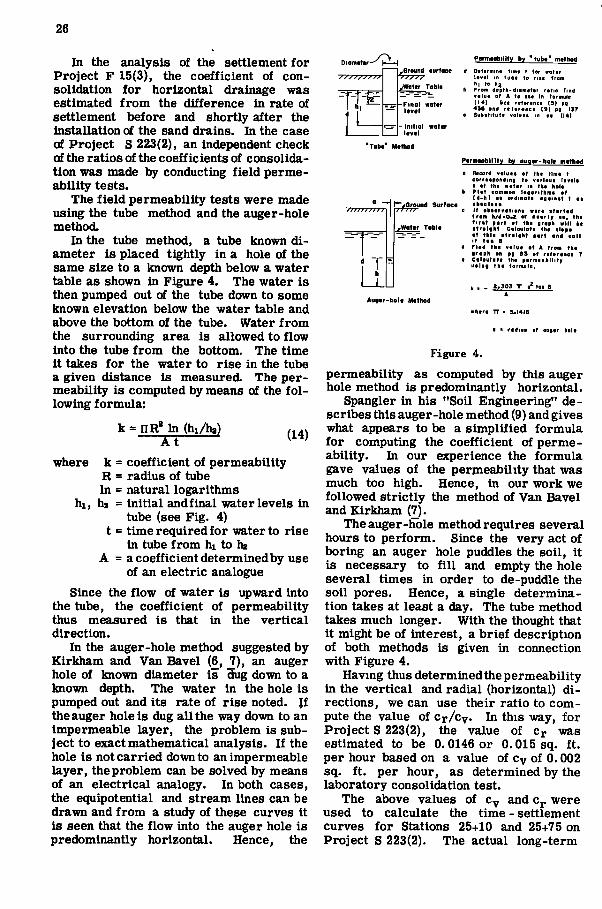
26
In the analysis of the settlement f o r Project F 15(3), the coefficient of consolidation f o r horizontal drainage was estimated f r o m the difference in rate of settlement before and shortly after the installation of the sand drains. In the case of Project S 223(2), an independent check of the ratios of the coefficients of consolidation was made by conducting f i e l d permeabili ty tests.
The f i e l d permeability tests were made using the tube method and the auger-hole method.
In the tube method, a tube known d i ameter is placed tightly in a hole of the same size to a known depth below a water table as shown in Figure 4. The water is then pumped out of the tube down to some known elevation below the water table and above the bottom of the tube. Water f r o m the surrounding area is allowed to flow into the tube f r o m the bottom. The time i t takes f o r the water to r ise in the tube a given distance is measured. The permeability is computed by means of the f o l lowing formula:
k = n R ' hi (hi/ha) A T (14)
where k R In
hi, h2
coefficient of permeability radius of tube natural logarithms in i t i a l and f ina l water levels in tube (see Fig. 4)
t = time required f o r water to rise in tube f r o m hi to h2
A = a coefficient determined by use of an electric analogue
Since the f low of water is upward into the tube, the coefficient of permeability thus measured is that in the ver t ical direction.
In the auger-hole method suggested by Kirkham and Van Bavel (6, 7), an auger hole of known diameter is Hug down to a known depth. The water in the hole is pumped out and i ts rate of r ise noted. | f the auger hole is dug a l l the way down to an impermeable layer, the problem is subject to exact mathematical analysis. I f the hole is not carr ied down to an impermeable layer, the problem can be solved by means of an electrical analogy. In both cases, the equipotential and stream lines can be drawn and f r o m a study of these curves i t is seen that the f low into the auger hole is predominantly horizontal. Hence, the
yGrcund surface
-Final water level
Initial level
Permeability by "tube" method
Determins limt t for wotsr Itvsl in tuba to n u from h| to h2 From dapth.diomatar rotie find volua Bf A to its« In formula (14) Sea rvfartnci {9) p« 436 and r i t t r anca (9) pg 137 Substitute watuai <n en (14)
Permeability by -hole method
7777777777-r| l ; ; ; ^ u „ d s . r r . c .
,Wot«f Tobit
T h
LLL
Racord vfllufls «f tbt tlma t corraapondinf t« «trt««« lavalt h of tha watar la tha hela Plat aaaiman laoonrbma of (d-h) aa ordiaata agaiaat t aa abaalaaa If obaarvatiana wara atartad from h/d.0.2 or aaa r l , aa, tba f i r a t port af tha grgpb wil l bt atralght caleulafa tha alapa af thia a t ro l ih t part and aall I t tan B Find tha valua af A tram tha graph an pg 93 at rafaranca 7 ei laulata tha parmaobnity uaing tha ferntula.
2.303 TT a' |.
Augir-hol< Mithod
whara TT - 3.1416
a . radiua of aogar hala
Figure 4.
permeability as computed by this auger hole method is predominantly horizontal.
Spangler in his "Soil Engineering" describes this auger-hole method (9) and gives what appears to be a s impl i f ied formula f o r computing the coefficient of permeabil i ty. In our experience the formula gave values of the permeability that was much too high. Hence, in our work we followed s t r ic t ly the method of Van Bavel and Kirkham (7).
The auger-hole method requires several hours to per form. Since the very act of boring an auger hole puddles the soi l , i t is necessary to f i l l and empty the hole several times in order to de-puddle the soil pores. Hence, a single determination takes at least a day. The tube method takes much longer. With the thought that i t might be of interest, a br ief description of both methods is given in connection with Figure 4.
Having thus determined the permeability in the vert ical and radial (horizontal) d i rections, we can use their ratio to compute the value of C r / c y . In this way, f o r Project S 223(2), the value of C j . was estimated to be 0.0146 or 0.015 sq. f t . per hour based on a value of Cy of 0.002 sq. f t . per hour, as determined by the laboratory consolidation test.
The above values of Cy and Cp were used to calculate the time - settlement curves fo r Stations 25+10 and 25+75 on Project S 223(2). The actual long-term

27
rate of settlement appeared to point to a value of Cp somewhat lower than given in the above and so a ratio of Cp /cy of 6 was used to calculate the settlements at Stations 47+43 and 48+20. *
settlement is shown in heavy lines and the calculated settlement in light lines. The observed settlement curves in both cases show a sharp drop at the time of installation of the sand drains. On both projects
T I M E - L 0 4 D P I A G t ^ A.MI
O R K I N S T A & L C -
OME.r>.tED F R O M 5 B O T O H a OOiVa C U T
P A V E . M E N i r U.AIO PROjaCT C O M P l - e l r e H
C A U C U M A R IG iq
T S O * ( t O M P l - E r E A T T C O M S O L I O A T i a M
C O I U S O L I D A T l O N B056+ C O M P L E p - E AT T^HIS P O l M T
AOO SOO
T I M E .
F i g u r e 5. Comparison of c a l c u l a t e d v e r s u s observed s e t t l e m e n t s for v e r t i c a l sand d r a i n s over the Kahanaiki swamp, P r o j e c t F 15
( 3 ) , S t a t i o n 269+ 25.
It is interesting to compare the estimated combined percent of consolidation as of a recent date, Apri l 6, 1953, with the hypothetical percent of consolidation as of the same date calculated on the assumption of vertical drainage only (no sand drains).
TABLE 1 COMBINED PERCENT CONSOLIDATION COMPARED WITH PERCENT
CONSOLIDATION DUE TO VERTICAL DRAINAGE ONLY PROJECT 5 223(2)
Station Date
Started
Date Sand Drains
Installed
Date Last Data Ot>tained
Ratio c , / = .
Calcul Consolidation with-
out Sand Drains
iteJ Consolidation
with sand Drains
25t7S 47443 48+20
10-27-Sl 10-27-51 I0-2S-51 [0-25-51
1-23-52 1-30-52 12-11-51 12-11-51
4-6-53 4-6-53 4-6-53 4-6-53
7% 7% 6 6
lb 28 4 39 6 25 5 22 9
% 91 4 92 1 88 8 88 4
A glance at the last two columns shows that the sand drains were effective in speeding up the settlement. It seems safe to assert that future settlement, if any, wi l l be slight; whereas if sand drains had not been installed, further progressive settlement could be expected resulting in high maintenance costs. The depths at the four stations listed in Table 1 are comparable and from the last column of the table, the combined percent of consolidation does not appear to be greatly affected by a change in the ratio of c^/c^ from 7% to 6.
SETTLEMENT CURVES
The observed settlement and the calculated combined settlement were plotted for a number of stations on both projects. An example from each project is presented (see Figs. 5 and 6). The observed * A r e c h e c k of o u r f i e l d - p e r m e a b i l i t y t e s t d a t a gave a v a l u e o f C f / c y of s l i g h t l y l e s s t h a n 6, o r a v a l u e o f Cy of 0 . 0 1 2 s q . f t . p e r h r .
some lateral plastic displacement was observed, indicating too fast a rate of loading, which probably accounts for the greater rate of observed settlement at the beginning. It can be seen that, if a constant displacement of about % foot be added in Figure 6, beginning shortly after the time the sand drains were installed, the calculated and observed settlement curves wil l agree closely and the above-mentioned plastic displacement would be accounted for. On Project F 15(3) a longitudinal plastic displacement under a bridge abutment appears to have taken place, although actually the problem is more complicated because erosion damage took place during a rainstorm that occurred shortly after the project was completed.
During March and Apri l of 1953, after both projects had been completed and in service for some time, levels were taken and the actual settlements at various points since completion were compared with the previously computed values. Such a comparison is given in Table 2,
Considering the fact that c and c vary from station to station and in view of the many other uncertainties involved, the observed settlement curves are considered to be in good agreement with the calculated.
CONCLUSION
Based on our experience on the two proj -ects mentioned, vertical sand drains are an effective and satisfactory method of accelerating the consolidation of soft, com-

28
oo
2 h
UI - I : 2 . w"'
T I N • 1 /
E - L GfU
O A C M - J,
S U F , C H / k R G ( S U I ' E M S A N
LRGE K M E
R N T
E M O V£0 Y E F
T I N • 1 /
E - L GfU
O A C M - J, 1.'
S U I ' E M S A N
LRGE K M E
R N T
E M O V£0 Y E F
- S A - W C
J O R K l
B U N G T A I
E T l \ _ E '
• V " - S A - W C
J O R K l
B U N G T A I
E T l \ _ E ' r
- S A - W C
J O R K l
B U N G T A I
E T l \ _ E '
C A L O B I
r r e i ' E D
> ' s s
S T T I z T T
. E M I - E M
I N T L N T
FRO FRC
2 i M 3
O O 1 O O 1 o S
•-1 0 LI C
A V S A V S
O . 3 O 1
3 ' 3'
1"
s (
3NS< i<S'. . CC M P l . E T L A- - T l MS T
< CI C A L C U L A T E 7 S O L D A I I O N q o "A C O M f U E T
< 9 -
U N E 152 P i P f : c u r O l
O B i E R > A P f I I - T. z » . < 2 (D -
P A V E M L N T LJ , I O - f E C T COI I P L f , T 6 I >
2£}0 3 0 0 350 . ^ O
- T I M E IM D A Y S
F i g u r e 6. Comparison of c a l c u l a t e d v e r s u s observed s e t t l e m e n t s f o r v e r t i c a l sand d r a i n s over K i i k i i swamps, P r o j e c t S 223 ( 2 )
S t a t i o n 25 + 75.
T A B L E 2 OBSERVED AND C A L C U L A T E D SETTLEMENTS
SINCE COMPLETION O F SAND DRAIN PROJECTS Observed Calculated
Project Station Settlement Settlement ft. ft.
F 15(3) 268+00 0.05 0. 81 F 15(3) 269+25 .68 . 71 F 15(3) 271+50 .47 .99 F 15(3) 273+5J .44 .37 S 223(2) 2S+10 .17 .49 S 223(2) 25+75 . 18 .33 S 223(2) 47+43 .09 .54 S 223(2) 48+20 .22 .57
presslble foundations. Too small a d i ameter of sand drains is probably not advisable, because of possible difficulties in fil l ing the mandrel with sand and of the arching of the latter due to friction of the sides. The 18-inch-diameter sand drains used on the two projects were of satisfactory size in these respects. In general, compressed air must be used to force the sand out of the mandrel, and both the pressure of the air and rate of withdrawal of the mandrel must be carefully regulated. The spacing of the sand drains can be varied so that reasonably complete consolidation wil l have taken place by the time the proj -ect is completed.
The coefficient of consolidation due to radial drainage of the pore water can be estimated by means of field permeability tests.
In computing the settlement due to vert ical drainage of the pore water, i t was assumed that the pressure distribution throughout the compressible layer was rectangular, whereas actually it was some -what trapezoidal. However, because of the relatively small part i t plays in the total
combined consolidation, i t is not believed the error is serious.
The discrepancy between the estimated settlements and the observed settlements for the periods since the completion of the two projects could be due to errors in the values of the coefficients of consolidation, to errors in the estimated ultimate settlements, or to other indeterminate factors.
In the field permeability tests, comparatively large "samples" are involved compared to the usual laboratory samples. Moreover, what is measured is the rate of seepage of the swamp water itself and not distilled water, which may have different seepage characteristics (8). Hence, the field permeability tests lead to more-representative values for the swamp mater ia l as a whole, at least theoretically.
ACKNOWLEDGMENTS
In closing, the author wishes to express his thanks to the many who gave generously of their time in making this paper possible, especially to H. Iwamoto, H. Tateishi, Jack C. Myatt, R. W. Hendry, George Shibano, Lawrence Felix, Edward Stone and Vernon Fvinn, all of the Territorial Highway Department, and to Frank R. Carlson, D. H. Walkington and W. J. Nelson of the U. S. Bureau of Public Roads. The projects here mentioned were undertaken by the Territorial Highway Department of which Ben E. Nutter is the Ter r i torial Highway Engineer. The views and opinions expressed herein are the author's own and do not necessarily reflect those of the department.

29
REFERENCES
1. Porter, O. J. "Studies of F i l l Construction Over Mud Flats Including A Description of Experimental Construction Using Vertical Sand Drains To Hasten Stabilization." "Proc, Of The International Conference On Soil Mechanics and Foundation Engineering," 1936 vol . 1, p. 229.
2. Terzaghi, Karl, "Theoretical Soil Mechanics."
3. Carillo, N. "Simple Two and Three Dimensional Cases In The Theory Of Consolidation Of Soils," J. Math. Physics, Vol. 21.
4. Barron, R. A. "The Influence Of Drain Wells On The Consolidation Of Fine-Grained Soils." A pamphlet published by the U. S. Engineer Office at Providence, R. I .
5. Frevert, Richard K. and Kirkham, Don. "A Field Method For Measuring The Permeability Of Soil Below A Water Table." Proceedings Highway Research Board, 1948, Vol. 28, pp. 433-442.
6. Kirkham, Don and van Bavel, C. H. M. "Theory Of Seepage Into Auger Holes." Proc. Soil Science Society Of America 1948, pp. 75-82.
7. van Bavel, C. H. M. and Kirkham, Don. "Field Measurement Of Soil Permeability Using Auger Holes." Proc. Soil Science Society Of America, pp. 90-96.
8. Reeve, RonaldC. and Kirkham, Don. "Soil Anisotropy And Some Field Methods For Measuring Permeability." Trans. American Geophysical Union, Vol. 32, No. 4, Aug. 1951, pp. 582-590.
9. Spangler, M. G. "SoilEngineering."

30
APPENDIX A
Cost Data on Vertical Sand Drains
Kalanianaole H i g h l y , Federal Aid Project F 15 (3)
Number of sand drains Total "ength Average length of drain Diameter of sand drains Volume of sand required
249 8521 l in.
34 f t . 18 in.
646 cu.
f t .
yd.
Labor Cost
Foreman 296 hr.at $1.75 $518. 00 Riggers 684 ff It 1.40 957.60 Crane Operator 296 tf 11 1.80 532. 80 Pitman 296 11 Tt 1.00 296.00 Laborers 780 11 11 1.10 858. 00 Truck Drivers* 86 11 11 1.25 107. 50
"$3,269.90
Equipment Costs
Crane, leads, and hammer Compressors Air tanks Post hole digger 6 c. y. Trucks Cost of mandrel (estimated)
296 hr. at $12.00 592 592 110 86
3.50 .50
3.50 2.00
Total cost - labor and material
Cost per l in . f t . exclusive of sand, taxes, overhead, and profit
$3,552.00 2,072.00
296.00 385.00 172.00
1,000.00
$ 7,477.00
$10,746.90
1.26
NOTE: On this project, the contractor had free access to a sand pit, so that the cost of sand is not included in the above costs. Haul from sand pit to project approximately 4 miles.
* Hauling Sand from Sand Pit to Project.
HaleiwaRoad Cut-off, Federal Aid Project S223(2)
No. of sand drains Total length Average length of drain Diameter of sand drains Volume of sand required
(including spiUage) No. of working days required
to complete work
390 17,023 lin. f t .
43 lin. f t . 18 inches
1,400 c. y.
39 days

31
Equipment Cost (Average Cost Per Day)
1 - P & H Crane 8 hrs.at $9. 80 = t 78. 40 1 - Trencher 8 " " 6.15 = 49.20 1 - Hough Loader 8 " " 2.80 = 22.40 1 - 5000# Hammer 8 " " 2.50 = 20.00 1 - 500 cfm Compressor G " " 7.00 = 56.00
Total Cost Equipment $226.00
Labor Cost (Average Cost Per Day)
1 - Superintendent $25.00 2 - Operators 13 hr.at $2.00 = 32.00 3 - Operators 24 " " 1.85 = 44.40 1 - Mechanic 8" " 1.80 = 14.40 1 - Laborer 8" " 1.45 = 11.60 2 - Laborers 16 " " 1.25 = 20.00 1 - Laborer 8 " " 1.10 = 8.80
Total Cost Equipment f 156. 20 W. C. & P . L . Insurance - 2.906% 4.53 2.906%
$160.73
Material Cost
1.400 c. y. at $1.25 = $1,750.00
Following is Cost Per Lin. Ft.
Mandrel $1,000.00 /17,023 = $0.0587 per l in. f t .
Equipment Cost 39 days at $226.00 = $8,814.00 P , 814.00/17.023 = $0. 5178 per l in . f t .
Labor Cost 39 days at $160.73 = $6,268.47 $6,268.47/17.023 = $0.3682 per l in . f t .
Material Cost $1,750.00/17,023 = $0.1028 per l in. f t .
TOTAL $1.0475 per l in. f t .
SUMMARY: Cost per lin. f t . of driving sand drains - including vertical holes and sand, back
f i l l , but exclusive of taxes, overhead, and prof it $1.05.

32
APPENDIX B
Consolidation Due to Horizontal Flow
The differential equation of consolidation due to radial, horizontal flow is (see eq. (4), Page 291 of "Theoretical Soil Mechanic" by Terzaghi).
Where P = hydrodynamic pressure within the pores of the compressible material at any time t
t = time
r = radial distance from the center of a vertical sand drain to the point where the pressure P is measured
c = coefficient of consolidation for flow in the horizontal direction
Boundary Conditions: Let the radii of a sand drain and that of the equivalent circu-lar area drained by it be a and b respectively. Then if the applied load is H per unit area the boundary conditions are
(2) (3)
(4)
The boimdary condition (Equation 2) requires that the pressure drop abruptly to zero at the boundary between the sand drain and the compressible material. This condition can be met if the sand drains are free-draining. The boimdary condition (Equation 3) requires that there be no flow across the outer radius b of the area drained. This means that the flow at any point must be radially toward the nearest sand drain. Thus the requirement is a reasonable one.
Solution of Equation (1). The solution of Equation (1) subject to the given boundary conditions is
k = « 2
P = Pi Z_ e-' k ct ^ ^ 3 ^ (^^^j
Where J (u. a) B, (u^r) = J„ (u^r) - ( v ) (6)
e = base of Naperian logarithms (uj^r) = Bessel function of f i rs t kind of zero order
Np (Uj^r) = Bessel function of the second kind of zero order (Neumann function) Aj^ and u ^ are constant; to be determined in the maimer set forth below.
Determination of Uj ; In differentiating Equation (5) with respect to r as called for by the boundary (Equation 3), we note that Bo(u. r) is the only factor containing r . Hence the u's must be determined in such a way thai
3 B(ur)
for r = b ^ '
p = 0 for r = a 3P = 0 for r = b 3r
P = Pi for t = = 0

33
Making use of the relations,
3 J, (ur)
3 -uJi(ur) (8)
and aN,(ur) ^ 3 r
we find that Equation (7) is equivalent to
Ji(ub) - i p i ^ Ni(ub) = 0 (10)
Where Ji(ur) = a Bessel function of the f i rs t kind of the f i rs t order Ni(ur) = a Bessel function of the second kind of the f i rs t order
Equation (10) has an infmite number of roots uib, U2b, usb, U4b, etc. These may be found by a process of successive approximations and the values of ui, U2, us, vu, etc., determined.
Determination of A^ : The coefficients Aj^ are determined by the following equation:
\ B . ( V )
\ = '(11)
b* B,(uj^b) -a"* _Bi(uj^a)
Where Bi(u. a) = Ni(u. a) - (u. a) (12)
For t = 0, Equation (5) reduces to
P = Pi ^= " A ^ B , ( u ^ r ) (13) r=i
and the purpose of Equation (11) is to determine the coefficients A^ in such a way so that
AiB^ (uir) + Aa B, (uar) + AsB^ (ujr) + etc. = 1 (14) for all values of r. Then
P = Pi for t = 0 for al l values of r and the boimdary condition Equation (4) wil l hold true.
Percent Consolidation: We can compute the hydrodynamic pressure for any given point subsequent to t = 0 by means of Equation (5). The difference Pi - P is the loss of pressure and is a measure of the amoimt of consolidation. Thus the percentage consolidation at a point is,
Up% = ^ ^ J ^ X 100 (15) Where U p% = percent consolidation at a given point
To fmd the average percentage consolidation over the entire area influenced by a sand drain, we need to find the average loss of pressure over the area. Thus,
b
U% = 100 X n(b*-a')Pi -2 nS Prdr
0 03=*-a*) Pi

34
Where U% = average percent consolidation over the entire area influenced by a sand drain.
Evaluating the integral in Equation (16) after f i rs t substituting for P from Equation
U% = 100
(5), we find 2 a u^ct
1 -b* - a* J(17)
(The summation in the above is with respect to the successive values of k) By a suitable transformation, i t can be easily shown that the value of U% in
Equation (17) depends on a parameter b/a. By means of Equation (17), the percentage coitsolidation corresponding to various
values of time can be computed and a time-consolidation curve plotted. In general, tf we are interested mainly in long-time effects, say consolidation greater than 30%, one term of the series under the summation sign in Equation (17) wi l l give sufficiently accurate results. Many times the coefficient of consolidation c is unknown and it is desirable to plot a general curve from which a time-consolidation curve can be plotted later when the value of c is determined. We can do this by introducing a zero-dimensioned time factor,
" (18) The exponential factor in Equation (17) then becomes,
-u?.ct -4bV T e =e (19)
By plotting T against U%, we obtain a time-factor, consolidation curve such as Figure 3.
SUMMARY The steps in computing a time-consolidation curve are as follows: 1. From the spacing of the sand drains determine the radius of the equivalent
circular area drained by each. Call this radius b. Also decide on the radius a of the sand drains.
2. By means of tables such as Jahnke and Emde's "Tables of Functions," solve the Equation (10) for values of u. Call these roots (more properly eigen values) in order of magnitude ui, U2, us, U4, etc.
3. Having determined the u's, we find from Equation (11) the coefficients A i , A2, A 3 , A 4 , etc., corresponding to the u's.
4. Finally by means of Equation (17), we can compute the percentage consolidation corresponding to various assumed values of t (or T) and thus obtain a time-consolidation curve (or time factor, consolidation curve).
EXAMPLE Given sand drains 18 inches in diameter (a = 0.75 feet) spaced 17 feet center to
center in a geometrical pattern as shown in Figure 6. (b = 1.05 x 17 = 8.93 f t . ) . 2
The parameter b/a = 11.9. Compute the percent consolidation due to radial, horizontal flow for a time-factor T = .0542
Solution
1. Values of b and a are as given above. 2. Second step. Compute the values of the u's satisfying Equation (10). This is
equivalent to finding the values of u for which the graph of the function crosses the

35
horizontal zero axis. As a preliminary, assume various values of u, compute the values of the function and note their signs, whether plus or minus. In this way we find that the fimction changes signs as follows:
from - 0.1072 for u = 0.1 to + 0.3996 for u = 0.2 from + 0.2382 for u = 0.5 to - 0.3013 for u = 0.6 from - 0.8391 for u = 0.8 to + 0.8037 for u = 1,0 from + 0.0637 for u = 1.7 to - 0.0588 for u = 1.73
Therefore the first four roots ui , U2, Us, and U4, lie between the above values. The f irs t root ui lies between 0.1 and 0.2. The algebraic difference between the two values of the function is the change in value of the function as u varies from 0.1 to 0.2. Dividing the change in the function by the change in the value of u gives the derivative or slope of the secant line.
0.3996 - (-0.1072) _ . fSH o . a - 6 . 1 — ^ -
Thus the function changes 5.068 units for a unit change in u. But for u = 0 .1 , the function is-0.1072 and is increasing algebraically as u increases. In order for the function to increase from 0.1072 to zero, the value of u must therefore increase by
0-1072 _ n noil orms -0-0211 Hence u = 0.1 + 0.0211=0.1211 to a f i rs t approximation. Substituting this value of u in
Equation (10), we find that the function does not become zero but has a value of+0.0192. We next repeat the above approximation for the shorter interval u = 0.1 to u =0.1211.
This second approximation gives us a value of u = 0.1178. For this value of u the function on the left of Equation (10) has the value + 0.0015. By a third approximation, we find ui = 0.1175 and for this value of u, the value of the function in Equation (10) is zero for practical purposes. In this way the f i r s t four roots of Equation (10) are found to be
ui = 0.1175 U2 = 0. 5455 Us = 0.9390 U4= 1.7151
3. Third step. Having found the values ui , U2, us, etc., the next step is to find the values of the coefficients A^ by means of Equation (11). To compute A i , we need the values of the following:
Bi(uia) = Bi(0.088) Bo(uib)=Bjl.049)
Looking up the tabular values of the various functions involved we find.
2x. 75 (-0.6163) (-7. 2332) - 0.0440 OHTTB L
Ai
8.93" 0.7432 - (-0.6163) (0.1255^ -0.75' -0.6163) (-7.2332) -(0.0440)
= 1.3191 In this way the coefficients are found to be
Ai = 1.3191 As = 0.2168 As = 0.0612 A4 = -0.0849
4. Fourth step. In computing the percent consolidation by means of Equation (17), we split the part under the summation sign into two parts as follows:

36
\ - ^ ^ B i ( v ) 2A 2 A k T / ^ ( V )
Ui 28.1731 2.6382 74.3263 Ua 3.6272 0.4336 1. 5728 Us 3.8625 0.1224 0.4728 U 4 -0. 7765 -0.1698 •fO. 1318 and
Ui =0.1175 Us =0.5455 0.006 Us =0.9390 0. OOOO(-)
The third term is less than the fourth place of decimals, account only the f i rs t two terms at the most.
Hence we need to take into
Thus U for T = 0.0542 we find is
U% = 100 X 1 1 - 74.33 x0.799 + 1.573 x 8.93* - .75^
006 25.01%
Repeating the calculations of Step 4 for various values of T, enough points can be found to enable one to plot a curve such as those of Figure 5 for the particular value of b/a involved.
The above example is not an hypothetical one. computed for actual projects.
It and the curves of Figure 5 were
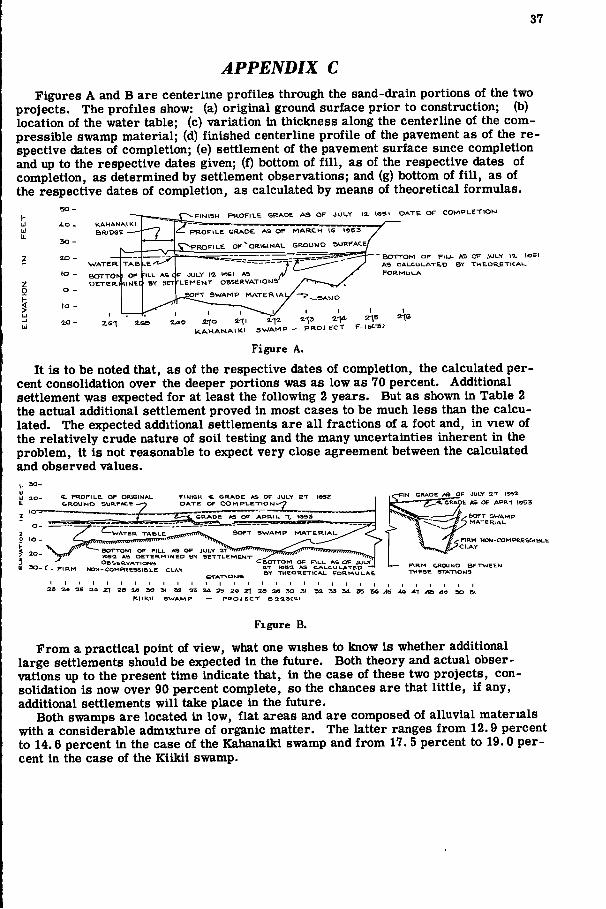
37
APPENDIX C Figures A and B are centerline profiles through the sand-drain portions of the two
projects. The profiles show: (a) original ground surface prior to construction; (b) location of the water table; (c) variation in thickness along the centerline of the compressible swamp material; (d) finished centerline profile of the pavement as of the respective dates of completion; (e) settlement of the pavement surface since completion and up to the respective dates given; (f) bottom of f i l l , as of the respective dates of completion, as determined by settlement observations; and (g) bottom of f i l l , as of the respective dates of completion, as calculated by means of theoretical formulas.
B R I D G E
- F I M 1 3 H P R O F I L E G R A . D E A S O F J U L Y 12 . 1 9 5 1 O A . T E O F C O M P L E T I O W
l ^ i f p R O F l L E G R A . D E . A S ~ 0 F ~ ~ M A R C H " i t 1 9 5 3 ~
l o -
M -
V ^ P R O F I L E O F O R 1 C . 1 N A L G R O U W D S U R F A C E
F J U L Y 11 W61 A S B O T T O N * O F , ,
• E T E R l f l l N E l } BY SETf-LEMEMT OBSHRVATlOwa
•KIFT 3 W A M F
B O T T O M O F F I L L A S O F J U L Y l^L l o S l A S C A L C U L A T E D B Y T H E O R . E T I C A U F O R M U L A
i a o aio 2-11 i i a a-l^ H A H A r J A l K l S W A M P - P R O J E C T F - 1 B C - ! S >
Figure A.
It is to be noted that, as of the respective dates of completion, the calculated percent consolidation over the deeper portions was as low as 70 percent. Additional settlement was expected for at least the following 2 years. But as shown in Table 2 the actual additional settlement proved in most cases to be much less than the calculated. The expected additional settlements are all fractions of a foot and, in view of the relatively crude nature of soil testing and the many uncertainties inherent in the problem, it is not reasonable to expect very close agreement between the calculated and observed values.
* . P R O F I L E O F O R l G m A L & R O U W O S U R F A C E
S O F T S W A M P M A T E R I A L W A T E R T A B L E .
F I N G R A D E A S O F JULY 2 T 1 » 5 I G R A D E AS O F A P R I 1 9 5 3
S O F T S W A M P M A T E R I A L
- B O T T O M O F F I L L A S O F J U L Y a t ' » S a A S D E T E R M I N E D B Y S E T T L E M E N T O B S E R V A T I O N S
N O N - C O M P R E S S I B L E C L A Y STATiOMS
R R M N O N - C O M P R E S S I B L E C L A Y
B O T T O M O F F I L L A S O F J U L Y n W B a A S C A U C U l - A T E D B Y T H E O R E T I C A L F O R M U I - A E
a s a * a s a a a i a a u i 5 0 s i ^ a s 2 4 a s 2G 21 a s a « 3 o 31 K I I K I I S W A M P — P R O J E C T S a a S C t L )
5 2 S 3 3d. 55 S G 4 S .AG 41 4 & 4 9 50 51
Figure B.
From a practical point of view, what one wishes to know is whether additional large settlements should be expected in the future. Both theory and actual observations up to the present time indicate that, in the case of these two projects, consolidation is now over 90 percent complete, so the chances are that li t t le, if any, additional settlements wil l take place in the future.
Both swamps are located in low, flat areas and are composed of alluvial materials with a considerable admixture of organic matter. The latter ranges from 12.9 percent to 14.6 percent in the case of the Kahanaiki swamp and from 17. 5 percent to 19.0 percent in the case of the Kiiki i swamp.

Publications of the Highway Research Board Sponsored by the Department of Soils
Bulletin 1: Silicate of Soda as a Soil Stabilizing Agent (1946) 21 pp. Bulletin 5: Report of Committee on Compaction of Subgrades and
Embankments (1947) 23 pp. Bulletin 8: Design of Flexible Pavements Using the Triaxial Compression
Test - Kansas Method (1947) 63 pp. Bulletin 13: The Appraisal of Terrain Conditions for Highway Engineering
Purposes (1948) 99 pp. Bulletin 14; Bulletin 22 Bulletin 23: Bulletin 28: Bulletin 42 BuUetin 44: Bulletin 45 Bulletin 46: Bulletin 49: Bulletin 58: Bulletin 65
Soil Committee Reports and Special Papers (1948) 42 pp. Engineering Use of Agricultural Soil Maps (1949) 128 pp. Compaction of Soil, Two Papers (1949) 20 pp. Soil E}q)loration and Mapping (1950) 124 pp. Soil Compaction (1951) 23 pp. Volcanic Ash and Laterite Soils in Highway Construction (1951) 32 pp. Subsurface Drainage (1951) 23 pp. Engineering Soil Survey Mj^ping (1951) 100 pp. Analysis of Landslides (1952) 42 pp. Compaction of Embankments, Subgrades and Bases (1952) 92 pp. Mapping and Subsurface Exploration for Engineering Purposes
(1952) 60 pp. Bulletin 69: Soil Stabilization (1953) 60 pp. Bulletin 71: Soil Temperature and Ground Freezing (1953) 127 pp. Bulletin 83: Engineering Applications of Soil Surveying and Mapping (1954) 78pp. Bulletin 90: Vertical Sand Drains (1954) 37 pp.
Current Road Problems 5: Current Road Problems 7:
(1943) 30 pp. Current Road Problems 11:
(1945) 25 pp. Current Road Problems 12:
Granular Stabilized Roads (1943) 27 pp.
Use of Soil Cement Mixtures for Base Courses
Compaction of Subgrades and Embankments
Soil Bituminous Roads (1946) 52 pp. Research R^or t 8-F: Prevention of Moisture Loss in Soil Cement with
Bituminous Materials (1949) 38 pp. Research Report 12-F: Stress Distribution in a Homogeneous Soil (1951) 38 pp.
Bibliography 3: Frost Action in Soils (Annotated) (1948) 59 pp. mimeographed Bibliography 10: Landslides (1951) 59 pp.
Bibliography 15: Survey and Treatment of Marsh Deposits(1954) 106 pp.
Special Report 1: Frost Action in Roads and Airfields: A Review of the Literature, 1765-1951, byA.W. Johnson (1952) 300 pp., illustrated, heavy paper binding (postage outside U. S. A. $0. 30)
Special Report 2: Frost Action in Soils: A Symposium (containing 38 technical papers) (1952) 394 pp. (postage outside U. S. A. $0. 30)
$ .15
.30
.75
1.50 .60
1.80 . 15
1.50 .45 .60 .45
1.50 .60
1.50
.90
.90 1.80 1.05 .60
.30
.30
.30
.30
.60
.60
.45
.90 1.20
3.00
3. 75
HRB: 11-2*1

TH E NATIONAL A C A D E M Y OF S C I E N C E S — N A T I O N A L R E S E A R C H C O U N C I L is a private, nonprofit organization of scientists, dedicated to the furtherance of science and to its use for the general welfare. The
A C A D E M Y itself was established in 1863 under a congressional charter signed by President Lincoln. Empowered to provide for all activities appropriate to academies of science, it was also required by its charter to act as an adviser to the federal government in scientific matters. This provision accounts for the close ties that have always existed between the A C A D E M Y and the government, although the A C A D E M Y is not a governmental agency.
The NATIONAL R E S E A R C H COUNCIL was established by the A C A D E M Y in 1916, at the request of President Wilson, to enable scientists generally zo associate their efforts with those of the limited membership of the A C A D E M Y in service to the nation, to society, and to science at home and abroad. Members of the NATIONAL R E S E A R C H COUNCIL receive their appointments from the president of the ACADEMY. They include representatives nominated by the major scientific and technical societies, representatives of the federal government designated by the President of the United States, and a number of members at large. In addition, several thousand scientists and engineers take part in the activities of the research council through membership on its various boards and committees.
Receiving funds from both public and private sources, by contribution, grant, or contract, the A C A D E M Y and its R E S E A R C H COUNCIL thus work to stimulate research and its applications, to survey the broad possibilities of science, to promote effective utilization of the scientific and technical resources of the country, to serve the government, and to further the general interests of science.
The H I G H W A Y R E S E A R C H BOARD was organized November 11, 1920, as an agency of the Division of Engineering and Industrial Research, one of the eight functional divisions of the NATIONAL R E S E A R C H COUNCIL. The BOARD is a cooperative organization of the highway technologists of America operating under the auspices of the A C A D E M Y - C O U N C I L and with the support of the several highway departments, the Bureau of Public Roads, and many other organizations interested in the development of highway transportation. The purposes of the BOARD are to encourage research and to provide a national clearinghouse and correlation service for research activities and information on highway administration and technology.


HIGHW,AY
' , B O M 0