Vertical integration: GHG data alignment principles and ...
23
This project is part of the International Climate Initiative (IKI) The German Federal Ministry for the Environment, Nature Conservation and Nuclear Safety (BMU) supports this initiative on the basis of a decision adopted by the German Bundestag. Vertical integration: GHG data alignment principles and practices for states and regions This document was prepared by Sina Wartmann, Rose Bailey and Sabina Shaikh at Ricardo Energy & Environment as part of the Climate Footprint Project | June 2021 About this paper Climate action can be more effective and ambitious where there is coordination and transparency between different levels of government. This technical knowledge product is designed to support states and regions in understanding some of the practical and technical considerations for ‘vertical integration’ between national, subnational and local governments, with a particular focus on data for greenhouse gas (GHG) inventories and mitigation measures and targets. It has come about primarily as a result of working with states and regions under the Climate Footprint Project to develop their GHG inventories and About the Climate Footprint Project The Climate Footprint Project supports state and regional governments to improve their greenhouse gas emissions tracking and reduction efforts. In the first phase of the project, the project worked with states and regions in developing and newly industrialising countries including Pernambuco (Brazil), Chhattisgarh and West Bengal (India), Baja California, Jalisco and Yucatán (Mexico), and KwaZulu-Natal (South Africa).
Transcript of Vertical integration: GHG data alignment principles and ...

This project is part of the International Climate Initiative (IKI)
The German Federal Ministry for the Environment, Nature Conservation and Nuclear Safety (BMU) supports this initiative on the basis of a decision adopted by the German Bundestag.
Vertical integration: GHG data alignment principles and practices for states and regions
This document was prepared by Sina Wartmann, Rose Bailey and Sabina Shaikh at Ricardo Energy & Environment as part of the Climate Footprint Project | June 2021
About this paper
Climate action can be more effective and ambitious where there is coordination and transparency between different levels of government. This technical knowledge product is designed to support states and regions in understanding some of the practical and technical considerations for ‘vertical integration’ between national, subnational and local governments, with a particular focus on data for greenhouse gas (GHG) inventories and mitigation measures and targets. It has come about primarily as a result of working with states and regions under the Climate Footprint Project to develop their GHG inventories and
About the Climate Footprint Project The Climate Footprint Project supports state and regional governments to improve their greenhouse gas emissions tracking and reduction efforts. In the first phase of the project, the project worked with states and regions in developing and newly industrialising countries including Pernambuco (Brazil), Chhattisgarh and West Bengal (India), Baja California, Jalisco and Yucatán (Mexico), and KwaZulu-Natal (South Africa).

monitoring, reporting and verification (MRV) systems, and the many questions that arose during this process. These included questions about how best to align with or integrate similar work being undertaken by major cities within the states and regions, who were developing GHG inventories and action plans for international city-level commitments such as the Global Covenant of Mayors, but using different methods and reporting formats. Or questions arising from national government stakeholders as to how detailed state level data on waste collection, for instance, could help improve national assumptions and calculations. There was found to be a gap in practical, technical guidance on how to approach these specific challenges, in order to maximise the benefits to all levels of government, whilst ensuring that the outputs still meet each one’s specific needs and objectives.
This technical knowledge product therefore aims to unpack what is meant by ‘vertical integration’, the areas this is relevant to and the different forms this can take, from improving communication to alignment of processes to fully integrated systems. It outlines the benefits and opportunities of vertical integration for GHG data specifically, before setting out three principles which can help guide the selection of solutions to common challenges. These common challenges are then explained, informed by practical experiences. For each of the common challenges, solutions that can be considered are then set out for communication, alignment and integration, before concluding on the process of achieving synergies and steps to take.
Acronyms
AFOLU Agriculture, Forestry and Other Land Use AR Assessment Report (IPCC) Gg Gigagram GHG Greenhouse Gas GPC Global Protocol for Community-scale Greenhouse Gas Emission Inventories GWP Global warming potential IPCC Intergovernmental Panel on Climate Change
IPPU Industrial Processes and other Product Use kt Kilotonne MRV Monitoring, reporting and verification MS Microsoft (e.g. Excel) Mt Megatonne NDC Nationally Determined Contribution QA/QC Quality Assurance & Quality Control t Tonne TCCCA Transparency, Accuracy, Completeness, Consistency, Comparability VI Vertical Integration

Contents
1 Introduction ............................................................................................................................................... 4
2 Vertical Integration: what does this mean in practice? ............................................................................ 5
3 Vertical Integration of GHG data ............................................................................................................... 6
4 Principles for Vertical Integration .............................................................................................................. 7
5 Vertical Integration and common challenges ............................................................................................ 9
5.1 Vertical Integration and input data ........................................................................................................ 9
5.2 Vertical Integration and methods ......................................................................................................... 13
5.3 Vertical Integration and reporting ........................................................................................................ 19
6. Conclusions ............................................................................................................................................. 22

1 Introduction
Although climate change is a global problem, working to measure and report greenhouse gas (GHG) emissions and implement actions to mitigate these emissions requires local solutions. States and regions know only too well that they form part of a system: from the very local (villages, neighbourhoods), to municipalities, towns and cities, to the state and regional level, and from there up to national, and in some cases, supranational levels (e.g. the European Union). Climate action can be more effective and ambitious where there is coordination and transparency between these different parties1 and there is increasing recognition of the importance of sub-national governments and integration between levels of government for delivering ambitious climate action2.
States and regions are at a level of governance that ‘make sense’ for tackling climate change. Closer to the action on the ground than national governments, state and regional teams often have a greater sense of what’s really needed, where opportunities lie, what the challenges might be and who the main actors are. However, they are also big enough to be a significant player in driving climate action – in terms of geographic and economic scale, human and financial resources, power and authority over key sectors, and closeness to national decision-makers. Whereas there might be hundreds of municipalities in a country, there might be single-digit numbers of states and regions. Whilst municipalities might have arbitrary boundaries which determine what is in and out of scope, states and regions represent a more comprehensive area of management and measurement, capturing all the flows of people and resources within a wider region. This includes ‘transboundary travel’, an ever-tricky area for local governments, and local agriculture and food systems for example, ensuring nothing falls through the reporting cracks. They also often have both the power, authority and resources to tackle climate actions at a larger, whilst still ‘local’ scale, whether that be housing retrofit programmes or land use and agricultural improvements.
Activity at all levels of government is crucial, but states and regions have a particularly important role in shaping and managing climate change responses, as an interface between local and national levels. As such, states and regions might desire to understand how they can ‘vertically integrate’ or align with the other levels of government, to ensure for example, the most effective cooperation, maximise mitigation opportunities, harmonise data and reporting processes and avoid double-counting.
1 GIZ (2020), Collaborative Climate Action – a Prerequisite for more Ambitious Climate Policy. https://collaborative-climate-action.org/wp-content/uploads/2021/02/CCA-a-prerequisite-for-more-ambitious-climate-action.pdf 2 Hale, T. (2018), The Role of Sub-state and Nonstate Actors in International Climate Processes. Chatham House Research Paper. https://www.chathamhouse.org/sites/default/files/publications/research/2018-11-28-non-state-sctors-climate-synthesis-hale-final.pdf
Figure 1: Levels of governance: states and regions play a key role in localising climate action and communicating with national governments.
2 Vertical Integration: what does this mean in practice?
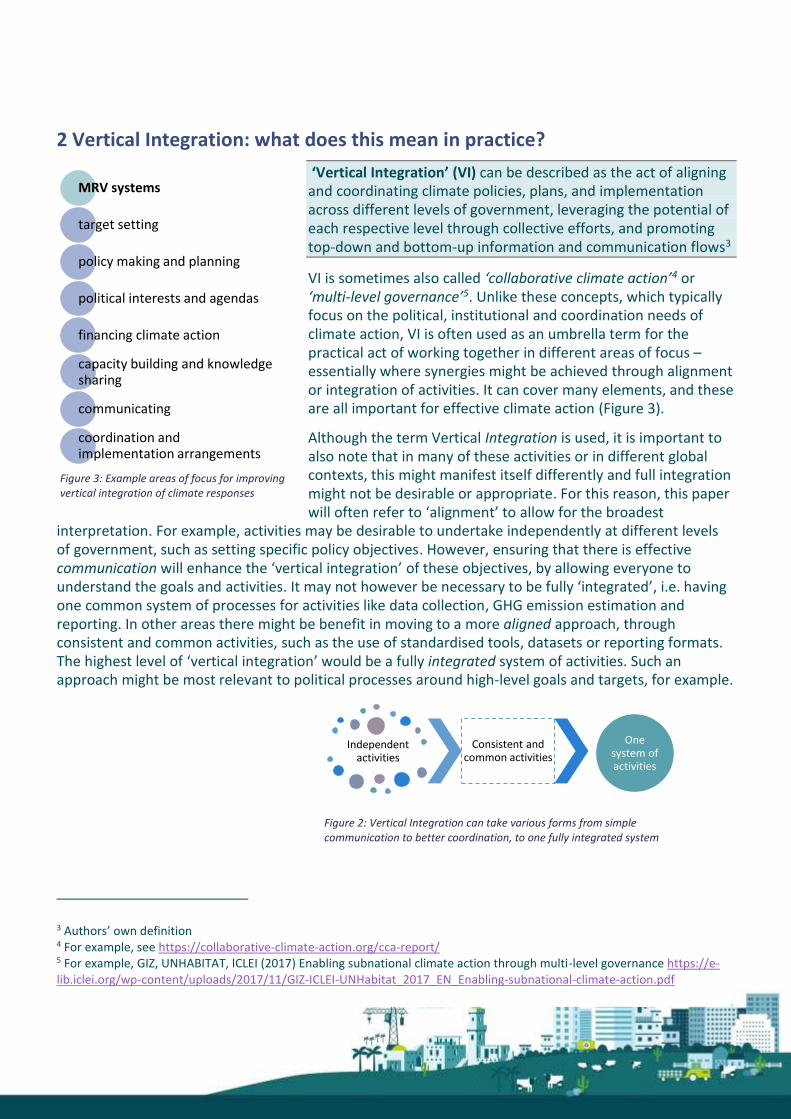
‘Vertical Integration’ (VI) can be described as the act of aligning and coordinating climate policies, plans, and implementation across different levels of government, leveraging the potential of each respective level through collective efforts, and promoting top-down and bottom-up information and communication flows3
VI is sometimes also called ‘collaborative climate action’4 or ‘multi-level governance’5. Unlike these concepts, which typically focus on the political, institutional and coordination needs of climate action, VI is often used as an umbrella term for the practical act of working together in different areas of focus – essentially where synergies might be achieved through alignment or integration of activities. It can cover many elements, and these are all important for effective climate action (Figure 3).
Although the term Vertical Integration is used, it is important to also note that in many of these activities or in different global contexts, this might manifest itself differently and full integration might not be desirable or appropriate. For this reason, this paper will often refer to ‘alignment’ to allow for the broadest
interpretation. For example, activities may be desirable to undertake independently at different levels of government, such as setting specific policy objectives. However, ensuring that there is effective communication will enhance the ‘vertical integration’ of these objectives, by allowing everyone to understand the goals and activities. It may not however be necessary to be fully ‘integrated’, i.e. having one common system of processes for activities like data collection, GHG emission estimation and reporting. In other areas there might be benefit in moving to a more aligned approach, through consistent and common activities, such as the use of standardised tools, datasets or reporting formats. The highest level of ‘vertical integration’ would be a fully integrated system of activities. Such an approach might be most relevant to political processes around high-level goals and targets, for example.
3 Authors’ own definition 4 For example, see https://collaborative-climate-action.org/cca-report/ 5 For example, GIZ, UNHABITAT, ICLEI (2017) Enabling subnational climate action through multi-level governance https://e-lib.iclei.org/wp-content/uploads/2017/11/GIZ-ICLEI-UNHabitat_2017_EN_Enabling-subnational-climate-action.pdf
Figure 3: Example areas of focus for improving vertical integration of climate responses
Independent activities
Communication
Consistent and common activities
Alignment
One system of activities
Integration
MRV systems
target setting
policy making and planning
political interests and agendas
financing climate action
capacity building and knowledge sharing
communicating
coordination and implementation arrangements
Figure 2: Vertical Integration can take various forms from simple communication to better coordination, to one fully integrated system

3 Vertical Integration of GHG data
This paper focusses on the VI of climate-related reporting, particularly data for GHG inventories and mitigation measures and targets. Whilst, at first glance, integration of institutional structures and governance might seem the place to start, in reality this can be complex, messy, and context specific. By starting with data, improving the alignment and integration of this, other areas can follow on more easily, where appropriate. For example:
• Data systems are often interlinked with other governance process, e.g. information sharing or inter-departmental collaborations
• Data (and the outputs derived from data) can help to unlock doors and drive change, through highlighting opportunities and challenges
• Data is often the foundation for accessing finance (how can something be funded if it is not measured?)
• Data should inform and drive policy and action
States and regions both communicate upwards to national government, and downwards to local governments. Ensuring that there is consistency and comparability in data across these different levels aids transparency and understanding of emissions and the impacts of actions, and avoids potential double-counting (and helps us to be sure that a tonne at one level is a tonne at another). States and regions might aggregate local data, which is in turn aggregated to the national level, and then disaggregated back downwards. Having systems aligned, or integrated, can make everyone’s life easier.
Improving the ‘vertical integration’ between levels of government therefore makes practical sense for tackling climate change. When everyone coordinates, things can happen more efficiently, effectively and transparently.
As data is the fundamental building block for managing and tracking action, it makes a particularly relevant starting point.
Figure 4 Illustrative example of the chains of communication between National Government, State/Regions and Local Governments.
4 Principles for Vertical Integration
Before looking into detail at what the main issues with VI might be and what solutions exist, it is useful to define principles which can guide the selection of such solutions.
We propose three main principles to underpin vertical integration efforts for GHG data:
• Principle #1 Allow for differences as required by policy needs at each level
• Principle #2 Ensure adherence to the IPCC ‘TCCCA’ principles
• Principle #3 Identify options for communication/alignment/integration and improve over time
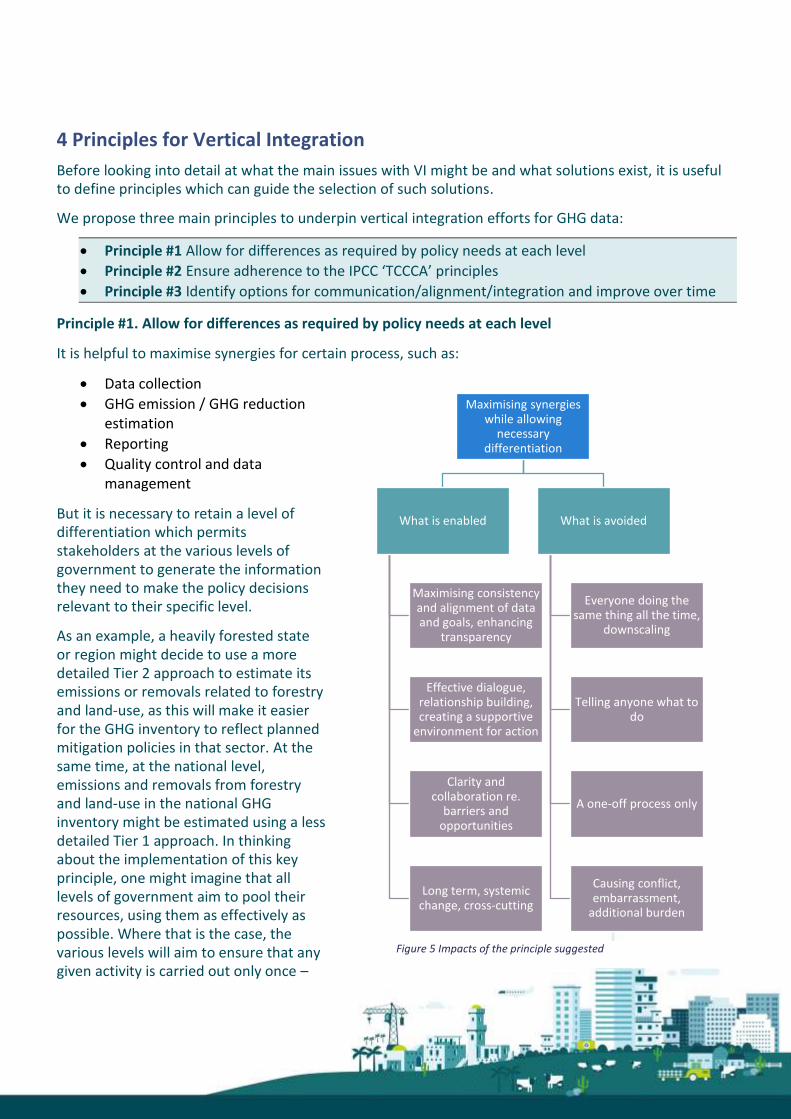
Principle #1. Allow for differences as required by policy needs at each level
It is helpful to maximise synergies for certain process, such as:
• Data collection
• GHG emission / GHG reduction estimation
• Reporting
• Quality control and data management
But it is necessary to retain a level of differentiation which permits stakeholders at the various levels of government to generate the information they need to make the policy decisions relevant to their specific level.
As an example, a heavily forested state or region might decide to use a more detailed Tier 2 approach to estimate its emissions or removals related to forestry and land-use, as this will make it easier for the GHG inventory to reflect planned mitigation policies in that sector. At the same time, at the national level, emissions and removals from forestry and land-use in the national GHG inventory might be estimated using a less detailed Tier 1 approach. In thinking about the implementation of this key principle, one might imagine that all levels of government aim to pool their resources, using them as effectively as possible. Where that is the case, the various levels will aim to ensure that any given activity is carried out only once –
Maximising synergies while allowing
necessary differentiation
What is enabled
Maximising consistency and alignment of data and goals, enhancing
transparency
Effective dialogue, relationship building, creating a supportive
environment for action
Clarity and collaboration re.
barriers and opportunities
Long term, systemic change, cross-cutting
What is avoided
Everyone doing the same thing all the time,
downscaling
Telling anyone what to do
A one-off process only
Causing conflict, embarrassment,
additional burden
Figure 5 Impacts of the principle suggested

e.g. where several levels can make use of the same data, it should be collected only once and shared among the levels as necessary. At the same time, levels which need to use a different scope or different estimation methodologies to suit their policy decision-making can do so. They might need to collect additional data for this purpose or recalculate data. A key point in the implementation of this principle is related to communication – the stakeholders involved need to understand where alignment/integration takes place and where differentiated approaches are used.
Principle #2: Ensure adherence to the IPCC ‘TCCCA’ principles
A group of principles, referred to as ‘TCCCA’ come from the compilation of national GHG inventories: Transparency, accuracy, completeness, consistency, comparability. These are defined in the Intergovernmental Panel on Climate Change (IPCC) 2006 Guidelines for National GHG inventories6 and summarised in a simplified manner below.
• Transparency: Methodologies, data sources, calculation factors, assumptions, etc. are clearly documented.
• Accuracy: Emissions are neither systematically underestimated nor overestimated compared to the real value
• Completeness: All relevant gases and emission sources and sinks are covered
• Consistency: Throughout the time series, the same data sources and calculation methodologies are used to the extent feasible. This way the trends of emission estimates will reflect actual changes in emissions and not changes in data source or methodology.
• Comparability: Through using the same standard for the emission estimation, e.g. the IPCC 2006 Guidelines for national GHG inventories. In the context of vertical integration, comparability might need to be slightly adjusted considering principle 1 mentioned above, with appropriate levels of differentiation being retained at the various levels of administration. For example, cities might be able to take better decisions related to mitigation planning on the basis of GHG inventories estimated using the Global Protocol for Community-scale Greenhouse Gas Emission Inventories (GPC), while for the national level, the IPCC 2006 Guidelines are used.
Principle #3: Identify options for communication/alignment/integration and improve over time
A principle not specifically defined as such in the IPCC 2006 Guidelines, but with much relevance for GHG inventories in general, is continuous improvement over time. This principle appreciates that resources are limited and especially when starting out to compile a GHG inventory or estimate and track mitigation data, data and expertise might be limited. Thus, starting out with simplified methodology, levels of data disaggregation or data coverage may be necessary. Over time, data, methodologies and processes can be improved in line with existing resources, identifying options for improvement, prioritising the most relevant improvements and implementing the ones with the highest priority in line with existing resources. This principle is equally relevant for VI – starting by identifying options for improving communication/ alignment/ integration, prioritising them and implementing them over time.
6 See https://www.ipcc-nggip.iges.or.jp/public/2006gl/pdf/1_Volume1/V1_1_Ch1_Introduction.pdf

5 Vertical Integration and common challenges
This section aims to set out the common data challenges that occur for states and regions, and other sub-national governments, when compiling GHG inventories. It summarises:
• What the challenges are and how and why they might occur
• Possible solutions to enhance vertical integration
• Examples of good practices and solutions
The most common vertical integration challenges are grouped and summarised under three themes (note that although QA/QC processes and data management, as noted above, are an essential part of GHG inventory compilation, this paper focusses on emission estimation only):
5.1 Vertical Integration and input data
Input data is one of the key ingredients in estimating GHG emissions, setting mitigation targets, and identifying, implementing and tracking mitigation measures. In an ideal world each dataset would be collected only once for the years relevant and at the various scopes and levels of disaggregation required by the various levels of administration, then quality checked using consistent methods and shared with all levels who might need this data for any relevant estimations. This is, however, not the situation encountered in real life, where there are many challenges related to data in and among the various levels of administration.
Challenges
Challenges related to data can be structured into a number of subcategories, related to the availability, the quality and the transparency of the data.
• Lack of data
o No local data (data relevant to a specific level of administration) is available, as the data is
simply not collected by anyone
o Data is collected but not made available – reasons can include confidentiality issues for
point sources, data not being published, or administrations not wanting to share the data
• Poor quality or inconsistent data o Data is patchy or incomplete, for instance, it does not cover all years in a time series or all
relevant activities (e.g. fuel consumption is known only for 3 out of 4 power plants)
Challenges related to input data
Challenges related to methods
Challenges related to reporting

o Where data is shared, it is not shared in the units relevant to a level of administration and
first requires recalculation
o Data is available for several years, but is inconsistent, e.g. it has been collected from
different data sources, using different assumptions, etc.
o Different levels of administration hold datasets for a specific activity, but the values are
not comparable and it is not clear which dataset offers a better quality
o Data available to different administrative levels covers different years
o Data is scaled/adjusted to the administrative level in question based on data for another
administrative level (often using drivers like population) and is thus less reliable
o Data has a high uncertainty, so it is just generally less reliable
• Lack of data transparency o Available data is not well documented, so relevant meta-data like scope, methodologies,
assumptions, and source might not be available, making any estimations from this data
less reliable
Role of Vertical Integration
VI with regards to data could start out by the various levels of administration communicating actively about the data available, used and required, it’s scope, the years covered, data sources, etc. Such exchange will allow understanding where the same data is potentially collected multiple times and where data available to one level of administration might be shared with others who wish to use the same data. Similarly, data quality and management approaches can be shared.
Challenge Potential solutions
Lack of data - Communication: o Identify which data is required by whom and who holds which data for which
years, scope, level of disaggregation, etc. o Find out why certain data is not shared by specific stakeholders. Clarify the
importance and specific aim of the data sharing with them. ▪ Limitations to the use of data (e.g. plant-specific data can only be
published in an aggregate manner; data is not used for other purposes than climate reporting) can be laid down in data sharing agreements/memoranda of understanding.
- Alignment: o Agree who is best suited to collect which data (scope, years, level of
disaggregation, units, etc.) and when and how it will be shared with which others.
o Templates can be helpful to document which variables such as scope, years, activity or units, that data collected for a specific activity should have and with whom it should be shared. ▪ Such templates would also allow other levels of administration obtaining
this data to be sure about the format of data that they will receive and set up their estimation process (e.g. in MS Excel) accordingly.

- Integration: o Set up database systems where the various levels of administration can check
which data they are expected to collect, while providing common formats for data collection. ▪ Such a system could aggregate data upwards, e.g. aggregating data from
municipalities to regional and country-level. ▪ Where issues with data confidentiality exist, such a database system
could facilitate the data sharing in that only the levels of administration who need specific data will gain access to it.
o It has to be noted that this would be a very comprehensive and potentially complex system, requiring considerable time and resources for set-up. ▪ Simpler solutions might be found by focussing on certain activities in
certain sectors or considering data collection infrastructure which is already in place, e.g. through statistical offices.
Poor quality or inconsistent data
- Communication: o Determine which datasets related to the same activity are held by several
levels of administration and identify gaps (e.g. scope, years, level of detail) and quality issues.
- Alignment. o Where data is incomplete and/or inconsistent, compare the available datasets
for the activity in question and determine whether the datasets might be combined to fill gaps (e.g. where certain years are missing).
o Where several datasets exist for the same activity, assess the datasets with regards to completeness and accuracy to understand whether one dataset is preferrable over the other. ▪ Moving forward, continue collecting data for the activity in question using
the approaches of the selected/preferrable dataset. o In certain cases, it might be necessary to discard datasets and collect new
data. - Integration: o A database system, as mentioned under “Lack of data” would ensure that data
is collected for all relevant scopes and relevant years and that each level of administration understand which dataset to use for their specific purposes.
Lack of data transparency
- Communication: o The various levels of administration share information about the
characteristics of datasets upon request. However, this might not be possible in all cases, e.g. due to staff turnover or if data characteristics have not been documented.
- Alignment: o A common template for the documentation of the relevant characteristics of
data is used by all levels of administration. o Where possible, the documentation is always shared together with the data.
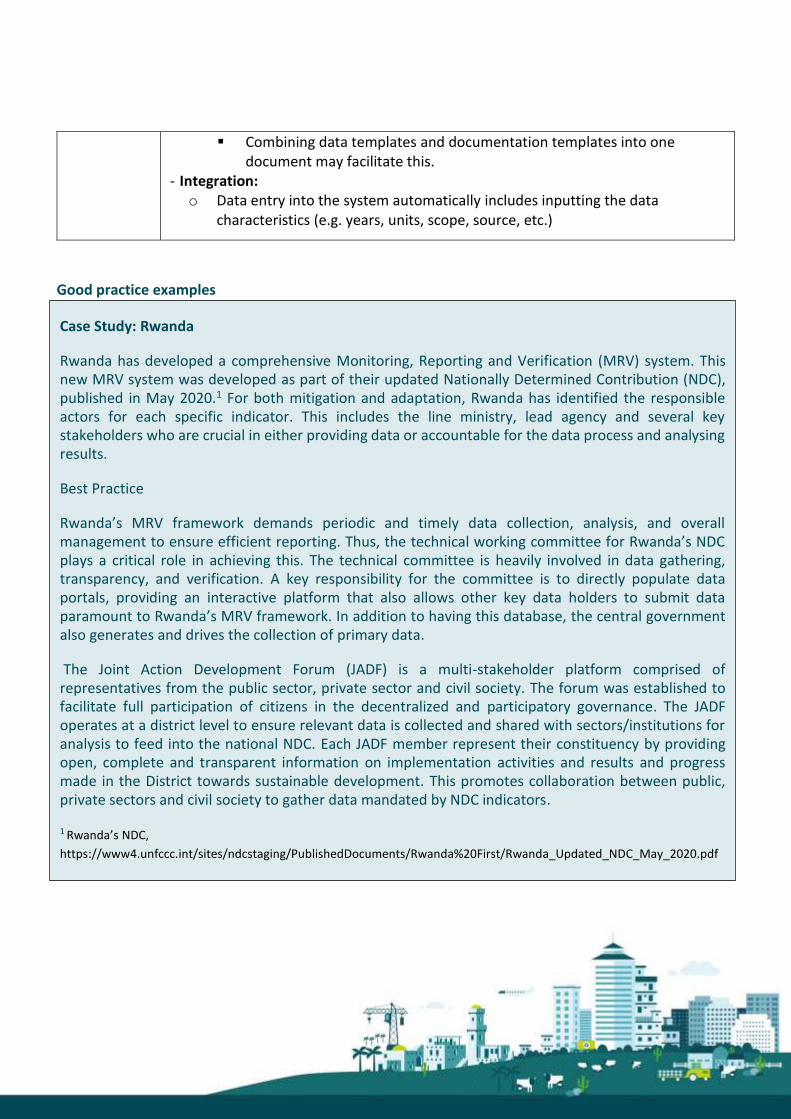
▪ Combining data templates and documentation templates into one document may facilitate this.
- Integration: o Data entry into the system automatically includes inputting the data
characteristics (e.g. years, units, scope, source, etc.)
Good practice examples
Case Study: Rwanda
Rwanda has developed a comprehensive Monitoring, Reporting and Verification (MRV) system. This new MRV system was developed as part of their updated Nationally Determined Contribution (NDC), published in May 2020.1 For both mitigation and adaptation, Rwanda has identified the responsible actors for each specific indicator. This includes the line ministry, lead agency and several key stakeholders who are crucial in either providing data or accountable for the data process and analysing results.
Best Practice
Rwanda’s MRV framework demands periodic and timely data collection, analysis, and overall management to ensure efficient reporting. Thus, the technical working committee for Rwanda’s NDC plays a critical role in achieving this. The technical committee is heavily involved in data gathering, transparency, and verification. A key responsibility for the committee is to directly populate data portals, providing an interactive platform that also allows other key data holders to submit data paramount to Rwanda’s MRV framework. In addition to having this database, the central government also generates and drives the collection of primary data.
The Joint Action Development Forum (JADF) is a multi-stakeholder platform comprised of representatives from the public sector, private sector and civil society. The forum was established to facilitate full participation of citizens in the decentralized and participatory governance. The JADF operates at a district level to ensure relevant data is collected and shared with sectors/institutions for analysis to feed into the national NDC. Each JADF member represent their constituency by providing open, complete and transparent information on implementation activities and results and progress made in the District towards sustainable development. This promotes collaboration between public, private sectors and civil society to gather data mandated by NDC indicators.
1 Rwanda’s NDC,
https://www4.unfccc.int/sites/ndcstaging/PublishedDocuments/Rwanda%20First/Rwanda_Updated_NDC_May_2020.pdf

5.2 Vertical Integration and methods
Data and methods are closely related. The availability and quality of data often determines which methods can be used for emission estimates. In a perfectly integrated system of data collection and emissions estimation, methods should be consistent by default. This is the case in the UK, where the national GHG inventory is disaggregated to the four countries (England, Wales, Scotland, Northern Ireland) and to all local governments using a combination of harmonised top-down and bottom-up methods. This centralised type of system of emissions estimation and reporting is rare however, and for states and regions that estimate emissions themselves, there remain a number of challenges related to estimation methods for inventories. In addition, as per Principle #1, there may be policy-related reasons for using different methods, and it is important that these are still met.
Challenges
Challenges related to methods can be widely varied, but for the purposes of this paper we identify five key areas. These can be summarised as:
1. Choice of methodological tiers
A tier represents a level of methodological complexity and the IPCC guidelines usually provide three. Tier 1 is the basic method, Tier 2 intermediate and Tier 3 the most demanding in terms of complexity and data requirements. Tiers 2 and 3 are sometimes referred to as higher tier methods, generally considered to be more accurate. Subnational governments may find their choice of methodological tier differs from national government. This could entail using a different tier than the national level does.
Case Study: Ghana
In 2013, Ghana launched the Ghana Climate Ambitious Reporting Program (G-CARP), an integrated system for continuous data generation on greenhouse gas (GHG) inventories, mitigation actions and support. Data collection on the impact of mitigation actions are carried out via regular surveys and also systematically through the sectoral Annual Progress Report (APR) system, where sectors are able to develop indicators and report through the sectoral APR.1
Best Practice
The Environmental Protection Agency (EPA) cooperates with inventory stakeholders to manage a host of data protocols, such as activity data and emissions factors, quality control/quality assurance, and preparation of the reports. This institutional structure involves thirty experts from sixteen different public and private institutions. The roles and responsibilities of each institution and their reporting lines are organised to reflect the levels of vertical and horizontal integration of the system. All data is compiled onto an online platform, the Climate Change Data Hub. This platform is a ‘one stop shop’, incorporating this data collection system as well as aiming to serve as a central database for all climate related documentation and archiving.
1Ghana’s NDC https://www.transparencypartnership.net/system/files/document/Good%20Practice-Ghana-
Climate%20Ambitious%20Reporting%20Program.pdf

For example, available subnational data on an emissions source is more detailed than the national level dataset (e.g., from detailed local waste collection data) and a higher tier is selected, or subnational-level data is not available, which requires the use of more generalised or proxy data, and thus tier 1 methods.
2. Choice of calculation factors used in estimates, such as emission factors and global warming potential (GWP) values
Even where the same tier levels are used, a specific level of government might not have insight into the emission factors (e.g. IPCC defaults, national or regional-level values or values from international sources7) or global warming potentials (e.g. from the IPCC’s 2nd, 4th or 5th Assessment Report8) other levels of government are using. Factors or values used at the subnational level may for this simple reason vary from those used by the national government. With regards to GWP values, subnational governments may also wish to ensure their GHG estimates use the most current set of values from the 5th IPCC Assessment Report, while national governments might still be using values from the 4th IPCC Assessment Report in line with international practice.
3. Disaggregation and detail
Subnational governments may also find that their policy needs and available data result in emissions estimates at a different level of disaggregation than national inventories, which could make alignment and integration challenging. For example, national inventories estimate and report emissions from ‘1A4 Other’, but subnational governments may desire to report Institutional and Commercial emissions separately from Residential.
4. Use of alternative methodological approaches
Whereas national inventories are defined by the geographic boundaries of the country and include all sources and sinks within them, subnational governments may choose to estimate emissions based not just on geographic boundaries. For example, areas that contain a power station supplying the national grid, may prefer to estimate emissions associated with the end use consumption of power from the national grid rather than the direct emissions from the power station. Other areas containing, for example, a major airport, may decide to exclude these emissions on the basis that they are ‘international’ and serve the country as a whole. Further, some areas may decide that a consumption-based approach is preferable for policy purposes, which differs significantly from national inventory methods.
5. Timeseries data and recalculations
Inventories are recommended to be calculated annually, and when doing so, timeseries data should be recalculated to ensure that improvements, data and other changes are implemented across the time series, in order to ensure that the reported emission trend is reliable. Subnational governments often calculate emissions for a single year as international reporting platforms require only the latest figure to
7 These might include factors published, for instance, on: UK conversion factors (https://www.gov.uk/government/publications/greenhouse-gas-reporting-conversion-factors-2020); website www.emissionfactors.com; WRI emission calculation tools (https://ghgprotocol.org/calculation-tools#cross_sector_tools_id) or EPA emission factors (https://www.epa.gov/sites/production/files/2020-04/documents/ghg-emission-factors-hub.pdf) 8 For these IPCC Assessment Reports see: https://www.ipcc.ch/reports/

be reported. This means that subnational governments may not always apply improvements to their timeseries, which could generate inconsistencies, or, may not be aware of or apply national improvements to their historical data, leading again to inconsistencies.
Role of Vertical Integration
VI with regards to methods is intrinsically linked to transparency and communication. Ensuring that there is transparency documentation, and communication of data, methods and assumptions between different levels of government will allow for harmonisation of methods or greater understanding of where there may be differences and the impact of these, to allow for adjustments.
Challenge Potential solutions
Choice of factors used in estimates
- Communication: o Review the emission factors and their sources that are used by different levels
of government. o Ensure that the emission factors used are communicated, for instance by
including a table of factors and their sources within publicly reported technical reports, to aid comparison and understand any key differences.
o If emission factors used are not made available by other levels of government, find out why. Clarify the importance and specific aim of sharing this information with them.
- Alignment: o Wherever possible, seek to align emission factors, e.g. using national factors
in calculations where available and when they also align to policy needs. o Generally, give preference to national emission factors over international
default factors wherever possible (but so long as this does not compromise policy needs).
o If alternative emission factors or GWP values are required to be used, for instance, for policy needs or according to requirements of reporting platforms, consider additionally calculating emissions using factors consistent with government to aid alignment, in an annex or alternative format report, for example.
- Integration: o A database system, as mentioned under “Lack of data” would ensure that
estimates are undertaken consistently with the same factors, and any new or updated factors can be automatically applied.
o A simpler option would be to establish a platform or communication process for sharing information on emission factors.
▪ For example, as part of the annual national inventory cycle it could be requested to include publication of emission factors and making these available to subnational governments on a website for use in their

estimations, or via the development of tools and other resources for subnational governments to use.
Choice of methodological tiers
- Communication: o The various levels of government exchange information about the tiers used
for the various sink/source categories. - Alignment: o The various levels of government agree on where to use the same tiers for the
same categories (allowing for easy aggregation) and where to continue using different tiers.
o As an example, a heavily forested state or region might decide to use a Tier 2 approach for forestry and land-use, as this will make it easier for the GHG inventory to reflect planned mitigation policies in that sector. At the same time, only a Tier 1 approach can be used at national level, as data required for Tier 2 is not available for all regions. Despite using a Tier 2 approach regionally, the region in question will have all necessary data for a Tier 1 approach (e.g. the land matrices) and can forward this data to the national level.
- Integration: o All levels of government would use the estimation standard and the same
tiers for the same categories within this standard. All relevant data is collected through the database system and can easily be aggregated for the purposes of emissions estimation (at the national level). This approach might not fulfil the policy needs of all levels of government.
Disaggregation and detail
- Communication: o Ensure that emissions reports use correct and consistent nomenclature9 so
that categories can be aggregated and disaggregated accordingly. - Alignment: o Linked to data sections – request data is provided at a level of disaggregation
helpful to other tiers and communicate the need for this. - Integration: o Use a database system with detailed data derived both from top down and
bottom up and harmonised, to enable estimation and reporting at very high levels of detail for any level/user.
Use of alternative methodological approaches
- Communication: o Be clear about the method and approach used so that others can understand
how it does and does not compare, i.e. ensure the methodology is fully referenced in the technical report.
- Alignment:
9 By using consistent and correct IPCC source category references, and if using alternative report formats such as the GPC, cross-referencing to the comparison tables contained in the annex.

o Some methods cannot be easily aligned, for example, consumption-based approaches take a fundamentally different approach to calculating emissions compared to those used by national inventories. The best way to align is to produce a second estimation using the same methodology. Preferably, all levels of government should agree on a preferred methodology (which, practically, would be the IPCC Guidelines – which are consistent with the GPC for cities).
o If an end-user inventory is estimated and electricity emissions are estimated using a grid average, ensure that ‘territorial’ emissions are also estimated. This means that any power stations are separately reported to enable aggregation, and methods for scope 3 transport are reported clearly, so that emissions can be separated to only include in-boundary.
- Integration: o This can be achieved by using a consumption-based accounting system
(usually these are estimated using national accounts such as economic expenditure statistics), that covers the whole country and makes data available at different spatial scales. This will allow consistent and integrated estimations.
Timeseries data and recalculations
- Communication: o Ensure improvements (and details of these) are communicated so that
comparisons with historical data at other levels of government and updates (if necessary) can be made.
- Alignment: o The inventory cycle is conducted in a way that means improvements can be
fed to other levels of government simultaneously (or at some point after publication so they can be implemented in the next update).
o Improvements should be proactively communicated, so that all levels of government can apply them as needed.
- Integration: o A centralised system of inventory compilation would ensure that
methodological updates are automatically applied at all levels and timeseries data are automatically recalculated.

Good practice examples
Case Study: Yucatán, Mexico
Throughout the lifespan of Yucatán's inventory, the specialised MRV state team has been guided by CONAFOR, the National Forestry Commission. This relationship has proven to be fruitful as Yucatán has accessed historical satellite monitoring data sets of forest land. These high-resolution images of forest land were generated by INEGI (the National Institute of Statistics and Geography). This allowed Yucatán to use these inputs and assess changes in forestry land to quantify the associated emissions in a precise manner.
Best Practice
CONAFOR has also guided the state inventory team on key methodologies to estimate GHG emissions. This encompassed several training sessions between the national (CONAFOR) and state-level inventory teams, thus encouraging a transfer of knowledge.
To maintain synergies across all of Yucatán's municipalities, an inter-ministerial board was established. This board represents eight municipalities. A bottom-up approach was integrated into Yucatán's inventory through continual engagement and collaboration between the inter-ministerial board. This proved to be advantageous as the state and board could amplify data sharing, coordinate project implementation and increase ownership and responsibility across the municipalities.
Case Study: Mato Grosso
Mato Grosso is a key example of a state utilising a combination of different data outlets to gather data on land use changes and land degradation. The data presented in the National Institute for Space Research’s (INPE) yearly reports are disaggregated by state, by year, by deforestation increment and by the extent of deforestation.
Best Practice
These reports issued by INPE include data at a granular level by municipality, therefore, equipping Mato Grosso with valuable data to feed into the state's inventory. Through this data sharing, Mato Grosso can open lines of communication and encourage vertical integration between the state and national level. This highlights the importance of data sharing between the national and state levels and sharing deforestation insights with the broader public. The process promoted transparency and accountability for both states and nations.
5.3 Vertical Integration and reporting
Reporting emission estimates is important for alignment from a communication perspective, but the format and nature of reporting can also help or hinder the ability to align.
Challenges
Challenges related to reporting can be classified into:
1. Reporting format
This might include the use of different reporting standards (e.g. GPC, IPCC 1996, IPCC 2006). Whilst
overlapping with the methods section above, the format of reporting includes nomenclature, allocation
of activities to sectors, and inclusion or exclusion of certain sectors (e.g. the GPC considers IPPU and
AFOLU to be ‘voluntary’). This means that inventories reported at different government levels may not
be immediately and obviously comparable.
In addition, emissions classified by ‘scope’ can add another layer of complexity. This is the case for
electricity under scope 2, which entails reporting emissions from power consumption within the
inventory´s geographical boundaries, regardless of if the energy was generated inside or outside of
these boundaries. Another example are emissions from waste which is generated within the boundaries
of the inventory, but disposed of outside its boundaries, meaning that the GHG emissions from this
waste also fall outside of these boundaries. Such emissions from waste are reported under scope 3.
Another difference in reporting is the choice of units, with various units in common use for reporting
emissions, such as Gg, Mt, kt, t, etc.
2. Reporting boundary
Whilst geographic boundaries should be easy to clarify between levels of government, other boundaries
also need to be defined and can differ. These might include the years over which a time series is
compiled (more relevant to subsequently undertaking projections, for example, starting from a defined
base year), or different choice of 12-month period, such as financial or calendar year. Lastly, boundaries
also relate to included and excluded activities, such as transboundary travel.
3. Reporting timeline
Lastly, the timeline and timeliness of data can impact vertical integration. For example, non-annual reporting or only periodic reporting means that it can be difficult to compare the same years or have certainty on when data might be available to align with. There is also often a lag in data, especially when provided by the national level, which might take 2+ years to be made available to other levels of government, compared to local data which might be available almost immediately.
Role of Vertical Integration
VI with regards to reporting is almost always about coordination and the provision of clear and complete information to ensure that the reported data can be easily understood and then adjusted if needed.

Challenge Potential solutions
Reporting format - Communication: o At the simplest level, ensuring that the reporting format being followed is
communicated clearly within both the inventory data and outputs will ensure that others can align.
▪ For the most part, reporting standards can generally be aligned to the IPCC guidelines so long as sectors are clearly identifiable. The GPC, for example, contains an annex that provides a table aligning the nomenclature10.
▪ Ensuring that the units of reporting and the inclusion or exclusion of any scopes is also communicated transparently will allow nonrelevant data to be excluded from (dis)aggregations.
- Alignment: o Agreeing on a reporting approach consistent between different levels of
government will help to ensure there is better alignment, and that specific common activities or classifications are used.
o Alignment could also be improved by the use of agreed templates for reporting between different entities, agreed units, and agreed approaches to ‘out of scope’ activities, such as waste disposed of in another jurisdiction.
o Ensure that there is a process for sharing outcomes to enhance opportunities to align.
- Integration: o A fully integrated database-type inventory system would harmonise simple
elements, such as units, and would enable the avoidance of double-counting through the centralised nature of the calculation and reporting.
▪ It would be necessary that all parties agree on the units, reporting system, etc.
▪ In addition, such a system should ideally be supported by a strong engagement process and collaboration activities, so that all levels of government are empowered to input. Collaboration could provide additional benefits, for example, improvements in data quality or reporting at one level can be fed in to enhance the outputs for all.
Reporting boundary
- Communication: o Again, at the simplest level, ensuring that the reporting boundary being
used is communicated clearly within both the inventory data and outputs will ensure that others can align.
10 https://ghgprotocol.org/sites/default/files/standards/GHGP_GPC_0.pdf

o Ensuring the time period of the assessment and any timeseries data is clearly identified is key.
o Ensure other levels of government can understand what has been included and excluded, and that the data is reported at a level of detail that allows for easy subtraction or comparison of such sectors as needed.
- Alignment: o Coordinating and agreeing between levels of government on the reporting
years in order to align them is key here, and again, templates and consistent reporting formats and procedures can assist.
o Ongoing communication and coordination in order to agree processes for reporting emissions across different scopes, such as scope 3 sources that might fall in other jurisdictions, will also support alignment.
- Integration: o As before, a fully integrated database-type inventory system would
harmonise boundary issues. It would again be necessary that all parties agree on the reporting boundaries.
Reporting timeline
- Communication: o Providing communications to ensure all levels of government are aware of
the publication dates and time periods covered (e.g. calendar year, financial year) for key statistics, data and inventory outputs will ensure that all levels can better align. ▪ Where publications do not cover the same time periods as a level of
government needs for its GHG inventory reporting, it may choose to adjust the data to the required time periods using scaling factors or other metrics. For example, where a GHG inventory is to cover calendar years, but fuel statistics cover the financial year, which starts in April and ends in March, data may be adjusted to match the calendar year.
- Alignment: o At the simplest level, alignment solutions here would involve an agreement
between all levels of government on the dates for publication, time periods covered and the frequency of reporting data and outputs, so that inventory cycles can be aligned to make best use of resources.
- Integration: o As before, a fully integrated database-type inventory system would
harmonise timeline issues. However, integration of reporting timelines needs to be part of a wider process of collaboration and engagement to ensure all levels of government are empowered to input and shape the outputs for their requirements, especially where policy needs determine a certain frequency or timeliness (e.g. annual deadlines).

Good practice examples
6. Conclusions
Subnational entities, like states and regions, are key in achieving successful climate action as they are closer to the ground. Where entities at several levels of administration (e.g. national, state/regional, city) assess GHG trends and plan, implement and track mitigation actions, ideally duplicated work should be minimized. Decisions should also be made based on common data to the extent feasible, allowing for differentiation where necessary according to the specific needs of each administration level.
The process of Vertical Integration (VI) provides a foundation for achieving efficiencies while allowing for flexibility, collaboration and understanding. Good practices of vertical integration for emissions and actions tracking can be found in many countries, as the case studies included in this paper demonstrate.
VI is a long-term process, which requires a detailed assessment of where synergies might be achieved and where differentiation remains necessary. This paper highlights a few key areas for synergies, including data, methodologies and reporting, through the activities of communication, alignment and integration. The paper presents practical solutions for each area according to this structure.
Case Study: Vietnam
The National Green Growth Action Plan (NGGAP) (2014)1 of Vietnam identifies specific activities and tasks in order to achieve the targeted objectives outlined in the Vietnam Green Growth Strategy (VGGS). More importantly it provides a clear mandate and ownership to each of the 63 provinces in the country to design their own respective Provincial Green Growth Action Plans.
As well, the Provincial People’s Committees and centrally-managed cities are also responsible for formulating local projects, developing action plans and directing the onsite implementation of the VGGS. In addition, the provinces will integrate the specific tasks into their local five-year plans, as well as their annual Socio-Economic Development Plan.
Best Practice
The development of the VGGS created a clear mandate for both the national and sub-national government levels to track green growth. This has allowed for a clear and transparent flow of data sharing. Vietnam have demonstrated the value of building on existing structures rather than re-inventing the wheel. An added benefit of the system enabled national ministries and provincial counterparts to take ownership of managing financial resources and flows.
1 Vietnam’s National Green Growth Action Plan (NGGAP) https://www.giz.de/en/downloads/Decision_403-2014-
TTg_EN.pdf

The process of achieving synergies requires prioritisation of actions and long-term implementation planning, in order to manage the creation of new systems and activities, across stakeholders with often limited resources. Figure 6 below presents some key process steps that to consider.
Figure 6 Steps to achieving VI in the longer term
As a first step, the needs of the various levels of administration with regards to tracking GHG emissions, setting reduction targets, planning and tracking for mitigation, and other related processes, need to be assessed. This assessment will reveal what kind of data is required (e.g. with regards to scope, years, units, standards used, etc.) and at what level of accuracy.
This needs assessment can then be compared with the data and methodologies already available and used at the various levels of administration, likely revealing a number of gaps, inconsistencies and duplications, such as similar data collected multiple times.
This insight will allow for agreement on where synergies might be realised (e.g. collecting data only once) and where differentiation has to prevail (e.g. cities using the GPC vs. states/regions using the IPCC guidelines).
Long-term planning will be required with regards to achieving these synergies step by step and in the most suitable form, be it through communication, alignment or integration, and by transitioning between these where and when appropriate.
As needs will change over time (e.g. when new targets are set or when international reporting requirements for the national level change), the assessment will need to be repeated from time to time, likely leading to updates to the long-term planning. Lessons learned from applying the first steps towards VI can then also be integrated.
Assess needs across government levels
Identify data & methodologies to meet
these needs
Identify data availability & methods used across
levels
Identify potential for synergies and need for
differentiation
Long-term planning for communication /
alignment / integration