Verizon’s 2008 Annual Report
76
Verizon Communications 2008 Annual Report
Transcript of Verizon’s 2008 Annual Report

Verizon Communications
2008 Annual Report

Financial Highlights (as of December 31, 2008)
$2.54 $2.54$2.39
$2.26$2.12
$1.90$88.2 $93.5 $97.4
$23.0
$26.3 $26.6$1.67$1.62
$1.78
ADJUSTED DILUTEDEARNINGS PER SHARE(non-GAAP)
06 07 0806 07 08
REPORTED DILUTEDEARNINGS PER SHARE
CONSOLIDATED REVENUES(billions)
OPERATING CASH FLOW FROM CONTINUING OPERATIONS(billions)
DECLARED DIVIDENDS PER SHARE
06 07 08 06 07 08 06 07 08
Note: Prior-period amounts have been reclassified to reflect comparable results.
See www.verizon.com/investor for reconciliations to generally accepted accounting principles (GAAP) for the non-GAAP financial measures included in this annual report. Verizon’s results for the periods presented have been adjusted to reflect the spinoff of local exchange and related business assets in Maine, New Hampshire and Vermont in March 2008. These reclassifications were determined using specific information where available and allocations where data is not maintained on a state-specific basis within the Company’s books and records. Verizon’s 2006 reported results include revenues and expenses from the former MCI, Inc., subsequent to the close of the merger in January 2006. Information provided in this annual report on a pro-forma (non-GAAP) basis presents the combined operating results of Verizon and the former MCI on a comparable basis. Discontinued operations include Verizon’s former directory publishing unit, which was spun off to shareowners in the fourth quarter 2006, and the operations of Verizon Dominicana C. por A. (Verizon Dominciana) and Telecomunicaciones de Puerto Rico Inc. (TELPRI) following second quarter 2006 agreements to sell the businesses. The Verizon Dominicana sale closed in the fourth quarter 2006. The TELPRI sale closed in the first quarter of 2007.
Corporate Highlights shown above are presented on a pro forma and adjusted basis. Intra- and inter-segment transactions have not been eliminated from the business group revenue totals cited in this document.
In keeping with Verizon’s commitment to protect the environment, this report was printed on paper certified by the Forest Stewardship Council (FSC). By selecting FSC-certified paper, Verizon is helping to make a difference by supporting responsible forest management practices.
Corporate Highlights > 5.1% consolidated revenue growth > 9.2% operating income growth > 7.6% EPS growth > 7% annual dividend increase > $1.4 billion in share repurchases

At Verizon, our business model is based on a few core beliefs. We believe our superior networks differentiate us and provide great communications experiences to customers. We believe our focus on the fundamentals of running a good business – operating excellence, financial discipline and strong values – gives us the ability to plan our future and manage through all economic conditions. We believe that investing for growth is the key to creating value for our shareowners. And we believe that the communications products and services we deliver are, and will continue to be, hugely important in the lives of our customers, our communities and our world.
By staying focused on this basic business model, Verizon has remained a source of relative stability in a tumultuous market. Our performance in 2008 bears this out and shows the funda-mental strength of our company.
Our main growth engines are wireless voice and data; high-speed consumer broadband and video services; and Internet Protocol (IP) networks, applications and professional services for global businesses. Each of these gained market share and attracted new customers in 2008. As a result of this strong performance in our strategic businesses, Verizon delivered growth in rev-enues, earnings and cash flow in 2008. Operating revenues for the year were $97.4 billion, an increase of 4.2 percent or 5.1 percent on an adjusted basis. Adjusted operating income was $18.1 billion, up 9.2 percent for the year. Operating cash flows from continuing operations totaled $26.6 billion, up 1.2 percent from 2007. Adjusted earnings from continuing operations were $2.54 per share, up 7.6 percent.
Chairman’s Letter to Shareowners
1
v e r i zo n co m m u n i c at i o n s i n c . 2008 a n n ua l r e p o r t
Ivan Seidenberg Chairman and Chief Executive Officer

2
By way of comparison, only three companies in the Dow Jones 30 generated more cash from operations than Verizon. Because of our strong financial position, we were able to invest $17.2 billion in networks, pay $5 billion in dividends and repurchase $1.4 billion of Verizon stock. In September, we increased our quarterly dividend by 7 percent, to $.46 per share – an expression of our Board’s confidence in our future and commitment to returning value to shareowners.
In 2008, we remained focused on building and creating the premier assets in our industry and continued to shift our center of gravity toward the growing wireless and broadband markets. For example, we expanded our wireless footprint by acquiring Rural Cellular and by winning extremely valuable wireless spectrum in the FCC auction, which positions us strongly for the next phase of growth in the wireless market. Also, in a transaction that closed in January 2009, we acquired the nation’s number-five wireless company, Alltel Corporation, making us the U.S. leader in wireless customers and revenues. At a time when even healthy companies found it difficult to tap into the credit markets, our ability to finance and execute a transaction of this magnitude affirms our financial solidity and healthy balance sheet. We also spun off some of our telephone properties in northern New England and merged them with Fairpoint Communications, a leading provider of local exchange services.
We continued to invest in the superior network technologies that are Verizon’s hallmark. Our purchase of spectrum in the FCC auction expanded our inventory by 60 percent, which gives us additional capacity to accommodate the rapid growth of wireless data services such as text messaging, e-mail and Internet access. We passed more than 3 million additional homes with our industry-leading fiber-optic network, FiOS, and are now beginning to expand into big city markets like New York City, Philadelphia and Washington, D.C. Our fiber network now passes 12.7 million homes, or about 40 percent of the households in our footprint, putting us two-thirds of the way to our target of passing 18 million homes by 2010. In the business market, our high-speed networks provide a sophisticated communications and computing platform for multinationals and govern-ment customers, and in 2008 we added to the security and robustness of our network infrastructure in the U.S., Europe and the Asia-Pacific region. We also led a consortium that built a high-speed submarine fiber link connecting China, South Korea, Taiwan and the United States.
$38.0$43.9
$49.3
WIRELESSREVENUE(billions)
06 07 08
59.165.7
72.1
WIRELESSCUSTOMERS(millions)
06 07 08
We’ve spent the last decade remaking our wireless, landline and Internet backbone networks and expanding the range of products, applications and services we can deliver to our customers. Today our customers do much more than make phone calls and send e-mail messages. They use our networks to watch high-definition (HD) TV, surf the Internet, share photos, watch videos online and conduct videoconferences around the globe. We’re prepared for the next wave of growth that will come from a new generation of broadband devices, applications and services that will use our wireless and fiber networks to deliver advances in entertain-ment, education, commerce and health care.
One of the biggest challenges for customers is bringing together all their digital experiences to make their lives more convenient and productive. We’ll soon be able to provide a technical solution to the challenge of convergence by designing applications that work across all our networks – broadband, global IP and wireless. Our customers will no longer be stranded on separate islands of technology because we’ll be able to build an application once and have the network deliver it to customers anytime, anywhere, and on any device. Giving customers new tools to better manage their digital lives will be one of the great business opportunities in the coming years.
Transforming Verizon to Deliver the Best Wireless and Broadband ExperienceFrom Voice and Data
To Content and Applications
To Unified Platforms
From Separate Platforms

3
v e r i zo n co m m u n i c at i o n s i n c . 2008 a n n ua l r e p o r t
Our philosophy is that by investing in the best networks, we can offer the best and most innovative services and enhance our competitiveness across the board. That proved true in 2008. We saw solid revenue growth in all our strategic businesses in 2008: 12.4 percent in wireless, 42 percent in broadband and video, and 16 percent in strategic business services. We added more than 6 million new wireless customers, 956,000 FiOS Internet customers and 975,000 customers for FiOS TV. Rising monthly average-revenue-per-user for wireless and broadband shows that our customers are finding these products more and more vital and useful in their daily lives. And in the business market, nearly 70 percent of our customers have or are in the process of transitioning to private IP networks, making this service the fastest growing in this business.
In wireless, we launched 36 new devices in 2008. More than one-third of them were smart phones, which reflects the evolution of wireless from a voice-only product to a full-service platform that allows customers to surf the Internet, check e-mail, watch video, exchange pictures and more. This growing array of data services now generates nearly 27 percent of wireless service revenues. Going forward, we believe that wireless growth will increasingly be driven by mobile connections built into a wide variety of products such as cameras, energy systems, vehicles, buildings and appliances. To accommodate these new services, we are preparing to launch our fourth-generation wireless network, which we believe will make Verizon’s wireless network the on-ramp for innovation in the next phase of this dynamic industry.
With FiOS, we are redefining the consumer telecom business as a broadband and video business. FiOS delivers ultra-fast Internet speeds and more high-definition video channels than any cable provider in the market today. These features have helped us achieve 25 percent market share for FiOS Internet and 21 percent for FiOS TV in four short years. We are well-positioned for the next wave of innovation in telecom, which will be driven by high-definition teleconferencing, three-dimensional video and other advanced services requiring the unique speed and capacity advantages of our all-fiber network.
In the global enterprise market, customers are looking for communications companies that can provide them with a full range of strategic capabilities – from security, professional services, information technology solutions, and private IP services to global networking. Verizon is one of
$4.5
$7.4
$10.7
WIRELESSDATA REVENUE(billions)
06 07 08
$50.44 $51.57 $51.88
WIRELESS RETAILSERVICE ARPU
06 07 08
We’re transforming our networks to provide for the bandwidth-intensive applications our customers will need in the future. Our all-fiber network will deliver all the advanced HD and Internet services that are being developed. You’ll walk through virtual stores, attend classes held thousands of miles away, or consult with your doctor – all without leaving home. Wireless smart phones will provide advanced Internet, video and computer applications to keep customers informed and entertained on the go. And our global network will support a new wave of productivity-enhancing applications like secure global transactions, electronic supply chains and manufacturing processes, and virtual-reality videoconferencing.
Verizon is doing much more than simply connecting individuals. We’re developing innovative network services that create communities where friends and neighbors, buyers and sellers, or teachers and students around the world can come together in unique and exciting ways. We’re enabling these valuable social networks by providing our customers the tools to share experiences with each other whenever and wherever they happen. We’re also helping address social issues that are critical to the well-being of our communities by building advanced broadband networks that are creating the jobs of the future, making communities more competitive and driving innovation and growth.
Transforming Verizon to Deliver the Best Wireless and Broadband ExperienceFrom Providing Service
To Offering Compelling Experiences
To Creating Communities
From Connecting Users

4
943
207
1,918
FIOS TVCUSTOMERS(thousands)
06 07 08
the world’s premier providers of all these capabilities. We are also building relationships with world-class partners like Accenture to leverage our complementary capabilities and provide customers with superior solutions for their businesses. Looking ahead, we expect companies to look for ways to use communications to run their businesses more efficiently, reduce travel expenses, save energy costs and connect their increasingly global workforces and supply chains. With our global reach and networking expertise, we have a great opportunity to be a strategic partner in helping our major customers achieve these goals.
Once again in 2008, our products earned Verizon top marks for quality and customer satisfac-tion. Consumer Reports ranked us number-one among wireless companies in customer satisfaction in 87 percent of the cities it studied. (By the way, Alltel was number-one in the other 13 percent.) PCMag.com named FiOS Internet the fastest and most satisfying service in the U.S. and listed FiOS as one of its 100 best products of 2008. Industry analysts such as Gartner and Forrester have recognized Verizon Business as a leader for global networks and services.
What this shows is that the market is responding to Verizon’s record of innovation. So we feel confident about our long-range growth opportunities. This is not to say we are
unaffected by the economic slowdown or by the ongoing structural changes in the communica-tions market. The traditional fixed-line telephone business continues to decline as customers disconnect their wired phones and shift to wireless, cable and other newer technologies. In addition, the faltering economy depressed volumes in the large-business market in the fourth quarter, as businesses began to curtail their spending and unemployment rose.
But all in all, 2008 was another year of operational excellence and strategic gains for our company. As for our stock performance, Verizon’s total return for 2008 was down 18 percent, as compared with declines of 32 percent for the Dow Jones Industrial Average and 37 percent for the Standard & Poor’s 500. If there’s a silver lining in these numbers, it’s that, on a relative basis, Verizon’s performance was in the top one-third of both the S&P and the Dow 30, which says that the market recognizes our earnings and dividend stability. A longer-term view of our performance over the period from 2006 to 2008 shows Verizon’s total return growing by 35 percent, as com-pared with a decline of 23 percent for the Standard & Poor’s 500.
In other words, Verizon has outperformed the market on a relative basis over the past year and has generated attractive returns on an absolute basis over three years. This is cold comfort to investors suffering through the current market crisis. You can be assured that the leaders of our company are focused on what we control – productivity, innovation, customer service, and a
687
1,525
2,481
FIOS INTERNETCUSTOMERS(thousands)
06 07 08
3-Year Total ReturnVerizon S&P 500
34.8%
-23.0%
-40%
0%
40%
80%
12/30/05 6/30/06 12/30/06 6/30/07 12/30/07 6/30/08 12/30/08

5
v e r i zo n co m m u n i c at i o n s i n c . 2008 a n n ua l r e p o r t
strong dividend – to translate the strength of our company into excellence for our customers and value for our investors.
I want to express my appreciation to our employees for their rock-solid dedication to our customers and sterling record of ethical management, diversity and volunteerism. In 2008, they volunteered 600,000 hours, contributed tens of millions of dollars to charities and community organizations, and responded with tremendous skill when ice storms, hurricanes and other emergencies threatened our customers’ vital communications lines. Their adherence to our values continues in bad times as well as good and is one of the major reasons I’m optimistic about our future, despite the challenges of the current economic environment.
I also would like to cite our Board of Directors, whose forethought and steadfastness in pursuing our strategic goals has been critical to our success. Special thanks go to longtime board member Robert Storey, who retired in 2008 with 23 years of service.
Finally, all Verizon shareowners owe a debt of gratitude to two executives who have put their mark on our company and our industry. William Barr retired at the end of 2008, having served as Verizon’s general counsel since our inception. Bill paved the way for a growing, competitive communications marketplace by leading the charge to reform the way our industry is regulated. He set the standard for what it means to be a superior general counsel. Our chief financial officer, Doreen Toben, will retire this year with decades of service to our company, the last seven as CFO. Doreen’s contributions to Verizon are profound. You can see her imprint on our culture of financial discipline, our strong balance sheet, our diversified asset base, and our passion for execution. Her influence will be visible for many years to come.
For all the challenges in our environment, we approach the future with confidence. In fact, I believe Verizon will be one of the companies that will help put our economy back on the path to prosperity and growth. Our products and services are indispensable in the lives of millions of customers. Our services will be key tools for businesses looking to work smarter and faster. Our technologies can help solve the big social challenges of our time such as energy efficiency and health care reform. We have the financial strength to grow and invest in the future. And we have great people, who want to do right by our customers, our company, our communities and our country. I couldn’t be more proud of their performance.
Last year in this space, I said Verizon’s goal was to be the best company in the communica-tions sector, period. To achieve that kind of sustained leadership requires several things. You need the right ideas about where the market is going and what differentiates your company in your industry. You need the right values to create the relationships on which long-term success is built. And you need the right culture of accountability to turn those ideas, beliefs and values into action and results.
That’s how we run our business. Our idea of the future, our values, and our commitment to accountability will keep us focused on our pursuit of excellence, regardless of how rocky the road ahead.
Tough times give us the opportunity to lead. I am confident that we will rise to the challenge of delivering value for our shareowners and customers in 2009.
Ivan Seidenberg Chairman and Chief Executive Officer
$17.1 $17.5 $17.2
CAPITAL EXPENDITURES(billions)
06 07 08
$4.1
$5.2$6.0
VERIZON BUSINESSSTRATEGIC SERVICESREVENUE(billions)
06 07 08

Any Time, Anywhere Broadband ConnectivityAt Verizon, we saw early on that wireless customers wanted to do more than just make phone calls, so we invested in wireless broadband technology to provide them with the bandwidth, speed and mobility they desire. Today our customers can check e-mail, get driving directions, take photos, share videos and explore the Internet, all with their mobile phones. We have the largest high-speed third-generation (3G) wireless network in America. With its size, scope and reliability, this advanced network provides the best wireless broadband experience in the industry and strong growth opportunities for our company.
But as our customers’ needs continue to evolve, they’ll want new ways to communicate whenever and wherever they choose – anywhere around the globe. They’ll need more bandwidth, innovative phones and other advanced services that enhance their mobile world. In fact, soon we won’t think only in terms of a wireless “phone.” The next generation of wireless broadband will be embedded into all kinds of consumer and business electronics including cameras, cars, credit cards, security systems, shipping containers, medical monitoring devices and even home appliances.
So in 2010, we’ll roll out our fourth-generation (4G) wireless network using Long Term Evolution (LTE) technology. This will enable customers to access data at even faster speeds, and it will provide a common wireless technology platform with true global scale. LTE will create additional
growth opportunities by delivering an unprecedented wireless broadband experience for high-performance mobile computing, advanced multimedia applications and sophisticated electronic devices.
We envision a future where a wide variety of wireless products and services from a growing portfolio of developers will be available for use on the Verizon Wireless network. To encourage this new round of innovation, Verizon Wireless is providing network options for using wireless devices, software and applications provided by third-party developers. Our Open Development Initiative is part of our strategy to expand the wireless market and offer our customers more wireless choices. Our goal is to create new opportunities for businesses, consumers and shareowners by driving broadband innovation deeper into the wireless marketplace.
To help deliver the broadband future, Verizon purchased valuable wireless spectrum from the FCC in 2008. This spectrum is a critical piece of our overall broadband strategy to take advantage of the enormous opportunity for growth in data services in the future. The spectrum will allow Verizon to capture the full potential of our 4G LTE network, our Open Development Initiative and the resulting next wave of wireless innovation.
Our investments will help us continue to maintain our network superiority, satisfy our customers’ broadband needs and provide additional value to our shareowners in the years ahead.
6

Any Time, Anywhere Broadband Connectivity
Verizon Wireless and Alltel Combined Networks
Verizon Wirelessformer Alltel
7
v e r i zo n co m m u n i c at i o n s i n c . 2008 a n n ua l r e p o r t
With the acquisition of Alltel in early 2009, Verizon Wireless now provides service to millions more customers across the United States on its own network. The merger created an enhanced platform of network coverage, spectrum and customer care to better serve the growing needs of both Alltel and Verizon Wireless customers for basic voice and advanced broadband wireless services. Our wireless network coverage now reaches approximately 288 million people – nearly the entire U.S. population – and our wireless customer base has increased to more than 80 million subscribers, making us the largest wireless carrier in the country.
Both Alltel and Verizon Wireless have long track records of delivering a high-quality customer experience in the marketplace, and the combination of the two companies will continue to improve on that heritage. Customers of both companies now have access to the country’s largest mobile to mobile calling community. Alltel
customers also will benefit from an expanded range of products and services, including a premier lineup of wireless devices and access to the nation’s largest 3G high-speed wireless broadband network.
The transaction puts the Alltel markets and customers on a path to advanced 4G services as Verizon Wireless deploys LTE technology throughout its network over the next several years. In addition, Alltel’s customers will reap the benefits of Verizon Wireless’ Open Development initiative, which welcomes third-party devices and services on the Verizon Wireless network.
The acquisition also provides opportunities for enhanced value for our shareowners. Both companies use a common network tech-nology, which provides advantages of a seamless transition for Alltel customers, ease in integrating the two companies’ networks, and scale efficiencies in operating the larger integrated network.
The Most Reliable Wireless Network is Now the Biggest
colored areas indicate verizon Wireless coverage, excluding roaming

As the nation’s premier broadband and entertainment provider, Verizon leads the way in delivering ultra-fast broadband using fiber-optic technology. Other companies claim to use fiber, but only Verizon FiOS delivers 100% fiber-optics – providing virtually unmatched bandwidth – on hair-thin strands of glass directly to our customers’ homes. Our all-fiber network offers an extraordinary experience in TV, Internet and phone, and provides immense capacity that will meet our customers’ bandwidth needs well into the future.
Cable companies deliver their broadband and TV services over coaxial cable, which has a fraction of the bandwidth available on our all-fiber network. In addition, cable customers share their broadband with other subscribers in their neighborhood, causing users to compete for available bandwidth during periods of high usage.
Verizon’s advanced technology and superior services have made FiOS the top-rated broadband service in America. Thanks to its unique architecture, Verizon’s all-fiber network has virtually
unlimited capacity, which delivers faster two-way speeds and bet-ter picture quality than cable companies can offer. Our FiOS TV and Internet services don’t have to struggle for bandwidth, because they’re delivered over separate high-capacity wavelengths of light. With the immense bandwidth of fiber, we can offer more HD chan-nels than any cable provider, and our uncompressed HD signal guarantees pure HD picture and sound.
But as recent history has shown, the amount of bandwidth that people use today is far less than they will want tomorrow. This is good news for Verizon because bandwidth growth is what makes FiOS so appealing. Our fiber network can be easily expanded to provide additional capacity by simply upgrading the lasers on the end points of the fiber cable. We avoid the labor-intensive costs of replacing our infrastructure, and we can grow as our customers’ broadband needs evolve, providing superior service and an efficient return on our network investment for years to come.
FiOS TV – the Future of Television
8

An All-Fiber Network for the Ultimate Entertainment ExperienceThe explosion of entertainment and information services has given Verizon new opportunities for growth in the broadband market. As Internet and high-definition video use continues to grow, consumers are demanding more capacity, speed and interactivity to send and receive bandwidth-intensive videos, photo albums and music files. Today’s digital home includes a wide variety of broadband devices, and the growth of Internet-capable consumer electronics will only increase future bandwidth demand. Tomorrow’s digital home will include dozens of “smart” devices, including multiple HDTVs; networked PCs and gaming consoles; appliance monitoring services; remote lighting and temperature controls; and interactive security systems.
Because our 100% fiber-optic network delivers a broader, more vibrant entertainment experience than any other provider, our customers get the best TV viewing experience possible. The high-capacity of fiber allows us to deliver more than 100 HD channels in every FiOS TV market. We offer a vast selection of programming, with more than 245 all-digital chan-nels and 14,000 video-on-demand titles each month, including more than 1,200 HD titles per month. Our Home Media Digital Video Recorder (DVR) technology allows customers to record programming on one DVR that can be watched on up to six TV sets throughout the home.
Fiber also allows Verizon customers to experience the fastest upload and download connection speeds. FiOS Internet is available with download speeds up to 50 megabits per second (Mbps) and upload speeds up to 20 Mbps. With these speeds customers no longer have to wait while large files are downloading, and they can upload 200 photos to their friends in about 90 seconds. Finally, in anticipation of the day when tomorrow’s digi-tal home requires even more bandwidth, we’re already testing download speeds of 100 Mbps.
The immense bandwidth and two-way interactivity of Verizon’s all-fiber network will help make the ultra-fast broadband future a reality because it’s perfectly suited for our customers’ evolving entertainment needs. As a result, the market penetration or our FiOS TV and Internet services continues to grow as more households opt for the superior band-width capacity of a direct fiber connection.
We’re uniquely positioned to offer customers superior broadband and entertainment services that fit today’s digital lifestyle, as well as the advanced applications our customers will require tomorrow.
9
v e r i zo n co m m u n i c at i o n s i n c . 2008 a n n ua l r e p o r t

10
Delivering A World of Experience The global marketplace continues to change, creating communication challenges for multinational corporations faced with widely dispersed employees, incompatible systems, limited resources and increasing competition. These organizations require a communications partner that can provide end-to-end solutions for the complex business needs of global enterprise customers.
As one of the leading providers of global communications, IT and security solutions, Verizon Business owns and maintains the world’s most-connected public IP network. Our vast experience, global reach and advanced technologies provide governments and businesses innovative solutions for a rapidly changing global environment.
Our strategic IP-based services are the essential building blocks for the integrated communications and IT solutions that Verizon Business offers worldwide. Strategic services include security and IT solutions as well as a full spectrum of professional and managed IP services that help customers make the most of IP communications, infrastructure and technology. The ongoing strong demand for these advanced services underscores that multinational customers see superior value in services that can help them maintain their competitive edge under any market conditions.
The growth of strategic services shows that multinational corporations and government agencies continue to look for ways to communicate and collaborate more effectively with customers, employees, suppliers and other key stakeholders around the globe. Verizon Business offers a range of video-related products, including a telepresence solution. Telepresence is the next-generation virtual meeting service that goes beyond video conferencing by creating the impression that everyone is assembled face-to-face in a single conference room. Working with the industry’s leading equipment manufacturers, Verizon Business provides the ideal telepresence platform through its Private IP and Ethernet offerings.
In 2008, we expanded and improved what was already one of the world’s few truly global networks, resulting in enhanced speed, availability, diversity and resiliency for business and government customers worldwide. These improvements were part of approximately $17 billion we invested last year building, operating and integrating our advanced broadband wireless and wireline networks.
We continue to invest in global network enhancements and innovative technologies that give our customers a competitive edge, whether they are across town or around the globe.

11
v e r i zo n co m m u n i c at i o n s i n c . 2008 a n n ua l r e p o r t
Connecting Nations Across the Globe
To meet the needs of businesses that operate around the world, Verizon has made strategic investments to become a leading pro-vider of global communications, IT and security solutions with the world’s most connected public IP network. As a founding mem-ber of the Trans-Pacific Express (TPE) Cable Consortium, Verizon Business has played a key role in helping to design, engineer and build the 18,000 kilometer (11,000 mile) TPE cable network, which is now in service. The TPE cable connects the United States to mainland China, South Korea and Taiwan.
As the only U.S.-based founding member of the consortium, Verizon Business guided the direction of the TPE cable and provided all U.S. operational needs for the TPE Consortium.
These include responsibility for activities at the cable station in Oregon, on the U.S. network cable routes and in the TPE network operations center, all of which allow us to provide a high level of network management functions for our customers. The next planned phase of the TPE system, with the addition of NTT Communications to the consortium, will provide new connections from Japan to China, Taiwan and South Korea.
Our involvement allows our customers to take full advantage of the cable system and the Verizon Business network, providing direct connectivity to our ultra-long haul and global mesh networks.

12
Making a Difference in Our CommunitiesAt Verizon, we understand our reputation isn’t limited to our performance in the marketplace. It also includes the quality of our products, our impact on the environment, the spirit of our employees and our standing in the community. We strive to make our broadband technologies as widely available as possible and to use our leadership and resources to create new solutions to the big problems facing our society. Even in these difficult economic times, we remain committed to using our signature programs to help create a better quality of life for the neighborhoods we live in and serve.
The Verizon Foundation connects our financial, technological and human resources with critical social issues that affect our employees, customers and communities. We focus on the issues of education and literacy, and safety and health. Our work is done through strategic partnerships with nonprofit organizations, informed grant-making that represents an investment in results, and the exceptional volunteer spirit of Verizon’s 223,900 employees. Our goal is to help people achieve the skills they need to live, learn and work in the 21st Century.
Thinkfinity.org is the Verizon Foundation’s free, comprehensive Web site containing more than 55,000 educational resources, including
standards-based, grade-specific, K-12 lesson plans; online educational games; videos; and other materials provided in partnership with many of the nation’s leading educational organizations. Since the Web site’s launch in March 2007, the Verizon Foundation has committed more than $34 million to update and expand Thinkfinity.org and provide training to teachers.
The Verizon Wireless HopeLine® program collects no-longer-used phones, batteries and accessories from any wireless service provider at our Communications Stores nationwide. We then put the nation’s most reliable wireless network to work in our communities by providing these phones as a vital link to emergency or support services for individuals who have suffered from abusive relationships. We also provide cash grants to local shelters and nonprofit organizations that focus on domestic violence prevention and awareness.
For more information on how Verizon is making a difference in our communities, please view our corporate responsibility report online at verizon.com/responsibility.

13
Selected Financial Data
v e r i zo n co m m u n i c at i o n s i n c . a n d s u b s i d i a r i e s
$60.0
Verizon S&P 500 Telecom Services S&P 500
Stock Performance Graph
$0
$100
$80
$60
$20
$40
$140
$120
$200
$180
$160
2003 2004 2005 2006 2007 2008
Dol
lars
Comparison of Five-Year Total Return Among Verizon, S&P 500 Telecom Services Index and S&P 500 Stock Index
The graph compares the cumulative total returns of Verizon, the S&P 500 Telecommunications Services Index, and the S&P 500 Stock Index over a five-year period, adjusted for the spin-off of our local exchange and related business assets in Maine, New Hampshire and Vermont and our domestic print and Internet yellow pages directories business. It assumes $100 was invested on December 31, 2003, with dividends reinvested.
Data Points in DollarsAt December 31,
2003 2004 2005 2006 2007 2008
Verizon 100.0 120.2 93.7 126.0 153.9 126.1S&P Telecom Services 100.0 119.9 113.5 155.0 173.4 120.6S&P 500 100.0 110.9 116.3 134.7 142.1 89.5
(dollars in millions, except per share amounts)
2008 2007 2006 2005 2004
Results of OperationsOperating revenues $ 97,354 $ 93,469 $ 88,182 $ 69,518 $ 65,751Operating income 16,884 15,578 13,373 12,581 10,870Income before discontinued operations, extraordinary item and cumulative effect of accounting change 6,428 5,510 5,480 6,027 5,899 Per common share – basic 2.26 1.90 1.88 2.18 2.13 Per common share – diluted 2.26 1.90 1.88 2.16 2.11Net income available to common shareowners 6,428 5,521 6,197 7,397 7,831 Per common share – basic 2.26 1.91 2.13 2.67 2.83 Per common share – diluted 2.26 1.90 2.12 2.65 2.79Cash dividends declared per common share 1.78 1.67 1.62 1.62 1.54
Financial PositionTotal assets $ 202,352 $ 186,959 $ 188,804 $ 168,130 $ 165,958Debt maturing within one year 4,993 2,954 7,715 6,688 3,476Long-term debt 46,959 28,203 28,646 31,569 34,970Employee benefit obligations 32,512 29,960 30,779 17,693 16,796Minority interest 37,199 32,288 28,337 26,433 24,709Shareowners’ investment 41,706 50,581 48,535 39,680 37,560
• Significanteventsaffectingourhistoricalearningstrendsin2006through2008aredescribedinManagement’sDiscussionandAnalysisofFinancialConditionandResultsofOperations.• 2005dataincludessalesofbusiness,leaseimpairment,severance,pensionandbenefitchargesandotheritems.• 2004dataincludessalesofbusiness,severance,pensionandbenefitchargesandotheritems.

Revenue Growth – To generate revenue growth we are devoting our resources to higher growth markets such as the wireless voice and data markets, the broadband and video markets, and the provision of stra-tegic services to business markets, rather than to the traditional wireline voice market. During 2008, revenues from these higher growth markets offset continuing declines in the traditional voice mass market, and we reported consolidated revenue growth of 4.2%. We continue developing and marketing innovative product bundles to include local, long-distance, wireless and broadband services for consumer and general business retail customers. We anticipate that these efforts will help counter the effects of competition and technology substitution that have resulted in access line losses, and will enable us to continue to grow consolidated revenues.
Market Share Gains – In our wireless business, our goal is to be the market leader in providing wireless voice and data communication services in the United States. To gain market share, we are focused on providing the highest network reliability and new and innovative products and services such as Mobile Broadband and our Evolution-Data Optimized (EV-DO) service. We also continue to expand our wireless data, messaging and multi-media offerings for both consumer and business customers. During 2008,
• our total number of customers increased 9.7% to 72.1 million; and• average revenueper customerpermonth (ARPU) fromservice reve-
nues increased by 1.2% to $51.59 from increased use of our messaging and other data services.
With our acquisition of Alltel Corporation (Alltel) in January 2009, we became the largest wireless provider in the U.S. as measured by the total number of customers.
In our wireline business, our goal is to become the leading broadband provider in every market in which we operate. During 2008,
• we passed 12.7 million premises with our high-capacity fiber optics network operated under the FiOS service mark;
• we added 660,000 net wireline broadband connections, for a total of 8,673,000 connections; and
• we added approximately 975,000 net new FiOS TV customers, for a total of 1,918,000 FiOS TV customers.
With FiOS, we have created the opportunity to increase revenue per customer as well as improve retention and profitability as the traditional fixed-line telephone business continues to decline as customers migrate to wireless, cable and other newer technologies. We are also focused on gaining market share in the enterprise business by the deployment of strategic service offerings – including expansion of our VoIP and inter-national Ethernet capabilities, the introduction of video and web-based conferencing capabilities, and enhancements to our virtual private net-work portfolio. In 2008, revenues from strategic services grew 16.1%.
Profitability Improvement – Our goal is to increase operating income and margins. In 2008,
• operating income rose 8.4% compared to 2007;• income before provision for income taxes, discontinued operations
and extraordinary item rose 2.8% compared to 2007; and• operating income margin rose 4% to 17.3% compared to 2007.
To position our company for sustainable, long-term profitability, we are directing our capital spending primarily toward higher growth markets. High-speed wireless data services, fiber optics to the premises, as well as expanded services to enterprise customers, are examples of these growth markets. During 2008, capital expenditures were $17,238 million compared with capital expenditures of $17,538 million in 2007, excluding
Overview
Verizon Communications Inc., (Verizon or the Company) is one of the world’s leading providers of communications services. Our domestic wireless business, operating as Verizon Wireless, provides wireless voice and data products and services across the United States (U.S.) using one of the most extensive and reliable wireless networks. Our wireline busi-ness provides communications services, including voice, broadband data and video services, network access, nationwide long-distance and other communications products and services, and also owns and oper-ates one of the most expansive end-to-end global Internet Protocol (IP) networks. Stressing diversity and commitment to the communities in which we operate, we have a highly diverse workforce of approximately 223,900 employees.
In the sections that follow we provide information about the important aspects of our operations and investments, both at the consolidated and segment levels, and discuss our results of operations, financial position and sources and uses of cash. In addition, we highlight key trends and uncertainties to the extent practicable. The content and organization of the financial and non-financial data presented in these sections are con-sistent with information used by our chief operating decision makers for, among other purposes, evaluating performance and allocating resources. We also monitor several key economic indicators as well as the state of the economy in general, primarily in the United States where the majority of our operations are located, in evaluating our operating results and assessing the potential impacts of these trends on our businesses. While most key economic indicators, including gross domestic product, affect our operations to some degree, we historically have noted higher cor-relations to non-farm employment, personal consumption expenditures and capital spending, as well as more general economic indicators such as inflationary or recessionary trends and housing starts.
Our results of operations, financial position and sources and uses of cash in the current and future periods reflect our focus on the following stra-tegic imperatives:
14
Management’s Discussion and Analysis ofFinancialConditionandResultsofOperations
v e r i zo n co m m u n i c at i o n s i n c . a n d s u b s i d i a r i e s

discontinued operations. We expect 2009 capital expenditures, excluding amounts related to the acquisition of Alltel, to be lower than 2008 capital expenditures.
Operational Efficiency – While focusing resources on revenue growth and market share gains, we are continually challenging our management team to lower expenses, particularly through technology-assisted produc-tivity improvements, including self-service initiatives. The effect of these and other efforts, such as real estate consolidations, call center routing improvements, the formation of a centralized shared services organiza-tion, and centralizing information technology and marketing efforts, has led to changes in our cost structure as well as maintaining and improving operating income margins. With our deployment of the FiOS network, we expect to realize savings annually in our ongoing operating expenses as a result of efficiencies gained from fiber network facilities. As the deploy-ment of the FiOS network gains scale and installation and automation improvements occur, average costs per home connected are expected to decline.
Customer Service – Our goal is to be the leading company in customer service in every market we serve. We view superior product offerings and customer service experiences as a competitive differentiator and a cata-lyst to growing revenues and gaining market share. We are committed to providing high-quality customer service and continually monitoring customer satisfaction in all facets of our business. We believe that we have the most loyal customer base of any wireless service provider in the United States, as measured by customer churn.
Performance-Based Culture – We embrace a culture of accountability, based on individual and team objectives that are performance-based and tied to Verizon’s strategic imperatives. Key objectives of our compensa-tion programs are pay-for-performance and the alignment of executives’ and shareowners’ long-term interests. We also employ a highly diverse workforce, since respect for diversity is an integral part of Verizon’s culture and a critical element of our competitive success.
We create value for our shareowners by investing the cash flows gen-erated by our business in opportunities and transactions that support the aforementioned strategic imperatives, thereby increasing customer satisfaction and usage of our products and services. In addition, we use our cash flows to repurchase shares and maintain and grow our dividend payouttoshareowners.Reflectingcontinuedstrongcashflowsandcon-fidence in Verizon’s business model, Verizon’s Board of Directors increased the Company’s quarterly dividend 6.2% during the third quarter of 2007 and 7.0% during the third quarter of 2008. During 2008, we repurchased $1,368 million of our common stock as part of our previously announced share buyback program. Net cash provided by operating activities – con-tinuing operations for the year ended December 31, 2008 of $26,620 million increased by $311 million from $26,309 million for the year ended December 31, 2007.
COnsOlidated results Of OperatiOns
In this section, we discuss our overall results of operations and highlight items that are not included in our business segment results. We have two reportable segments, which we operate and manage as strategic business units and organize by products and services. Our segments are Domestic Wireless and Wireline.
Thissectionandthefollowing“SegmentResultsofOperations”sectionalso highlight and describe those items of a non-recurring or non-oper-ational nature separately to ensure consistency of presentation. In the following section, we review the performance of our two reportable seg-ments. We exclude the effects of certain items that management does not consider in assessing segment performance, primarily because of their non-recurring and/or non-operational nature as discussed below andinthe“OtherConsolidatedResults”and“Other Items”sections.Webelieve that this presentation will assist readers in better understanding our results of operations and trends from period to period.
On March 31, 2008, we completed the spin-off of our local exchange and related business assets in Maine, New Hampshire and Vermont. Accordingly, Wireline results from divested operations have been reclassi-fied to Corporate and Other and reflect comparable operating results.
15
Management’s Discussion and Analysis ofFinancialConditionandResultsofOperations continued

Consolidated Revenues
(dollars in millions)Years Ended December 31, 2008 2007 % Change 2007 2006 % Change
Domestic Wireless $ 49,332 $ 43,882 12.4 $ 43,882 $ 38,043 15.3Wireline Verizon Telecom 29,912 30,780 30,780 31,759 Verizon Business 21,126 21,109 21,109 20,546 Intrasegment eliminations (2,824) (2,760) (2,760) (2,801)
48,214 49,129 (1.9) 49,129 49,504 (0.8)Corporate and Other (192) 458 nm 458 635 (27.9)ConsolidatedRevenues $ 97,354 $ 93,469 4.2 $ 93,469 $ 88,182 6.0
nm – not meaningful
2008 Compared to 2007Consolidated revenues in 2008 increased by $3,885 million, or 4.2%, com-pared to 2007. This increase was primarily the result of continued strong growth at Domestic Wireless.
Domestic Wireless’s revenues in 2008 increased by $5,450 million, or 12.4%, compared to 2007 due to increases in service revenues and equipment and other revenue. Service revenues during 2008 increased $4,619 million, or 12.2%, compared to 2007 primarily due to increases in data revenues and customers. Equipment and other revenue increased principally as a result of increases in the number of existing customers upgrading their wireless devices. Total data revenues increased by $3,265 million, or 44.2% in 2008 compared to 2007. There were 72.1 million total Domestic Wireless customers as of December 31, 2008, an increase of 9.7% from December 31, 2007. Domestic Wireless’s retail customer base as of December 31, 2008 was approximately 70 million, a 9.9% increase from 2007, and represented approximately 97.2% of its total customer base. ServiceARPU increasedby1.2%to$51.59 in2008comparedto2007,primarilyattributabletoincreasesinDataARPUdrivenbyincreaseduseofourmessagingandotherdataservices.RetailServiceARPUincreasedby 0.6% to $51.88 in 2008 compared to 2007.
Wireline’s revenues in 2008 decreased $915 million, or 1.9%, compared to 2007, primarily driven by lower demand and usage of our basic local exchange and accompanying services, partially offset by continued growth from broadband and strategic services. During 2008, we added 660,000 net new broadband connections, including 956,000 net new FiOS data connections, offset by a net decline of 296,000 high speed Internet connections. As of December 31, 2008 we served 8,673,000 connections, including 2,481,000 for FiOS Internet, representing an 8.2% increase in total broadband connections from December 31, 2007. In addition, we added 975,000 net new FiOS TV customers in 2008, for a total of 1,918,000 at December 31, 2008. The revenue growth at Verizon Telecom driven by broadband and video services was more than offset by a 3,722,000 decline in subscriber access lines resulting from competition andtechnologysubstitution, includingwirelessandVoIP.RevenuesatVerizon Business increased primarily due to higher demand for Internet-related product offerings, specifically Private IP products and the impact of foreign currency exchange rates on services billed in local currencies, partially offset by lower voice revenues.
2007 Compared to 2006Consolidated revenues in 2007 increased by $5,287 million, or 6.0%, com-pared to 2006. This increase was primarily the result of continued strong growth at Domestic Wireless.
Domestic Wireless’s revenues in 2007 increased by $5,839 million, or 15.3%, compared to 2006 due to increases in service revenues and equipment and other revenue. Equipment and other revenue increased principally as a result of increases in the number of existing customers upgrading their wireless devices. Total data revenues increased by $2,911 million, or 65.0% in 2007 compared to 2006 driven by increased use of our messaging and other data services. There were approximately 65.7 million total Domestic Wireless customers as of December 31, 2007, an increase of 11.3% from December 31, 2006. Domestic Wireless’s retail customer base as of December 31, 2007 was approximately 63.7 million, a 12.2% increase from 2006, and represented approximately 97% of its total customer base. ServiceARPUincreasedby2.3%to$50.96in2007comparedto2006,pri-marilyattributabletoincreasesindatarevenuepercustomer.RetailARPUincreased by 2.2% to $51.57 in 2007 compared to 2006.
Wireline’s revenues in 2007 decreased $375 million, or 0.8%, compared to 2006, primarily driven by lower demand and usage of our basic local exchange and accompanying services, partially offset by continued growth from broadband and strategic services. During 2007, we added 1,227,000 new broadband connections, an increase of 18.1%, including 847,000 for FiOS, for a total of 8,013,000 lines at December 31, 2007. In addition, we added 736,000 FiOS TV customers in 2007, for a total of 943,000atDecember31,2007.RevenuesatVerizonBusinessincreasedduring 2007 compared to 2006 primarily due to higher demand for strategic products. These increases were offset by a decline in voice revenues at Verizon Telecom due to a 3.5 million decline in subscribers resulting from competition and technology substitution, such as wireless and VoIP, including those subscribers who have migrated to our other service offerings.
16
Management’s Discussion and Analysis ofFinancialConditionandResultsofOperations continued

Consolidated selling, general and administrative expense in 2008 included $885 million for severance, pension and benefits charges (see “Other Items”),$150millionformergerintegrationcosts,primarilycomprisedofWireline systems integration activities related to businesses acquired and $87 million related to the spin-off of local exchange and related business assets in Maine, New Hampshire and Vermont.
Consolidated selling, general and administrative expense in 2007 included charges of $772 million for severance and related expenses (see “Other Items”),$146millionformerger integrationcosts,primarilycomprisedof Wireline systems integration activities related to businesses acquired and $84 million related to the spin-off of local exchange and related business assets in Maine, New Hampshire and Vermont. In addition, during 2007 we contributed $100 million of the proceeds from the sale ofourinvestmentinTelecomunicacionesdePuertoRico,Inc.(TELPRI)tothe Verizon Foundation.
Depreciation and Amortization ExpenseDepreciation and amortization expense in 2008 increased $188 million, or 1.3%, compared to 2007. The increase was mainly driven by growth in depreciable telephone plant and non-network software from additional capital spending.
2007 Compared to 2006Cost of Services and SalesConsolidated cost of services and sales expense in 2007 increased $2,238 million, or 6.3%, compared to 2006, primarily as a result of higher wireless network costs and wireless equipment costs, as well as higher costs asso-ciated with Wireline’s growth businesses. The increase was partially offset by the impact of productivity improvement initiatives and decreases in net pension and other postretirement benefit costs.
The higher wireless network costs were caused by increased network usage relating to both voice and data services in 2007 compared to 2006, partially offset by decreased local interconnection, long distance and roaming rates. Cost of wireless equipment sales increased in 2007 compared to 2006, primarily as a result of an increase in wireless devices sold due to an increase in equipment upgrades.
Consolidated cost of services and sales expense in 2007 and 2006 included $32 million and $25 million, respectively, of costs associated with the integration of MCI into our wireline business.
2008 Compared to 2007Cost of Services and SalesCost of services and sales includes the following costs directly attribut-able to a service or product: salaries and wages, benefits, materials and supplies, contracted services, network access and transport costs, wire-less equipment costs, customer provisioning costs, computer systems support, costs to support our outsourcing contracts and technical facili-ties and contributions to the universal service fund. Aggregate customer care costs, which include billing and service provisioning, are allocated between cost of services and sales and selling, general and administra-tive expense.
Consolidated cost of services and sales in 2008 increased $1,460 mil-lion, or 3.9%, compared to 2007, primarily as a result of higher wireless network costs and wireless equipment costs. The increase was partially offset by the impact of productivity improvement initiatives and lower cost of services and sales driven by a decline in switched access lines in service and wholesale voice connections. The higher wireless network costs in 2008 were primarily caused by increased network usage for voice and data services, increased roaming, increased use of data services and applications and increased payments related to network leases. Cost of wireless equipment sales increased in 2008 compared to 2007 primarily as a result of an increase in the number of equipment upgrades by cus-tomers, combined with an increase in average cost per unit. The increase in cost of services and sales was also impacted by unfavorable foreign exchange rates, higher utility costs and the inclusion of the results of operations of a security services firm acquired on July 1, 2007.
Consolidated cost of services and sales in 2008 and 2007 include $24 mil-lion and $32 million, respectively, of costs primarily associated with the integration of MCI into our wireline business. Consolidated cost of ser-vices and sales in 2008 also included $16 million related to the spin-off of local exchange and related business assets in Maine, New Hampshire and Vermont and $65 million for severance, pension and benefits charges.
Selling, General and Administrative ExpenseSelling, general and administrative expense includes salaries and wages and benefits not directly attributable to a service or product, bad debt charges, taxes other than income taxes, advertising and sales commis-sion costs, customer billing, call center and information technology costs, professional service fees and rent for administrative space.
Consolidated selling, general and administrative expense in 2008 increased $931 million, or 3.6%, compared to 2007. The increase resulted from higher sales commission expense, bad debt expense and adver-tising and promotion costs, partially offset by lower salary and benefits related expense and the impact of productivity initiatives.
17
Consolidated Operating Expenses
(dollars in millions)
Years Ended December 31, 2008 2007 % Change 2007 2006 % Change
Cost of services and sales $ 39,007 $ 37,547 3.9 $ 37,547 $ 35,309 6.3Selling, general and administrative expense 26,898 25,967 3.6 25,967 24,955 4.1Depreciation and amortization expense 14,565 14,377 1.3 14,377 14,545 (1.2)Consolidated Operating Expenses $ 80,470 $ 77,891 3.3 $ 77,891 $ 74,809 4.1
Management’s Discussion and Analysis ofFinancialConditionandResultsofOperations continued

Selling, General and Administrative ExpenseConsolidated selling, general and administrative expense in 2007 increased $1,012 million, or 4.1%, compared to 2006. The increase was primarily attributable to higher salary and benefits expenses. Also contrib-uting to the increase was higher sales commission expense at Domestic Wireless and higher advertising costs at Wireline. Partially offsetting the increases were lower bad debt expenses and cost reduction initiatives.
Consolidated selling, general and administrative expense in 2007 included charges of $772 million for severance and related expenses (see “Other Items”),$146millionformergerintegrationcosts,primarilycomprisedofWireline systems integration activities related to businesses acquired and $84 million related to the spin-off of local exchange and related business assets in Maine, New Hampshire and Vermont. In addition, during 2007 we contributed $100 million of the proceeds from the sale of our invest-mentinTELPRItotheVerizonFoundation.
Consolidated selling, general and administrative expense in 2006 included $56 million related to pension settlement losses incurred in connection with our benefit plans and a pretax charge of $369 million for employee severance and severance-related activities in connection with the involuntary separation of approximately 4,100 employees who were separated in 2006. Consolidated selling, general and administrative expense in 2006 also included $207 million of merger integration costs, primarily for advertising and other costs related to re-branding initiatives and systems integration activities, and a pretax charge of $184 million for Verizon Center relocation costs.
Depreciation and Amortization ExpenseDepreciation and amortization expense in 2007 decreased $168 million, or 1.2%, compared to 2006. The decrease was primarily due to lower rates of depreciation as a result of changes in the estimated useful lives of certain asset classes at Wireline and fully amortized customer lists at Domestic Wireless, partially offset by growth in depreciable telephone plant as a result of increased capital expenditures.
Other Consolidated Results
Equity in Earnings of Unconsolidated Businesses (dollars in millions)Years Ended December 31, 2008 2007 2006
Vodafone Omnitel $ 655 $ 597 $ 703CANTV – – 182Other (88) (12) (112)Total $ 567 $ 585 $ 773
Equity in earnings of unconsolidated businesses in 2008 decreased by $18 million, or 3.1%, compared to 2007. The decrease was primarily driven by the gain on the sale of an international investment in 2007, partially offset by higher earnings at Vodafone Omnitel N.V. (Vodafone Omnitel) in 2008.
Equity in earnings of unconsolidated businesses in 2007 decreased by $188 million, or 24.3%, compared to 2006. The decrease was primarily driven by the nationalization of Compañía Anónima Nacional Teléfonos de Venezuela (CANTV) during 2007, as well as the effect of lower tax ben-efits at Vodafone Omnitel.
Other Income and (Expense), Net (dollars in millions)Years Ended December 31, 2008 2007 2006
Interest income $ 362 $ 168 $ 201Foreign exchange gains (losses), net (46) 14 (3)Other, net (34) 29 197Total $ 282 $ 211 $ 395
Other Income and (Expense), Net in 2008 increased $71 million, or 33.6%, compared to 2007. The increase was primarily attributable to higher interest income, primarily from our investment in Alltel’s debt obligations. Partially offsetting the increase were foreign exchange losses at our international Wireline operations and an impairment charge of $48 million recorded during the fourth quarter of 2008 related to an other-than-temporary decline in fair value of our investments in certain marketable securities.
Other Income and (Expense), Net in 2007 decreased $184 million, or 46.6%, compared to 2006. The decline was primarily attributable to a gain on the sale of a Wireline investment in 2006, as well as decreased interest income as a result of lower average cash balances.
Interest Expense (dollars in millions)Years Ended December 31, 2008 2007 2006
Total interest costs on debt balances $ 2,566 $ 2,258 $ 2,811Less capitalized interest costs 747 429 462Interest expense $ 1,819 $ 1,829 $ 2,349
Weighted average debt outstanding $ 41,064 $ 32,964 $ 41,500Effective interest rate 6.25% 6.85% 6.78%
Total interest costs in 2008 increased $308 million, compared to 2007, due to an increase in the weighted average debt level, partially offset by lower interest rates compared to last year. Interest Expense in 2008 decreased $10 million compared to 2007 primarily due to higher capitalized interest costs. Capitalized interest costs include approximately $557 million related to the development of wireless licenses for commercial service, primarily as a result of the spectrum acquired in the 700 MHz auction. The increase in weighted average debt outstanding was primarily driven by the issuance of $8,000 million of fixed rate notes with varying maturi-ties, in the first half of 2008, and to a lesser extent, the Verizon Wireless borrowings during the second half of 2008 (see “Consolidated Financial Condition”).Partiallyoffsettingthisincreaseintheweightedaveragedebtoutstanding were debt reductions.
Total interest costs in 2007 decreased $553 million, compared to 2006, pri-marily due to a decrease in average debt levels, partially offset by slightly higher interest rates. Debt levels decreased primarily as a result of the approximately $7,100 million reduction from the spin-off of our domestic print and Internet yellow pages directories business in November 2006, as well as from debt redemptions and retirements funded by proceeds from the spin-off and the divestiture of our Caribbean and Latin American investments during 2006 and the first quarter of 2007.
Minority Interest (dollars in millions)Years Ended December 31, 2008 2007 2006
Minority interest $ 6,155 $ 5,053 $ 4,038
The increase in minority interest in 2008 compared to 2007, and in 2007 compared to 2006, was due to the higher earnings in our Domestic Wireless segment, which has a significant minority interest attributable to Vodafone Group Plc (Vodafone).
18
Management’s Discussion and Analysis ofFinancialConditionandResultsofOperations continued

Provision for Income Taxes (dollars in millions)Years Ended December 31, 2008 2007 2006
Provision for income taxes $ 3,331 $ 3,982 $ 2,674Effective income tax rate 34.1% 42.0% 32.8%
The effective income tax rate is the provision for income taxes as a per-centage of income from continuing operations before the provision for income taxes. The effective income tax rate in 2008 was lower than 2007 primarily due to recording $610 million of foreign and domestic taxes and expenses in 2007 specifically relating to our share of Vodafone Omnitel’s distributable earnings. Verizon received net distributions from Vodafone Omnitel in April 2008 and December 2007 of approximately $670 million and $2,100 million, respectively.
The effective income tax rate in 2007 compared to 2006 was higher primarily due to taxes recorded in 2007 related to distributions from Vodafone Omnitel as discussed above. The 2007 rate was also increased due to higher state taxes in 2007 as compared to 2006, as well as greater benefits from foreign operations in 2006 compared to 2007. These increases were partially offset by lower expenses recorded for unrecog-nized tax benefits in 2007 as compared to 2006.
A reconciliation of the statutory federal income tax rate to the effective income tax rate for each period is included in Note 16 to the consoli-dated financial statements.
Discontinued Operations In accordance with Statement of Financial Accounting Standard (SFAS) No. 144, Accounting for the Impairment or Disposal of Long-Lived Assets, we haveclassifiedTELPRI,VerizonDominicanaandourformerdomesticprintand Internet yellow pages directories publishing operations as discon-tinued operations in the consolidated financial statements for all periods presented through the date of the divestiture or spin-off.
On March 30, 2007, after receiving Federal Communications Commission (FCC)approval,wecompletedthesaleofour52%interestinTELPRIandreceived gross proceeds of approximately $980 million. The sale resulted in a pretax gain of $120 million ($70 million after-tax, or $.02 per diluted share). Additionally, $100 million of the proceeds were contributed to the Verizon Foundation.
The sale of Verizon Dominicana closed in December 2006, and primarily due to taxes on previously unremitted earnings, a pretax gain of $30 mil-lion resulted in an after-tax loss of $541 million ($.18 per diluted share).
We completed the spin-off of our domestic print and Internet yellow pages directories business to our shareowners on November 17, 2006, which resulted in an $8,695 million increase to contributed capital in shareowner’s investment. In addition, we recorded pretax charges of $117 million ($101 million after-tax, or $.03 per diluted share) for costs related to this spin-off. These costs primarily consisted of debt retirement costs, costs associated with accumulated vested benefits of employees, investment banking fees and other transaction costs related to the spin-off, which are included in discontinued operations.
Income from discontinued operations, net of tax, decreased by $617 million, or 81.3%, in 2007 compared to 2006. The decrease was primarily driven by the assets disposed of in 2006, partially offset by the after-tax gainrecordedin2007onthesaleofourinvestmentinTELPRI.
19
Management’s Discussion and Analysis ofFinancialConditionandResultsofOperations continued
Extraordinary ItemIn January 2007, the BolivarianRepublic ofVenezuela (the Republic)declared its intent to nationalize certain companies, including CANTV. On February 12, 2007, we entered into a Memorandum of Understanding (MOU)withtheRepublic,whichprovidedthattheRepublicoffertopur-chase all of the equity securities of CANTV, including our 28.5% interest, through public tender offers in Venezuela and the United States. Under the terms of the MOU, the prices in the tender offers would be adjusted downward to reflect any dividends declared and paid subsequent to February 12, 2007. During 2007, the tender offers were completed and Verizon received an aggregate amount of approximately $572 million, which included $476 million from the tender offers as well as $96 million of dividends declared and paid subsequent to the MOU. During 2007, based upon our investment balance in CANTV, we recorded an extraor-dinary loss of $131 million, including taxes of $38 million, or $.05 per diluted share.
Cumulative Effect of Accounting ChangeEffective January 1, 2006, we adopted SFAS No. 123(R), Share-Based Payments, utilizing the modified prospective method. The impact to Verizon primarily resulted from Domestic Wireless, for which we recorded a $42 million ($.01 per diluted share) cumulative effect of accounting change, net of taxes and after minority interest, to recognize the effect of initially measuring the outstanding liability for awards granted to Domestic Wireless employees at fair value utilizing a Black-Scholes model.
segment results Of OperatiOns
We have two reportable segments, Domestic Wireless and Wireline, which we operate and manage as strategic business units and organize by prod-ucts and services. We previously measured and evaluated our reportable segments based on segment income. Beginning in 2008, we measure and evaluate our reportable segments based on segment operating income, which is reflected in all periods presented. The use of segment operating income is consistent with the chief operating decision makers’ assessment of segment performance. You can find additional information about our segments in Note 17 to the consolidated financial statements.
Corporate, eliminations and other includes unallocated corporate expenses, intersegment eliminations recorded in consolidation, the results of other businesses such as our investments in unconsolidated businesses, lease financing, and other adjustments and gains and losses that are not allocated in assessing segment performance due to their non-recurring or non-operational nature. Although such transactions are excluded from the business segment results, they are included in reported consolidated earnings. Gains and losses that are not individually significant are included in all segment results, since these items are included in the chief oper-ating decision makers’ assessment of segment performance.

20
Domestic Wireless
Our Domestic Wireless segment provides wireless voice and data ser-vices, other value-added services and equipment sales across the United States. This segment primarily represents the operations of our joint ven-ture with Vodafone, operating as Verizon Wireless. We own a 55% interest in the joint venture and Vodafone owns the remaining 45%. All financial results included in the tables below reflect the consolidated results of Verizon Wireless.
Operating Revenue (dollars in millions)Years Ended December 31, 2008 2007 2006
Service revenue $ 42,635 $ 38,016 $ 32,796 Equipment and other 6,697 5,866 5,247 Total Domestic Wireless OperatingRevenue $ 49,332 $ 43,882 $ 38,043
Domestic Wireless’s total operating revenue in 2008 increased by $5,450 million, or 12.4%, compared to 2007. Service revenue increased by $4,619 million, or 12.2%, in 2008 compared to 2007. The increase in service revenue was primarily driven by an increase in data revenue in 2008 compared to 2007, and to a lesser extent, an increase in customers as of December 31, 2008 compared to December 31, 2007. Equipment and other revenue increased by $831 million, or 14.2%, in 2008 compared to 2007, primarily as a result of an increase in the number of customers upgrading their wireless devices. Other revenue also increased due to increases in cost recovery surcharges and regulatory fees.
Total data revenue in 2008 was $10,651 million and accounted for 25.0% of service revenue, compared to $7,386 million and 19.4% of service revenuein2007.TotaldataARPUincreasedby30.2%to$12.89in2008,compared to $9.90 in 2007, primarily as a result of increased use of our messaging service, Mobile Broadband and e-mail services, data transport charges, and newer data services such as VZ Navigator.
ServiceARPUincreasedby1.2%to$51.59in2008,comparedto$50.96in2007.RetailServiceARPUincreasedby0.6%to$51.88in2008,comparedto $51.57 in 2007.
Domestic Wireless had approximately 70 million retail customers as of December 31, 2008, an increase of 6.3 million, or 9.9%, compared to approximately 63.7 million retail customers as of December 31, 2007. Retail(non-wholesale)customersarecustomerswhoaredirectlyservedand managed by Verizon Wireless and who buy its branded services. Domestic Wireless had 72.1 million total customers as of December 31, 2008, of which 97.2% were retail customers, compared to approximately 65.7 million total customers as of December 31, 2007, of which 97.0% were retail customers. Our Domestic Wireless customer base as of December 31, 2008 was 92.9% retail postpaid, unchanged compared to December 31, 2007. Customer acquisitions and adjustments during 2008 included approximately 650,000 net total customer additions, after conforming adjustments,acquired fromRuralCellularCorporation (RuralCellular).As a result of the exchange with AT&T consummated on December 22, 2008, Domestic Wireless transferred a net of approximately 122,000 total customers. The total average monthly customer churn rate was 1.25% in 2008, compared to 1.21% in 2007. The average monthly retail postpaid customer churn rate was 0.96% in 2008, compared to 0.91% in 2007.
Domestic Wireless’s total operating revenue in 2007 increased by $5,839 million, or 15.3%, compared to 2006. Service revenue in 2007 increased by $5,220 million, or 15.9%, compared to 2006. The service revenue increase was primarily due to an 11.3% increase in customers as of December 31, 2007 compared to December 31, 2006, and increased average revenue per customer. Equipment and other revenue in 2007 increased by $619 million, or 11.8%, compared to 2006, principally as a result of increases
in the number of customers upgrading their wireless devices. Other rev-enue in 2007 also increased due to increases in cost recovery surcharges and regulatory fees.
Total data revenue in 2007 was $7,386 million and accounted for 19.4% of service revenue, compared to $4,475 million and 13.6% of service revenuein2006.TotaldataARPUincreasedby45.8%to$9.90in2007,compared to $6.79 in 2006, as a result of increased use of messaging ser-vice, Broadband Access and e-mail services, and other data services.
ServiceARPUincreasedby2.3%to$50.96in2007comparedto$49.80in2006.RetailServiceARPUincreasedby2.2%to$51.57in2007comparedto $50.44 in 2006.
Operating Expenses (dollars in millions)Years Ended December 31, 2008 2007 2006
Cost of services and sales $ 15,660 $ 13,456 $ 11,491Selling, general and administrative expense 14,273 13,477 12,039Depreciation and amortization expense 5,405 5,154 4,913Total Operating Expenses $ 35,338 $ 32,087 $ 28,443
Cost of Services and SalesCost of services and sales includes costs to operate the wireless network as well as the cost of roaming and long distance, the cost of data services and applications and the cost of equipment sales. Cost of services and sales in 2008 increased by $2,204 million, or 16.4%, compared to 2007. The increase in cost of services was driven by higher wireless network costs on increased network usage for voice and data services, increased roaming, increased use of data services and applications, as well as increased payments related to network related leases. Cost of equipment sales increased by 18.9%, in 2008 compared to 2007. This increase was pri-marily attributable to an increase in the number of equipment upgrades by customers combined with an increase in average cost per unit.
Cost of services and sales in 2007 increased by $1,965 million, or 17.1%, compared to 2006, primarily due to higher wireless network costs in 2007 caused by increased network usage, partially offset by lower rates for long distance, roaming and local interconnection. Cost of equipment sales grew by 20.2% in 2007 compared to 2006. The increase was pri-marily attributed to an increase in equipment upgrades, together with an increase in cost per unit as a result of increased sales of higher cost advanced wireless devices.
Selling, General and Administrative ExpenseSelling, general and administrative expense in 2008 increased by $796 million, or 5.9%, compared to 2007. This increase was primarily due to an increase in sales commission expense, primarily from an increase in equipment upgrades in our indirect channel, as well as higher adver-tising and promotion expense, bad debt expense and regulatory fees. The increases in selling, general and administrative expense were par-tially offset by a decrease in salary and benefits related expense.
Selling, general and administrative expense in 2007 increased by $1,438 million, or 11.9%, compared to 2006. This increase was primarily due to an increase in salary and benefits expense, resulting from an increase in employees in the sales and customer care areas, and higher per employee salary and benefit costs.
Depreciation and Amortization ExpenseDepreciation and amortization expense in 2008 increased by $251 mil-lion, or 4.9%, compared to 2007 and increased by $241 million, or 4.9%, in 2007 compared to 2006. These increases were primarily due to an increase in depreciable assets. Partially offsetting this increase in 2007 was lower amortization expense resulting from customer lists becoming fully amortized during 2006.
Management’s Discussion and Analysis ofFinancialConditionandResultsofOperations continued

21
Operating Income
(dollars in millions)Years Ended December 31, 2008 2007 2006
Operating Income $ 13,994 $ 11,795 $ 9,600
Operating income in 2008 increased by $2,199 million, or 18.6%, com-pared to 2007 and increased by $2,195 million, or 22.9%, in 2007 compared to 2006, primarily due to the impact of operating revenue and operating expenses described above.
Wireline
The Wireline segment consists of the operations of Verizon Telecom, which provides communication services, including voice, broadband video and data, network access, long distance, and other services to resi-dential and small business customers and carriers, and Verizon Business, which provides voice, data and Internet communications services as well as next-generation IP network services to medium and large business cus-tomers, multi-national corporations, and state and federal government customers globally. The results of operations presented below exclude the local exchange and related businesses in Maine, New Hampshire and Vermont that were spun-off on March 31, 2008.
Operating Revenues (dollars in millions)Years Ended December 31, 2008 2007 2006
Verizon Telecom Mass Markets $ 20,974 $ 21,289 $ 21,542 Wholesale 7,571 7,774 8,017 Other 1,367 1,717 2,200Verizon Business Enterprise Business 14,411 14,550 14,164 Wholesale 3,341 3,345 3,281 International and Other 3,374 3,214 3,101Intrasegment eliminations (2,824) (2,760) (2,801)TotalWirelineOperatingRevenues $ 48,214 $ 49,129 $ 49,504
Verizon Telecom Mass MarketsVerizon Telecom’s Mass Markets revenue includes local exchange (basic service and end-user access), value-added services, long distance, broadband services for residential and small business accounts and FiOS TV services. Long distance includes both regional toll services and long distance services. Broadband services include high speed Internet and FiOS Internet.
Our Mass Markets revenue in 2008 decreased by $315 million, or 1.5%, compared to 2007 and decreased by $253 million, or 1.2% in 2007, com-pared to 2006. These decreases were primarily driven by lower demand and usage of our basic local exchange and accompanying services, attributable to consumer subscriber line losses driven by competition and technology substitution, including wireless and VoIP. These decreases were partially offset by growth from broadband and video services.
Declines in switched access lines in service of 9.3% in 2008 and 8.1% in 2007 were mainly driven by the effects of competition and technology substitution.Residentialretailaccess linesdeclined11.4%in2008and9.5% in 2007, as customers substituted wireless, VoIP, broadband and cable services for traditional voice landline services. At the same time, small business retail access lines declined 5.0% in 2008 and 4.0% in 2007, primarily reflecting competition and a shift to high-speed access lines. The resulting total retail access line loss was 9.1% and 7.6% in 2008 and 2007, respectively.
We added 660,000 net new broadband connections, including 956,000 net new FiOS Internet connections, in 2008. We ended 2008 with 8,673,000 net broadband connections, including 2,481,000 for FiOS Internet, representing an 8.2% increase in total broadband connections compared to 8,013,000 connections at December 31, 2007. In addition, we added approximately 975,000 FiOS TV customers in 2008 and ended the year with a total of 1,918,000, an increase of approximately 103.4% compared to 943,000 FiOS TV customers at December 31, 2007. As of December 31, 2008, for FiOS Internet and FiOS TV, we achieved penetra-tion rates of 24.9% and 20.8%, respectively, across all markets where we have been selling these services.
WholesaleWholesale revenues are earned from long distance and other carriers who use our local exchange facilities to provide services to their customers. Switched access revenues are generated from fixed and usage-based charges paid by carriers for access to our local network. Special access revenues are generated from carriers that buy dedicated local exchange capacity to support their private networks. Wholesale services also include local wholesale revenues from unbundled network elements (UNEs) and interconnection revenues from competitive local exchange carriers (CLECs) and wireless carriers.
Wholesale revenues in 2008 decreased by $203 million, or 2.6%, compared to 2007 and by $243 million, or 3.0% in 2007 compared to 2006, due to declines in switched access revenues and local wholesale revenues. These declines were partially offset by increases in special access revenues. Switched minutes of use (MOUs) declined in 2008 and 2007, reflecting the impact of access line loss and wireless substitution. Wholesale lines decreased by 16.0% in 2008 due to the continued impact of competitors deemphasizing their local market initiatives coupled with the impact of technology substitution compared to a 16.1% decline in 2007. Special access revenue growth reflects continuing demand for high-capacity, high-speed digital services, partially offset by lower demand for older, low-speed data products and services. As of December 31, 2008, customer demand, as measured in DS1 and DS3 circuits, for high-capacity and digital data services increased 5.1% compared to an increase of 8.2% in 2007.
The FCC regulates the rates charged to customers for interstate access services.See“OtherFactorsThatMayAffectFutureResults–RegulatoryandCompetitiveTrends–FCCRegulation”foradditionalinformationonFCC rulemaking concerning federal access rates, universal service and certain broadband services.
OtherRevenuesOther revenues include such services as operator services (including deaf relay services), public (coin) telephone, card services and supply sales, as well as dial around services including 10-10-987, 10-10-220, 1-800-COLLECT and Prepaid Cards. Verizon Telecom’s revenues from other services decreased by $350 million, or 20.4% in 2008, and by $483 million, or 22.0% in 2007, mainly due to the discontinuation of non-stra-tegic product lines and reduced business volumes.
Management’s Discussion and Analysis ofFinancialConditionandResultsofOperations continued

22
Verizon BusinessEnterprise BusinessOur Enterprise Business channel offers voice, data and Internet communi-cations services to medium and large business customers, multi-national corporations, and state and federal government customers. In addition to traditional voice and data services, Enterprise Business offers managed and advanced products and solutions through our Strategic Services. This encompasses our focus areas of growth, including IP services and value-added solutions that make communications more secure, reliable and efficient. Enterprise Business also provides managed network services for customers that outsource all or portions of their communications and information processing operations and data services such as Private IP, PrivateLine,FrameRelayandATMservices,bothdomesticallyandinter-nationally. In addition, Enterprise Business offers professional services in more than 30 countries around the world, supporting a range of solu-tions including network service, managing a move to IP-based unified communications and providing application performance support.
Enterprise Business revenues in 2008 decreased by $139 million, or 1.0%, compared to 2007. The revenue decline is due to certain customers moving traffic off of our network, partially offset by increases in customer premise equipment revenue and security solutions revenue. The IP and services suite of products continues to be Enterprise Business’ fastest growing and includes Private IP, IP, VPN, Managed Services, Web Hosting and VoIP. Enterprise Business revenues in 2007 increased by $386 million, or 2.7%, compared to 2006, primarily reflecting growth in demand for our strategic products, specifically IP services, Managed Services and security, as well as the inclusion of the results of operations of the former MCI business subsequent to the close of the merger on January 6, 2006.
WholesaleOur Wholesale revenues relate to domestic wholesale services and include all interexchange wholesale traffic sold in the United States, as well as internationally destined traffic that originates in the United States. The Wholesale line of business is comprised of numerous large and small customers that predominately resell voice services to their own customer base. A portion of this revenue is generated by a few large telecommuni-cation carriers, many of whom compete directly with Verizon.
Verizon Business Wholesale revenues in 2008 decreased by $4 million, or 0.1%, compared to 2007, primarily due to continued rate compres-sion due to competition in the marketplace partially offset by increased MOUs in traditional voice products. Verizon Business Wholesale revenues in 2007 increased by $64 million, or 2.0% as compared to 2006, primarily due to increased MOUs in traditional voice products, partially offset by continued rate compression due to competition in the marketplace, as well as the inclusion of the results of operations of the former MCI busi-ness subsequent to the close of the merger on January 6, 2006.
International and OtherOur International operations serve retail and wholesale customers, including enterprise businesses, government entities and telecommu-nication carriers outside of the United States, primarily in Europe, the Middle East, Africa, the Asia Pacific region, Latin America and Canada. These operations provide telecommunications services, which include voice, data services, Internet and managed network services.
International and other revenue in 2008 increased by $160 million, or 5.0%, compared to 2007, reflecting strong growth in our Internet suite of products, specifically Private IP products, and the impact of favorable foreign currency exchange rates on services billed in local currencies. International and other revenue in 2007 increased by $113 million, or 3.6%, compared to 2006 as a result of higher revenue growth in our stra-tegic products, specifically IP services. This increase was partially offset by competitive rate compression and lower volumes with respect to our voice products.
Operating Expenses (dollars in millions)
Years Ended December 31, 2008 2007 2006
Cost of services and sales $ 24,274 $ 24,181 $ 23,806Selling, general and administrative expense 11,047 11,527 11,998Depreciation and amortization expense 9,031 8,927 9,309Total Operating Expenses $ 44,352 $ 44,635 $ 45,113
Cost of Services and SalesCost of services and sales includes costs directly attributable to a service or product, including salaries and wages, benefits, materials and sup-plies, contracted services, network access and transport costs, customer provisioning costs, computer systems support, costs to support our out-sourcing contracts and technical facilities, contributions to the universal service fund, and cost of products sold. Aggregate customer care costs, which include billing and service provisioning, are allocated between cost of services and sales and selling, general and administrative expense.
Cost of services and sales in 2008 increased by $93 million, or 0.4%, compared to 2007. These increases were primarily due to higher costs associated with our growth businesses, primarily FiOS services, including TV and Internet services, and IP services, partially offset by productivity improvement initiatives, headcount reductions and lower switched access lines in service as well as lower wholesale voice connections. The increase in cost of services and sales expense was also impacted by unfavorable foreign exchange rate changes, higher utility costs and the inclusion of the results of operations of a security services firm acquired on July 1, 2007.
Cost of services and sales in 2007 increased by $375 million, or 1.6%, com-pared to 2006. This increase was primarily due to higher costs associated with our growth businesses, annual wage increases and higher customer premise equipment costs, partially offset by productivity improvement initiatives, headcount reductions and lower switched access lines in ser-vice, as well as lower wholesale voice connections.
Selling, General and Administrative ExpenseSelling, general and administrative expense includes salaries, wages and benefits not directly attributable to a service or product, bad debt charges, taxes other than income, advertising and sales commission costs, customer billing, call center and information technology costs, pro-fessional service fees and rent for administrative space.
Selling, general and administrative expenses in 2008 decreased by $480 million or 4.2%, compared to 2007. This decrease was primarily due to declines in compensation expense, in part driven by headcount reduc-tions, cost reduction initiatives and lower bad debt costs, partially offset by the inclusion of the results of operations of a security services firm acquired on July 1, 2007.
Selling, general and administrative expenses in 2007 decreased by $471 million or 3.9%, compared to 2006. The decrease was primarily due to headcount reductions, cost reduction initiatives, as well as the impact of gains from real estate sales and lower bad debt costs, partially offset by higher advertising costs and the inclusion of the results of operations of the former MCI business subsequent to the close of the merger on January 6, 2006.
Management’s Discussion and Analysis ofFinancialConditionandResultsofOperations continued

23
Depreciation and Amortization ExpenseDepreciation and amortization expense in 2008 increased $104 million, or 1.2%, compared to 2007, mainly driven by growth in depreciable tele-phone plant and non-network software from additional capital spending, partially offset by lower rates of depreciation as a result of changes in the estimated useful lives of certain asset classes. Depreciation and amortiza-tion expense in 2007 decreased $382 million, or 4.1%, compared to 2006, mainly driven by lower rates of depreciation as a result of changes in the estimated useful lives of certain asset classes, partially offset by growth in depreciable telephone plant from increased capital spending.
Operating Income (dollars in millions)Years Ended December 31, 2008 2007 2006
Operating Income $ 3,862 $ 4,494 $ 4,391
Segment operating income in 2008 decreased by $632 million, or 14.1%, compared to 2007 and increased by $103 million, or 2.3% in 2007 com-pared to 2006, due to the impact of operating revenues and operating expenses described above. Non-recurring or non-operational items not included in Verizon Wireline’s segment income totaled $993 million, $726 million and $458 million in 2008, 2007 and 2006, respectively.
Non-recurring or non-operational items in 2008 primarily included sev-erance and severance-related costs, pension settlement losses, costs associated with continued merger integration initiatives, the results of operations spun-off during the first quarter of 2008 and the costs incurred in connection with the spin-off related to network, non-network software,andotheractivities(see“RecentDevelopments”).
Non-recurring or non-operational items in 2007 included costs associated with severance and other related charges, costs incurred related to net-work, non-network software, and other activities in connection with the spin-off of local exchange assets in Maine, New Hampshire and Vermont, as well as costs associated with merger integration initiatives, principally related to the acquisition of MCI and other items.
Non-recurring or non-operational items in 2006 included costs associ-ated with severance activity, pension settlement losses, Verizon Center relocation-related costs and merger integration costs. Merger integra-tion costs primarily included costs related to advertising and re-branding initiatives, facility exit costs, severance costs, labor and contractor costs related to information technology integration initiatives and employee retention expenses.
Other items
Facility and Employee-Related Items
During 2008, we recorded net pretax severance, pension and benefits charges of $950 million ($588 million after-tax, or $.21 per diluted share). This charge primarily included $586 million ($363 million after-tax) for workforce reductions in connection with the separation of approximately 8,600 employees and related charges; 3,500 of whom were separated in the second half of 2008, with the remaining reductions expected to occur in 2009, in accordance with SFAS No. 112, Employers’ Accounting for Postemployment Benefits. Also included are net pretax pension settle-ment losses of $364 million ($225 million after-tax) related to employees that received lump-sum distributions primarily resulting from our separa-tion plans. These charges were recorded in accordance with SFAS No. 88, Employers’ Accounting for Settlements and Curtailments of Defined Benefit Pension Plans and for Termination Benefits (SFAS No. 88), which requires that settlement losses be recorded once prescribed payment thresholds have been reached.
During the fourth quarter of 2007, we recorded charges of $772 million ($477 million after-tax, or $.16 per diluted share) primarily in connection with workforce reductions of 9,000 employees and related charges, 4,000 of whom were separated in the fourth quarter of 2007 with the remaining reductions occurring throughout 2008. In addition, we adjusted our actu-arial assumptions for severance to align with future expectations.
During 2006, we recorded net pretax severance, pension and benefits charges of $425 million ($258 million after-tax, or $.09 per diluted share). These charges included net pretax pension settlement losses of $56 mil-lion ($26 million after-tax) related to employees that received lump-sum distributions primarily resulting from our separation plans. These charges were recorded in accordance with SFAS No. 88. Also included are pretax charges of $369 million ($228 million after-tax), for employee severance and severance-related costs in connection with the involuntary separa-tion of approximately 4,100 employees.
During 2006, we recorded pretax charges of $184 million ($118 million after-tax, or $.04 per diluted share) in connection with the relocation of employeesandbusinessoperationstoVerizonCenterinBaskingRidge,New Jersey.
Merger Integration Costs
In 2008, 2007, and 2006, we recorded pretax charges of $172 million ($107 million after-tax, or $.03 per diluted share), $178 million ($112 million after-tax, or $.04 per diluted share) and $232 million ($146 million after-tax, or $.05 per diluted share), respectively, primarily related to the MCI acquisi-tion that were comprised mainly of systems integration activities.
Telephone Access Lines Spin-off
In 2008 and 2007, we recorded pretax charges of $103 million ($81 million after-tax, or $.03 per diluted share) and $84 million ($80 million after-tax, or $.03 per diluted share), respectively, for costs incurred related to network, non-network software, and other activities to enable the opera-tions in Maine, New Hampshire and Vermont to operate on a stand-alone basis subsequent to the spin-off of our telephone access line operations in those states, as well as professional advisory and legal fees in connec-tion with this transaction.
Investment Impairment Charges
During 2008, we recorded a pretax charge of $48 million ($31 million after-tax, or $.01 per diluted share) related to an other-than-temporary decline in the fair value of our investments in certain marketable securities.
International Taxes
In December 2007, Verizon received a net distribution from Vodafone Omnitel of approximately $2,100 million and received an additional $670 million net distribution in April 2008. During 2007, we recorded $610 million ($.21 per diluted share) of foreign and domestic taxes and expenses specifically relating to our share of Vodafone Omnitel’s distributable earnings.
Other
In 2006, we recorded pretax charges of $26 million ($16 million after-tax, or $.01 per diluted share) resulting from the extinguishment of debt assumed in connection with the MCI merger.
Management’s Discussion and Analysis ofFinancialConditionandResultsofOperations continued

24
COnsOlidated finanCial COnditiOn
(dollars in millions)Years Ended December 31, 2008 2007 2006
Cash Flows Provided By (Used In) Operating Activities: Continuing operations $ 26,620 $ 26,309 $ 23,030 Discontinued operations – (570) 1,076 Investing Activities: Continuing operations (31,579) (16,865) (17,422) Discontinued operations – 757 1,806 Financing activities: Continuing operations 13,588 (11,697) (5,752) Discontinued operations – – (279)Increase (Decrease) In Cash and Cash Equivalents $ 8,629 $ (2,066) $ 2,459
We use the net cash generated from our operations to fund network expansion and modernization, repay external financing, pay dividends, purchase Verizon common stock for treasury and invest in new busi-nesses. Additional external financing is obtained when necessary. While our current liabilities typically exceed current assets, our sources of funds, primarily from operations and, to the extent necessary, from readily avail-able external financing arrangements, are sufficient to meet ongoing operating and investing requirements. We expect that capital spending requirements will continue to be financed primarily through internally generated funds. Additional debt or equity financing may be needed to fund additional development activities or to maintain our capital struc-ture to ensure our financial flexibility.
Although conditions in the credit markets through December 31, 2008 did not have a significant impact on our ability to obtain financing, such conditions resulted in higher fixed interest rates on borrowings than those we have paid in recent years. The recent disruption in the global financial markets has also affected some of the financial institutions with which we do business. A continuing sustained decline in the stability of financial institutions could affect our access to financing. We completed $21.9 billion of new financing in 2008, including the issuance of $9.2 bil-lion of new notes during the fourth quarter of 2008. As of December 31, 2008, more than two-thirds in aggregate principal amount of our total debt portfolio consisted of fixed rate indebtedness (including the effect of all interest rate swap agreements on our debt portfolio). Furthermore, we have had, and continue to have, access to the commercial paper mar-kets, although we were required during a brief period of time in the third quarter of 2008 to pay interest rates on our commercial paper that were significantly higher than the rates we have paid in recent years. If the national or global economy or credit market conditions in general were to deteriorate further, it is possible that such changes could adversely affect our cash flows through increased interest costs or our ability to obtain external financing or to refinance our existing indebtedness.
Cash Flows Provided By (Used In) Operating Activities
Our primary source of funds continues to be cash generated from opera-tions. Net cash provided by operating activities – continuing operations in 2008 increased $0.3 billion, compared to 2007, primarily due to higher earnings, partially offset by lower dividends received from Vodafone Omnitel. The increase in Net cash provided by operating activities – con-tinuing operations in 2007, compared to 2006, was primarily due to the distributions from Vodafone Omnitel and CANTV, increased operating cash flows from Domestic Wireless and lower interest payments on out-standing debt, partially offset by changes in working capital.
The net changes in cash flow from operating activities – discontinued operations for the periods presented were primarily due to income taxes paid in 2007 related to the fourth quarter 2006 disposition of Verizon Dominicana, as well as the disposal of the discontinued operations in the fourth quarter of 2006.
Cash Flows Provided By (Used In) Investing Activities
Capital expenditures continue to be our primary use of cash flows from operations, as they facilitate the introduction of new products and ser-vices, enhance responsiveness to competitive challenges and increase the operating efficiency and productivity of our networks. Capital spending at Domestic Wireless represents our continuing effort to invest in this high growth business. We invested $6.5 billion in our Domestic Wireless business in 2008, compared to $6.5 billion and $6.6 billion in 2007 and 2006, respectively. We invested $9.8 billion in our Wireline busi-ness in 2008, compared to $11.0 billion and $10.3 billion in 2007 and 2006, respectively.
In 2008, we invested $15.9 billion in acquisitions and investments in businesses and wireless licenses. We invested $9.4 billion to acquire twenty-five 12 MHz licenses in the A block, seventy-seven 12 MHz licenses in the B Block and seven 22 MHz (nationwide, except Alaska) licenses in the C block resulting from participation in the FCC’s Auction 73.OnAugust7,2008,VerizonWirelesscompleteditsacquisitionofRuralCellular for cash consideration of $0.9 billion, net of cash acquired after an exchange transaction with another carrier to complete the required divestiture of certain markets. In connection with the Alltel transaction, Verizon Wireless purchased from third parties approximately $5.0 billion aggregate principal amount of debt obligations of certain subsidiaries of Alltel for approximately $4.8 billion plus accrued and unpaid interest. On January 9, 2009, Verizon Wireless paid approximately $5.9 billion for theequityofAlltel(see“RecentDevelopments”). In2007,wepaid$0.4billion, net of cash received, to acquire a network security business and $0.2 billion to purchase several wireless properties and licenses. In 2006, we invested $1.4 billion in acquisitions and investments in businesses, including $2.8 billion to acquire thirteen 20 MHz licenses in connection with the FCC Advanced Wireless Services auction, as well as the acquisi-tion of other wireless properties. This was offset by MCI’s cash balances of $2.4 billion we acquired at the date of the merger.
Our short-term investments include cash equivalents held in trust accounts for payment of employee benefits. In 2008, we decreased our annual trust funding to $0.1 billion, which is included in Short-term investments in the consolidated balance sheets. In 2007 and 2006, we invested $1.7 billion and $1.9 billion, respectively, in short-term invest-ments, primarily to pre-fund active employees’ health and welfare benefits. Proceeds from the sales of all short-term investments, principally for the payment of these benefits, were $1.8 billion, $1.9 billion and $2.2 billion in the years 2008, 2007 and 2006, respectively.
Other, net investing activities in 2008 primarily include cash proceeds of $0.3 billion from the sale of properties and sale of select non-strategic assets, a cash payment of $0.2 billion in connection with the settlement of foreign currency forward contracts and $0.1 billion receivable from a money market fund managed by a third party, which is in the process of being liquidated and returned to Verizon. Other, net investing activities in 2007 primarily included cash proceeds of $0.8 billion from property sales and sales of select non-strategic assets, as well as $0.5 billion from the disposition of our interest in CANTV. Other, net investing activities in 2006 primarily included cash proceeds of $0.3 billion from property sales.
In 2007, investing activities of discontinued operations primarily included gross proceeds of approximately $1.0 billion in connection with the sale
Management’s Discussion and Analysis ofFinancialConditionandResultsofOperations continued

25
ofourinvestmentinTELPRI.In2006,investingactivitiesofdiscontinuedoperations included net pretax cash proceeds of $2.0 billion in connec-tion with the sale of Verizon Dominicana.
Cash Flows Provided By (Used In) Financing Activities
During 2008, net cash provided by financing activities was $13.6 billion, compared with the net cash used in financing activities of $11.7 billion in 2007. Proceeds from borrowings during 2008 were approximately $24.0 billion. Cash flow used in financing activities primarily included net debt repayments of $4.1 billion, dividend payments of $5.0 billion, and pur-chases of Verizon common stock for treasury of $1.4 billion.
Our total debt increased by $20.8 billion in 2008. Verizon Communications issued $11.5 billion of fixed rate debt with varying maturities. Domestic Wireless issued $10.4 billion of debt for the purchase of Alltel’s debt obli-gationsacquiredinthesecondquarter,thepurchaseofRuralCellularandsubsequentrepaymentofRuralCellulardebt,andtoraisecashtofinancea portion of the purchase price of the Alltel acquisition which closed on January 9, 2009. Partially offsetting the increase in total debt, including an increase in commercial paper outstanding, was the repayment of $4.1 billion of term debt.
In November 2008, Verizon issued $2.0 billion of 8.75% notes due 2018 and $1.3 billion of 8.95% notes due 2039, which resulted in cash proceeds of $3.2 billion net of discount and issuance costs. In April 2008, Verizon issued $1.3 billion of 5.25% notes due 2013, $1.5 billion of 6.10% notes due 2018, and $1.3 billion of 6.90% notes due 2038, resulting in cash proceeds of $4.0 billion, net of discounts and issuance costs. In February 2008, Verizon issued $0.8 billion of 4.35% notes due 2013, $1.5 billion of 5.50% notes due 2018, and $1.8 billion of 6.40% notes due 2038, resulting in cash proceeds of $4.0 billion, net of discounts and issuance costs. In January 2008, Verizon utilized a $0.2 billion fixed rate vendor financing facility due 2010.
Verizon Wireless’s financing activities included:
• On December 19, 2008, Verizon Wireless and Verizon Wireless Capital LLC as the borrowers, entered into a $17.0 billion credit facility (Bridge Facility) in order to complete the acquisition of Alltel and repay certain of Alltel’s outstanding debt. On December 31, 2008, the Bridge Facility was reduced to $12.5 billion. On January 9, 2009, Verizon Wireless bor-rowed $12.4 billion under the Bridge Facility and the unused commit-ments under the Bridge Facility were terminated. The Bridge Facility has a maturity date of January 8, 2010. Interest on borrowings under the Bridge Facility is calculated based on the London Interbank Offered Rate(LIBOR)fortheapplicableperiod,thelevelofborrowingsonspeci-fied dates and a margin that is determined by reference to our long-termcreditratingissuedbyStandardandPoor’sRatingService(S&P).Ifthe aggregate outstanding principal amount under the Bridge Facility is greater than $6.0 billion on July 8, 2009 (the 180th day after the closing date of the Alltel acquisition), we are required to repay $3.0 billion on that date (less the amount of specified mandatory or optional prepay-ments that have been made as of that date). The remaining aggregate outstanding principal amount must be repaid on the maturity date. We expect to refinance or repay the borrowings under the Bridge Facility within the next 12 months by utilizing a combination of internally gen-erated free cash flows, net proceeds from the required disposition of assets in connection with the Alltel acquisition and new borrowings.
• In December 2008, Verizon Wireless obtained net proceeds of $2.4 billion from the issuance of €0.7 billion of 7.625% notes due 2011, €0.5 billion of 8.750% notes due 2015 and £0.6 billion of 8.875% notes due 2018. Concurrent with the borrowings, Verizon Wireless entered into
cross currency swaps primarily to exchange the proceeds from British Pound Sterling and Euros into U.S. dollars and fix its future interest and principal payments in U.S. dollars. As a result of these swaps, Verizon Wireless exchanged the aggregate principal amounts for cash proceeds of $2.4 billion, which were used to finance a portion of the purchase price of the Alltel acquisition on January 9, 2009.
• In November 2008, Verizon Wireless obtained proceeds of $3.5 billion, net of discounts and issuance costs, from the issuance in a private placement of $1.3 billion of 7.375% notes due November 2013 and $2.3 billion of 8.500% notes due November 2018.
• On September 30, 2008, Verizon Wireless and Verizon Wireless Capital LLC entered into a $4.4 billion Three-Year Term Loan Facility Agreement (Three-Year Term Facility) with Citibank, N.A., as Administrative Agent, with a maturity date of September 30, 2011. Verizon Wireless borrowed $4.4 billion under the Three-Year Term Facility in order to repay a por-tion of the 364-Day Credit Agreement as described below. Of the $4.4 billion, $0.4 billion must be repaid at the end of the first year, $2.0 bil-lion at the end of the second year, and $2.0 billion upon final maturity. Interest on borrowings under the Three-Year Term Facility is calculated basedontheLIBORrate for theapplicableperiodandamarginthatis determined by reference to the long-term credit rating of Verizon Wireless issued by S&P and Moody’s Investors Service (if Moody’s sub-sequently determines to provide a credit rating for the Three-Year Term Facility). Borrowings under the Three-Year Term Facility currently bear interest at a variable ratebasedon LIBORplus 100basis points.TheThree-Year Term Facility includes a requirement to maintain a certain leverage ratio.
• On June 5, 2008, Verizon Wireless entered into a $7.6 billion 364-Day Credit Agreement with Morgan Stanley Senior Funding Inc. as Administrative Agent, which included a $4.8 billion term facility and a $2.8 billion delayed draw facility. On June 10, 2008, Verizon Wireless borrowed $4.8 billion under the 364-Day Credit Agreement in order to purchase the Alltel debt obligations acquired in the second quarter and, during the third quarter, borrowed $2.8 billion under the delayed drawfacility tocomplete thepurchaseofRuralCellularandto repayRuralCellular’sdebtandpayfeesandexpensesincurredinconnectiontherewith. During 2008, $4.4 billion of the 364-Day Credit Agreement was repaid using proceeds from the Three-Year Term Loan Facility; the remainder of the borrowings under the 364-Day Credit Agreement was also repaid during 2008.
• On February 4, 2009, Verizon Wireless and Verizon Wireless Capital LLC co-issued in a private placement $3.5 billion of 5.55% notes due 2014 and $0.8 billion of 5.25% notes due 2012, resulting in cash proceeds of $4.2 billion, net of discounts and issuance costs. Verizon Wireless will use the net proceeds from the sale of these notes to repay a portion of the borrowings outstanding under the Bridge Facility described above.
As of December 31, 2008, we had current assets of $26.1 billion, including cash and cash equivalents of $9.8 billion and short-term investments of $0.5 billion. Our current liabilities of $25.9 billion included debt maturing within one year of $5.0 billion.
Historically, we fund our operations primarily with cash from operations, cash on hand, and access to the commercial paper markets. However, if the economic conditions should worsen or we do not maintain our cash flows from operations, we could see a negative impact on our liquidity in 2009. We believe we can meet our debt service requirements in the next twelve months as we expect to continue to generate free cash flow and maintain access to the commercial paper markets.
Management’s Discussion and Analysis ofFinancialConditionandResultsofOperations continued

S&Passignsan‘A’CorporateCreditRatingandan‘A-1’short-termdebtrating to Verizon Communications. In early June 2008 S&P revised its outlook on Verizon’s ratings to negative from stable following the announcement of the agreement to acquire Alltel. At the same time, S&P affirmedallVerizon’sratings,includingits‘A’CorporateCreditRating,‘A-1’short-termratingandthe‘A’CorporateCreditRatingonCellcoPartnership(d/b/a Verizon Wireless). In November 2008 S&P affirmed the ‘A’ Corporate CreditRatingwithanegativeoutlookonCellcoPartnershipandVerizonCommunications.
Moody’s Investors Service (Moody’s) assigns an ‘A3’ long-term debt rating and a ‘P-2’ short-term debt rating to Verizon Communications. In June2008Moody’splacedVerizonon“ReviewforPossibleDowngrade”following the announcement of the agreement to acquire Alltel. In October 2008 Moody’s concluded its review and revised the outlook on Verizon Communication’s ratings from stable to negative. The ‘P-2’ short-term rating was affirmed. In November 2008 Moody’s initiated a Cellco Partnership (d/b/a Verizon Wireless) long-term debt rating of ‘A2’ with a negative outlook.
FitchRatings(Fitch)assignsan‘A’long-termIssuerDefaultRatingandan‘F1’ short-term rating with stable outlook to Verizon Communications. In June2008FitchplacedVerizonCommunicationson“RatingWatchNegative” following the announcement of the Alltel acquisition. InNovember 2008 Fitch downgraded the long-term debt rating of Verizon to ‘A’ from ‘A+’ with a stable outlook, affirmed the ‘F1’ short-term rating andremovedVerizon’sratingsfrom“RatingWatchNegative”.Inthatsameaction, Fitch initiated a Cellco Partnership (d/b/a Verizon Wireless) rating at ‘A’ with a stable outlook.
While we do not anticipate a ratings downgrade, the three primary rating agencies have identified factors which they believe could result in a rat-ings downgrade for Verizon Communications and/or Cellco Partnership in the future including sustained leverage levels at Verizon Communications and/or Cellco Partnership resulting from: (i) diminished wireless oper-ating performance as a result of a weakening economy and competitive pressures; (ii) failure to achieve significant synergies in the Alltel integra-tion; (iii) accelerated wireline losses; or (iv) a material acquisition or sale of operations that causes a material deterioration in its credit metrics. A ratings downgrade would increase the cost of refinancing existing debt and might constrain Verizon Communications’ access to certain short-term debt markets.
Both the Verizon Wireless Three-Year Term Credit Facility and $12.5 billion BridgeFacilitycontaincovenantsincludingaLeverageRatioof3.25:1asdefined in the agreement. Each also contains events of default that are customary for companies maintaining an investment grade credit rating. As of December 31, 2008, we and our consolidated subsidiaries were in compliance with all of our debt covenants.
Common stock has been used from time to time to satisfy some of the funding requirements of employee and shareowner plans. On February 7, 2008, the Board of Directors replaced the current share buy back program with a new program for the repurchase of up to 100 million common shares terminating no later than the close of business on February 28, 2011. The Board also determined that no additional shares were to be purchased under the prior program. We repurchased $1.4 billion, $2.8 bil-lion and $1.7 billion of our common stock during 2008, 2007 and 2006, respectively.
As in prior periods, dividend payments were a significant use of cash flows from operations in 2008. We determine the appropriateness of the level of our dividend payments on a periodic basis by considering such fac-
As of December 31, 2008, we had approximately $5.6 billion of unused bank lines of credit consisting of a three-year committed facility that expires in September 2009. We also entered into a vendor provided credit facility that provided $0.2 billion of financing capacity. We have a shelf registration available for the issuance of up to $6.8 billion of additional unsecured debt or equity securities.
In addition to the repayments of the $7.6 billion 364-Day Credit Agreement, we made other debt repayments of approximately $4.1 billion in 2008, including $0.2 billion of 5.55% notes issued by Verizon Northwest Inc., $0.1 billion of 6.0% notes issued by Verizon South Inc., $0.3 billion of 6.0% notes issued by Verizon New York, $0.1 billion of 7.0% notes issued by Verizon California Inc., $0.3 billion of 6.9% notes issued by Verizon North Inc., $0.3 billion of 5.65% notes issued by Verizon North Inc., and $3.0 billion of other corporate borrowings, which included the repayment ofRuralCellular’sdebtand$1.0billionofVerizonCommunicationsInc.4.0% notes. As a result of the spin-off of our local exchange business and related activities in Maine, New Hampshire and Vermont, in March 2008, our net debt was reduced by approximately $1.4 billion.
Our total debt was reduced by $5.2 billion in 2007. We repaid approxi-mately $1.7 billion of Wireline debt, including the early repayment of previously guaranteed $0.3 billion 7.0% debentures issued by Verizon South Inc. and $0.5 billion 7.0% debentures issued by Verizon New England Inc., as well as approximately $1.6 billion of other borrowings. Also, we redeemed $1.6 billion principal of our outstanding floating rate notes, which were called on January 8, 2007, and the $0.5 billion 7.9% debentures issued by GTE Corporation. Partially offsetting the reduction in total debt were cash proceeds of $3.4 billion in connection with fixed and floating rate debt issued during 2007.
Cash of $1.9 billion was used to reduce our debt in 2006. We repaid $6.8 billion of Wireline debt, including premiums associated with the retire-ment of $5.7 billion of aggregate principal amount of long-term debt assumed in connection with the MCI merger. The Wireline repayments also included the early retirement/prepayment of $0.7 billion of long-term debt and $0.2 billion of other long-term debt at maturity. We repaid approximately $2.5 billion of Domestic Wireless 5.375% fixed rate notes that matured on December 15, 2006. Also, we redeemed the $1.4 bil-lion accreted principal of our remaining zero-coupon convertible notes and retired $0.5 billion of other corporate long-term debt at maturity. These repayments were partially offset by our issuance of long-term debt resulting in cash proceeds of approximately $4.0 billion, net of discounts, issuance costs and the receipt of cash proceeds related to hedges on the interest rate of an anticipated financing. In connection with the spin-off of our domestic print and Internet yellow pages directories business, we received net cash proceeds of approximately $2.0 billion and retired debt in the aggregate principal amount of approximately $7.1 billion.
Our ratio of debt to debt combined with shareowners’ equity was 55.5% at December 31, 2008 compared to 38.1% at December 31, 2007.
The amount of cash that we need to service our debt substantially increased with the acquisition of Alltel. Our ability to make payments on our debt will depend largely upon our cash balances and future operating performance. While we anticipate the challenging credit environment to continue in 2009, we do not expect this to have a material impact on our ability to obtain financing due to our investment grade ratings which we expect to maintain. The debt securities of Verizon Communications and its subsidiaries continue to be accorded high ratings by the three primary rating agencies.
26
Management’s Discussion and Analysis ofFinancialConditionandResultsofOperations continued

Contributions to our other postretirement benefit plans generally relate to payments for benefits on an as-incurred basis since the other postre-tirement benefit plans do not have funding requirements similar to the pension plans. We contributed $1,227 million, $1,048 million and $1,099 million to our other postretirement benefit plans in 2008, 2007 and 2006, respectively. Contributions to our other postretirement benefit plans are estimated to be approximately $1,770 million in 2009 and $1,890 million in 2010.
RefertoNote1intheconsolidatedfinancialstatementsforadiscussionof the adoption of SFAS No. 158, Employers’ Accounting for Defined Benefit Pension and Other Postretirement Plans—an amendment of FASB Statements No. 87, 88, 106, and 132(R), which was effective December 31, 2006.
Leasing Arrangements
We are the lessor in leveraged and direct financing lease agreements for commercial aircraft and power generating facilities, which comprise the majority of the portfolio along with telecommunications equipment, real estate property, and other equipment. These leases have remaining terms up to 42 years as of December 31, 2008. Minimum lease payments receiv-able represent unpaid rentals, less principal and interest on third-party nonrecourse debt relating to leveraged lease transactions. Since we have no general liability for this debt, which holds a senior security interest in the leased equipment and rentals, the related principal and interest have been offset against the minimum lease payments receivable in accordance with GAAP. All recourse debt is reflected in our consolidated balance sheets.
tors as long-term growth opportunities, internal cash requirements and the expectations of our shareowners. During the third quarter of 2008, Verizon’s Board of Directors increased the Company’s quarterly dividend payments 7.0% to $.460 per share from $.430 per share in 2007, with a goal of moving to an annual dividend increase model. In the third quarter of 2007, we increased our dividend payments 6.2% to $.430 per share from $.405 per share in the first two quarters of 2007.
Increase (Decrease) In Cash and Cash Equivalents
Our Cash and cash equivalents at December 31, 2008 totaled $9.8 bil-lion, an $8.6 billion increase compared to Cash and cash equivalents at December 31, 2007. Our Cash and cash equivalents at December 31, 2007 totaled $1.2 billion, a $2.1 billion decrease compared to Cash and cash equivalents at December 31, 2006.
Employee Benefit Plan Funded Status and Contributions
We operate numerous qualified and nonqualified pension plans and other postretirement benefit plans. These plans primarily relate to our domestic business units. We contributed $332 million, $612 million and $451 mil-lion in 2008, 2007 and 2006, respectively, to our qualified pension plans. We also contributed $155 million, $125 million and $117 million to our nonqualified pension plans in 2008, 2007 and 2006, respectively.
Based on the funded status of the plans at December 31, 2008, we antici-pate making qualified pension trust contributions of $300 million in 2009. Our estimate of required qualified pension trust contributions for 2010 is approximately $800 million. The estimated contribution in 2010 is based on a range of $600 million to $900 million which depends primarily upon asset returns and interest rates in 2009. Nonqualified pension contribu-tions are estimated to be approximately $120 million for 2009 and $130 million for 2010, respectively.
27
Management’s Discussion and Analysis ofFinancialConditionandResultsofOperations continued
Off Balance Sheet Arrangements and Contractual Obligations
Contractual Obligations and Commercial CommitmentsThe following table provides a summary of our contractual obligations and commercial commitments at December 31, 2008. Additional detail about these items is included in the notes to the consolidated financial statements.
(dollars in millions)Payments Due By Period
Contractual Obligations TotalLess than
1 year 1-3 years 3-5 yearsMore than
5 years
Long-term debt(1) $ 50,075 $ 3,443 $ 10,533 $ 9,854 $ 26,245Capital lease obligations (see Note 9) 390 63 132 90 105Total long-term debt, including current maturities 50,465 3,506 10,665 9,944 26,350Interest on long-term debt(1) 36,426 3,080 5,786 4,430 23,130Operating leases (see Note 9) 7,302 1,620 2,378 1,309 1,995Purchase obligations (see Note 20) 737 435 237 55 10Income tax audit settlements(2) 97 97 – – –Other long-term liabilities(3) 4,950 2,160 2,790 – –Total contractual obligations $ 99,977 $ 10,898 $ 21,856 $ 15,738 $ 51,485
(1)Long-termdebtincludesa$4,440millionThree-YearTermFacilityAgreementwhichcurrentlybearsinterestbasedonLIBORplus100basispoints(seeNote10).(2) Income tax audit settlements includes gross unrecognized tax benefits of $40 million as determined under Financial Accounting Standards Board (FASB) Interpretation No. 48, Accounting for
Uncertainty in Income Taxes (FIN 48) and related gross interest of $57 million. We are not able to make a reliable estimate of when the balance of $2,582 million of unrecognized tax benefits and related interest and penalties will be settled with the respective taxing authorities until issues or examinations are further developed (see Note 16).
(3) Other long-term liabilities include estimated qualified pension plan contributions of $300 million in 2009 and $800 million in 2010. The estimated contribution in 2010 is based on a range of $600 million to $900 million which depends primarily upon asset returns and interest rates in 2009 (see Note 15).

Alltel Interest Rate SwapsInconnectionwiththeAlltelacquisition(see“RecentDevelopments”),Verizon Wireless acquired seven interest rate swap agreements with a notional value of $9.5 billion that pay fixed and receive variable rates basedonthree-monthandone-monthLIBORwithmaturitiesrangingfrom 2009 to 2013. Until they are terminated, the swap agreements are guaranteed by Verizon Wireless. Upon closing of the acquisition, these swap agreements will be recorded at fair value as of the closing date as part of the purchase price allocation and subsequent changes in the fair value will be recorded in earnings. Based on recent trends in the credit markets, changes in interest rates may have a significant impact on our earnings as long as the contracts are outstanding. We estimate that a 10-basis point change in rates can result in an approximately $30 mil-lion impact on pretax earnings. We anticipate that these contracts will be settled during the first half of 2009.
Foreign Currency Translation
The functional currency of our foreign operations is generally the local cur-rency. For these foreign entities, we translate income statement amounts at average exchange rates for the period, and we translate assets and liabilities at end-of-period exchange rates. We record these translation adjustments in Accumulated other comprehensive loss, a separate com-ponent of Shareowners’ Investment, in our consolidated balance sheets. We report exchange gains and losses on intercompany foreign currency transactions of a long-term nature in Accumulated other comprehen-sive loss. Other exchange gains and losses are reported in income. At December 31, 2008, our primary translation exposure was to the British Pound Sterling, the Euro and the Australian Dollar.
During 2008, we entered into cross currency swaps designated as cash flow hedges to exchange the net proceeds from the December 18, 2008 Verizon Wireless and Verizon Wireless Capital LLC offering from British Pound Sterling and Euros into U.S. dollars, to fix our future interest and principal payments in U.S. dollars as well as mitigate the impact of for-eign currency transaction gains or losses. We record these contracts at fair value and any gains or losses on these contracts will, over time, offset the gains or losses on the underlying debt obligations.
During 2007, we entered into foreign currency forward contracts to hedge a portion of our net investment in Vodafone Omnitel. Changes in fair value of these contracts due to Euro exchange rate fluctuations are recognized in Accumulated other comprehensive loss and partially offset the impact of foreign currency changes on the value of our net investment. During 2008, our positions in these foreign currency forward contracts were settled. As of December 31, 2008, Accumulated other comprehensive loss includes unrecognized losses of approximately $166 million ($108 million after-tax) related to these hedge contracts, which along with the unrealized foreign currency translation balance on the investment hedged, remain in Accumulated other comprehensive loss until the investment is sold.
Guarantees
In connection with the execution of agreements for the sale of businesses and investments, Verizon ordinarily provides representations and warran-ties to the purchasers pertaining to a variety of nonfinancial matters, such as ownership of the securities being sold, as well as financial losses.
As of December 31, 2008, letters of credit totaling approximately $200 million were executed in the normal course of business, which support several financing arrangements and payment obligations to third parties.
market risk
We are exposed to various types of market risk in the normal course of business, including the impact of interest rate changes, foreign currency exchange rate fluctuations, changes in equity investment and commodity prices and changes in corporate tax rates. We employ risk management strategies which may include the use of a variety of derivatives, including cross currency swaps, foreign currency forwards and collars, equity options, interest rate and commodity swap agreements and interest rate locks. We do not hold derivatives for trading purposes.
It is our general policy to enter into interest rate, foreign currency and other derivative transactions only to the extent necessary to achieve our desired objectives in limiting our exposure to the various market risks. Our objectives include maintaining a mix of fixed and variable rate debt to lower borrowing costs within reasonable risk parameters and to protect against earnings and cash flow volatility resulting from changes in market conditions. We do not hedge our market risk exposure in a manner that would completely eliminate the effect of changes in interest rates and foreign exchange rates on our earnings. We do not expect that our net income, liquidity and cash flows will be materially affected by these risk management strategies.
Interest Rate Risk
The table that follows summarizes the fair values of our long-term debt and interest rate and cross currency swap derivatives as of December 31, 2008 and 2007. The table also provides a sensitivity analysis of the esti-mated fair values of these financial instruments assuming 100-basis-point upward and downward shifts in the yield curve. Our sensitivity analysis does not include the fair values of our commercial paper and bank loans, if any, because they are not significantly affected by changes in market interest rates.
(dollars in millions)
At December 31, 2008 Fair Value
Fair Valueassuming
+100 basispoint shift
Fair Valueassuming
–100 basispoint shift
Long-term debt and related derivatives $ 51,258 $ 48,465 $ 54,444
At December 31, 2007
Long-term debt and related derivatives $ 31,930 $ 30,154 $ 33,957
28
Management’s Discussion and Analysis ofFinancialConditionandResultsofOperations continued

• Our current and deferred income taxes, and associated valuation allowances, are impacted by events and transactions arising in the normal course of business as well as in connection with the adop-tion of new accounting standards, acquisitions of businesses and non-recurring items. Assessment of the appropriate amount and clas-sification of income taxes is dependent on several factors, including estimates of the timing and realization of deferred income tax assets and the timing of income tax payments. We account for tax benefits taken or expected to be taken in our tax returns in accordance with FIN 48, which requires the use of a two-step approach for recognizing and measuring tax benefits taken or expected to be taken in a tax return and disclosures regarding uncertainties in income tax positions. Actual collections and payments may materially differ from these estimates as a result of changes in tax laws as well as unanticipated future transac-tions impacting related income tax balances.
• Verizon’s plant, property and equipment balance represents a sig-nificant component of our consolidated assets. Depreciation expense on Verizon’s local telephone operations is principally based on the composite group remaining life method and straight-line composite rates, which provides for the recognition of the cost of the remaining net investment in telephone plant, less anticipated net salvage value, over the remaining asset lives. We depreciate other plant, property and equipment generally on a straight-line basis over the estimated useful life of the assets. Changes in the remaining useful lives of assets as a result of technological change or other changes in circumstances, including competitive factors in the markets where we operate, can have a significant impact on asset balances and depreciation expense.
Recent Accounting Pronouncements
InDecember2008, theFASB issuedFSPFASNo.132 (R)-1,Employers’ Disclosures about Postretirement Benefit Plan Assets (FSP132 (R)-1). FSP132(R)-1requiresVerizon,asplansponsor,toprovideimproveddisclo-sures about plan assets, including categories of plan assets, nature and amount of concentrations of risk and disclosure about fair value mea-surements of plan assets, similar to those required by SFAS No. 157, Fair Value Measurements.FAS132(R)-1iseffectiveforfiscalyearsendingafterDecember15,2009.WedonotexpectthattheadoptionofFSP132(R)-1will have a significant impact on our consolidated financial statements.
In April 2008, the FASB issued FSP No. FAS 142-3, Determination of the Useful Life of Intangible Assets (FSP 142-3). FSP 142-3 removes the require-ment under SFAS No. 142, Goodwill and Other Intangible Assets to consider whether an intangible asset can be renewed without substantial cost or material modifications to the existing terms and conditions, and replaces it with a requirement that an entity consider its own historical experience in renewing similar arrangements, or a consideration of market partici-pant assumptions in the absence of historical experience. FSP 142-3 also requires entities to disclose information that enables users of financial statements to assess the extent to which the expected future cash flows associated with the asset are affected by the entity’s intent and/or ability to renew or extend the arrangement. We were required to adopt FSP 142-3 effective January 1, 2009 on a prospective basis. The adoption of FSP 142-3 on January 1, 2009 did not have an impact on our consolidated financial statements.
CritiCal aCCOunting estimates and reCent aCCOunting prOnOunCements
Critical Accounting Estimates
A summary of the critical accounting estimates used in preparing our financial statements is as follows:
• Goodwill and Other intangible assets, net are a significant compo-nent of our consolidated assets. At December 31, 2008, goodwill at Wireline and Domestic Wireless was $4,738 million and $1,297 million, respectively. As required by SFAS No. 142, Goodwill and Other Intangible Assets (SFAS No. 142), goodwill is periodically evaluated for impair-ment. The evaluation of goodwill for impairment is primarily based on a discounted cash flow model that includes estimates of future cash flows. There is inherent subjectivity involved in estimating future cash flows, which can have a material impact on the amount of any potential impairment. Wireless licenses of $61,974 million represent the largest component of our intangible assets. Our wireless licenses are indefinite-lived intangible assets, and as required by SFAS No. 142, are not amortized but are periodically evaluated for impairment. Any impairment loss would be determined by comparing the aggregated fair value of the wireless licenses with the aggregated carrying value. The direct value approach is used to determine fair value by estimating future cash flows.
• We maintain benefit plans for most of our employees, including pen-sion and other postretirement benefit plans. At December 31, 2008, in the aggregate, pension plan benefit obligations exceeded the fair value of pension plan assets which will result in higher future pension plan expense. Other postretirement benefit plans have larger benefit obligations than plan assets, resulting in expense. Significant benefit plan assumptions, including the discount rate used, the long-term rate of return on plan assets and health care trend rates are periodically updated and impact the amount of benefit plan income, expense, assets and obligations. A sensitivity analysis of the impact of changes in these assumptions on the benefit obligations and expense (income) recorded as of December 31, 2008 and for the year then ended per-taining to Verizon’s pension and postretirement benefit plans is pro-vided in the table below.
(dollars in millions)
Percentage point
change
Benefit obligation increase
(decrease) at December 31, 2008
Expense increase(decrease) for the
year ended December 31, 2008
Pension plans discount rate* + 0.50 $ (1,281) $ (29)
- 0.50 1,399 41Long-term rate of return on pension plan assets + 1.00 – (375)
- 1.00 – 375Postretirement plans discount rate* + 0.50 (1,401) (99)
- 0.50 1,547 110Long-term rate of return on postretirement plan assets + 1.00 – (39)
- 1.00 – 39
Health care trend rates + 1.00 2,891 460- 1.00 (2,399) (318)
*The discount rate assumptions at December 31, 2008 were determined from hypothetical double A yield curves represented by a series of annualized individual discount rates devel-oped using actual bonds available in the market. From the yield curves a single equivalent discount rate is determined at which the future stream of benefit payments could be settled. Each bond issue included in developing the yield curves is required to have a rating of double A or better by a nationally recognized rating agency and be non-callable with at least $150 million par outstanding.
29
Management’s Discussion and Analysis ofFinancialConditionandResultsofOperations continued

In March 2008, the FASB issued SFAS No. 161, Disclosures about Derivative Instruments and Hedging Activities – an amendment of FASB Statement No. 133, (SFAS No. 161). This statement requires additional disclosures for derivative instruments and hedging activities that include how and why an entity uses derivatives, how these instruments and the related hedged items are accounted for under SFAS No. 133 and related interpretations, and how derivative instruments and related hedged items affect the entity’s financial position, results of operations and cash flows. SFAS No. 161 is effective for financial statements issued for fiscal years and interim periods beginning after November 15, 2008. The adoption of SFAS No. 161 on January 1, 2009 did not have an impact on our consolidated financial statements.
InDecember2007,theFASBissuedSFASNo.141(R),Business Combinations, (SFASNo.141(R)),toreplaceSFASNo.141,Business Combinations. SFAS No. 141(R)requirestheuseoftheacquisitionmethodofaccounting,definesthe acquirer, establishes the acquisition date and broadens the scope to all transactions and other events in which one entity obtains control over one or more other businesses. This statement is effective for busi-ness combinations or transactions entered into for fiscal years beginning onorafterDecember15,2008.UpontheadoptionofSFASNo.141(R)we will be required to expense certain transaction costs and related fees associated with business combinations that were previously capitalized. This will result in additional expenses being recognized relating to the 2009 closing of the Alltel transaction. In addition, with the adoption of SFASNo.141(R)changestovaluationallowancesfordeferredincometaxassets and adjustments to unrecognized tax benefits generally will be recognized as adjustments to income tax expense rather than goodwill.
In December 2007, the FASB issued SFAS No. 160, Noncontrolling Interests in Consolidated Financial Statements – an amendment of ARB No. 51, (SFAS No. 160). SFAS No. 160 establishes accounting and reporting standards for the noncontrolling interest in a subsidiary and for the retained interest and gain or loss when a subsidiary is deconsolidated. This statement is effective for financial statements issued for fiscal years beginning on or after December 15, 2008 which will be applied prospectively, except for the presentation and disclosure requirements which will be applied retrospectively for all periods presented. Upon the initial adoption of this statement we will change the classification and presentation of Noncontrolling Interest in our financial statements, which we currently refer to as minority interest. Additionally, we conduct certain business operations in certain markets through non-wholly owned entities. Any changes in these ownership interests may be required to be measured at fair value and recognized as a gain or loss, if any, in earnings. SFAS No. 160 will also result in a lower effective income tax rate for the Company due to the inclusion of income attributable to noncontrolling interest in income before the provision for income taxes. However, the income tax provision will not be adjusted as a result of SFAS No. 160.
RefertoNote1intheconsolidatedfinancialstatementsforadiscussionof the accounting pronouncements adopted during 2008.
Other faCtOrs that may affeCt future results
Recent Developments
Alltel CorporationOn June 5, 2008, Verizon Wireless entered into an agreement and plan of merger with Alltel and its controlling stockholder, Atlantis Holdings LLC, an affiliate of private investment firms TPG Capital and GS Capital Partners, to acquire 100% of the equity of Alltel in an all-cash merger. After satisfying all closing conditions, including receiving the required regulatory approvals, Verizon Wireless closed the acquisition on January 9, 2009 and paid approximately $5.9 billion for the equity of Alltel. Immediately prior to the closing, the Alltel debt associated with the transaction, net of cash, was approximately $22.2 billion. Alltel provides wireless voice and advanced data services to residential and business customers in 34 states.
In connection with this transaction, on June 10, 2008, Verizon Wireless purchased from third parties approximately $5.0 billion aggregate prin-cipal amount of debt obligations of certain subsidiaries of Alltel for approximately $4.8 billion plus accrued and unpaid interest. These debt obligations are included in the amount of Alltel net debt, referenced above, immediately prior to the closing referenced above.
Rural Cellular CorporationOn August 7, 2008, Verizon Wireless acquired 100% of the outstanding commonstockandredeemedallofthepreferredstockofRuralCellularinacashtransaction.RuralCellularwasawirelesscommunicationsserviceprovideroperatingunderthetradenameof“Unicel,”focusingprimarilyon rural markets in the United States. Verizon Wireless believes that the acquisition will further enhance its network coverage in markets adjacent to its existing service areas and will enable Verizon Wireless to achieve operational benefits through realizing synergies in reduced roaming and other operating expenses. Under the terms of the acquisition agreement, VerizonWirelesspaidRuralCellular’scommonshareholders$728millionincash($45pershare).Additionally,allclassesofRuralCellular’spreferredshareholders received cash in the aggregate amount of $571 million.
AspartofitsapprovalprocessfortheRuralCellularacquisition,theFCCand Department of Justice (DOJ) required the divestiture of six oper-atingmarkets, including all of Rural Cellular’s operations inVermontand New York as well as its operations in Okanogan and Ferry, WA (the Divestiture Markets). On December 22, 2008, Verizon Wireless com-pleted an exchange transaction with AT&T. Pursuant to the terms of the exchange agreement, as amended, AT&T received the assets relating to the Divestiture Markets and a cellular license for part of the Madison, KY market. In exchange, Verizon Wireless received cellular operating markets in Madison and Mason, KY and 10 MHz PCS licenses in Las Vegas, NV, Buffalo, NY, Erie, PA, Sunbury-Shamokin, PA and Youngstown, OH. Verizon Wireless also received AT&T’s minority interests in three entities in which Verizon Wireless holds interests plus a cash payment. The preliminary aggregate value of properties exchanged was approximately $500 mil-lion. In addition, subject to FCC approval, Verizon Wireless will acquire PCS licenses in Franklin, NY (except Franklin county) and the entire state of Vermont from AT&T in a separate cash transaction that is expected to close in the first half of 2009.
Telephone Access Lines Spin-offOn January 16, 2007, we announced a definitive agreement with FairPoint Communications, Inc. (FairPoint) providing for Verizon to establish a sepa-rate entity for its local exchange and related business assets in Maine, New Hampshire and Vermont, spin-off that new entity into a newly formed company, known as Northern New England Spinco Inc. (Spinco), to Verizon’s shareowners, and immediately merge it with and into
30
Management’s Discussion and Analysis ofFinancialConditionandResultsofOperations continued

Regulatory and Competitive Trends
Competition and Regulation Technological, regulatory and market changes have provided Verizon both new opportunities and challenges. These changes have allowed Verizon to offer new types of services in an increasingly competitive market. At the same time, they have allowed other service providers to broaden the scope of their own competitive offerings. Current and potential competitors for network services include other telephone companies, cable companies, wireless service providers, foreign telecom-munications providers, satellite providers, electric utilities, Internet service providers, providers of VoIP services, and other companies that offer net-work services using a variety of technologies. Many of these companies have a strong market presence, brand recognition and existing customer relationships, all of which contribute to intensifying competition and may affect our future revenue growth. Many of our competitors also remain subject to fewer regulatory constraints than Verizon.
We are unable to predict definitively the impact that the ongoing changes in the telecommunications industry will ultimately have on our business, results of operations or financial condition. The financial impact will depend on several factors, including the timing, extent and success of competition in our markets, the timing and outcome of various regula-tory proceedings and any appeals, and the timing, extent and success of our pursuit of new opportunities.
FCC RegulationThe FCC has jurisdiction over our interstate telecommunications ser-vices and other matters for which the FCC has jurisdiction under the Communications Act of 1934, as amended (Communications Act). The Communications Act generally provides that we may not charge unjust or unreasonable rates, or engage in unreasonable discrimination when we are providing services as a common carrier, and regulates some of the rates, terms and conditions under which we provide certain services. The FCC also has adopted regulations governing various aspects of our busi-ness including: (i) use and disclosure of customer proprietary network information; (ii) telemarketing; (iii) assignment of telephone numbers to customers; (iv) provision to law enforcement agencies of the capability to obtain call identifying information and call content information from calls pursuant to lawful process; (v) accessibility of services and equipment to individuals with disabilities if readily achievable; (vi) interconnection with thenetworksofothercarriers;and(vii)customers’abilitytokeep(or“port”)their telephone numbers when switching to another carrier. In addition, we pay various fees to support other FCC programs, such as the universal service program discussed below. Changes to these mandates, or the adoption of additional mandates, could require us to make changes to our operations or otherwise increase our costs of compliance.
BroadbandThe FCC has adopted a series of orders that recognize the competitive nature of the broadband market and impose lesser regulatory require-ments on broadband services and facilities than apply to narrowband or traditional telephone services. With respect to facilities, the FCC has determined that certain unbundling requirements that apply to narrow-band facilities do not apply to broadband facilities such as fiber to the premise loops and packet switches. With respect to services, the FCC has concluded that broadband Internet access services offered by telephone companies and their affiliates qualify as largely deregulated information services. The same order also concluded that telephone companies may offer the underlying broadband transmission services that are used as an input to Internet access services through private carriage arrangements on negotiated commercial terms. The order was upheld on appeal. In addi-tion, a Verizon petition asking the FCC to forbear from applying common
31
FairPoint. On March 31, 2008, we completed the spin-off of the shares of Spinco to Verizon shareowners and the merger of Spinco with FairPoint, resulting in Verizon shareowners collectively owning approximately 60 percent of FairPoint common stock. FairPoint issued approximately 53.8 million shares of FairPoint common stock to Verizon shareowners in the merger, and Verizon shareowners received one share of FairPoint common stock for every 53.0245 shares of Verizon common stock they owned as of March 7, 2008. FairPoint paid cash in lieu of any fraction of a share of FairPoint common stock. As a result of the spin-off, our net debt was reduced by approximately $1.4 billion. Both the spin-off and merger qualify as tax-free transactions, except for the cash payments for fractional shares which are generally taxable.
Environmental MattersDuring 2003, under a government-approved plan, remediation com-menced at the site of a former Sylvania facility in Hicksville, New York thatprocessednuclear fuelrods inthe1950sand1960s.Remediationbeyond original expectations proved to be necessary and a reassessment of the anticipated remediation costs was conducted. A reassessment of costs related to remediation efforts at several other former facilities was also undertaken. In September 2005, the Army Corps of Engineers (ACE) accepted theHicksville site into theFormerlyUtilizedSitesRemedialAction Program. This may result in the ACE performing some or all of the remediation effort for the Hicksville site with a corresponding decrease in costs to Verizon. To the extent that the ACE assumes responsibility for remedial work at the Hicksville site, an adjustment to a reserve previously established for the remediation may be made. Adjustments to the reserve may also be necessary based upon actual conditions discovered during the remediation at any of the sites requiring remediation.
New York Recovery Funding In August 2002, President Bush signed the Supplemental Appropriations bill that included $5.5 billion in New York recovery funding. Of that amount, approximately $750 million was allocated to cover utility res-toration and infrastructure rebuilding as a result of the September 11th terrorist attacks on lower Manhattan. These funds will be distributed through the Lower Manhattan Development Corporation and Empire State Development Corporation (ESDC) following an application and audit process. As of September 2004, we had applied for reimbursement of approximately $266 million under Category One and in 2004 and 2005 we applied for reimbursement of an additional $139 million of Category Two losses. Category One funding relates to Emergency and Temporary ServiceResponsewhileCategoryTwofundingisforpermanentrestora-tion and infrastructure improvement. According to the plan, permanent restoration is reimbursed up to 75% of the loss. On November 3, 2005, we received the results of preliminary audit findings disallowing all but $49.9 million of our $266 million of Category One application. On December 8, 2005, we provided a detailed rebuttal to the preliminary audit findings. We received a copy of the final audit report for Verizon’s Category One applications largely confirming the preliminary audit findings and, on January 4, 2007, we filed an appeal. That appeal is pending. On November 9, 2007, Verizon submitted an additional Category Two application for approximately $16 million. ESDC has approved approximately $17 million in advances to Verizon on its Category Two applications. Based on the progress of these audits, Verizon recorded a portion of these advances to income in June 2008. The Category Two audits remain pending.
Management’s Discussion and Analysis ofFinancialConditionandResultsofOperations continued

carrier regulation to certain broadband services sold primarily to larger business customers when those services are not used for Internet access was deemed granted by operation of law when the FCC did not deny the petition by the statutory deadline. The relief has been upheld on appeal, but is subject to a continuing challenge before the FCC.
VideoThe FCC has a body of rules that apply to cable operators under Title VI of the Communications Act of 1934, and these rules also generally apply to telephone companies that provide cable services over their networks. In addition, companies that provide cable service over a cable system generally must obtain a local cable franchise. The FCC has interpreted the Cable Act to limit the franchise fees and other requirements that local franchise authorities may impose on cable operators and has found that some prior practices of franchise authorities constituted an unreasonable refusal to award a competitive local franchise under the requirements of federal law. This order has been upheld on appeal.
Interstate Access Charges and Intercarrier CompensationThe current framework for interstate access rates was established in the Coalition for Affordable Local and Long Distance Services (CALLS) plan which the FCC adopted on May 31, 2000. The CALLS plan has three main components. First, it establishes portable interstate access universal service support of $650 million for the industry that replaces implicit sup-port previously embedded in interstate access charges. Second, the plan simplifies the patchwork of common line charges into one subscriber line charge (SLC) and provides for de-averaging of the SLC by zones and class of customers. Third, the plan set into place a mechanism to transition to a set target of $.0055 per minute for switched access services. Once that target rate is reached, local exchange carriers are no longer required to make further annual price cap reductions to their switched access prices. As a result of tariff adjustments which became effective in July 2003, vir-tually all of our switched access lines reached the $.0055 benchmark.
The FCC currently is conducting a broad rulemaking proceeding to con-sider new rules governing intercarrier compensation including, but not limited to, access charges, compensation for Internet traffic and recip-rocal compensation for local traffic. The FCC has sought comments about intercarrier compensation in general and requested input on a number of specific reform proposals. On November 5, 2008, the FCC issued an order on remand relating to intercarrier compensation for dial-up Internet-bound traffic. In April 2001, the FCC had found that this traffic is not subject to reciprocal compensation under Section 251(b)(5) of the Telecommunications Act of 1996. Instead, in that order, the FCC estab-lished federal rates per minute for this traffic that declined from $.0015 to $.0007 over a three-year period, and required incumbent local exchange carriers to offer to both bill and pay reciprocal compensation for local traffic at the same rate as they are required to pay on Internet-bound traffic. The U.S. Court of Appeals for the D.C. Circuit rejected part of the FCC’s rationale, but declined to vacate the order while it is on remand. On July 8, 2008, the D.C. Circuit issued an order requiring the FCC to issue its order on remand by November 5, 2008. The FCC’s November 2008 order provided a new rationale to support the compensation regime the FCC had announced in April 2001. The November 2008 order is now on appeal to the U.S. Court of Appeals for the D.C. Circuit. Disputes also remain pending in a number of forums relating to the appropriate com-pensation for Internet-bound traffic during previous periods under the terms of our interconnection agreements with other carriers.
32
Management’s Discussion and Analysis ofFinancialConditionandResultsofOperations continued
The FCC is also conducting a rulemaking proceeding to address the regulation of services that use Internet protocol. The issues raised in the rulemaking as well as in several petitions currently pending before the FCC include whether, and under what circumstances, access charges should apply to voice or other Internet protocol services and the scope of federal and state commission authority over these services. The FCC previously has held that one provider’s peer-to-peer Internet protocol service that does not use the public switched network is an interstate information service and is not subject to access charges, while a service that utilizes Internet protocol for only one intermediate part of a call’s transmission is a telecommunications service that is subject to access charges. The FCC also declared the services offered by one provider of a voice over Internet protocol service to be jurisdictionally interstate and stated that its conclusion would apply to other services with similar char-acteristics. This order was affirmed on appeal.
The FCC also has adopted rules for special access services that provide for pricing flexibility and ultimately the removal of services from price regu-lation when prescribed competitive thresholds are met. More than half of special access revenues are now removed from price regulation. The FCC currently has a rulemaking proceeding underway to update the public record concerning its pricing flexibility rules and to determine whether any changes to those rules are warranted.
Universal ServiceThe FCC also has a body of rules implementing the universal service provisions of the Telecommunications Act of 1996, including rules gov-erning support to rural and non-rural high-cost areas, support for low income subscribers and support for schools, libraries and rural health care. The FCC’s current rules for support to high-cost areas served by larger“non-rural”localtelephonecompanieswerepreviouslyremandedby U.S. Court of Appeals for the Tenth Circuit, which had found that the FCC had not adequately justified these rules. The FCC has initiated a rulemaking proceeding in response to the court’s remand, but its rules remain in effect pending the results of the rulemaking. On April 29, 2008, the FCC adopted a cap on the amount of support competitive carriers (including all wireless carriers) may receive. That cap is the subject of a pending appeal. The FCC is considering additional changes to the high-cost portion of the universal service fund but has not to date taken industry-wide action. However, in its November 4, 2008 order approving Verizon Wireless’s acquisition of Alltel, the FCC required Verizon Wireless to phase out the high-cost support the merged company receives from the universal service fund by 20 percent during the first year following completion of the acquisition and by an additional 20 percent for each of the following three years, after which no support will be provided. In addition, the FCC is considering other changes to the rules governing contributions to, and disbursements from, the fund. Any change in the current rules could result in a change in the contribution that local tele-phone companies, wireless carriers or others must make and that would have to be collected from customers, or in the amounts that these pro-viders receive from the fund.
Unbundling of Network ElementsUnder Section 251 of the Telecommunications Act of 1996, incum-bent local exchange carriers are required to provide competing carriers with access to components of their network on an unbundled basis, known as UNEs, where certain statutory standards are satisfied. The Telecommunications Act of 1996 also adopted a cost-based pricing stan-dard for these UNEs, which the FCC interpreted as allowing it to impose apricingstandardknownas“totalelementlongrunincrementalcost”or“TELRIC.”TheFCC’s rulesdefiningtheunbundlednetworkelementsthatmustbemade available atTELRICpriceshavebeenoverturnedon multiple occasions by the courts. In its most recent order issued in

Wireless’s acquisition of Alltel, the FCC adopted conditions that impose additional requirements on Verizon Wireless in its provision of Enhanced 911 services and roaming services.
The Communications Act imposes restrictions on foreign ownership of U.S. wireless systems. The FCC has approved the interest that Vodafone Group Plc holds, through various of its subsidiaries, in Verizon Wireless. The FCC may need to approve any increase in Vodafone’s interest or the acquisition of an ownership interest by other foreign entities. In addition, as part of the FCC’s approval of Vodafone’s ownership interest, Verizon Wireless, Verizon and Vodafone entered into an agreement with the U.S. Department of Defense, Department of Justice and Federal Bureau of Investigation which imposes national security and law enforce-ment-related obligations on the ways in which Verizon Wireless stores information and otherwise conducts its business.
Verizon Wireless anticipates that it will need additional spectrum to meet future demand. It can meet spectrum needs by purchasing licenses or leasing spectrum from other licensees, or by acquiring new spectrum licenses from the FCC. Under the Communications Act, before Verizon Wireless can acquire a license from another licensee in order to expand its coverage or its spectrum capacity in a particular area, it must file an application with the FCC, and the FCC can grant the application only after a period for public notice and comment. This review process can delay acquisition of spectrum needed to expand services. The Communications Act also requires the FCC to award new licenses for most commercial wire-less services through a competitive bidding process in which spectrum is awarded to bidders in an auction. Verizon Wireless has participated in spectrum auctions to acquire licenses for radio spectrum in various bands. Most recently, it participated in the FCC’s auction of spectrum in the 700 MHz band. This spectrum is currently used for UHF television operations. By law those operations were to have ceased no later than February 17, 2009. However, a new law has been enacted that extends this date until June 12, 2009. We do not believe that this extension will have a material adverse effect on our testing of LTE technology or our planned deploy-ment of a 4G wireless broadband network using LTE.
On November 26, 2008, the FCC granted Verizon Wireless 109 licenses in this band for which it was the winning bidder. The FCC also adopted service rules that will impose costs on licensees that acquire the 700 MHz band spectrum, including minimum coverage mandates by specific dates during the license terms, and, for approximately one-third of the spectrum,“openaccess”requirements,whichgenerallyrequirelicenseesof that spectrum to allow customers to use devices and applications of their choice, subject to certain limits. Seven of the licenses that Verizon Wireless acquired in the 700 MHz auction, which in the aggregate cover the United States except for Alaska, are subject to these requirements. The open access requirements are the subject of a pending appeal in which Verizon Wireless has intervened. The timing of future auctions may not match Verizon Wireless’s needs, and the company may not be able to secure the spectrum in the amounts and/or in the markets it seeks through any future auction.
The FCC is also conducting several proceedings to explore making additional spectrum available for licensed and/or unlicensed use. These proceedings could increase radio interference to Verizon Wireless’s opera-tions from other spectrum users and could impact the ways in which it uses spectrum, the capacity of that spectrum to carry traffic, and the value of that spectrum.
33
response to these court decisions, the FCC eliminated the requirement to unbundle mass market local switching on a nationwide basis, and estab-lished criteria for determining whether high-capacity loops, transport or dark fiber transport must be unbundled in individual wire centers. The FCC also eliminated the obligation to provide dark fiber loops and found that there is no obligation to provide UNEs exclusively for wireless or long distance service. The decision was upheld on appeal.
As noted above, the FCC has concluded that the requirement under Section 251 of the Telecommunications Act of 1996 to provide unbun-dlednetworkelementsatTELRICpricesgenerallydoesnotapplywithrespect to broadband facilities, such as fiber to the premises loops, the packet-switched capabilities of hybrid loops and packet switching. The FCC also has held that any separate unbundling obligations that may be imposed by Section 271 of the Telecommunications Act of 1996 do not apply to these same facilities. Those decisions were upheld on appeal.
Wireless ServicesThe FCC regulates the licensing, construction, operation, acquisition and transfer of wireless communications systems, including the systems that Verizon Wireless operates, pursuant to the Communications Act, other legislation, and the FCC’s rules. The FCC and Congress continuously con-sider changes to these laws and rules. Adoption of new laws or rules may raise the cost of providing service or require modification of Verizon Wireless’s business plans or operations.
To use the radio frequency spectrum, wireless communications systems must be licensed by the FCC to operate the wireless network and mobile devices in assigned spectrum segments. Verizon Wireless holds FCC licenses to operate in several different radio services, including the cel-lular radiotelephone service, personal communications service, wireless communications service, and point-to-point radio service. The technical and service rules, the specific radio frequencies and amounts of spec-trum we hold, and the sizes of the geographic areas we are authorized to operate in, vary for each of these services. However, all of the licenses Verizon Wireless holds allow it to use spectrum to provide a wide range of mobile and fixed communications services, including both voice and data services, and Verizon Wireless operates a seamless network that uti-lizes those licenses to provide services to customers. Because the FCC issues licenses for only a fixed time, generally 10 years, Verizon Wireless must periodically seek renewal of those licenses. Although the FCC has routinely renewed all of Verizon Wireless’s licenses that have come up for renewal to date, challenges could be brought against the licenses in the future. If a wireless license were revoked or not renewed upon expira-tion, Verizon Wireless would not be permitted to provide services on the licensed spectrum in the area covered by that license.
The FCC has also imposed specific mandates on carriers that operate wireless communications systems, which increase Verizon Wireless’s costs. These mandates include requirements that Verizon Wireless: (i) meet specific construction and geographic coverage requirements during the license term; (ii) meet technical operating standards that, among other things, limit the radio frequency radiation from mobile devices andantennas;(iii)deploy“Enhanced911”wirelessservicesthatprovidethe wireless caller’s number, location and other information to a state or local public safety agency that handles 911 calls; (iv) provide roaming services to other wireless service providers; and (v) comply with regula-tions for the construction of transmitters and towers that, among other things, restrict siting of towers in environmentally sensitive locations and in places where the towers would affect a site listed or eligible for listing ontheNationalRegisterofHistoricPlaces.Changestothesemandatescould require Verizon Wireless to make changes to operations or increase its costs of compliance. In its November 4, 2008 order approving Verizon
Management’s Discussion and Analysis ofFinancialConditionandResultsofOperations continued

State Regulation and Local ApprovalsTelephone OperationsState public utility commissions regulate our telephone operations with respect to certain telecommunications intrastate rates and services and other matters. Our competitive local exchange carrier and long distance operations are generally classified as nondominant and lightly regu-lated the same as other similarly situated carriers. Our incumbent local exchange operations are generally classified as dominant. These latter operations predominantly are subject to alternative forms of regulation (AFORs) in thevariousstates,althoughthey remainsubject to rateofreturn regulation in a few states. Arizona, Illinois, Nevada, Oregon and Washington are rate of return regulated with various levels of pricing flexibility for competitive services. California, Connecticut, Delaware, the District of Columbia, Florida, Indiana, Maryland, Michigan, Massachusetts, NewJersey,NewYork,NorthCarolina,Ohio,Pennsylvania,RhodeIsland,South Carolina, Texas, Virginia, West Virginia and Wisconsin are under AFORswithvarious levelsofpricing flexibility,detariffing,andservicequality standards.Noneof theAFORs includeearnings regulation. InIdaho, Verizon has made the election under a statutory amendment into a deregulatory regime that phases out all price regulation.
VideoCompanies that provide cable service over a cable system are typically subject to state and/or local cable television rules and regulations. As noted above, cable operators generally must obtain a local cable fran-chise from each local unit of government prior to providing cable service in that local area. Some states have recently enacted legislation that enables cable operators to apply for, and obtain, a single cable franchise at the state, rather than local, level. To date, Verizon has applied for and received state-issued franchises in California, Indiana, Florida, New Jersey, Texas and the unincorporated areas of Delaware. We also have obtained authorizationfromthestatecommissioninRhodeIslandtoprovidecableservice in certain areas in that state, have obtained required state com-mission approvals for our local franchises in New York, and will need to obtain additional state commission approvals in these states to provide cable service in additional areas. Virginia law provides us the option of entering a given franchise area using state standards if local franchise negotiations are unsuccessful.
Wireless ServicesThe rapid growth of the wireless industry has led to an increase in efforts by some state legislatures and state public utility commissions to regu-late the industry in ways that may impose additional costs on Verizon Wireless. The Communications Act generally preempts regulation by state and local governments of the entry of, or the rates charged by, wire-less carriers. Although a state may petition the FCC to allow it to impose rate regulation, no state has done so. In addition, the Communications Act does not prohibit the states from regulating the other “terms and conditions”ofwirelessservice.Whilenumerousstatecommissionsdonot currently have jurisdiction over wireless services, state legislatures may decide to grant them such jurisdiction, and those commissions that already have authority to impose regulations on wireless carriers may adopt new rules.
State efforts to regulate wireless services have included proposals to regulate customer billing, termination of service, trial periods for service, advertising, network outages, the use of handsets while driving, and reporting requirements for system outages and the availability of broad-band wireless services. Over the past several years, only a few states have imposed regulation in one or more of these areas, and in 2006 a federal appellate court struck down one such state statute, but Verizon Wireless expects these efforts to continue. Some states also impose their own uni-versal service support regimes on wireless and other telecommunications carriers, and other states are considering whether to create such regimes.
34
Verizon Wireless (as well as AT&T and Sprint-Nextel) is a party to an Assurance of Voluntary Compliance (AVC) with 33 State Attorneys General. The AVC, which generally reflected Verizon Wireless’s practices at the time it was entered into in July 2004, obligates the company to dis-close certain rates and terms during a sales transaction, to provide maps depicting coverage, and to comply with various requirements regarding advertising, billing, and other practices.
At the state and local level, wireless facilities are subject to zoning and land use regulation. Under the Communications Act, neither state nor local governments may categorically prohibit the construction of wireless facilities in any community or take actions, such as indefinite moratoria, which have the effect of prohibiting service. Nonetheless, securing state and local government approvals for new tower sites has been and is likely to continue to be a difficult, lengthy and expensive process. Finally, state and local governments continue to impose new or higher fees and taxes on wireless carriers.
Management’s Discussion and Analysis ofFinancialConditionandResultsofOperations continued

35
CautiOnary statement COnCerning fOrward-lOOking statements
In this annual report on Form 10-K we have made forward-looking state-ments. These statements are based on our estimates and assumptions and are subject to risks and uncertainties. Forward-looking statements include the information concerning our possible or assumed future results of operations. Forward-looking statements also include those pre-cededorfollowedbythewords“anticipates,”“believes,”“estimates,”“hopes”or similar expressions. For those statements, we claim the protection of the safe harbor for forward-looking statements contained in the Private SecuritiesLitigationReformActof1995.
The following important factors, along with those discussed elsewhere in this annual report, could affect future results and could cause those results to differ materially from those expressed in the forward-looking statements:
• the effects of adverse conditions in the U.S. and international economies;
• the effects of competition in our markets; • materially adverse changes in labor matters, including workforce levels
and labor negotiations, and any resulting financial and/or operational impact, in the markets served by us or by companies in which we have substantial investments;
• the effects of material changes in available technology; • any disruption of our suppliers’ provisioning of critical products or
services;• significant increases in benefit plan costs or lower investment returns
on plan assets;• the impact of natural or man-made disasters or existing or future litiga-
tion and any resulting financial impact not covered by insurance;• technology substitution;• an adverse change in the ratings afforded our debt securities by
nationally accredited ratings organizations or adverse conditions in the credit markets impacting the cost, including interest rates, and/or availability of financing;
• any changes in the regulatory environments in which we operate, including any loss of or inability to renew wireless licenses, and the final results of federal and state regulatory proceedings and judicial review of those results;
• the timing, scope and financial impact of our deployment of fiber-to-the-premises broadband technology;
• changes in our accounting assumptions that regulatory agencies, including the SEC, may require or that result from changes in the accounting rules or their application, which could result in an impact on earnings;
• our ability to successfully integrate Alltel Corporation into Verizon Wireless’s business and achieve anticipated benefits of the acquisition; and
• the inability to implement our business strategies.
Management’s Discussion and Analysis ofFinancialConditionandResultsofOperations continued

36
v e r i zo n co m m u n i c at i o n s i n c . a n d s u b s i d i a r i e s
We, the management of Verizon Communications Inc., are responsible for establishing and maintaining adequate internal control over financial reporting of the company. Management has evaluated internal control over financial reporting of the company using the criteria for effective internal control established in Internal Control – Integrated Framework issued by the Committee of Sponsoring Organizations of the Treadway Commission.
Management has assessed the effectiveness of the company’s internal control over financial reporting as of December 31, 2008. Based on this assessment, we believe that the internal control over financial reporting of the company is effective as of December 31, 2008. In connection with this assessment, there were no material weaknesses in the company’s internal control over financial reporting identified by management.
The company’s financial statements included in this annual report have been audited by Ernst & Young LLP, independent registered public accounting firm. Ernst & Young LLP has also provided an attestation report on the company’s internal control over financial reporting.
Ivan G. SeidenbergChairman and Chief Executive Officer
Doreen A. TobenExecutive Vice President and Chief Financial Officer
Thomas A. BartlettSenior Vice President and Controller
Report of Management on Internal Control Over Financial Reporting
Report of Independent Registered Public Accounting Firm on Internal Control Over Financial Reporting
To The Board of Directors and Shareowners of Verizon Communications Inc.:
We have audited Verizon Communications Inc. and subsidiaries’ (Verizon) internal control over financial reporting as of December 31, 2008, based on criteria established in Internal Control – Integrated Framework issued by the Committee of Sponsoring Organizations of the Treadway Commission (the COSO criteria). Verizon’s management is responsible for maintaining effective internal control over financial reporting, and for its assessment of the effectiveness of internal control over financial reporting included in the accompanying Report of Management on Internal Control Over Financial Reporting. Our responsibility is to express an opinion on the company’s internal control over financial reporting based on our audit.
We conducted our audit in accordance with the standards of the Public Company Accounting Oversight Board (United States). Those standards require that we plan and perform the audit to obtain reasonable assur-ance about whether effective internal control over financial reporting was maintained in all material respects. Our audit included obtaining an understanding of internal control over financial reporting, assessing the risk that a material weakness exists, testing and evaluating the design and operating effectiveness of internal control based on the assessed risk, and performing such other procedures as we considered necessary in the circumstances. We believe that our audit provides a reasonable basis for our opinion.
A company’s internal control over financial reporting is a process designed to provide reasonable assurance regarding the reliability of financial reporting and the preparation of financial statements for external pur-poses in accordance with generally accepted accounting principles. A company’s internal control over financial reporting includes those poli-cies and procedures that (1) pertain to the maintenance of records that, in reasonable detail, accurately and fairly reflect the transactions and dispositions of the assets of the company; (2) provide reasonable assur-ance that transactions are recorded as necessary to permit preparation of financial statements in accordance with generally accepted accounting principles, and that receipts and expenditures of the company are being made only in accordance with authorizations of management and direc-tors of the company; and (3) provide reasonable assurance regarding prevention or timely detection of unauthorized acquisition, use, or dis-position of the company’s assets that could have a material effect on the financial statements.

37
To The Board of Directors and Shareowners of Verizon Communications Inc.:
We have audited the accompanying consolidated balance sheets of Verizon Communications Inc. and subsidiaries (Verizon) as of December 31, 2008 and 2007, and the related consolidated statements of income, cash flows and changes in shareowners’ investment for each of the three years in the period ended December 31, 2008. These financial statements are the responsibility of Verizon’s management. Our responsibility is to express an opinion on these financial statements based on our audits.
We conducted our audits in accordance with the standards of the Public Company Accounting Oversight Board (United States). Those stan-dards require that we plan and perform the audit to obtain reasonable assurance about whether the financial statements are free of material misstatement. An audit includes examining, on a test basis, evidence supporting the amounts and disclosures in the financial statements. An audit also includes assessing the accounting principles used and signifi-cant estimates made by management, as well as evaluating the overall financial statement presentation. We believe that our audits provide a reasonable basis for our opinion.
In our opinion, the financial statements referred to above present fairly, in all material respects, the consolidated financial position of Verizon at December 31, 2008 and 2007, and the consolidated results of its operations and its cash flows for each of the three years in the period ended December 31, 2008, in conformity with U.S. generally accepted accounting principles.
As discussed in Note 1 to the financial statements, Verizon changed its methods of accounting for uncertainty in income taxes and for leveraged lease transactions effective January 1, 2007, stock-based compensation effective January 1, 2006 and pension and other post-retirement obliga-tions effective December 31, 2006.
We also have audited, in accordance with the standards of the Public Company Accounting Oversight Board (United States), Verizon’s internal control over financial reporting as of December 31, 2008, based on criteria established in Internal Control–Integrated Framework issued by the Committee of Sponsoring Organizations of the Treadway Commission and our report dated February 20, 2009 expressed an unqualified opinion thereon.
Ernst & Young LLPNew York, New York
February 20, 2009
Because of its inherent limitations, internal control over financial reporting may not prevent or detect misstatements. Also, projections of any evalua-tion of effectiveness to future periods are subject to the risk that controls may become inadequate because of changes in conditions, or that the degree of compliance with the policies or procedures may deteriorate.
In our opinion, Verizon maintained, in all material respects, effective internal control over financial reporting as of December 31, 2008, based on the COSO criteria.
We also have audited, in accordance with the standards of the Public Company Accounting Oversight Board (United States), the consolidated balance sheets of Verizon as of December 31, 2008 and 2007, and the related consolidated statements of income, cash flows and changes in shareowners’ investment for each of the three years in the period ended December 31, 2008 of Verizon and our report dated February 20, 2009 expressed an unqualified opinion thereon.
Ernst & Young LLPNew York, New York
February 20, 2009
Report of Independent Registered Public Accounting Firm on Financial Statements

38
v e r i zo n co m m u n i c at i o n s i n c . a n d s u b s i d i a r i e s
Consolidated Statements of Income
(dollars in millions, except per share amounts)
Years Ended December 31, 2008 2007 2006
Operating Revenues $ 97,354 $ 93,469 $ 88,182
Operating Expenses Cost of services and sales (exclusive of items shown below) 39,007 37,547 35,309 Selling, general and administrative expense 26,898 25,967 24,955 Depreciation and amortization expense 14,565 14,377 14,545Total Operating Expenses 80,470 77,891 74,809
Operating Income 16,884 15,578 13,373Equity in earnings of unconsolidated businesses 567 585 773Other income and (expense), net 282 211 395Interest expense (1,819) (1,829) (2,349)Minority interest (6,155) (5,053) (4,038)Income Before Provision for Income Taxes, Discontinued Operations, Extraordinary Item and Cumulative Effect of Accounting Change 9,759 9,492 8,154Provision for income taxes (3,331) (3,982) (2,674)Income Before Discontinued Operations, Extraordinary Item and Cumulative Effect of Accounting Change 6,428 5,510 5,480Income from discontinued operations, net of tax – 142 759Extraordinary item, net of tax – (131) –Cumulative effect of accounting change, net of tax – – (42)Net Income $ 6,428 $ 5,521 $ 6,197
Basic Earnings Per Common Share(1)
Income before discontinued operations, extraordinary item and cumulative effect of accounting change $ 2.26 $ 1.90 $ 1.88Income from discontinued operations, net of tax – .05 .26Extraordinary item, net of tax – (.05) –Cumulative effect of accounting change, net of tax – – (.01)Net Income $ 2.26 $ 1.91 $ 2.13Weighted-average shares outstanding (in millions) 2,849 2,898 2,912
Diluted Earnings Per Common Share(1)
Income before discontinued operations, extraordinary item and cumulative effect of accounting change $ 2.26 $ 1.90 $ 1.88Income from discontinued operations, net of tax – .05 .26Extraordinary item, net of tax – (.05) –Cumulative effect of accounting change, net of tax – – (.01)Net Income $ 2.26 $ 1.90 $ 2.12Weighted-average shares outstanding (in millions) 2,850 2,902 2,938
(1) Total per share amounts may not add due to rounding.
See Notes to Consolidated Financial Statements.

39
Consolidated Balance Sheets
v e r i zo n co m m u n i c at i o n s i n c . a n d s u b s i d i a r i e s
(dollars in millions, except per share amounts)
At December 31, 2008 2007
AssetsCurrent assets Cash and cash equivalents $ 9,782 $ 1,153 Short-term investments 509 2,244 Accounts receivable, net of allowances of $941 and $1,025 11,703 11,736 Inventories 2,092 1,729 Prepaid expenses and other 1,989 1,836Total current assets 26,075 18,698
Plant, property and equipment 215,605 213,994 Less accumulated depreciation 129,059 128,700
86,546 85,294Investments in unconsolidated businesses 3,393 3,372Wireless licenses 61,974 50,796Goodwill 6,035 5,245Other intangible assets, net 5,199 4,988Other investments 4,781 –Other assets 8,349 18,566Total assets $ 202,352 $ 186,959
Liabilities and Shareowners’ InvestmentCurrent liabilities Debt maturing within one year $ 4,993 $ 2,954 Accounts payable and accrued liabilities 13,814 14,462 Other 7,099 7,325Total current liabilities 25,906 24,741
Long-term debt 46,959 28,203Employee benefit obligations 32,512 29,960Deferred income taxes 11,769 14,784Other liabilities 6,301 6,402
Minority interest 37,199 32,288
Shareowners’ investment Series preferred stock ($.10 par value; none issued) – – Common stock ($.10 par value; 2,967,610,119 and 2,967,610,119 shares issued) 297 297 Contributed capital 40,291 40,316 Reinvested earnings 19,250 17,884 Accumulated other comprehensive loss (13,372) (4,506) Common stock in treasury, at cost (4,839) (3,489) Deferred compensation-employee stock ownership plans and other 79 79Total shareowners’ investment 41,706 50,581Total liabilities and shareowners’ investment $ 202,352 $ 186,959
See Notes to Consolidated Financial Statements.

40
v e r i zo n co m m u n i c at i o n s i n c . a n d s u b s i d i a r i e s
Consolidated Statements of Cash Flows
(dollars in millions)
Years Ended December 31, 2008 2007 2006
Cash Flows from Operating ActivitiesNet Income $ 6,428 $ 5,521 $ 6,197Adjustments to reconcile net income to net cash provided by operating activities – continuing operations: Depreciation and amortization expense 14,565 14,377 14,545 Loss on sale of discontinued operations – – 541 Employee retirement benefits 1,955 1,720 1,923 Deferred income taxes 2,183 408 (252) Provision for uncollectible accounts 1,085 1,047 1,034 Equity in earnings of unconsolidated businesses, net of dividends received 212 1,986 (731) Extraordinary item, net of tax – 131 – Cumulative effect of accounting change, net of tax – – 42 Changes in current assets and liabilities, net of effects from acquisition/disposition of businesses: Accounts receivable (1,085) (1,931) (1,312) Inventories (188) (255) 8 Other assets (59) (140) 52 Accounts payable and accrued liabilities (1,701) (567) (383) Other, net 3,225 4,012 1,366Net cash provided by operating activities – continuing operations 26,620 26,309 23,030Net cash provided by (used in) operating activities – discontinued operations – (570) 1,076Net cash provided by operating activities 26,620 25,739 24,106
Cash Flows from Investing ActivitiesCapital expenditures (including capitalized software) (17,238) (17,538) (17,101)Acquisitions of licenses, investments and businesses, net of cash acquired (15,904) (763) (1,422)Net change in short-term investments 1,677 169 290Other, net (114) 1,267 811Net cash used in investing activities – continuing operations (31,579) (16,865) (17,422)Net cash provided by investing activities – discontinued operations – 757 1,806Net cash used in investing activities (31,579) (16,108) (15,616)
Cash Flows from Financing ActivitiesProceeds from long-term borrowings 21,598 3,402 3,983Repayments of long-term borrowings and capital lease obligations (4,146) (5,503) (11,233)Increase (decrease) in short-term obligations, excluding current maturities 2,389 (3,252) 7,944Dividends paid (4,994) (4,773) (4,719)Proceeds from sale of common stock 16 1,274 174Purchase of common stock for treasury (1,368) (2,843) (1,700)Other, net 93 (2) (201)Net cash provided by (used in) financing activities – continuing operations 13,588 (11,697) (5,752)Net cash used in financing activities – discontinued operations – – (279)Net cash provided by (used in) financing activities 13,588 (11,697) (6,031)
Increase (decrease) in cash and cash equivalents 8,629 (2,066) 2,459Cash and cash equivalents, beginning of year 1,153 3,219 760Cash and cash equivalents, end of year $ 9,782 $ 1,153 $ 3,219
See Notes to Consolidated Financial Statements.

Consolidated Statements of Changes in Shareowners’ Investment
41
(dollars in millions, except per share amounts, and shares in thousands)
Years Ended December 31, 2008 2007 2006Shares Amount Shares Amount Shares Amount
Common StockBalance at beginning of year 2,967,610 $ 297 2,967,652 $ 297 2,774,865 $ 277Shares issued–MCI/Price acquisitions – – (42) – 192,787 20Balance at end of year 2,967,610 297 2,967,610 297 2,967,652 297
Contributed CapitalBalance at beginning of year 40,316 40,124 25,369Shares issued-employee and shareowner plans – 58 (1)Shares issued-MCI/Price acquisitions – – 6,010Domestic print and Internet yellow pages directories business spin-off – – 8,695Other (25) 134 51Balance at end of year 40,291 40,316 40,124
Reinvested EarningsBalance at beginning of year 17,884 17,324 15,905Adoption of tax accounting standards (See Note 1) – (134) –Adjusted balance at beginning of year 17,884 17,190 15,905Net income 6,428 5,521 6,197Dividends declared ($1.78, $1.67 and $1.62 per share) (5,062) (4,830) (4,781)Other – 3 3Balance at end of year 19,250 17,884 17,324
Accumulated Other Comprehensive LossBalance at beginning of year (4,506) (7,530) (1,783)Spin-off of local exchange businesses in Maine, New Hampshire and Vermont (see Note 3) 44 – –Adjusted balance at beginning of year (4,462) (7,530) (1,783)Foreign currency translation adjustments (231) 838 1,196Unrealized gains (losses) on marketable securities (97) (4) 54Unrealized gains (losses) on cash flow hedges (40) 1 14Defined benefit pension and postretirement plans (8,542) 1,948 –Minimum pension liability adjustment – – 526Other – 241 (128)Other comprehensive income (loss) (8,910) 3,024 1,662Adoption of pension and postretirement benefit accounting standard (See Note 1) – – (7,409)Balance at end of year (13,372) (4,506) (7,530)
Treasury StockBalance at beginning of year (90,786) (3,489) (56,147) (1,871) (11,456) (353)Shares purchased (36,779) (1,368) (68,063) (2,843) (50,066) (1,700)Shares distributed Employee plans 468 18 33,411 1,224 5,355 181 Shareowner plans 7 – 13 1 20 1 Balance at end of year (127,090) (4,839) (90,786) (3,489) (56,147) (1,871)
Deferred Compensation–ESOPs and OtherBalance at beginning of year 79 191 265Amortization – (112) (74)Other – – –Balance at end of year 79 79 191Total Shareowners’ Investment $ 41,706 $ 50,581 $ 48,535
Comprehensive IncomeNet income $ 6,428 $ 5,521 $ 6,197Other comprehensive income (loss) per above (8,910) 3,024 1,662Total Comprehensive Income (Loss) $ (2,482) $ 8,545 $ 7,859
See Notes to Consolidated Financial Statements.
v e r i zo n co m m u n i c at i o n s i n c . a n d s u b s i d i a r i e s

42
Notes to Consolidated Financial Statements
NOTE 1
DESCRIPTION OF BUSINESS AND SUMMARY OF SIGNIFICANT ACCOUNTING POLICIES
Description of BusinessVerizon Communications Inc., (Verizon or the Company) is one of the world’s leading providers of communications services. We have two reportable segments, Domestic Wireless and Wireline, which we operate and manage as strategic business units and organize by products and services. For further information concerning our business segments, see Note 17.
Verizon’s Domestic Wireless segment, operating as Verizon Wireless, pro-vides wireless voice and data products and other value-added services and equipment across the United States (U.S.) using one of the most extensive and reliable wireless networks. Verizon Wireless continues to expand our wireless data, messaging and multi-media offerings at broadband speeds for both consumer and business customers.
Our Wireline segment provides communications services, including voice, broadband video and data, network access, nationwide long-dis-tance and other communications products and services, and also owns and operates one of the most expansive end-to-end global Internet Protocol (IP) networks. We continue to deploy advanced broadband network technology, with our fiber-to-the-premises network, operated under the FiOS service mark, creating a platform with sufficient band-width and capabilities to meet customers’ current and future needs. FiOS allows us to offer our customers a wide array of broadband services, including advanced data and video offerings. Our IP network includes over 485,000 route miles of fiber optic cable and provides access to over 150 countries across six continents, enabling us to provide next-generation IP network products and information technology services to medium and large businesses and government customers worldwide.
Consolidation The method of accounting applied to investments, whether consoli-dated, equity or cost, involves an evaluation of all significant terms of the investments that explicitly grant or suggest evidence of control or influence over the operations of the investee. The consolidated financial statements include our controlled subsidiaries. Investments in businesses which we do not control, but have the ability to exercise significant influence over operating and financial policies, are accounted for using the equity method. Investments in which we do not have the ability to exercise significant influence over operating and financial policies are accounted for under the cost method. Equity and cost method invest-ments are included in Investments in unconsolidated businesses in our consolidated balance sheets. Certain of our cost method investments are classified as available-for-sale securities and adjusted to fair value pursuant to the Financial Accounting Standards Board (FASB) Statement of Financial Accounting Standards (SFAS) No. 115, Accounting for Certain Investments in Debt and Equity Securities (SFAS No. 115).
All significant intercompany accounts and transactions have been eliminated.
We have reclassified prior year amounts to conform to the current year presentation.
Use of EstimatesWe prepare our financial statements using U.S. generally accepted accounting principles (GAAP), which require management to make esti-mates and assumptions that affect reported amounts and disclosures. Actual results could differ from those estimates.
Examples of significant estimates include: the allowance for doubtful accounts, the recoverability of plant, property and equipment, the recoverability of intangible assets and other long-lived assets, unbilled revenues, fair values of financial instruments, unrecognized tax benefits, valuation allowances on tax assets, accrued expenses, equity in income of unconsolidated entities, pension and postretirement benefit assump-tions, contingencies and allocation of purchase prices in connection with business combinations.
Revenue RecognitionDomestic WirelessOur Domestic Wireless segment earns revenue by providing access to and usage of our network, which includes voice and data revenue. In general, access revenue is billed one month in advance and recognized when earned. Access revenue and usage revenue are recognized when service is rendered. Equipment sales revenue associated with the sale of wireless handsets and accessories is recognized when the products are delivered to and accepted by the customer, as this is considered to be a separate earnings process from the sale of wireless services. Customer activation fees are considered additional consideration, and to the extent that handsets are sold to customers at a discount, these fees are recorded as equipment sales revenue at the time of customer acceptance. For agreements involving the resale of third-party services in which we are considered the primary obligor in the arrangements, we record the revenue gross.
WirelineOur Wireline segment earns revenue based upon usage of our network and facilities and contract fees. In general, fixed monthly fees for voice, video, data and certain other services are billed one month in advance and recognized when earned. Revenue from services that are not fixed in amount and are based on usage is recognized when such services are provided.
We recognize equipment revenue for services, in which we bundle the equipment with maintenance and monitoring services, when the equip-ment is installed in accordance with contractual specifications and ready for the customer’s use. The maintenance and monitoring services are recognized monthly over the term of the contract as we provide the services. Long-term contracts are accounted for using the percentage of completion method. We use the completed contract method if we cannot estimate the costs with a reasonable degree of reliability.
Customer activation fees, along with the related costs up to but not exceeding the activation fees, are deferred and amortized over the cus-tomer relationship period.
We report taxes imposed by governmental authorities on revenue-producing transactions between us and our customers that are within the scope of EITF No. 06-3, How Taxes Collected from Customers and Remitted to Governmental Authorities Should Be Presented in the Income Statement in the consolidated financial statements on a net basis.
v e r i zo n co m m u n i c at i o n s i n c . a n d s u b s i d i a r i e s

Notes to Consolidated Financial Statements continued
43
Discontinued Operations, Assets Held for Sale, and Sales of Businesses and InvestmentsWe classify as discontinued operations for all periods presented any component of our business that we hold for sale or disposal that has operations and cash flows that are clearly distinguishable operationally and for financial reporting purposes from the rest of Verizon. For those components, Verizon has no significant continuing involvement after dis-posal and their operations and cash flows are eliminated from Verizon’s ongoing operations. Sales of significant components of our business not classified as discontinued operations are reported as either Equity in earnings of unconsolidated businesses or Other income and (expense), net in our consolidated statements of income.
Maintenance and RepairsWe charge the cost of maintenance and repairs, including the cost of replacing minor items not constituting substantial betterments, princi-pally to Cost of services and sales as these costs are incurred.
Advertising Costs Advertising costs for advertising products and services as well as other promotional and sponsorship costs are charged to Selling, general and administrative expense in the periods in which they are incurred (see Note 19).
Earnings Per Common ShareBasic earnings per common share are based on the weighted-average number of shares outstanding during the period. Diluted earnings per common share include the dilutive effect of shares issuable under our stock-based compensation plans, an exchangeable equity interest and zero-coupon convertible notes (see Note 13). As of December 31, 2006, the exchangeable equity interest and zero-coupon convertible notes were no longer outstanding.
Cash and Cash EquivalentsWe consider all highly liquid investments with a maturity of 90 days or less when purchased to be cash equivalents. Cash equivalents are stated at cost, which approximates market value and include amounts held in money market funds. Prior to the close of the acquisition of Alltel Corporation (Alltel) we redeemed approximately $8.9 billion of these money market funds (see Note 2).
Short-Term InvestmentsOur short-term investments, which are stated at fair value, consist pri-marily of money market funds, a portion of which is held in trust to pay for certain employee benefits.
Marketable SecuritiesMarketable securities are included in the accompanying consolidated balance sheets in Short-term investments, Investments in uncon-solidated businesses or Other assets. We continually evaluate our investments in marketable securities for impairment due to declines in market value considered to be other-than-temporary. That evalua-tion includes, in addition to persistent, declining stock prices, general economic and company-specific evaluations. In the event of a determi-nation that a decline in market value is other-than-temporary, a charge to earnings is recorded for the loss, and a new cost basis in the invest-ment is established.
InventoriesInventory consists of wireless and wireline equipment held for sale, which is carried at the lower of cost (determined principally on either an average cost or first-in, first-out basis) or market. We also include in inventory new and reusable supplies and network equipment of our
local telephone operations, which are stated principally at average original cost, except that specific costs are used in the case of large indi-vidual items.
Plant and DepreciationWe record plant, property and equipment at cost. Our local telephone operations’ depreciation expense is principally based on the composite group remaining life method and straight-line composite rates. This method provides for the recognition of the cost of the remaining net investment in local telephone plant, less anticipated net salvage value, over the remaining asset lives. This method requires the periodic revi-sion of depreciation rates.
Plant, property and equipment of other wireline and wireless operations are generally depreciated on a straight-line basis.
The asset lives used by our operations are presented in the following table:
Average Useful Lives (in years)
Buildings 8 – 45Central office equipment 3 – 11Other network equipment 3 – 15Outside communications plant Copper cable 13 – 18 Fiber cable (including undersea cable) 11 – 25 Poles, conduit and other 30 – 50Furniture, vehicles and other 1 – 20
When we replace, retire or otherwise dispose of depreciable plant used in our local telephone network, we deduct the carrying amount of such plant from the respective accounts and charge it to accumulated depre-ciation. When the depreciable assets of our other wireline and wireless operations are retired or otherwise disposed of, the related cost and accumulated depreciation are deducted from the plant accounts, and any gains or losses on disposition are recognized in income.
We capitalize network software purchased or developed along with related plant assets. We also capitalize interest associated with the acqui-sition or construction of network-related assets. Capitalized interest is reported as part of the cost of the network-related assets and as a reduc-tion in interest expense.
In connection with our ongoing review of the average useful lives of plant, property and equipment, we determined, effective January 1, 2009 that the average useful lives of fiber cable would be increased to 25 years from 20 to 25 years and the average useful lives of copper cable would be changed to 15 years from 13 to 18 years. These changes are not expected to have a significant impact on our depreciation expense for 2009. Effective January 1, 2008 the average useful lives of fiber cable was increased from 20 years to 20 to 25 years. This change did not result in a significant impact to depreciation expense for 2008. Effective January 1, 2007, the average useful lives of certain of the circuit equipment was lengthened from 8 years to 9 years based on subsequent modifications to our fiber optic cable deployment plan. The average useful lives of certain buildings at Wireline was also increased from 42 years to 45 years. The reduction in depreciation resulting from these adjustments in 2007 was partially offset by increased depreciation resulting from the shortening of the lives of various types of wireless plant, property and equipment. While the timing and extent of current deployment plans are subject to modification, we believe the current estimates of impacted asset lives are reasonable and subject to ongoing analysis.

Notes to Consolidated Financial Statements continued
44
Interest expense incurred while qualifying wireless licenses are developed for service is capitalized as part of Wireless licenses. The capitalization period ends when the development is completed and the licenses are placed in commercial service.
Intangible Assets Subject to Amortization Our intangible assets that do not have indefinite lives (primarily customer lists and non-network internal-use software) are amortized over their useful lives and reviewed for impairment in accordance with SFAS No. 144, Accounting for the Impairment or Disposal of Long-Lived Assets (SFAS No. 144), whenever events or changes in circumstances indicate that the carrying amount of the asset may not be recoverable. If any indications were present, we would test for recoverability by comparing the carrying amount of the asset to the net undiscounted cash flows expected to be generated from the asset. If those net undiscounted cash flows do not exceed the carrying amount (i.e., the asset is not recoverable), we would perform the next step, which is to determine the fair value of the asset and record an impairment, if any. We reevaluate the useful life determi-nations for these intangible assets each reporting period to determine whether events and circumstances warrant a revision in their remaining useful lives.
For information related to the carrying amount of goodwill by segment, wireless licenses and other intangible assets, as well as the major com-ponents and average useful lives of our other acquired intangible assets, see Note 4.
Fair Value MeasurementsIn September 2006, the FASB issued SFAS No. 157, Fair Value Measurements (SFAS No. 157). SFAS No. 157 defines fair value, establishes a framework for measuring fair value and establishes a hierarchy that categorizes and prioritizes the sources to be used to estimate fair value. SFAS No. 157 also expands financial statement disclosures about fair value measurements. Under SFAS No. 157, fair value is defined as an exit price, representing the amount that would be received to sell an asset or paid to transfer a liability in an orderly transaction between market participants. SFAS No. 157 also establishes a three-tier hierarchy for inputs used in measuring fair value, which prioritizes the inputs used in the valuation methodolo-gies in measuring fair value:
Level 1 – Quoted prices in active markets for identical assets or liabilities
Level 2 – Observable inputs other than quoted prices in active markets for identical assets and liabilities
Level 3 – No observable pricing inputs in the market
Financial assets and financial liabilities are classified in their entirety based on the lowest level of input that is significant to the fair value measurements. Our assessment of the significance of a particular input to the fair value measurements requires judgment, and may affect the valuation of the assets and liabilities being measured and their place-ment within the fair value hierarchy.
Computer Software CostsWe capitalize the cost of internal-use network and non-network software which has a useful life in excess of one year. Subsequent additions, modi-fications or upgrades to internal-use network and non-network software are capitalized only to the extent that they allow the software to perform a task it previously did not perform. Software maintenance and training costs are expensed in the period in which they are incurred. Also, we capitalize interest associated with the development of internal-use network and non-network software. Capitalized non-network internal-use software costs are amortized using the straight-line method over a period of 2 to 7 years and are included in Other intangible assets, net in our consolidated balance sheets. For a discussion of our impairment policy for capitalized software costs, see “Goodwill and Other Intangible Assets” below. Also, see Note 4 for additional detail of internal-use non-network software reflected in our consolidated balance sheets.
Goodwill and Other Intangible AssetsGoodwillGoodwill is the excess of the acquisition cost of businesses over the fair value of the identifiable net assets acquired. Impairment testing for goodwill is performed annually or more frequently if indications of potential impairment exist under the provisions of SFAS No. 142, Goodwill and Other Intangible Assets (SFAS No. 142). The impairment test for goodwill uses a two-step approach, which is performed at the reporting unit level. We have determined that in our case, the reporting units are our operating segments since that is the lowest level at which discrete, reliable financial and cash flow information is available. Step one compares the fair value of the reporting unit (calculated using a market approach and a discounted cash flow method) to its carrying value. If the carrying value exceeds the fair value, there is a potential impairment and step two must be performed. Step two compares the carrying value of the reporting unit’s goodwill to its implied fair value (i.e., fair value of reporting unit less the fair value of the unit’s assets and liabilities, including identifiable intangible assets). If the fair value of goodwill is less than the carrying amount of goodwill, an impairment is recognized.
Intangible Assets Not Subject to AmortizationA significant portion of our intangible assets are wireless licenses that provide our wireless operations with the exclusive right to utilize des-ignated radio frequency spectrum to provide cellular communication services. While licenses are issued for only a fixed time, generally ten years, such licenses are subject to renewal by the Federal Communications Commission (FCC). Renewals of licenses have occurred routinely and at nominal cost. Moreover, we have determined that there are currently no legal, regulatory, contractual, competitive, economic or other factors that limit the useful life of our wireless licenses. As a result, we treat the wireless licenses as an indefinite-lived intangible asset under the provi-sions of SFAS No. 142. We reevaluate the useful life determination for wireless licenses each reporting period to determine whether events and circumstances continue to support an indefinite useful life.
We test our wireless licenses for potential impairment annually or more frequently if indications of impairment exist. We evaluate our licenses on an aggregate basis using a direct value approach. The direct value approach determines fair value using estimates of future cash flows associated specifically with the licenses. If the fair value of the aggre-gated wireless licenses is less than the aggregated carrying amount of the licenses, an impairment is recognized.

Notes to Consolidated Financial Statements continued
45
On February 12, 2008, FASB issued FASB Staff Position (FSP) No. FAS 157-2, Effective Date of FASB Statement No. 157 (FSP 157-2), which delays the effective date of SFAS No. 157 for one year for all nonfinancial assets and nonfinancial liabilities, except those that are recognized or disclosed at fair value in the financial statements on a recurring basis. We elected a partial deferral of SFAS No. 157 under the provisions of FSP 157-2 related to the measurement of fair value used when evaluating good-will, other intangible assets, wireless licenses and other long-lived assets for impairment and valuing asset retirement obligations and liabilities for exit or disposal activities. On October 10, 2008, the FASB issued FSP 157-3, Determining the Fair Value of a Financial Asset When the Market for That Asset Is Not Active, (FSP 157-3), which clarifies application of SFAS No. 157 in a market that is not active. FSP 157-3 was effective upon issu-ance, including prior periods for which financial statements have not been issued. The impact of partially adopting SFAS No. 157 on January 1, 2008 and the related FSPs 157-2 and 157-3 was not material to our financial statements.
SFAS No. 159SFAS No. 159, The Fair Value Option for Financial Assets and Financial Liabilities - Including an Amendment of SFAS No. 115 (SFAS No. 159), permits but does not require us to measure financial instruments and certain other items at fair value. Unrealized gains and losses on items for which the fair value option has been elected are reported in earnings. As we did not elect to fair value any of our financial instruments under the provisions of SFAS No. 159, our adoption of this statement effective January 1, 2008 did not have an impact on our consolidated financial statements.
Income TaxesVerizon and its domestic subsidiaries file a consolidated federal income tax return.
Deferred income taxes are provided for temporary differences in the bases between financial statement and income tax assets and liabilities. Deferred income taxes are recalculated annually at rates then in effect. We record valuation allowances to reduce our deferred tax assets to the amount that is more likely than not to be realized.
Effective January 1, 2007, we adopted FASB Interpretation No. 48, Accounting for Uncertainty in Income Taxes (FIN 48), which requires the use of a two-step approach for recognizing and measuring tax benefits taken or expected to be taken in a tax return and disclosures regarding uncertainties in income tax positions. The first step is recognition: we determine whether it is more likely than not that a tax position will be sustained upon examination, including resolution of any related appeals or litigation processes, based on the technical merits of the position. In evaluating whether a tax position has met the more-likely-than-not rec-ognition threshold, we presume that the position will be examined by the appropriate taxing authority that has full knowledge of all relevant information. The second step is measurement: a tax position that meets the more-likely-than-not recognition threshold is measured to determine the amount of benefit to recognize in the financial statements. The tax position is measured at the largest amount of benefit that is greater than 50 percent likely of being realized upon ultimate settlement. Differences between tax positions taken in a tax return and amounts recognized in the financial statements will generally result in one or more of the fol-lowing: an increase in a liability for income taxes payable, a reduction of an income tax refund receivable, a reduction in a deferred tax asset, or an increase in a deferred tax liability.
As a result of the implementation of FIN 48, we recorded adjustments to liabilities that resulted in a net $79 million increase in the liability for unrecognized tax benefits with an offsetting reduction to reinvested earnings as of January 1, 2007. The implementation of FIN 48 also resulted in adjustments to prior acquisitions accounted for under purchase accounting, resulting in a reduction in the liability for tax contingencies in the amount of $635 million and corresponding reductions to good-will and wireless licenses of $100 million and $535 million, respectively. The implementation impact included a reduction in deferred income taxes of approximately $3 billion, offset with a similar increase in Other liabilities as of January 1, 2007.
FASB Staff Position (FSP) No. FAS 13-2, Accounting for a Change or Projected Change in the Timing of Cash Flows Relating to Income Taxes Generated by a Leveraged Lease Transaction (FSP 13-2), requires that changes in the projected timing of income tax cash flows generated by a leveraged lease transaction be recognized as a gain or loss in the year in which the change occurs. We adopted FSP 13-2 effective January 1, 2007. The cumulative effect of initially adopting FSP 13-2 was a reduction to rein-vested earnings of $55 million, after-tax.
Stock-Based CompensationEffective January 1, 2006, we adopted SFAS No. 123(R), Share-Based Payment (SFAS No. 123(R)) utilizing the modified prospective method. SFAS No. 123(R) requires the measurement of stock-based compensa-tion expense based on the fair value of the award on the date of grant. Under the modified prospective method, the provisions of SFAS No. 123(R) apply to all awards granted or modified after the date of adoption. The impact to Verizon resulted from the Domestic Wireless segment, for which we recorded a $42 million cumulative effect of accounting change as of January 1, 2006, net of taxes and after minority interest, to recog-nize the effect of initially measuring the outstanding liability for Value Appreciation Rights (VARs) granted to Domestic Wireless employees at fair value utilizing a Black-Scholes model.
Foreign Currency Translation The functional currency of our foreign operations is generally the local currency. For these foreign entities, we translate income statement amounts at average exchange rates for the period, and we translate assets and liabilities at end-of-period exchange rates. We record these translation adjustments in Accumulated other comprehensive loss, a separate component of Shareowners’ Investment, in our consolidated balance sheets. We report exchange gains and losses on intercompany foreign currency transactions of a long-term nature in Accumulated other comprehensive loss. Other exchange gains and losses are reported in income.

46
Employee Benefit PlansPension and postretirement health care and life insurance benefits earned during the year as well as interest on projected benefit obliga-tions are accrued currently. Prior service costs and credits resulting from changes in plan benefits are amortized over the average remaining ser-vice period of the employees expected to receive benefits. Expected return on plan assets is determined by applying the return on assets assumption to the market-related value of assets.
As of July 1, 2006, Verizon management employees no longer earn pension benefits or earn service towards the company retiree medical subsidy (see Note 15).
In September 2006, the FASB issued SFAS No. 158, Employers’ Accounting for Defined Benefit Pension and Other Postretirement Plans—an amendment of FASB Statements No. 87, 88, 106, and 132(R) (SFAS No. 158). Effective December 31, 2006, SFAS No. 158 requires the recognition of a defined benefit postretirement plan’s funded status as either an asset or liability on the balance sheet. SFAS No. 158 also requires the immediate recognition of the unrecognized actuarial gains and losses and prior service costs and credits that arise during the period as a component of Other accumulated comprehensive loss, net of applicable income taxes. We adopted SFAS No. 158 effective December 31, 2006, which resulted in a net decrease to shareowners’ investment of $7,409 million. This included a net increase in pension obligations of $2,007 million, an increase in Other Postretirement Benefits Obligations of $10,828 million and an increase in Other Employee Benefit Obligations of $31 million, offset by an increase in deferred taxes of $5,457 million. Additionally, plan assets are measured at fair value as of the Company’s year-end.
Derivative InstrumentsWe have entered into derivative transactions to manage our exposure to fluctuations in foreign currency exchange rates, interest rates and commodity prices. We employ risk management strategies which may include the use of a variety of derivatives including cross currency swaps, foreign currency forwards and collars, equity options, interest rate and commodity swap agreements and interest rate locks. We do not hold derivatives for trading purposes.
In accordance with SFAS No. 133, Accounting for Derivative Instruments and Hedging Activities (SFAS No. 133) and related amendments and inter-pretations, we measure all derivatives, including derivatives embedded in other financial instruments, at fair value and recognize them as either assets or liabilities on our consolidated balance sheets. Changes in the fair values of derivative instruments not qualifying as hedges or any ineffective portion of hedges are recognized in earnings in the cur-rent period. Changes in the fair values of derivative instruments used effectively as fair value hedges are recognized in earnings, along with changes in the fair value of the hedged item. Changes in the fair value of the effective portions of cash flow hedges are reported in other com-prehensive income (loss) and recognized in earnings when the hedged item is recognized in earnings.
Recent Accounting PronouncementsIn December 2008, the FASB issued FSP FAS No. 132 (R)-1, Employers’ Disclosures about Postretirement Benefit Plan Assets (FSP 132 (R)-1). FSP 132 (R)-1 requires Verizon, as plan sponsor, to provide improved disclo-sures about plan assets, including categories of plan assets, nature and amount of concentrations of risk and disclosure about fair value mea-surements of plan assets, similar to those required by SFAS No. 157. FAS 132 (R)-1 is effective for fiscal years ending after December 15, 2009. We do not expect that the adoption of FSP 132 (R)-1 will have a significant impact on our consolidated financial statements.
In April 2008, the FASB issued FSP No. FAS 142-3, Determination of the Useful Life of Intangible Assets (FSP 142-3). FSP 142-3 removes the requirement under SFAS No. 142, Goodwill and Other Intangible Assets to consider whether an intangible asset can be renewed without substan-tial cost or material modifications to the existing terms and conditions, and replaces it with a requirement that an entity consider its own histor-ical experience in renewing similar arrangements, or a consideration of market participant assumptions in the absence of historical experience. FSP 142-3 also requires entities to disclose information that enables users of financial statements to assess the extent to which the expected future cash flows associated with the asset are affected by the entity’s intent and/or ability to renew or extend the arrangement. We were required to adopt FSP 142-3 effective January 1, 2009 on a prospective basis. The adoption of FSP 142-3 on January 1, 2009 did not have an impact on our consolidated financial statements.
In March 2008, the FASB issued SFAS No. 161, Disclosures about Derivative Instruments and Hedging Activities – an amendment of FASB Statement No. 133, (SFAS No. 161). This statement requires additional disclosures for derivative instruments and hedging activities that include how and why an entity uses derivatives, how these instruments and the related hedged items are accounted for under SFAS No. 133 and related inter-pretations, and how derivative instruments and related hedged items affect the entity’s financial position, results of operations and cash flows. SFAS No. 161 is effective for financial statements issued for fiscal years and interim periods beginning after November 15, 2008. The adoption of SFAS No. 161 on January 1, 2009 did not have an impact on our con-solidated financial statements.
In December 2007, the FASB issued SFAS No. 141(R), Business Combinations, (SFAS No. 141(R)), to replace SFAS No. 141, Business Combinations. SFAS No. 141(R) requires the use of the acquisition method of accounting, defines the acquirer, establishes the acquisition date and broadens the scope to all transactions and other events in which one entity obtains control over one or more other businesses. This statement is effective for business combinations or transactions entered into for fiscal years beginning on or after December 15, 2008. Upon the adoption of SFAS No. 141(R) we will be required to expense certain transaction costs and related fees associated with business combinations that were previously capitalized. This will result in additional expenses being recognized relating to the 2009 closing of the Alltel transaction. In addition, with the adoption of SFAS No. 141(R) changes to valuation allowances for deferred income tax assets and adjustments to unrecognized tax ben-efits generally will be recognized as adjustments to income tax expense rather than goodwill.
Notes to Consolidated Financial Statements continued

Notes to Consolidated Financial Statements continued
47
In December 2007, the FASB issued SFAS No. 160, Noncontrolling Interests in Consolidated Financial Statements – an amendment of ARB No. 51, (SFAS No. 160). SFAS No. 160 establishes accounting and reporting standards for the noncontrolling interest in a subsidiary and for the retained interest and gain or loss when a subsidiary is deconsolidated. This statement is effective for financial statements issued for fiscal years beginning on or after December 15, 2008 which will be applied prospectively, except for the presentation and disclosure requirements which will be applied retrospectively for all periods presented. Upon the initial adoption of this statement, we will change the classification and presentation of Noncontrolling Interest in our financial statements, which we currently refer to as minority interest. Additionally, we conduct certain business operations in certain markets through non-wholly owned entities. Any changes in these ownership interests may be required to be measured at fair value and recognized as a gain or loss, if any, in earnings. SFAS No. 160 will also result in a lower effective income tax rate for the Company due to the inclusion of income attributable to noncontrolling interest in income before the provision for income taxes. However, the income tax provision will not be adjusted as a result of SFAS No. 160.
NOTE 2
ACQUISITIONS
Alltel CorporationOn June 5, 2008, Verizon Wireless entered into an agreement and plan of merger with Alltel and its controlling stockholder, Atlantis Holdings LLC, an affiliate of private investment firms TPG Capital and GS Capital Partners, to acquire 100% of the equity of Alltel in an all-cash merger. After satisfying all closing conditions, including receiving the required regulatory approvals, Verizon Wireless closed the acquisition on January 9, 2009 and paid approximately $5.9 billion for the equity of Alltel. Immediately prior to the closing, the Alltel debt associated with the transaction, net of cash, was approximately $22.2 billion. Alltel provides wireless voice and advanced data services to residential and business customers in 34 states.
We expect to experience substantial operational benefits from the Alltel acquisition, including additional combined overall cost savings from reduced roaming costs by moving more traffic to our own net-work, reduced network-related costs from the elimination of duplicate facilities, consolidation of platforms, efficient traffic consolidation, and reduced overall expenses relating to advertising, overhead and head-count. We expect reduced overall combined capital expenditures as a result of greater economies of scale and the rationalization of network assets. We also anticipate that the use of the same technology platform will enable us to rapidly integrate Alltel’s operations with ours while enabling a seamless transition for customers.
The Alltel acquisition will be accounted for as a business combination under SFAS No. 141(R). While Verizon Wireless has commenced the appraisals necessary to assess the fair values of the tangible and intan-gible assets acquired and liabilities assumed, the amounts of assets and liabilities arising from contingencies, the fair value of noncontrolling interests, and the amount of goodwill to be recognized as of the acqui-sition date, the initial purchase price allocation is not yet available.
On June 10, 2008, in connection with the agreement to acquire Alltel, Verizon Wireless purchased from third parties $5.0 billion aggregate principal amount of debt obligations of certain subsidiaries of Alltel for approximately $4.8 billion, plus accrued and unpaid interest. The matu-rity dates of these obligations range from 2015 to 2017. Verizon Wireless’s investment in Alltel debt obligations is classified as available-for-sale and is included in Other investments in the consolidated balance sheet at December 31, 2008.
Alltel Divestiture Markets As a condition of the regulatory approvals by the United States Department of Justice (DOJ) and the FCC that were required to com-plete the Alltel acquisition, Verizon Wireless will divest overlapping properties in 105 operating markets in 24 states (the Alltel Divestiture Markets). These markets consist primarily of Alltel operations, but also include the pre-merger operations of Verizon Wireless in four markets as well as operations in Southern Minnesota and Western Kansas that were acquired from Rural Cellular Corporation (Rural Cellular). As a result of these divestiture requirements, Verizon Wireless has placed the licenses and assets in the Alltel Divestiture Markets in a management trust that will continue to operate the markets under their current brands until they are sold.

48
Repayment of Alltel Debt and New BorrowingsOn December 19, 2008, Verizon Wireless and Verizon Wireless Capital LLC, as the borrowers, entered into the $17.0 billion credit facility (Bridge Facility) with Bank of America, N.A., as Administrative Agent. On December 31, 2008, the Bridge Facility was reduced to $12.5 billion. As of December 31, 2008, there were no amounts outstanding under this facility.
On January 9, 2009, immediately prior to the closing of the Alltel acquisi-tion, we borrowed $12,350 million under the Bridge Facility in order to complete the acquisition of Alltel and repay certain of Alltel’s outstanding debt. The remaining commitments under the Bridge Facility were ter-minated. The Bridge Facility has a maturity date of January 8, 2010. Interest on borrowings under the Bridge Facility is calculated based on the London Interbank Offered Rate (LIBOR) for the applicable period, the level of borrowings on specified dates and a margin that is determined by reference to our long-term credit rating issued by S&P. If the aggre-gate outstanding principal amount under the Bridge Facility is greater than $6.0 billion on July 8th, 2009 (the 180th day after the closing of the Alltel acquisition), we are required to repay $3.0 billion on that date (less the amount of specified mandatory or optional prepayments that have been made as of that date). The Bridge Facility includes a requirement to maintain a certain leverage ratio. We are required to prepay indebted-ness under the Bridge Facility with the net cash proceeds of specified asset sales, issuances and sales of equity and incurrences of borrowed money indebtedness, subject to certain exceptions.
On February 4, 2009, Verizon Wireless and Verizon Wireless Capital LLC co-issued a private placement of $3,500 million of 5.55% notes due 2014 and $750 million of 5.25% notes due 2012, resulting in cash proceeds of $4,211 million, net of discounts and issuance costs. The net proceeds from the sale of these notes were used to repay a portion of the borrow-ings outstanding under the Bridge Facility.
After the completion of the Alltel acquisition and repayments of Alltel debt, including repayments completed through January 28, 2009, approximately $2.5 billion of Alltel debt that is owed to third parties remained outstanding.
Rural Cellular CorporationOn August 7, 2008, Verizon Wireless acquired 100% of the outstanding common stock and redeemed all of the preferred stock of Rural Cellular in a cash transaction. Rural Cellular was a wireless communications service provider operating under the trade name of “Unicel,” focusing primarily on rural markets in the United States. Verizon Wireless believes that the acquisition will further enhance its network coverage in mar-kets adjacent to its existing service areas and will enable Verizon Wireless to achieve operational benefits through realizing synergies in reduced roaming and other operating expenses. Under the terms of the acquisition agreement, Verizon Wireless paid Rural Cellular’s common shareholders $728 million in cash ($45 per share). Additionally, all classes of Rural Cellular’s preferred shareholders received cash in the aggregate amount of $571 million.
The consolidated financial statements include the results of Rural Cellular’s operations from the date the acquisition closed. Had this acquisition been consummated on January 1, 2008 or 2007, the results of Rural Cellular’s acquired operations would not have had a significant impact on our consolidated income statement. In connection with the acquisition, Verizon Wireless assumed $1.5 billion of Rural Cellular’s debt. This debt was redeemed on September 5, 2008, using proceeds from new debt borrowings by Verizon Wireless (see Note 10). The aggregate value of the net assets acquired was $1.3 billion based on the cash con-sideration, as well as closing and other direct acquisition-related costs of approximately $12 million.
In accordance with SFAS No. 141, the cost of the acquisition was pre-liminarily allocated to the assets acquired and liabilities assumed based on their fair values as of the close of the acquisition, with the amounts exceeding the fair value being recorded as goodwill. As the values of certain assets and liabilities are preliminary in nature, they are subject to adjustment as additional information is obtained. The valuations will be finalized within 12 months of the close of the acquisition. When the valuations are finalized, any changes to the preliminary valuation of assets acquired or liabilities assumed may result in adjustments to the fair value of the identifiable intangible assets acquired and goodwill.
The following table summarizes the preliminary allocation of the acqui-sition cost to the assets acquired, including cash acquired of $42 million, and liabilities assumed as of the acquisition date and adjustments made thereto during the three months ended December 31, 2008:
(dollars in millions)As of
August 7, 2008 AdjustmentsAdjusted as of
August 7, 2008
Assets acquired Wireless licenses $ 1,014 $ 82 $ 1,096 Goodwill 935 (2) 933 Intangible assets subject to amortization 197 1 198 Other acquired assets 1,007 (34) 973 Total assets acquired 3,153 47 3,200
Liabilities assumed Long-term debt 1,505 – 1,505 Deferred income taxes and other liabilities 342 42 384 Total liabilities assumed 1,847 42 1,889 Net assets acquired $ 1,306 $ 5 $ 1,311
Included in Other acquired assets are $490 million of assets that have been divested pursuant to the exchange agreement with AT&T, as described below. Adjustments were primarily related to ongoing revi-sions to preliminary valuations of wireless licenses and other tangible and intangible assets acquired that were subsequently divested to AT&T, and revised estimated tax bases of acquired assets and liabilities.
Wireless licenses acquired have an indefinite life, and accordingly, are not subject to amortization. The customer relationships are being amortized using an accelerated method over 6 years, and other intangibles are being amortized on a straight-line basis over 12 months. Goodwill of approximately $115 million is expected to be deductible for tax purposes.
Notes to Consolidated Financial Statements continued

Notes to Consolidated Financial Statements continued
49
Divestiture Markets and Exchange Agreements with AT&TAs part of its regulatory approval for the Rural Cellular acquisition, the FCC and DOJ required the divestiture of six operating markets, including all of Rural Cellular’s operations in Vermont and New York as well as its operations in Okanogan and Ferry, WA (the Divestiture Markets).
On December 22, 2008, Verizon Wireless completed an exchange with AT&T. Pursuant to the terms of the exchange agreement, as amended, AT&T received the assets relating to the Divestiture Markets and a cel-lular license for part of the Madison, KY market. In exchange, Verizon Wireless received cellular operating markets in Madison and Mason, KY and 10 MHz PCS licenses in Las Vegas, NV, Buffalo, NY, Erie, PA, Sunbury-Shamokin, PA and Youngstown, OH. Verizon Wireless also received AT&T’s minority interests in three entities in which Verizon Wireless holds interests plus a cash payment. The preliminary aggregate value of prop-erties exchanged was approximately $500 million. There was no gain or loss recognized on the exchange. In addition, subject to FCC approval, Verizon Wireless will acquire PCS licenses in Franklin, NY (except Franklin county) and the entire state of Vermont from AT&T in a separate cash transaction that is expected to close in the first half of 2009.
Other AcquisitionsIn July 2007, Verizon acquired a security-services firm for $435 million, primarily resulting in goodwill of $343 million and other intangible assets of $81 million. This acquisition was made to enhance our managed infor-mation security services to large business and government customers worldwide. This acquisition was integrated into the Wireline segment.
In connection with the 2006 acquisition of MCI, Inc. (MCI), we recorded certain severance and severance-related costs and contract termination costs associated with the merger, pursuant to Emerging Issues Task Force Issue No. 95-3, Recognition of Liabilities in Connection with a Purchase Business Combination. At December 31, 2007, there was approximately $36 million remaining for these obligations which were substantially resolved during 2008. During 2008, 2007 and 2006, we recorded pretax charges of $172 million ($107 million after-tax), $178 million ($112 mil-lion after-tax) and $232 million ($146 million after-tax), respectively, primarily related to the MCI acquisition that were comprised mainly of systems integration activities.
NOTE 3
DISCONTINUED OPERATIONS, ExTRAORDINARY ITEM AND OTHER DISPOSITIONS
Discontinued OperationsTelecomunicaciones de Puerto Rico, Inc. On March 30, 2007, we completed the sale of our 52% interest in Telecomunicaciones de Puerto Rico, Inc. (TELPRI) and received gross proceeds of approximately $980 million. The sale resulted in a pretax gain of $120 million ($70 million after-tax). Verizon contributed $100 mil-lion ($65 million after-tax) of the proceeds to the Verizon Foundation.
Verizon Dominicana C. por A.On December 1, 2006, we closed the sale of Verizon Dominicana C. por A (Verizon Dominicana). The transaction resulted in net pretax cash proceeds of $2,042 million, net of a purchase price adjustment of $373 million. The U.S. taxes that became payable and were recognized at the time the transaction closed exceeded the $30 million pretax gain on the sale resulting in an overall after-tax loss of $541 million.
Verizon Information ServicesIn October 2006, we announced our intention to spin-off our domestic print and Internet yellow pages directories publishing operations, which have been organized into a newly formed company known as Idearc Inc. On October 18, 2006, the Verizon Board of Directors declared a divi-dend consisting of 1 share of the newly formed company for each 20 shares of Verizon owned. In making its determination to effect the spin-off, Verizon’s Board of Directors considered, among other things, that the spin-off may allow each company to separately focus on its core busi-ness, which may facilitate the potential expansion and growth of Verizon and the newly formed company, and allow each company to determine its own capital structure.
On November 17, 2006, we completed the spin-off of our domestic print and Internet yellow pages directories business. Cash was paid for frac-tional shares. The distribution of common stock of the newly formed company to our shareowners was considered a tax free transaction for us and for our shareowners, except for the cash payments for fractional shares which were generally taxable.
At the time of the spin-off, the exercise price and number of shares of Verizon common stock underlying options to purchase shares of Verizon common stock, restricted stock units (RSU’s) and performance stock units (PSU’s) were adjusted pursuant to the terms of the applicable Verizon equity incentive plans, taking into account the change in the value of Verizon common stock as a result of the spin-off.
In connection with the spin-off, Verizon received approximately $2 bil-lion in cash from the proceeds of loans under a term loan facility of the newly formed company and transferred to the newly formed company debt obligations in the aggregate principal amount of approximately $7.1 billion thereby reducing Verizon’s outstanding debt at that time. We incurred pretax charges of approximately $117 million ($101 million after-tax), including debt retirement costs, costs associated with accu-mulated vested benefits of employees of the newly formed company, investment banking fees and other transaction costs related to the spin-off, which are included in discontinued operations.

Notes to Consolidated Financial Statements continued
50
In accordance with SFAS No. 144 we have classified TELPRI, Verizon Dominicana and our former domestic print and Internet yellow page directories publishing operations as discontinued operations in the con-solidated financial statements for all periods presented through the date of the divestiture or spin-off.
Income from discontinued operations, net of tax, presented in the con-solidated statements of income included the following:
(dollars in millions)Years Ended December 31, 2008 2007 2006
Operating revenues $ – $ 306 $ 5,077
Income before provision for income taxes $ – $ 185 $ 2,041Provision for income taxes – (43) (1,282)Income from discontinued operations,
net of tax $ – $ 142 $ 759
Extraordinary ItemCompañía Anónima Nacional Teléfonos de Venezuela (CANTV)In January 2007, the Bolivarian Republic of Venezuela (the Republic) declared its intent to nationalize certain companies, including CANTV. On February 12, 2007, we entered into a Memorandum of Understanding (MOU) with the Republic, which provided that the Republic offer to pur-chase all of the equity securities of CANTV, including our 28.5% interest, through public tender offers in Venezuela and the United States. Under the terms of the MOU, the prices in the tender offers would be adjusted downward to reflect any dividends declared and paid subsequent to February 12, 2007. During 2007, the tender offers were completed and Verizon received an aggregate amount of approximately $572 million, which included $476 million from the tender offers as well as $96 million of dividends declared and paid subsequent to the MOU. During 2007, based upon our investment balance in CANTV, we recorded an extraor-dinary loss of $131 million, including taxes of $38 million.
Other DispositionsTelephone Access Lines Spin-offOn January 16, 2007, we announced a definitive agreement with FairPoint Communications, Inc. (FairPoint) providing for Verizon to estab-lish a separate entity for its local exchange and related business assets in Maine, New Hampshire and Vermont, spin-off that new entity into a newly formed company, known as Northern New England Spinco Inc. (Spinco), to Verizon’s shareowners, and immediately merge it with and into FairPoint.
On March 31, 2008, we completed the spin-off of the shares of Spinco to Verizon shareowners and the merger of Spinco with FairPoint, resulting in Verizon shareowners collectively owning approximately 60 percent of FairPoint common stock. FairPoint issued approximately 53.8 million shares of FairPoint common stock to Verizon shareowners in the merger, and Verizon shareowners received one share of FairPoint common stock for every 53.0245 shares of Verizon common stock they owned as of March 7, 2008. FairPoint paid cash in lieu of any fraction of a share of FairPoint common stock.
On April 1, 2008, the number of shares of restricted stock units (RSUs) and performance stock units (PSUs) previously issued by Verizon were adjusted pursuant to the terms of the applicable Verizon equity incentive plans, taking into account the change in the value of Verizon common stock as a result of the spin-off.
We also entered into other agreements that defined responsibility for obligations arising before or that may arise after the spin-off, including, among others, obligations relating to Verizon employees whose primary duties relate to Spinco’s business, certain transition services and taxes. In general, the agreements governed the exchange of services between us and FairPoint through January 2009 at specified cost-based or com-mercial rates.
As a result of the spin-off, our net debt was reduced by approximately $1.4 billion. The consolidated income statements for the periods presented include the results of operations of the local exchange and related busi-ness assets in Maine, New Hampshire and Vermont through March 31, 2008, the date of completion of the spin-off. The consolidated balance sheet as of December 31, 2008 reflects the spin-off as of March 31, 2008, which increased shareowners’ investment by approximately $16 million, and included approximately $79 million ($44 million after-tax) related to defined benefit pension and postretirement benefit plans, which is reflected as a reduction to the beginning balance of Accumulated other comprehensive loss.
During 2008, we recorded pretax charges of $103 million ($81 million after-tax) for costs incurred related to the separation of the wireline facilities and operations in Maine, New Hampshire and Vermont from Verizon at the closing of the transaction, as well as for professional advi-sory and legal fees in connection with this transaction. During 2007, we recorded pretax charges of $84 million ($80 million after-tax) for costs incurred related to the separation of the wireline facilities and opera-tions in Maine, New Hampshire and Vermont.
NOTE 4
WIRELESS LICENSES, GOODWILL AND OTHER INTANGIBLE ASSETS
Wireless Licenses Changes in the carrying amount of wireless licenses are as follows:
(dollars in millions)
Balance as of December 31, 2006 $ 50,959 Wireless licenses acquired 170 Capitalized interest on wireless licenses 203 Other, net (536)Balance as of December 31, 2007 $ 50,796 Wireless licenses acquired 10,626 Capitalized interest on wireless licenses 557 Other, net (5)Balance as of December 31, 2008 $ 61,974
As of December 31, 2008 and 2007, $12.4 billion and $3.0 billion, respec-tively, of wireless licenses were not in service.
During 2007, Other, net primarily included the impact of adopting FIN 48 (see Note 1) of $535 million.
On March 20, 2008, the FCC announced the results of Auction 73 of wireless spectrum licenses in the 700 MHz band. We were the suc-cessful bidder for twenty-five 12 MHz licenses in the A-Block frequency, seventy-seven 12 MHz licenses in the B-Block frequency and seven 22 MHz licenses (nationwide with the exception of Alaska) in the C-Block frequency, with an aggregate bid price of $9,363 million. We have made all required payments to the FCC for these licenses. The FCC granted us these licenses on November 26, 2008.

Notes to Consolidated Financial Statements continued
51
GoodwillChanges in the carrying amount of goodwill are as follows:
(dollars in millions)
Domestic Wireless Wireline Total
Balance at December 31, 2006 $ 345 $ 5,310 $ 5,655 Acquisitions – 343 343 Reclassifications and adjustments – (753) (753)Balance at December 31, 2007 $ 345 $ 4,900 $ 5,245 Acquisitions 954 – 954 Reclassifications and adjustments (2) (162) (164)Balance at December 31, 2008 $ 1,297 $ 4,738 $ 6,035
Reclassifications and adjustments to goodwill include the impact of adopting FIN 48 (see Note 1) of $100 million as of January 1, 2007, as well as to reflect revised estimated tax bases of acquired assets and lia-bilities during 2008 and 2007.
Other Intangible AssetsThe following table displays the details of other intangible assets:
(dollars in millions)At December 31, 2008 At December 31, 2007
Gross Amount
Accumulated Amortization
Net Amount
Gross Amount
AccumulatedAmortization
Net Amount
Finite-lived intangible assets: Customer lists (3 to 10 years) $ 1,415 $ 595 $ 820 $ 1,307 $ 459 $ 848 Non-network internal-use software
(2 to 7 years) 8,099 4,102 3,997 8,116 4,147 3,969
Other (1 to 25 years) 465 83 382 215 44 171Total $ 9,979 $ 4,780 $ 5,199 $ 9,638 $ 4,650 $ 4,988
Customer lists and Other at December 31, 2008 include $198 million related to the Rural Cellular acquisition. Amortization expense was $1,383 million, $1,341 million, and $1,423 million for the years ended December 31, 2008, 2007 and 2006, respectively and is estimated to be $1,430 mil-lion in 2009, $1,139 million in 2010, $934 million in 2011, $713 million in 2012 and $552 million in 2013.
During 2008, we entered into an agreement to acquire a non-exclusive license (the IP License) to a portfolio of intellectual property owned by an entity formed for the purpose of acquiring and licensing intellectual property. We paid an initial fee of $100 million for the IP License, which is included in Other intangible assets and is being amortized over the expected useful lives of the licensed intellectual property. In addition, we executed a subscription agreement (with a capital commitment of $250 million, of which approximately $214 million is remaining to be funded at December 31, 2008, as required through 2012) to become a member in a limited liability company (the LLC) formed by the same entity for the purpose of acquiring and licensing additional intellectual property. In connection with this investment, we will receive non-exclusive license rights to certain intellectual property acquired by the LLC for an annual license fee.

52
Notes to Consolidated Financial Statements continued
NOTE 5
MARKETABLE SECURITIES AND OTHER INVESTMENTS
We have investments in marketable securities which are considered “available-for-sale” under the provisions of SFAS No. 115. These invest-ments have been included in our consolidated balance sheets in Short-term investments, Other investments, Investments in unconsoli-dated businesses and Other assets.
Investment Impairment Charge During 2008, we recorded a pretax charge of $48 million ($31 million after-tax) related to an other-than-temporary decline in the fair value of our investments in certain marketable securities.
The following table shows certain summarized information related to our investments in marketable securities:
(dollars in millions)Gross Unrealized
Cost Gains LossesFair
Value
At December 31, 2008Short-term investments $ 362 $ 2 $ (5) $ 359Investments in
unconsolidated businesses (Note 7) 342 – (52) 290
Other investments (Notes 2 and 12) 4,781 – – 4,781
Other assets 684 4 (9) 679$ 6,169 $ 6 $ (66) $ 6,109
At December 31, 2007Short-term investments $ 497 $ 21 $ – $ 518Investments in
unconsolidated businesses (Note 7) 286 42 – 328
Other assets 661 31 – 692$ 1,444 $ 94 $ – $ 1,538
Our short-term investments are primarily bonds and mutual funds.
Certain other investments in securities that we hold are not adjusted to market values because those values are not readily determinable and/or the securities are not marketable. We do, however, adjust the car-rying values of these securities in situations where we believe declines in value below cost were other–than-temporary. The carrying values for investments not adjusted to market value were $28 million at December 31, 2008 and $15 million at December 31, 2007.
NOTE 6
PLANT, PROPERT Y AND EQUIPMENT
The following table displays the details of plant, property and equip-ment, which is stated at cost:
(dollars in millions)At December 31, 2008 2007
Land $ 815 $ 839Buildings and equipment 20,440 19,734Network equipment 175,757 173,654Furniture, office and data processing equipment 10,477 11,912Work in progress 1,279 1,988Leasehold improvements 4,155 3,612Other 2,682 2,255
215,605 213,994Less accumulated depreciation 129,059 128,700Total $ 86,546 $ 85,294
Verizon Center Relocation, NetDuring 2006, we recorded pretax charges of $184 million ($118 million after-tax) in connection with the relocation of employees and business operations to Verizon Center located in Basking Ridge, New Jersey.

53
Notes to Consolidated Financial Statements continued
NOTE 7
INVESTMENTS IN UNCONSOLIDATED BUSINESSES
Our investments in unconsolidated businesses are comprised of the following:
(dollars in millions)
At December 31, Ownership2008
Investment Ownership2007
Investment
Equity InvesteesVodafone Omnitel 23.1% $ 2,182 23.1% $ 2,313Other Various 877 Various 744Total equity investees 3,059 3,057
Cost Investees Various 334 Various 315Total investments
in unconsolidated businesses $ 3,393 $ 3,372
Dividends and repatriations of foreign earnings received from these investees amounted to $779 million in 2008, $2,571 million in 2007 and $42 million in 2006.
Equity Method InvestmentsVodafone OmnitelVodafone Omnitel is the second largest wireless communications company in Italy. At December 31, 2008 and 2007, our investment in Vodafone Omnitel included goodwill of $1,105 million and $1,154 million, respectively. During 2008 and 2007, Verizon received a net dis-tribution from Vodafone Omnitel of approximately $670 million and $2,100 million, respectively. As a result, in 2007 we recorded $610 million of foreign and domestic taxes and expenses specifically relating to our share of Vodafone Omnitel’s distributable earnings.
Other Equity InvesteesVerizon has limited partnership investments in entities that invest in affordable housing projects, for which Verizon provides funding as a limited partner and receives tax deductions and tax credits based on its partnership interests. At December 31, 2008 and 2007, Verizon had equity investments in these partnerships of $761 million and $637 million, respectively. Verizon currently adjusts the carrying value of these investments for any losses incurred by the limited partnerships through earnings.
The remaining investments include wireless partnerships in the U.S. and other smaller domestic and international investments.
Cost Method InvestmentsSome of our cost investments are carried at their current market value. Other cost investments are carried at their original cost, except in cases where we have determined that a decline in the estimated market value of an investment is other-than-temporary.
NOTE 8
MINORIT Y INTEREST
Minority interests in equity of subsidiaries were as follows:
(dollars in millions)At December 31, 2008 2007
Minority interests in consolidated subsidiaries: Wireless joint venture $ 36,683 $ 31,782 Cellular partnerships and other 516 506
$ 37,199 $ 32,288
Wireless Joint VentureThe wireless joint venture was formed in April 2000 in connection with the combination of the U.S. wireless operations and interests of Verizon and Vodafone. The wireless joint venture operates as Verizon Wireless. Verizon owns a controlling 55% interest in Verizon Wireless and Vodafone owns the remaining 45%.
Under the terms of an investment agreement, Vodafone had the right to require Verizon Wireless to purchase up to an aggregate of $20 billion worth of Vodafone’s interest in Verizon Wireless at designated times (put windows) at its then fair market value, not to exceed $10 billion in any one put window. The last of these put windows opened on June 10 and closed on August 9 in 2007. Vodafone did not exercise its right during this period and no longer has any right to require the purchase of any of its interest in Verizon Wireless.
Cellular Partnerships and OtherIn August 2002, Verizon Wireless and Price Communications Corp. (Price) combined Price’s wireless business with a portion of Verizon Wireless. The resulting limited partnership, Verizon Wireless of the East LP (VZ East), is controlled and managed by Verizon Wireless. In exchange for its contributed assets, Price received a limited partnership interest in VZ East which was exchangeable into the common stock of Verizon Wireless if an initial public offering of that stock occurred, or into the common stock of Verizon on the fourth anniversary of the asset contri-bution date. On August 15, 2006, Verizon delivered 29.5 million shares of newly-issued Verizon common stock to Price valued at $1,007 million in exchange for Price’s limited partnership interest in VZ East.
Noncontrolling Interests in Consolidated Financial StatementsSee Note 1 for a discussion of the pending implementation of SFAS No. 160.
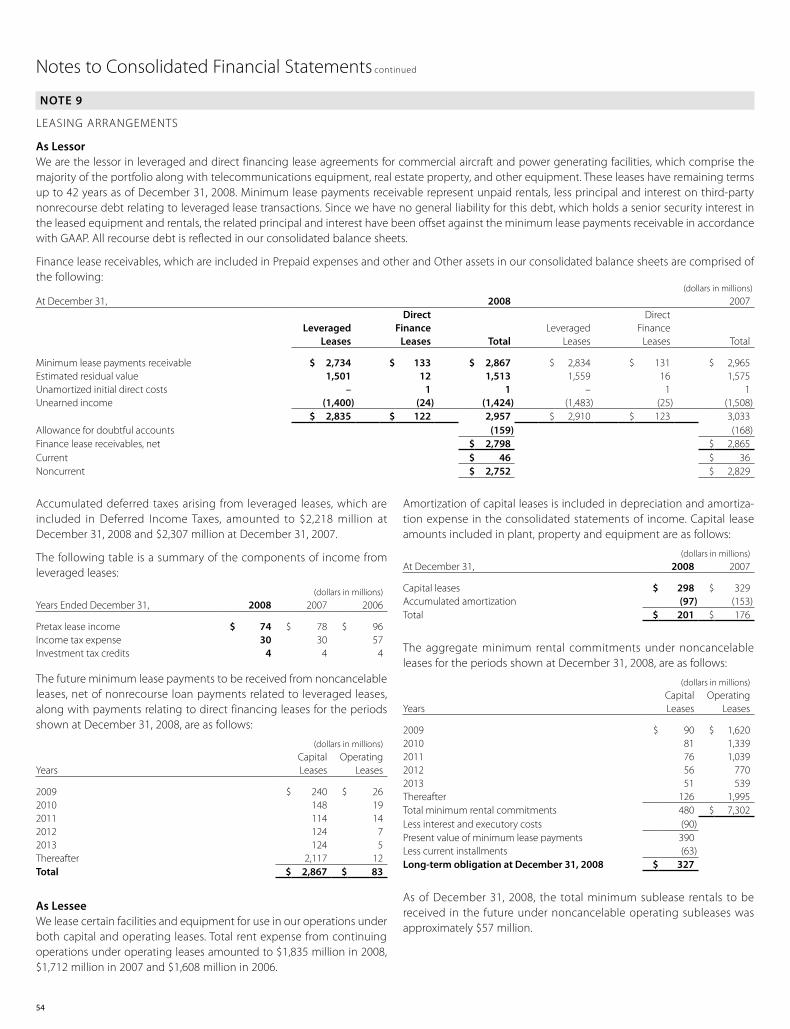
54
Accumulated deferred taxes arising from leveraged leases, which are included in Deferred Income Taxes, amounted to $2,218 million at December 31, 2008 and $2,307 million at December 31, 2007.
The following table is a summary of the components of income from leveraged leases:
(dollars in millions)Years Ended December 31, 2008 2007 2006
Pretax lease income $ 74 $ 78 $ 96Income tax expense 30 30 57Investment tax credits 4 4 4
The future minimum lease payments to be received from noncancelable leases, net of nonrecourse loan payments related to leveraged leases, along with payments relating to direct financing leases for the periods shown at December 31, 2008, are as follows:
(dollars in millions)
YearsCapitalLeases
OperatingLeases
2009 $ 240 $ 262010 148 192011 114 142012 124 72013 124 5Thereafter 2,117 12Total $ 2,867 $ 83
As LesseeWe lease certain facilities and equipment for use in our operations under both capital and operating leases. Total rent expense from continuing operations under operating leases amounted to $1,835 million in 2008, $1,712 million in 2007 and $1,608 million in 2006.
Amortization of capital leases is included in depreciation and amortiza-tion expense in the consolidated statements of income. Capital lease amounts included in plant, property and equipment are as follows:
(dollars in millions)At December 31, 2008 2007
Capital leases $ 298 $ 329Accumulated amortization (97) (153)Total $ 201 $ 176
The aggregate minimum rental commitments under noncancelable leases for the periods shown at December 31, 2008, are as follows:
(dollars in millions)
YearsCapital Leases
Operating Leases
2009 $ 90 $ 1,6202010 81 1,3392011 76 1,0392012 56 7702013 51 539Thereafter 126 1,995Total minimum rental commitments 480 $ 7,302Less interest and executory costs (90)Present value of minimum lease payments 390Less current installments (63)Long-term obligation at December 31, 2008 $ 327
As of December 31, 2008, the total minimum sublease rentals to be received in the future under noncancelable operating subleases was approximately $57 million.
NOTE 9
LEASING ARRANGEMENTS
As Lessor We are the lessor in leveraged and direct financing lease agreements for commercial aircraft and power generating facilities, which comprise the majority of the portfolio along with telecommunications equipment, real estate property, and other equipment. These leases have remaining terms up to 42 years as of December 31, 2008. Minimum lease payments receivable represent unpaid rentals, less principal and interest on third-party nonrecourse debt relating to leveraged lease transactions. Since we have no general liability for this debt, which holds a senior security interest in the leased equipment and rentals, the related principal and interest have been offset against the minimum lease payments receivable in accordance with GAAP. All recourse debt is reflected in our consolidated balance sheets.
Finance lease receivables, which are included in Prepaid expenses and other and Other assets in our consolidated balance sheets are comprised of the following:
(dollars in millions)At December 31, 2008 2007
Leveraged Leases
Direct Finance
Leases TotalLeveraged
Leases
Direct Finance
Leases Total
Minimum lease payments receivable $ 2,734 $ 133 $ 2,867 $ 2,834 $ 131 $ 2,965Estimated residual value 1,501 12 1,513 1,559 16 1,575Unamortized initial direct costs – 1 1 – 1 1Unearned income (1,400) (24) (1,424) (1,483) (25) (1,508)
$ 2,835 $ 122 2,957 $ 2,910 $ 123 3,033Allowance for doubtful accounts (159) (168)Finance lease receivables, net $ 2,798 $ 2,865Current $ 46 $ 36Noncurrent $ 2,752 $ 2,829
Notes to Consolidated Financial Statements continued

Notes to Consolidated Financial Statements continued
55
Notes PayableIn November 2008, Verizon issued $2,000 million of 8.75% notes due 2018 and $1,250 million of 8.95% notes due 2039, which resulted in cash proceeds of $3,189 million net of discount and issuance costs. In April 2008, Verizon issued $1,250 million of 5.25% notes due 2013, $1,500 mil-lion of 6.10% notes due 2018, and $1,250 million of 6.90% notes due 2038, resulting in cash proceeds of $3,950 million, net of discounts and
issuance costs. In February 2008, Verizon issued $750 million of 4.35% notes due 2013, $1,500 million of 5.50% notes due 2018, and $1,750 million of 6.40% notes due 2038, resulting in cash proceeds of $3,953 million, net of discounts and issuance costs. In January 2008, Verizon uti-lized a $239 million fixed rate vendor financing facility due 2010. During the first quarter of 2008, $1,000 million of Verizon Communications Inc. 4.0% notes matured and were repaid.
NOTE 10
DEBT
Debt Maturing Within One YearDebt maturing within one year is as follows:
(dollars in millions)At December 31, 2008 2007
Long-term debt maturing within one year $ 3,506 $ 2,564Commercial paper 1,487 390Total debt maturing within one year $ 4,993 $ 2,954
The weighted average interest rate for our commercial paper at December 31, 2008 and December 31, 2007 was 2.9% and 4.6%, respectively.
Capital expenditures (primarily acquisition and construction of network assets) are partially financed pending long-term financing through bank loans and the issuance of commercial paper payable within 12 months.
At December 31, 2008, we had approximately $5,600 million of unused bank lines of credit which consisted of a three-year committed facility that expires in September 2009. In addition, at December 31, 2008, we had entered into a vendor provided credit facility that provided $150 million of financing capacity. Certain of these lines of credit contain requirements for the payment of commitment fees.
Long-Term DebtOutstanding long-term debt obligations are as follows:
(dollars in millions)At December 31, Interest Rates % Maturities 2008 2007
Notes payable 4.35 – 5.50 2009 – 2018 $ 7,878 $ 5,8725.55 – 6.90 2012 – 2038 8,741 3,5507.25 – 8.95 2009 – 2039 8,822 5,501
Verizon Wireless – notes payable and other 7.38 – 8.88 2011 – 2018 5,983 –LIBOR plus 1.00% 2009 – 2011 4,440 –
Telephone subsidiaries – debentures 4.63 – 7.00 2009 – 2033 9,654 10,5807.15 – 7.88 2012 – 2032 1,449 1,4498.00 – 8.75 2010 – 2031 1,080 1,080
Other subsidiaries – debentures and other 6.84 – 8.75 2009 – 2028 2,200 2,450
Employee stock ownership plan loans – NYNEx debentures 9.55 2010 47 70
Capital lease obligations (average rate 6.2% and 6.8%) 390 312
Unamortized discount, net of premium (219) (97)Total long-term debt, including current maturities 50,465 30,767Less debt maturing within one year (3,506) (2,564)Total long-term debt $ 46,959 $ 28,203

In April 2007, Verizon issued $750 million of 5.50% notes due 2017, $750 million of 6.25% notes due 2037, and $500 million of floating rate notes due 2009 resulting in cash proceeds of $1,977 million, net of discounts and issuance costs. In March 2007, Verizon issued $1,000 million of 13-month floating rate exchangeable notes with an original maturity of 2008. These notes were exchangeable periodically at the option of the note holder into similar notes until 2017. The exchangeable notes were not exchanged and are now due April 2009. In February 2007, Verizon utilized a $425 million floating rate vendor financing facility due 2013.
In January 2007, we redeemed $1,580 million principal of the remaining outstanding floating rate notes due August 15, 2007, at a redemption price equal to 100% of the principal amount of the notes being redeemed plus accrued and unpaid interest through the date of redemption. The total payment on the date of redemption was approximately $1,593 mil-lion. Approximately $1,600 million of other borrowings were redeemed during 2007.
We recorded pretax charges of $26 million ($16 million after-tax) during the first quarter of 2006 resulting from the extinguishment of $5,665 million aggregate principal amount of long-term debt assumed in con-nection with the MCI merger.
Verizon Wireless – Notes Payable and OtherUnless indicated, the following notes were co-issued or co-borrowed by Verizon Wireless and Verizon Wireless Capital LLC. Verizon Wireless Capital LLC is a wholly owned subsidiary of Verizon Wireless. It is a lim-ited liability company formed under the laws of Delaware on December 7, 2001 as a special purpose finance subsidiary to facilitate the offering of debt securities of Verizon Wireless by acting as co-issuer. Other than the financing activities as a co-issuer of Verizon Wireless indebtedness, Verizon Wireless Capital LLC has no material assets, operations or reve-nues. Verizon Wireless is jointly and severally liable with Verizon Wireless Capital LLC for these notes.
On December 18, 2008, Verizon Wireless and Verizon Wireless Capital LLC, co-issued €650 million of 7.625% notes due 2011, €500 million of 8.750% notes due 2015 and £600 million of 8.875% notes due 2018. Concurrent with these offerings, we entered into cross currency swaps to fix our future interest and principal payments in U.S. dollars as well as to exchange the proceeds from British Pound Sterling and Euros into U.S. dollars (see Note 11). The cash proceeds of $2,410 million, net of discounts and issuance costs were used in connection with the Alltel acquisition on January 9, 2009 (see Note 2).
On November 21, 2008, Verizon Wireless and Verizon Wireless Capital LLC co-issued a private placement of $1,250 million of 7.375% notes due 2013 and $2,250 million of 8.500% notes due 2018 resulting in cash proceeds of $3,451 million net of discounts and issuance costs. The net proceeds from the sale of these notes were used in connection with the Alltel acquisition on January 9, 2009 (see Note 2). The co-issuers are required to file a registration statement with respect to an offer to exchange these notes for a new issue of notes registered under the Securities Act of 1933 and use their reasonable best efforts to cause the registration statement to be declared effective within 330 days after the closing of the offering of these notes.
On September 30, 2008, Verizon Wireless and Verizon Wireless Capital LLC entered into a $4,440 million Three-Year Term Loan Facility Agreement (Three-Year Term Facility) with Citibank, N.A., as Administrative Agent, with a maturity date of September 30, 2011. Verizon Wireless borrowed $4,440 million under the Three-Year Term Facility in order to repay a portion of the 364-Day Credit Agreement as described below. Of the $4,440 million, $444 million must be repaid at the end of the first year, $1,998 million at the end of the second year, and $1,998 million upon final maturity. Interest on borrowings under the Three-Year Term Facility is calculated based on the LIBOR rate for the applicable period and a margin that is determined by reference to the long-term credit rating of Verizon Wireless issued by Standard & Poor’s Rating Services and Moody’s Investors Service (if Moody’s subsequently determines to provide a credit rating for the Three-Year Term Facility). Borrowings under the Three-Year Term Facility currently bear interest at a variable rate based on LIBOR plus 100 basis points. The Three-Year Term Facility includes a requirement to maintain a certain leverage ratio.
On June 5, 2008, Verizon Wireless entered into a $7,550 million 364-Day Credit Agreement with Morgan Stanley Senior Funding Inc. as Administrative Agent. During 2008, Verizon Wireless utilized this facility primarily to purchase the Alltel debt obligations acquired in the second quarter and pay fees and expenses incurred in connection therewith, finance the acquisition of Rural Cellular and repay the outstanding Rural Cellular debt and pay fees and expenses incurred in connection there-with. During 2008, the borrowings under the 364-Day Credit Agreement were repaid.
See Note 2 regarding the recent repayment of Alltel debt and related borrowings subsequent to December 31, 2008.
Telephone and Other Subsidiary DebtDuring the fourth quarter of 2008, $200 million of Verizon Northwest 5.55% notes, $250 million 6.9% notes and $250 million 5.65% notes of Verizon North Inc. matured and were repaid. During the second quarter of 2008, $100 million of Verizon California Inc. 7.0% notes and $250 million of Verizon New York Inc. 6.0% notes matured and were repaid. Additionally, during first half of 2008, $250 million of GTE Corporation 6.46% notes and $125 million of Verizon South Inc. 6.0% notes matured and were repaid.
During the fourth quarter of 2007, Verizon New England Inc. redeemed previously guaranteed $480 million 7.0% debentures, Series B, issued by Verizon New England Inc. due 2042 at par plus accrued and unpaid interest to the redemption dates. During the third quarter of 2007, $150 million Verizon Pennsylvania Inc. 7.375% notes matured and were repaid. During the second quarter of 2007, $125 million Verizon New England Inc. 7.65% notes and the $225 million Verizon South Inc. 6.125% notes matured and were repaid. During the first quarter of 2007, $150 million GTE Southwest Inc. 6.23% notes and the $275 million Verizon California Inc. 7.65% notes matured and were repaid. In addition, we redeemed $500 million of GTE Corporation 7.9% debentures due February 1, 2027 and $300 million Verizon South Inc. 7.0% debentures, Series F, due 2041 at par plus accrued and unpaid interest to the redemption dates. During the first quarter of 2007, we recorded pretax charges of $28 million ($18 million after-tax) in connection with the early extinguishments of debt.
56
Notes to Consolidated Financial Statements continued

Notes to Consolidated Financial Statements continued
57
Guarantees We guarantee the debt obligations of GTE Corporation (but not the debt of its subsidiary or affiliate companies) that were issued and out-standing prior to July 1, 2003. As of December 31, 2008, $2,200 million principal amount of these obligations remained outstanding. Verizon Communications Inc. and NYNEx Corporation are the joint and several co-obligors of the 20-Year 9.55% Debentures due 2010 previously issued by NYNEx on March 26, 1990. As of December 31, 2008, $47 million prin-cipal amount of this obligation remained outstanding. NYNEx and GTE no longer issue public debt or file SEC reports.
Debt CovenantsWe and our consolidated subsidiaries are in compliance with all of our debt covenants.
Maturities of Long-Term DebtMaturities of long-term debt outstanding at December 31, 2008 are as follows:
Years (dollars in million)
2009 $ 3,5062010 5,0182011 5,6472012 4,3062013 5,638Thereafter 26,350
NOTE 11
FINANCIAL INSTRUMENTS
DerivativesThe ongoing effect of SFAS No. 133 and related amendments and inter-pretations on our consolidated financial statements will be determined each period by several factors, including the specific hedging instru-ments in place and their relationships to hedged items, as well as market conditions at the end of each period.
Interest Rate Risk ManagementWe have entered into domestic interest rate swaps to achieve a targeted mix of fixed and variable rate debt, where we principally receive fixed rates and pay variable rates based on LIBOR. These swaps are designated as fair value hedges and hedge against changes in the fair value of our debt portfolio. We record the interest rate swaps at fair value in our bal-ance sheet as assets and liabilities and adjust debt for the change in its fair value due to changes in interest rates. During 2008, we entered into domestic interest rate swaps, designated as fair value hedges, with a notional principal value of approximately $2 billion. The fair value of our entire portfolio of interest rate swaps at December 31, 2008 included in Other assets and Long-term debt was $415 million.
Foreign Exchange Risk ManagementDuring 2008, we entered into cross currency swaps designated as cash flow hedges to exchange the net proceeds from the December 18, 2008 Verizon Wireless and Verizon Wireless Capital LLC offering (see Note 10) from British Pound Sterling and Euros into U.S. dollars, to fix our future interest and principal payments in U.S. dollars as well as mitigate the impact of foreign currency transaction gains or losses. We record these contracts at fair value and any gains or losses on the contract will, over time, offset the gains or losses on the underlying debt obligations.
Net Investment HedgesDuring 2007, we entered into foreign currency forward contracts to hedge a portion of our net investment in Vodafone Omnitel. Changes in fair value of these contracts due to Euro exchange rate fluctuations are recognized in Accumulated other comprehensive loss and partially offset the impact of foreign currency changes on the value of our net investment. During 2008, our positions in these foreign currency forward contracts were settled. As of December 31, 2008, Accumulated other comprehensive loss includes unrecognized losses of approximately $166 million ($108 million after-tax) related to these hedge contracts, which along with the unrealized foreign currency translation balance on the investment hedged, remain in Accumulated other comprehensive loss until the investment is sold.
Concentrations of Credit RiskFinancial instruments that subject us to concentrations of credit risk con-sist primarily of temporary cash investments, short-term and long-term investments, trade receivables, certain notes receivable, including lease receivables, and derivative contracts. Our policy is to deposit our tem-porary cash investments with major financial institutions. Counterparties to our derivative contracts are also major financial institutions. The finan-cial institutions have all been accorded high ratings by primary rating agencies. We limit the dollar amount of contracts entered into with any one financial institution and monitor our counterparties’ credit ratings. We generally do not give or receive collateral on swap agreements due to our credit rating and those of our counterparties. While we may be exposed to credit losses due to the nonperformance of our counterpar-

58
ties, we consider the risk remote and do not expect the settlement of these transactions to have a material effect on our results of operations or financial condition.
NOTE 12
FAIR VALUE MEASUREMENTS
The following table presents the balances of assets and liabilities mea-sured at fair value on a recurring basis as of December 31, 2008:
(dollars in millions) Level 1(1) Level 2(2) Level 3 (3) Total
Assets: Short-term investments $ 180 $ 329 $ – $ 509 Investments in
unconsolidated businesses 290 – – 290
Other investments – – 4,781 4,781 Other assets – 1,158 – 1,158
Liabilities: Other liabilities – 59 – 59
(1) quoted prices in active markets for identical assets or liabilities(2) observable inputs other than quoted prices in active markets for identical assets
and liabilities(3) no observable pricing inputs in the market
A reconciliation of the beginning and ending balance of items mea-sured at fair value using significant unobservable inputs as of December 31, 2008 is as follows:
(dollars in millions) Level 3
Balance at January 1, 2008 $ – Total gains (losses) (realized/unrealized): Included in earnings – Included in other comprehensive loss – Purchases, issuances and settlements 4,767 Discount amortization included in earnings 14 Transfers in (out) of Level 3 –Balance at December 31, 2008 $ 4,781
Short-term investments include a fund comprised of cash equivalents held in trust for the payment of certain employee benefits and are classi-fied as Level 2. These temporary cash investments are stated at fair value using matrix pricing as they are not actively traded in an established market. Short-term investments and Investments in unconsolidated businesses also include equity securities, mutual funds, U.S. Treasuries, and obligations of the U.S. government, which are generally measured using quoted prices in active markets and are classified as Level 1.
Other investments are comprised of our investment in Alltel debt, which was acquired in June 2008, and is classified as Level 3. The fair value of the investment in Alltel debt is based upon internally developed valu-ation techniques since the underlying obligations are not registered or traded in an active market. Upon closing of the Alltel acquisition (see Note 2), the investment in Alltel debt became an intercompany loan that will be eliminated in consolidation.
Other assets are primarily comprised of domestic and foreign corporate and government bonds. While quoted prices in active markets for certain of these debt securities are available, for some they are not. As permitted under SFAS No. 157, we use alternative matrix pricing as a practical expedient resulting in our debt securities being classified as Level 2.
Notes to Consolidated Financial Statements continued
Our derivative contracts, included in Other assets or Other liabilities, are primarily comprised of interest rate swaps, are valued using models based on readily observable market parameters for all substantial terms of our derivative contracts and thus are classified within Level 2. As permitted by SFAS No. 157, we use mid-market pricing for fair value measurements of our derivative instruments.
The fair value of our short-term and long-term debt, excluding capital leases, is determined based on market quotes for similar terms and maturities or future cash flows discounted at current rates. The fair value of our long-term and short-term debt, excluding capital leases, was $53,174 million and $32,380 million at December 31, 2008 and 2007, respectively, as compared to the carrying value of $51,562 million and $30,845 million, respectively at December 31, 2008 and 2007.
NOTE 13
EARNINGS PER SHARE AND SHAREOWNERS’ INVESTMENT
Earnings Per ShareThe following table is a reconciliation of the numerators and denomina-tors used in computing earnings per common share:
(dollars and shares in millions, except per share amounts)Years Ended December 31, 2008 2007 2006
Income Before Discontinued Operations, Extraordinary Item and Cumulative Effect of Accounting Change $ 6,428 $ 5,510 $ 5,480
After-tax minority interest expense related to exchangeable equity interest – – 20
After-tax interest expense related to zero-coupon convertible notes – – 11
Income Before Discontinued Operations, Extraordinary Item and Cumulative Effect of Accounting Change – after assumed conversion of dilutive securities $ 6,428 $ 5,510 $ 5,511
Weighted-average shares outstanding – basic 2,849 2,898 2,912
Effect of dilutive securities: Stock options 1 4 1 Exchangeable equity interest – – 18 Zero-coupon convertible notes – – 7Weighted-average shares
outstanding – diluted 2,850 2,902 2,938
Earnings Per Common Share from Income Before Discontinued Operations, Extraordinary Item and Cumulative Effect of Accounting Change
Basic $ 2.26 $ 1.90 $ 1.88Diluted $ 2.26 $ 1.90 $ 1.88
Certain outstanding options to purchase shares were not included in the computation of diluted earnings per common share because they were not dilutive, including approximately 158 million weighted-average shares during 2008, 170 million weighted-average shares during 2007 and 228 million weighted-average shares during 2006.
The zero-coupon convertible notes were retired on May 15, 2006 and the exchangeable equity interest was converted on August 15, 2006 by issuing 29.5 million Verizon shares (see Note 8).

Notes to Consolidated Financial Statements continued
59
The following table summarizes Verizon’s Restricted Stock Unit activity:
(shares in thousands)Restricted
Stock Units
Weighted-Average
Grant-DateFair Value
Outstanding, January 1, 2006 6,869 $ 36.12Granted 9,116 31.88Cancelled/forfeited (392) 35.01Outstanding, December 31, 2006 15,593 33.67Granted 6,779 37.59Payments (602) 36.75Cancelled/forfeited (197) 34.81Outstanding, December 31, 2007 21,573 34.80Granted 7,277 36.64Payments (6,869) 36.06Cancelled/forfeited (161) 35.45Outstanding, December 31, 2008 21,820 35.01
Performance Share UnitsThe Plan also provides for grants of PSUs that generally vest at the end of the third year after the grant. As defined by the Plan, the Human Resources Committee of the Board of Directors determines the number of PSUs a participant earns based on the extent to which the corre-sponding goals have been achieved over the three-year performance cycle. All payments are subject to approval by the Human Resources Committee. The PSUs are classified as liability awards because the PSU awards are paid in cash upon vesting. The PSU award liability is measured at its fair value at the end of each reporting period and, therefore, will fluctuate based on the price of Verizon’s stock as well as performance relative to the targets. Dividend equivalent units are also paid to partici-pants at the time that the PSU award is determined and paid, and in the same proportion as the PSU award.
The following table summarizes Verizon’s Performance Share Unit activity:
(shares in thousands) Performance
Share Units
Weighted-Average
Grant-Date Fair Value
Outstanding, January 1, 2006 19,091 $ 36.84Granted 14,166 32.05Payments (3,607) 38.54Cancelled/forfeited (1,227) 37.25Outstanding, December 31, 2006 28,423 34.22Granted 10,371 37.59Payments (5,759) 36.75Cancelled/forfeited (900) 36.18Outstanding, December 31, 2007 32,135 34.80Granted 11,194 36.64Payments (7,597) 36.06Cancelled/forfeited (2,518) 36.00Outstanding, December 31, 2008 33,214 35.04
As of December 31, 2008, unrecognized compensation expense related to the unvested portion of Verizon’s RSUs and PSUs was approximately $308 million and is expected to be recognized over a weighted-average period of approximately two years.
Shareowners’ InvestmentOur certificate of incorporation provides authority for the issuance of up to 250 million shares of Series Preferred Stock, $.10 par value, in one or more series, with such designations, preferences, rights, qualifications, limitations and restrictions as the Board of Directors may determine.
We are authorized to issue up to 4.25 billion shares of common stock.
On February 7, 2008, the Board of Directors approved a share buy back program which authorized the repurchase of up to 100 million shares of Verizon common stock terminating no later than the close of busi-ness on February 28, 2011. During 2008, 2007 and 2006, we repurchased approximately 37 million, 68 million and 50 million common shares under programs previously authorized by the Board of Directors.
NOTE 14
STOCK-BASED COMPENSATION
Refer to Note 1 for a discussion of the adoption of SFAS No. 123(R), which was effective January 1, 2006.
Verizon Communications Long Term Incentive PlanThe Verizon Communications Long Term Incentive Plan (the Plan), per-mits the granting of nonqualified stock options, incentive stock options, restricted stock, restricted stock units, performance shares, performance share units and other awards. The maximum number of shares for awards is 207 million.
Restricted Stock UnitsThe Plan provides for grants of RSUs that generally vest at the end of the third year after the grant. The RSUs are classified as liability awards because they will be paid in cash upon vesting. The RSU award liability is measured at its fair value at the end of each reporting period and, there-fore, will fluctuate based on the performance of Verizon’s stock. Dividend equivalent units are also paid to participants at the time the RSU award is paid.

60
Notes to Consolidated Financial Statements continued
Verizon Wireless’s Long-Term Incentive PlanThe 2000 Verizon Wireless Long-Term Incentive Plan (the Wireless Plan) provides compensation opportunities to eligible employees and other participating affiliates of Verizon Wireless (the Partnership). The Wireless Plan provides rewards that are tied to the long-term performance of the Partnership. Under the Wireless Plan, VARs were granted to eligible employees. As of December 31, 2008, all VARs were fully vested.
VARs reflect the change in the value of the Partnership, as defined in the Wireless Plan, similar to stock options. Once VARs become vested, employees can exercise their VARs and receive a payment that is equal to the difference between the VAR price on the date of grant and the VAR price on the date of exercise, less applicable taxes. VARs are fully exercisable three years from the date of grant with a maximum term of 10 years. All VARs are granted at a price equal to the estimated fair value of the Partnership, as defined in the Wireless Plan, at the date of the grant.
With the adoption of SFAS No. 123(R), the Partnership began estimating the fair value of VARs granted using a Black-Scholes option valuation model. The following table summarizes the assumptions used in the model during 2008:
Ranges
Risk-free rate 0.6% – 3.3%Expected term (in years) 1.2 – 3.0Expected volatility 33.9% – 58.5%
The risk-free rate is based on the U.S. Treasury yield curve in effect at the time of the measurement date. The expected term of the VARs granted was estimated using a combination of the simplified method historical experience, and management judgment. Expected volatility was based on a blend of the historical and implied volatility of publicly traded peer companies for a period equal to the VARs expected life, ending on the measurement date, and calculated on a monthly basis.
The following table summarizes the Value Appreciation Rights activity:
(shares in thousands) VARs
Weighted-Average
Grant-Date Fair Value
Outstanding rights, January 1, 2006 108,923 $ 17.12Exercised (7,448) 13.00Cancelled/forfeited (7,008) 23.25Outstanding rights, December 31, 2006 94,467 16.99Exercised (30,848) 15.07Cancelled/forfeited (3,207) 24.55Outstanding rights, December 31, 2007 60,412 17.58Exercised (31,817) 18.47Cancelled/forfeited (351) 19.01Outstanding rights, December 31, 2008 28,244 16.54
Stock-Based Compensation ExpenseAfter-tax compensation expense for stock-based compensation related to RSUs, PSUs, and VARs described above included in net income as reported was $375 million, $750 million and $535 million for 2008, 2007 and 2006, respectively.
Stock OptionsThe Verizon Long Term Incentive Plan provides for grants of stock options to employees at an option price per share of 100% of the fair market value of Verizon Stock on the date of grant. Each grant has a 10 year life, vesting equally over a three year period, starting at the date of the grant. We have not granted new stock options since 2004.
The following table summarizes Verizon’s stock option activity:
(shares in thousands) Stock
Options
Weighted- Average Exercise
Price
Outstanding, January 1, 2006 259,760 $ 46.01Exercised (3,371) 32.12Cancelled/forfeited (27,025) 43.72Outstanding, December 31, 2006 229,364 46.48Exercised (33,079) 38.50Cancelled/forfeited (21,422) 48.26Outstanding, December 31, 2007 174,863 47.78Exercised (218) 38.00Cancelled/forfeited (39,878) 48.13Options outstanding, December 31, 2008 134,767 47.69
Options exercisable, December 31, 2006 225,067 46.69 2007 174,838 47.78 2008 134,767 47.69
The following table summarizes information about Verizon’s stock options outstanding as of December 31, 2008:
Range of Exercise Prices
Shares (in thousands)
Weighted-Average
Remaining Life
Weighted-Average
Exercise Price
$ 20.00 – 29.99 24 3.7 years $ 27.8630.00 – 39.99 19,327 4.6 36.4140.00 – 49.99 54,190 2.2 44.0350.00 – 59.99 60,884 1.1 54.4660.00 - 69.99 342 0.8 60.48
Total 134,767 2.1 47.69
The total intrinsic value for stock options outstanding was not signifi-cant as of December 31, 2008. The total intrinsic value for stock options exercised was $147 million in 2007 and not significant in 2008 and 2006. The amount of cash received from the exercise of stock options was not significant in 2008, $1,274 million in 2007 and $101 million in 2006, respectively. The related tax benefits were not significant. The after-tax compensation expense for stock options was not significant for 2007 and 2006. There was no stock option expense for 2008.

Notes to Consolidated Financial Statements continued
61
NOTE 15
EMPLOYEE BENEFITS
We maintain non-contributory defined benefit pension plans for many of our employees. In addition, we maintain postretirement health care and life insurance plans for our retirees and their dependents, which are both contributory and non-contributory and include a limit on the Company’s share of cost for certain recent and future retirees. We also sponsor defined contribution savings plans to provide opportunities for eligible employees to save for retirement on a tax-deferred basis. We use a measurement date of December 31 for our pension and postretire-ment health care and life insurance plans.
Refer to Note 1 for a discussion of the adoption of SFAS No. 158, which was effective December 31, 2006.
Pension and Other Postretirement BenefitsPension and other postretirement benefits for many of our employees are subject to collective bargaining agreements. Modifications in bene-fits have been bargained from time to time, and we may also periodically amend the benefits in the management plans.
As of June 30, 2006, Verizon management employees no longer earned pension benefits or earned service towards the company retiree medical subsidy. In addition, new management employees hired after December 31, 2005 are not eligible for pension benefits and managers with less than 13.5 years of service as of June 30, 2006 are not eligible for com-pany-subsidized retiree healthcare or retiree life insurance benefits. Beginning July 1, 2006, management employees receive an increased company match on their savings plan contributions.
The following tables summarize benefit costs, as well as the benefit obli-gations, plan assets, funded status and rate assumptions associated with pension and postretirement health care and life insurance benefit plans:
Obligations and Funded Status (dollars in millions) Pension Health Care and LifeAt December 31, 2008 2007 2008 2007
Change in Benefit Obligations
Beginning of year $ 32,495 $ 34,159 $ 27,306 $ 27,330Service cost 382 442 306 354Interest cost 1,966 1,975 1,663 1,592Plan amendments 300 – 24 –Actuarial (gain) loss, net (154) 123 (483) (409)Benefits paid (2,577) (4,204) (1,529) (1,561)Termination benefits 32 – 7 –Curtailment gain – – (29) –Acquisitions and
divestitures, net (183) – (169) –Settlements (1,867) – – –End of year $ 30,394 $ 32,495 $ 27,096 $ 27,306
Change in Plan Assets Beginning of year $ 42,659 $ 41,509 $ 4,142 $ 4,303Actual return on plan assets (10,680) 4,591 (1,285) 352Company contributions 487 737 1,227 1,048Benefits paid (2,577) (4,204) (1,529) (1,561)Settlements (1,867) – – –Acquisitions and
divestitures, net (231) 26 – –End of year $ 27,791 $ 42,659 $ 2,555 $ 4,142
Funded Status End of year $ (2,603) $ 10,164 $ (24,541) $ (23,164)
Amounts recognized on the balance sheet
Noncurrent assets $ 3,132 $ 13,745 $ – $ – Current liabilities (122) (130) (496) (360) Noncurrent liabilities (5,613) (3,451) (24,045) (22,804) Total $ (2,603) $ 10,164 $ (24,541) $ (23,164)
Amounts recognized in Accumulated Other Comprehensive Loss (Pretax)
Actuarial loss, net $ 13,296 $ 13 $ 6,848 $ 6,040 Prior service cost 1,162 932 3,235 3,636Total $ 14,458 $ 945 $ 10,083 $ 9,676
Changes in benefit obligations were caused by factors including changes in actuarial assumptions and settlements.
The accumulated benefit obligation for all defined benefit pension plans was $29,405 million and $31,343 million at December 31, 2008 and 2007, respectively.
Information for pension plans with an accumulated benefit obligation in excess of plan assets follows:
(dollars in millions)At December 31, 2008 2007
Projected benefit obligation $ 27,171 $ 11,001Accumulated benefit obligation 26,641 10,606Fair value of plan assets 21,436 8,868
During 2008, the decline in the fair value of pension assets increased the number of plans having accumulated benefit obligations in excess of plan assets as of December 31, 2008 compared to December 31, 2007.

Notes to Consolidated Financial Statements continued
62
Net Periodic CostThe following table displays the details of net periodic pension and other postretirement costs:
(dollars in millions) Pension Health Care and LifeYears Ended December 31, 2008 2007 2006 2008 2007 2006
Service cost $ 382 $ 442 $ 581 $ 306 $ 354 $ 356Interest cost 1,966 1,975 1,995 1,663 1,592 1,499Expected return on plan assets (3,187) (3,175) (3,173) (321) (317) (328)Amortization of prior service cost 62 43 44 395 392 360Actuarial loss, net 40 98 182 222 316 290Net periodic benefit (income) cost (737) (617) (371) 2,265 2,337 2,177Termination benefits 32 – 47 7 – 14Settlement loss 364 – 56 – – –Curtailment loss and other, net – – – 24 – –Subtotal 396 – 103 31 – 14Total (income) cost $ (341) $ (617) $ (268) $ 2,296 $ 2,337 $ 2,191
Other pretax changes in plan assets and benefit obligations recognized in other comprehensive (income) loss are as follows: (dollars in millions)
Pension Health Care and LifeAt December 31, 2008 2007 2008 2007
Other changes in plan assets and benefit obligations recognized in other comprehensive (income) loss (pretax)
Actuarial (gain) loss, net $ 13,686 $ (1,317) $ 1,030 $ (444)Prior service cost 293 – (6) –Reversal of amortization items: Prior service cost (62) (43) (395) (392) Actuarial loss, net (404) (98) (222) (316)Total recognized in other comprehensive (income) loss (pretax) $ 13,513 $ (1,458) $ 407 $ (1,152)
The estimated net loss and prior service cost for the defined benefit pension plans that will be amortized from Accumulated other com-prehensive loss into net periodic benefit cost over the next fiscal year are $114 million and $112 million, respectively. The estimated net loss and prior service cost for the defined benefit postretirement plans that will be amortized from Accumulated other comprehensive loss into net periodic benefit cost over the next fiscal year are $238 million and $401 million, respectively.
Additional InformationAs a result of the adoption of SFAS No. 158 in 2006, we no longer record an additional minimum pension liability. In prior years, as a result of changes in interest rates and changes in investment returns, an adjust-ment to the additional minimum pension liability was required for a number of plans, as indicated below. The adjustment in the liability was recorded as a charge or (credit) to Accumulated other comprehensive loss, net of tax, in shareowners’ investment in the consolidated balance sheets. The Additional Minimum Pension Liability at December 31, 2006, was reduced by $809 million, ($526 million after-tax) based on the final measurement just prior to the adoption of SFAS No. 158. The remaining $396 million, ($262 million after-tax), was reversed as a result of the adoption of SFAS No. 158.
(dollars in millions)Years Ended December 31, 2008 2007 2006
Decrease in minimum liability included in other comprehensive income, net of tax $ – $ – $ (526)

Notes to Consolidated Financial Statements continued
63
AssumptionsThe weighted-average assumptions used in determining benefit obligations follow:
Pension Health Care and LifeAt December 31, 2008 2007 2008 2007
Discount rate 6.75% 6.50% 6.75% 6.50%Rate of compensation increases 4.00 4.00 N/A 4.00
The weighted-average assumptions used in determining net periodic cost follow:
Pension Health Care and LifeYears Ended December 31, 2008 2007 2006 2008 2007 2006
Discount rate 6.50% 6.00% 5.75% 6.50% 6.00% 5.75%Expected return on plan assets 8.50 8.50 8.50 8.25 8.25 8.25 Rate of compensation increase 4.00 4.00 4.00 4.00 4.00 4.00
Plan AssetsPension PlansThe weighted-average asset allocations for the pension plans by asset category follow:
At December 31, 2008 2007
Asset Category Equity securities 46% 59%Debt securities 20 18 Real estate 9 6 Other 25 17 Total 100% 100%
Equity securities include Verizon common stock of $87 million and $127 million at December 31, 2008 and 2007, respectively. Other assets include cash and cash equivalents (primarily held for the payment of benefits), private equity and investments in absolute return strategies.
Health Care and Life PlansThe weighted-average asset allocations for the other postretirement benefit plans by asset category follow:
At December 31, 2008 2007
Asset Category Equity securities 67% 74%Debt securities 26 21 Other 7 5 Total 100% 100%
In our health care and life plans, there was not a significant amount of Verizon common stock held at the end of 2008 and none in 2007.
Our portfolio strategy emphasizes a long-term equity orientation, significant global diversification, the use of both public and private investments and professional financial and operational risk controls. Assets are allocated according to long-term risk and return estimates. Both active and passive management approaches are used depending on perceived market efficiencies and various other factors.
In order to project the long-term target investment return for the total portfolio, estimates are prepared for the total return of each major asset class over the subsequent 10-year period, or longer. Those estimates are based on a combination of factors including the current market interest rates and valuation levels, consensus earnings expectations, historical long-term risk premiums and value-added. To determine the aggregate return for the pension trust, the projected return of each individual asset class is then weighted according to the allocation to that investment area in the trust’s long-term asset allocation policy.
The assumed Health Care Cost Trend Rates follow:
Health Care and LifeAt December 31, 2008 2007 2006
Health care cost trend rate assumed for next year 9.00% 10.00% 10.00%
Rate to which cost trend rate gradually declines 5.00 5.00 5.00
Year the rate reaches level it is assumed to remain thereafter 2014 2013 2011
A one-percentage-point change in the assumed health care cost trend rate would have the following effects:
(dollars in millions)One-Percentage-Point Increase Decrease
Effect on 2008 service and interest cost $ 279 $ ( 224)Effect on postretirement benefit obligation as of
December 31, 2008 2,891 (2,399)

64
Notes to Consolidated Financial Statements continued
Cash FlowsIn 2008, we contributed $332 million to our qualified pension plans, $155 million to our nonqualified pension plans and $1,227 million to our other postretirement benefit plans. We estimate required qualified pension plan contributions for 2009 to be approximately $300 million. We also anticipate approximately $120 million in contributions to our non-qualified pension plans and $1,770 million to our other postretire-ment benefit plans in 2009.
Estimated Future Benefit PaymentsThe benefit payments to retirees, which reflect expected future service, are expected to be paid as follows: (dollars in millions)
Pension Benefits
Health Care and Life Prior to Medicare
PrescriptionDrug Subsidy
Expected Medicare Prescription
Drug Subsidy
2009 $ 4,101 $ 1,979 $ 89 2010 3,110 2,085 99 2011 2,769 2,174 109 2012 2,324 2,195 122 2013 2,338 2,221 134 2014 – 2018 11,292 10,928 837
Savings Plan and Employee Stock Ownership PlansWe maintain four leveraged employee stock ownership plans (ESOP). Only one plan currently has unallocated shares. We match a certain per-centage of eligible employee contributions to the savings plans with shares of our common stock from this ESOP. At December 31, 2008, the number of unallocated and allocated shares of common stock in this ESOP were 3 million and 68 million, respectively. All leveraged ESOP shares are included in earnings per share computations.
Total savings plan costs were $683 million, $712 million, and $669 mil-lion in 2008, 2007 and 2006, respectively.
Severance BenefitsThe following table provides an analysis of our severance liability recorded in accordance with SFAS No. 112, Employers’ Accounting for Postemployment Benefits (SFAS No. 112):
(dollars in millions)
YearBeginning
of YearCharged to
Expense Payments Other End of Year
2006 $ 596 $ 343 $ (383) $ 88 $ 6442007 644 743 (363) – 1,0242008 1,024 570 (509) 19 1,104
The remaining severance liability is actuarially determined and includes the impact of the activities described in “Severance, Pension and Benefit Related Charges” below. The 2008 expense includes charges for the involuntary separation of approximately 8,600 employees, including approximately 800 during the fourth quarter of 2008 and 5,100 expected during 2009. The 2007 expense includes charges for the involuntary sep-aration of 9,000 employees as described below.
Severance, Pension and Benefit Related ChargesDuring 2008, we recorded net pretax severance, pension and benefits charges of $950 million ($588 million after-tax). This charge primarily included $586 million ($363 million after-tax) for workforce reductions in connection with the separation of approximately 8,600 employees and related charges; 3,500 of whom were separated in the second half of 2008, with the remaining reductions expected to occur in 2009, in accordance with SFAS No. 112. Also included are net pretax pension settlement losses of $364 million ($225 million after-tax) related to employees that received lump-sum distributions primarily resulting from our separation plans. These charges were recorded in accordance with SFAS No. 88, Employers’ Accounting for Settlements and Curtailments of Defined Benefit Pension Plans and for Termination Benefits (SFAS No. 88), which requires that settlement losses be recorded once prescribed pay-ment thresholds have been reached.
During the fourth quarter of 2007, we recorded charges of $772 million ($477 million after-tax) primarily in connection with workforce reductions of 9,000 employees and related charges, 4,000 of whom were separated in the fourth quarter of 2007 with the remaining reductions occurring throughout 2008. In addition, we adjusted our actuarial assumptions for severance to align with future expectations.
During 2006, we recorded net pretax severance, pension and benefits charges of $425 million ($258 million after-tax). These charges included net pretax pension settlement losses of $56 million ($26 million after-tax) related to employees that received lump-sum distributions primarily resulting from our separation plans. These charges were recorded in accordance with SFAS No. 88. Also included are pretax charges of $369 million ($228 million after-tax) for employee severance and sev-erance-related costs in connection with the involuntary separation of approximately 4,100 employees.

Notes to Consolidated Financial Statements continued
65
NOTE 16
INCOME TAxES
The components of Income Before Provision for Income Taxes, Discontinued Operations, Extraordinary Item and Cumulative Effect of Accounting Change are as follows:
(dollars in millions)Years Ended December 31, 2008 2007 2006
Domestic $ 8,838 $ 8,508 $ 7,000Foreign 921 984 1,154
$ 9,759 $ 9,492 $ 8,154
The components of the provision for income taxes from continuing operations are as follows:
(dollars in millions)Years Ended December 31, 2008 2007 2006
Current Federal $ 365 $ 2,568 $ 2,364 Foreign 240 461 141 State and local 543 545 421
1,148 3,574 2,926Deferred Federal 2,214 397 (9) Foreign (91) 66 (45) State and local 66 (48) (191)
2,189 415 (245)Investment tax credits (6) (7) (7)Total income tax expense $ 3,331 $ 3,982 $ 2,674
The following table shows the principal reasons for the difference between the effective income tax rate and the statutory federal income tax rate:
Years Ended December 31, 2008 2007 2006
Statutory federal income tax rate 35.0 % 35.0 % 35.0 %State and local income tax, net of federal tax
benefits 4.1 3.4 1.8Distributions from foreign investments (0.8) 5.9 –Equity in earnings from unconsolidated
businesses (2.4) (2.3) (3.8)Other, net (1.8) – (0.2)Effective income tax rate 34.1 % 42.0 % 32.8 %
The effective income tax rate is the provision for income taxes as a per-centage of income from continuing operations before the provision for income taxes. The effective income tax rate in 2008 was lower than 2007 primarily due to recording $610 million of foreign and domestic taxes and expenses in 2007 specifically relating to our share of Vodafone Omnitel’s distributable earnings. Verizon received net distributions from Vodafone Omnitel in April 2008 and December 2007 of approximately $670 million and $2,100 million, respectively.
The effective income tax rate in 2007 compared to 2006 was higher primarily due to taxes recorded in 2007 related to distributions from Vodafone Omnitel as discussed above. The 2007 rate was also increased due to higher state taxes in 2007 as compared to 2006, as well as greater benefits from foreign operations in 2006 compared to 2007. These increases were partially offset by lower expenses recorded for unrecog-nized tax benefits in 2007 as compared to 2006.
Deferred taxes arise because of differences in the book and tax bases of certain assets and liabilities. Significant components of deferred tax are shown in the following table:
(dollars in millions)At December 31, 2008 2007
Employee benefits $ 13,174 $ 7,067Tax loss and credit carry forwards 2,634 2,711Uncollectible accounts receivable 341 400Other – assets 953 852
17,102 11,030Valuation allowance (2,995) (2,944)Deferred tax assets 14,107 8,086
Former MCI intercompany accounts receivable basis difference 1,818 1,977
Depreciation 8,157 7,045Leasing activity 2,218 2,307Wireless joint venture including wireless licenses 12,957 11,634Other – liabilities 823 349Deferred tax liabilities 25,973 23,312Net deferred tax liability $ 11,866 $ 15,226
Employee benefits deferred tax assets include $10,344 million and $4,929 million at December 31, 2008 and 2007, respectively, recognized in accordance with SFAS No. 158 (see Notes 1 and 15).
At December 31, 2008, undistributed earnings of our foreign subsid-iaries indefinitely invested outside of the United States amounted to approximately $800 million. We have not provided deferred taxes on these earnings because we intend that they will remain indefinitely invested outside of the United States. Determination of the amount of unrecognized deferred taxes related to these undistributed earnings is not practical.
At December 31, 2008, we had tax loss and credit carry forwards for income tax purposes of approximately $3,000 million. Of these tax loss and credit carry forwards, approximately $2,420 million will expire between 2009 and 2028 and approximately $580 million may be carried forward indefinitely. The amount of tax loss and credit carry forwards reflected as a deferred tax asset above has been reduced by approxi-mately $614 million and $661 million at December 31, 2008 and 2007, respectively, due to federal and state tax law limitations on utilization of net operating losses.
During 2008, the valuation allowance increased $51 million. Beginning January 1, 2009, due to the issuance of SFAS No. 141(R), the valuation allowance as of December 31, 2008, if recognized, will be reflected in income tax expense.

66
Notes to Consolidated Financial Statements continued
FASB Interpretation No. 48FIN 48 prescribes the recognition, measurement and disclosure standards for uncertainties in income tax positions. A reconciliation of the beginning and ending balance of unrecognized tax benefits is as follows:
(dollars in millions)2008 2007
Balance at January 1, $ 2,883 $ 2,958Additions based on tax positions related
to the current year 251 141Additions for tax positions of prior years 344 291Reductions for tax positions of prior years (651) (420)Settlements (126) (11)Lapses of statutes of limitations (79) (76)Balance at December 31, $ 2,622 $ 2,883
Included in the total unrecognized tax benefits at December 31, 2008 and 2007 is $1,631 million and $1,245 million, respectively, that if recog-nized, would favorably affect the effective income tax rate. Of the $1,631 million at December 31, 2008, $383 million of unrecognized tax benefits are from a prior acquisition and pursuant to SFAS No. 141(R), if recog-nized, would favorably affect the effective income tax rate.
We recognize any interest and penalties accrued related to unrecog-nized tax benefits in income tax expense. During 2008 we recognized a net after tax benefit in the income statement related to interest and penalties of approximately $55 million. We had approximately $538 mil-lion (after-tax) and $598 million (after-tax) for the payment of interest and penalties accrued in the balance sheets at December 31, 2008 and December 31, 2007, respectively.
During the year ended December 31, 2007, we recognized approximately $175 million (after-tax) in the income statement for the payment of interest and penalties. We had approximately $598 million (after-tax) and $444 million (after-tax) for the payment of interest and penalties accrued in the balance sheet at December 31, 2007 and January 1, 2007, respectively.
Verizon or one of its subsidiaries files income tax returns in the U.S. fed-eral jurisdiction, and various state, local and foreign jurisdictions. The Company is generally no longer subject to U.S. federal, state and local, or non-U.S. income tax examinations by tax authorities for years before 2004. The Internal Revenue Service (IRS) will begin its examination of the Company’s U.S. income tax returns for years 2004 through 2006 in the first quarter of 2009. As a result of the anticipated resolution of various income tax audits within the next twelve months, we believe that it is reasonably possible that the amount of unrecognized tax benefits will decrease. An estimate of the range of the possible change cannot be made until issues are further developed.
NOTE 17
SEGMENT INFORMATION
Reportable SegmentsWe have two reportable segments, which we operate and manage as strategic business units and organize by products and services. We previously measured and evaluated our reportable segments based on segment income. Beginning in 2008, we measure and evaluate our reportable segments based on segment operating income, which is reflected in all periods presented. The use of segment operating income is consistent with the chief operating decision makers’ assessment of segment performance.
Corporate, eliminations and other includes unallocated corporate expenses, intersegment eliminations recorded in consolidation, the results of other businesses such as our investments in unconsolidated businesses, lease financing, and other adjustments and gains and losses that are not allocated in assessing segment performance due to their non-recurring or non-operational nature. Although such transactions are excluded from the business segment results, they are included in reported consolidated earnings. Gains and losses that are not individually significant are included in all segment results, since these items are included in the chief operating decision makers’ assessment of segment performance.
The below reconciliation of segment operating revenues and expenses to consolidated operating revenues and expenses also include those items of a non-recurring or non-operational nature. We exclude from segment results the effects of certain items that management does not consider in assessing segment performance, primarily because of their non-recurring or non-operational nature.
In 2008, we completed the spin-off of our local exchange and related business assets in Maine, New Hampshire and Vermont. Accordingly, Wireline results from divested operations, including the impact of the non strategic assets sold during the first quarter of 2007, have been reclassified to Corporate and Other and reflect comparable operating results. In 2007, we completed the sale of our 52% interest in TELPRI and our interest in CANTV. In 2006, we closed the sale of Verizon Dominicana. Consequently, with these three transactions, we completed the disposi-tion of our International segment. Also in 2006, we completed the spin-off of our Information Services segment which included our domestic print and Internet yellow pages directories business. For further information concerning the disposition of the International and Information Services segments, see Note 3.
Our segments and their principal activities consist of the following:
Segment Description
Domestic Wireless Domestic Wireless’s products and services include wire-less voice, data services and other value-added services and equipment sales across the United States.
Wireline Wireline’s communications services include voice, Internet access, broadband video and data, next genera-tion Internet Protocol network services, network access, long distance and other services. We provide these ser-vices to consumers, carriers, businesses and government customers both in the United States and internationally in 150 countries.

Notes to Consolidated Financial Statements continued
67
The following table provides operating financial information for our two reportable segments:(dollars in millions)
2008 Domestic Wireless Wireline Total Segments
External revenues $ 49,226 $ 46,978 $ 96,204Intersegment revenues 106 1,236 1,342 Total operating revenues 49,332 48,214 97,546Cost of services and sales 15,660 24,274 39,934Selling, general & administrative expense 14,273 11,047 25,320Depreciation & amortization expense 5,405 9,031 14,436 Total operating expenses 35,338 44,352 79,690Operating income $ 13,994 $ 3,862 $ 17,856
Assets $ 111,979 $ 90,386 $ 202,365Plant, property and equipment, net 27,136 58,287 85,423Capital expenditures 6,510 9,797 16,307
2007
External revenues $ 43,777 $ 47,889 $ 91,666Intersegment revenues 105 1,240 1,345 Total operating revenues 43,882 49,129 93,011Cost of services and sales 13,456 24,181 37,637Selling, general & administrative expense 13,477 11,527 25,004Depreciation & amortization expense 5,154 8,927 14,081 Total operating expenses 32,087 44,635 76,722Operating income $ 11,795 $ 4,494 $ 16,289
Assets $ 83,755 $ 92,264 $ 176,019Plant, property and equipment, net 25,971 58,702 84,673Capital expenditures 6,503 10,956 17,459
2006
External revenues $ 37,930 $ 48,352 $ 86,282Intersegment revenues 113 1,152 1,265 Total operating revenues 38,043 49,504 87,547Cost of services and sales 11,491 23,806 35,297Selling, general & administrative expense 12,039 11,998 24,037Depreciation & amortization expense 4,913 9,309 14,222 Total operating expenses 28,443 45,113 73,556Operating income $ 9,600 $ 4,391 $ 13,991
Assets $ 81,989 $ 92,274 $ 174,263Plant, property and equipment, net 24,659 57,031 81,690Capital expenditures 6,618 10,259 16,877

68
Notes to Consolidated Financial Statements continued
Reconciliation To Consolidated Financial Information A reconciliation of the segment operating revenues and expenses to the consolidated operating revenues and expenses is as follows:
(dollars in millions)2008 2007 2006
Operating RevenuesTotal reportable segments $ 97,546 $ 93,011 $ 87,547Reconciling items: Impact of dispositions and operations sold 258 1,094 1,191Corporate, eliminations and other (450) (636) (556)Consolidated operating revenues – reported $ 97,354 $ 93,469 $ 88,182
Operating ExpensesTotal reportable segments $ 79,690 $ 76,722 $ 73,556Reconciling items: Merger integration costs (see Note 2) 174 178 232 Access line spin-off related charges (see Note 3) 103 84 – Taxes on foreign distributions (see Note 7) – 15 – Verizon Center relocation (see Note 6) – – 184 Severance, pension and benefit charges, net (see Note 15) 950 772 425 Impact of disposition and operations sold (see Note 3) 214 912 1,016 Verizon Foundation contribution (see Note 3) – 100 –Corporate, eliminations and other (661) (892) (604)Consolidated operating expenses – reported $ 80,470 $ 77,891 $ 74,809
A reconciliation of the total of the reportable segments’ operating income to consolidated Income Before Provision for Income Taxes, Discontinued Operations, Extraordinary Item and Cumulative Effect of Accounting Change is as follows:
(dollars in millions)2008 2007 2006
Operating Income Total segment operating income $ 17,856 $ 16,289 $ 13,991Total reconciling items (1,183) (967) (666)Corporate, eliminations and other 211 256 48Consolidated operating income – reported $ 16,884 $ 15,578 $ 13,373
Equity in earnings of unconsolidated businesses 567 585 773Other income and (expense), net 282 211 395Interest expense (1,819) (1,829) (2,349)Minority interest (6,155) (5,053) (4,038)Income Before Provision for Income Taxes, Discontinued Operations, Extraordinary item and Cumulative Effect of Accounting Change $ 9,759 $ 9,492 $ 8,154
AssetsTotal reportable segments $ 202,365 $ 176,019 $ 174,263Corporate, eliminations and other (13) 10,940 14,541Total consolidated – reported $ 202,352 $ 186,959 $ 188,804
We generally account for intersegment sales of products and services and asset transfers at current market prices. We are not dependent on any single customer. International operating revenues and long-lived assets are not significant.

69
Notes to Consolidated Financial Statements continued
NOTE 18
COMPREHENSIVE INCOME
Comprehensive income (loss) consists of net income and other gains and losses affecting shareowners’ investment that, under GAAP, are excluded from net income. Significant changes in the components of Other comprehensive income (loss), net of income tax expense (ben-efit), are described below.
Foreign Currency Translation
(dollars in millions)Years Ended December 31, 2008 2007 2006
Foreign Currency Translation Adjustments:
Vodafone Omnitel $ (119) $ 397 $ 330CANTV – 412 –Verizon Dominicana – – 786Other international operations (112) 29 80
$ (231) $ 838 $ 1,196
Net Unrealized Gains (Losses) on Cash Flow HedgesThe changes in Unrealized Gains (Losses) on Cash Flow Hedges were as follows:
(dollars in millions)Years Ended December 31, 2008 2007 2006
Unrealized Gains (Losses) on Cash Flow Hedges
Unrealized gains (losses), net of taxes $ (43) $ (2) $ 11Less reclassification adjustments
for losses realized in net income, net of taxes (3) (3) (3)
Net unrealized gains (losses) on cash flow hedges $ (40) $ 1 $ 14
Unrealized Gains (Losses) on Marketable SecuritiesThe changes in Unrealized Gains (Losses) on Marketable Securities were as follows:
(dollars in millions)Years Ended December 31, 2008 2007 2006
Unrealized Gains (Losses) on Marketable Securities
Unrealized gains (losses), net of taxes $ (142) $ 13 $ 79 Less reclassification adjustments
for gains (losses) realized in net income, net of taxes (45) 17 25
Net unrealized gains (losses) on marketable securities $ (97) $ (4) $ 54
Accumulated Other Comprehensive LossThe components of Accumulated Other Comprehensive Loss are as follows:
(dollars in millions)At December 31, 2008 2007
Foreign currency translation adjustments $ 936 $ 1,167Net unrealized losses on hedging (50) (10)Unrealized gains (losses) on marketable securities (37) 60Defined benefit pension and postretirement plans (14,221) (5,723)Accumulated Other Comprehensive Loss $ (13,372) $ (4,506)
Foreign Currency Translation AdjustmentsThe change in foreign currency translation adjustments at December 31, 2008 was primarily driven by the settlement of the foreign currency forward contracts which hedged a portion of our net investment in Vodafone Omnitel (see Note 11) and the devaluation of the Euro. During 2007 we sold our interest in CANTV. During 2006 we sold our interest in Verizon Dominicana. See Note 3 for information on CANTV and Verizon Dominicana.
Defined Benefit Pension and Postretirement PlansThe change in defined benefit pension and postretirement plans of $8.5 billion, net of taxes of $5.4 billion, at December 31, 2008 was attrib-utable to the change in the funded status of the plans in connection with the annual pension and postretirement valuation in accordance with SFAS No. 158. The funded status was impacted by changes in asset performance, actuarial assumptions, and plan experience. In addition to the pension and postretirement items, we recorded a reduction to the beginning balance of Accumulated other comprehensive loss of $79 million ($44 million after-tax) in connection with the spin-off of our local exchange and related business assets in Maine, New Hampshire and Vermont.

70
Notes to Consolidated Financial Statements continued
Cash Flow Information
(dollars in millions)Years Ended December 31, 2008 2007 2006
Cash PaidIncome taxes, net of amounts refunded $ 1,206 $ 2,491 $ 3,299Interest, net of amounts capitalized 1,664 1,682 2,103
Supplemental Investing and Financing Transactions
Cash acquired in business combinations 397 17 2,361Assets acquired in business combinations 2,803 589 18,511Liabilities assumed in business
combinations 384 154 7,813Debt assumed in business combinations 1,505 – 6,169Shares issued to Price to acquire limited
partnership interest in VZ East (Note 8) – – 1,007
Other, net cash provided by operating activities – continuing operations primarily included the add back of the minority interest’s share of Verizon Wireless earnings, net of dividends paid to minority partners, of $5,218 million in 2008, $3,953 million in 2007 and $3,232 million in 2006.
NOTE 20
COMMITMENTS AND CONTINGENCIES
Several state and federal regulatory proceedings may require our tele-phone operations to pay penalties or to refund to customers a portion of the revenues collected in the current and prior periods. There are also various legal actions pending to which we are a party and claims which, if asserted, may lead to other legal actions. We have established reserves for specific liabilities in connection with regulatory and legal actions, including environmental matters that we currently deem to be probable and estimable. We do not expect that the ultimate resolution of pending regulatory and legal matters in future periods, including the Hicksville matter described below, will have a material effect on our financial con-dition, but it could have a material effect on our results of operations for a given reporting period.
During 2003, under a government-approved plan, remediation com-menced at the site of a former Sylvania facility in Hicksville, New York that processed nuclear fuel rods in the 1950s and 1960s. Remediation beyond original expectations proved to be necessary and a reassessment of the anticipated remediation costs was conducted. A reassessment of costs related to remediation efforts at several other former facilities was also undertaken. In September 2005, the Army Corps of Engineers (ACE) accepted the Hicksville site into the Formerly Utilized Sites Remedial Action Program. This may result in the ACE performing some or all of the remediation effort for the Hicksville site with a corresponding decrease in costs to Verizon. To the extent that the ACE assumes responsibility for remedial work at the Hicksville site, an adjustment to a reserve previously established for the remediation may be necessary. Adjustments to the reserve may also be necessary based upon actual conditions discovered during the remediation at any of the sites requiring remediation.
In connection with the execution of agreements for the sales of busi-nesses and investments, Verizon ordinarily provides representations and warranties to the purchasers pertaining to a variety of nonfinancial mat-ters, such as ownership of the securities being sold, as well as indemnity from certain financial losses.
Subsequent to the sale of Verizon Information Services Canada in 2004, we continue to provide a guarantee to publish directories, which was issued when the directory business was purchased in 2001 and had a 30-year term (before extensions). The preexisting guarantee continues, without modification, despite the subsequent sale of Verizon Information Services Canada and the spin-off of our domestic print and Internet yellow pages directories business. The possible financial impact of the guarantee, which is not expected to be adverse, cannot be reasonably estimated since a variety of the potential outcomes available under the guarantee result in costs and revenues or benefits that may offset each other. In addition, performance under the guarantee is not likely.
As of December 31, 2008, letters of credit totaling approximately $200 million were executed in the normal course of business, which support several financing arrangements and payment obligations to third parties.
We have several commitments primarily to purchase network services, equipment and software from a variety of suppliers totaling $737 million. Of this total amount, $435 million, $162 million, $75 million, $29 million, $26 million and $10 million are expected to be purchased in 2009, 2010, 2011, 2012, 2013 and thereafter, respectively.
NOTE 19
ADDITIONAL FINANCIAL INFORMATION
The tables that follow provide additional financial information related to our consolidated financial statements:
Income Statement Information
(dollars in millions)Years Ended December 31, 2008 2007 2006
Depreciation expense $ 13,182 $ 13,036 $ 13,122Interest cost incurred 2,566 2,258 2,811Capitalized interest (747) (429) (462)Advertising costs 2,754 2,463 2,271
Balance Sheet Information
(dollars in millions)At December 31, 2008 2007
Accounts Payable and Accrued LiabilitiesAccounts payable $ 3,856 $ 4,491Accrued expenses 2,299 2,400Accrued vacation, salaries and wages 4,871 4,828Interest payable 652 473Accrued taxes 2,136 2,270
$ 13,814 $ 14,462Other Current LiabilitiesAdvance billings and customer deposits $ 2,651 $ 2,476Dividends payable 1,584 1,266Other 2,864 3,583
$ 7,099 $ 7,325

Notes to Consolidated Financial Statements continued
71
NOTE 21
QUARTERLY FINANCIAL INFORMATION (UNAUDITED)
(dollars in millions, except per share amounts)
Income Before Discontinued Operations, Extraordinary Item and Cumulative Effect of Accounting Change
Quarter EndedOperating Revenues
Operating Income Amount
Per Share-Basic
Per Share- Diluted Net Income
2008March 31 $ 23,833 $ 4,333 $ 1,642 $ .57 $ .57 $ 1,642June 30 24,124 4,546 1,882 .66 .66 1,882September 30 24,752 4,173 1,669 .59 .59 1,669December 31 24,645 3,832 1,235 .43 .43 1,235
2007March 31 $ 22,584 $ 3,796 $ 1,484 $ .51 $ .51 $ 1,495June 30 23,273 4,149 1,683 .58 .58 1,683September 30 23,772 4,210 1,271 .44 .44 1,271December 31 23,840 3,423 1,072 .37 .37 1,072
• Resultsofoperationsforthefirstquarterof2008includeafter-taxchargesof$18millionformergerintegrationcostsand$81millionrelatedtoaccesslinespin-offcharges.• Resultsofoperationsforthesecondquarterof2008includeafter-taxchargesof$22millionformergerintegrationcosts.• Resultsofoperationsforthethirdquarterof2008includeafter-taxchargesof$32millionformergerintegrationcostsand$164millionforseverance,pensionandbenefitcharges.• Resultsofoperationsforthefourthquarterof2008includeafter-taxchargesof$35millionformergerintegrationcosts,$31millioninvestmentrelatedchargesattributabletoanother-than-
temporary decline in the fair value of our investments in marketable securities, and $424 million for severance, pension and other charges.• Resultsofoperationsforthefirstquarterof2007includeafter-taxchargesof$9millionformergerintegrationcosts,$131millionforanextraordinarychargerelatedtothenationalizationof
CANTV, a $70 million after-tax gain on the sale of our interest in TELPRI and a $65 million after tax contribution to the Verizon Foundation.• Resultsofoperationsforthesecondquarterof2007includeafter-taxchargesof$17millionformergerintegrationcosts.• Resultsofoperationsforthethirdquarterof2007includeafter-taxchargesof$28millionformergerintegrationcosts,$44millionrelatedtoaccesslinespin-offchargesand$471millionasso-
ciated with taxes on foreign distributions.• Resultsofoperationsforthefourthquarterof2007includeafter-taxchargesof$58millionformergerintegrationcosts,$36millionrelatedtoaccesslinespin-offcharges,$139millionassoci-
ated with taxes on foreign distributions, and $477 million for severance, pension and other charges. Income before discontinued operations per common share is computed independently for each quarter and the sum of the quarters may not equal the annual amount.

72
Board of DirectorsCorporate Officers and Executive Leadership
Richard L. Carrión Chairman, President and Chief Executive Officer Popular, Inc. and Chairman and Chief Executive Officer Banco Popular de Puerto Rico
M. Frances Keeth Retired Executive Vice President Royal Dutch Shell plc
Robert W. Lane Chairman and Chief Executive Officer Deere & Company
Sandra O. Moose President Strategic Advisory Services LLC
Joseph Neubauer Chairman and Chief Executive Officer ARAMARK Holdings Corporation
Donald T. Nicolaisen Former Chief Accountant United States Securities and Exchange Commission
Thomas H. O’Brien Retired Chairman and Chief Executive Officer The PNC Financial Services Group, Inc. and PNC Bank, N.A.
Clarence Otis, Jr. Chairman and Chief Executive Officer Darden Restaurants, Inc.
Hugh B. Price Visiting Professor and Lecturer Woodrow Wilson School of Public and International Affairs, Princeton University and Non-Resident Senior Fellow The Brookings Institution
Ivan G. Seidenberg Chairman and Chief Executive Officer Verizon Communications Inc.
John W. Snow President JWS Associates, LLC
John R. Stafford Retired Chairman and Chief Executive Officer Wyeth
Retired in 2008:
Robert D. Storey Retired Partner Thompson Hine LLP
Ivan G. Seidenberg Chairman and Chief Executive Officer
Dennis F. Strigl President and Chief Operating Officer
Doreen A. Toben* Executive Vice President and Chief Financial Officer
Thomas A. Bartlett Senior Vice President and Controller
John W. Diercksen Executive Vice President – Strategy, Development and Planning
Marianne Drost Senior Vice President, Deputy General Counsel and Corporate Secretary
Patrick R. Gaston President – Verizon Foundation
Shaygan Kheradpir Executive Vice President and Chief Information Officer
John F. Killian* President – Verizon Business
Ronald H. Lataille Senior Vice President – Investor Relations
Kathleen H. Leidheiser Senior Vice President – Internal Auditing
Richard J. Lynch Executive Vice President and Chief Technology Officer
Lowell C. McAdam Executive Vice President and President and Chief Executive Officer – Verizon Wireless
Daniel S. Mead President – Verizon Telecom
Randal S. Milch Executive Vice President and General Counsel
Marc C. Reed Executive Vice President – Human Resources
Virginia P. Ruesterholz President – Verizon Services Operations
John G. Stratton Executive Vice President and Chief Marketing Officer
Thomas J. Tauke Executive Vice President – Public Affairs, Policy and Communications
Catherine T. Webster Senior Vice President and Treasurer
* Doreen Toben will serve as Executive Vice President until her retirement in mid-2009. Effective March 1, 2009, John Killian became Executive Vice President and Chief Financial Officer and Francis J. Shammo became President – Verizon Business.

Registered Shareowner ServicesQuestions or requests for assistance regarding changes to or transfers of your registered stock ownership should be directed to our transfer agent, Computershare Trust Company, N.A. at:
Verizon Communications Shareowner Services c/o Computershare P.O. Box 43078 Providence, RI 02940-3078 Phone: 800 631-2355 Website: www.computershare.com/verizon Email: [email protected]
Persons outside the U.S. may call: 781 575-3994
Persons using a telecommunications device for the deaf (TDD) may call: 800 524-9955
On-line Account Access – Registered shareowners can view account information on-line at: www.computershare.com/verizon
Click on “Create login” to register. For more information, contact Computershare.
Direct Dividend Deposit Service – Verizon offers an electronic funds transfer service to registered shareowners wishing to deposit dividends directly into savings or checking accounts on dividend payment dates. For more information, contact Computershare.
Direct Invest Stock Purchase and Ownership Plan – Verizon offers a direct stock purchase and share ownership plan. The plan allows cur-rent and new investors to purchase common stock and to reinvest the dividends toward the purchase of additional shares. To receive a Plan Prospectus and enrollment form, contact Computershare or visit their website.
eTree® Program – Worldwide, Verizon is acting to conserve natural resources in a variety of ways. Now we are proud to offer shareowners an opportunity to be environmentally responsible. By receiving links to proxy, annual report and shareowner materials online, you can help Verizon reduce the amount of materials we print and mail. As a thank you for choosing electronic delivery, Verizon will plant a tree on your behalf. It’s fast and easy and you can change your electronic delivery options at any time. Sign up at www.eTree.com/verizon or call 800 631-2355 or 781 575-3994.
Corporate GovernanceVerizon’s Corporate Governance Guidelines are available on our website – www.verizon.com/investor
If you would prefer to receive a printed copy in the mail, please contact the Assistant Corporate Secretary:
Verizon Communications Inc. Assistant Corporate Secretary 140 West Street, 29th Floor New York, NY 10007
Investor ServicesInvestor Website – Get company information and news on our website – www.verizon.com/investor
VZ Mail – Get the latest investor information delivered directly to your computer desktop. Subscribe to VzMail at our investor information website.
Stock Market InformationShareowners of record at December 31, 2008: 798,938
Verizon is listed on the New York Stock Exchange (ticker symbol: VZ)
Also listed on the Chicago, London, Swiss, Amsterdam and Frankfurt exchanges.
Common Stock Price and Dividend Information
Market Price Cash
Dividend Declared High Low
2008 Fourth Quarter $ 34.90 $ 23.07 $ 0.460Third Quarter 36.34 30.25 0.460Second Quarter 39.94 33.84 0.430First Quarter* 44.12 33.00 0.430
2007* Fourth Quarter $ 46.03 $ 40.59 $ 0.430Third Quarter 44.55 39.09 0.430Second Quarter 43.79 36.59 0.405First Quarter 38.60 35.44 0.405
*Prices have been adjusted for the spin-off of our local exchange and related business assets in Maine, New Hampshire and Vermont.
Form 10–KTo receive a copy of the 2008 Annual Report on Form 10-K, which is filed with the Securities and Exchange Commission, contact Investor Relations:
Verizon Communications Inc. Investor Relations One Verizon Way Basking Ridge, NJ 07920 Phone: 212 395-1525
Certifications Regarding Public Disclosures & Listing StandardsThe 2008 Annual Report on Form 10-K filed with the Securities and Exchange Commission includes the certifications required by Section 302 of the Sarbanes-Oxley Act regarding the quality of Verizon’s public disclosure. In addition, the annual certification of the chief executive officer regarding compliance by Verizon with the corporate governance listing standards of the New York Stock Exchange was submitted without qualification following the 2008 annual meeting of shareholders.
Equal Opportunity PolicyVerizon maintains a long-standing commitment to equal opportunity and valuing the diversity of its employees, suppliers and customers. Verizon is fully committed to a workplace free from discrimination and harassment for all persons, without regard to race, color, religion, age, gender, national origin, sexual orientation, marital status, citizenship status, veteran status, disability or other protected classifications.
Investor Information
v e r i zo n co m m u n i c at i o n s i n c . 2008 a n n ua l r e p o r t

c4
Verizon Communications Inc.140 West StreetNew York, New York 10007212 395-1000
verizon.com
©2009. Verizon. All Rights Reserved.002CS18035
Cert no. SCS-COC-00648