Venues in Social Media: Examining Ambiance Perception Through Scene...
9
Venues in Social Media: Examining Ambiance Perception Through Scene Semantics Yassir Benkhedda Idiap Research Institute [email protected] Darshan Santani Idiap Research Institute [email protected] Daniel Gatica-Perez Idiap Research Institute and EPFL [email protected] ABSTRACT We address the question of what visual cues, including scene objects and demographic attributes, contribute to the automatic inference of perceived ambiance in social media venues. We first use a state- of-art, deep scene semantic parsing method and a face attribute extractor to understand how different cues present in a scene relate to human perception of ambiance on Foursquare images of social venues. We then analyze correlational links between visual cues and thirteen ambiance variables, as well as the ability of the semantic attributes to automatically infer place ambiance. We study the effect of the type and amount of image data used for learning, and compare regression results to previous work, showing that the proposed approach results in marginal-to-moderate performance increase for up to ten of the ambiance dimensions, depending on the corpus. 1 INTRODUCTION Understanding and inferring human perception of images and places in terms of associated affective and social constructs is a topic of increasing interest within the vision and multimedia com- munities [11], [13], [27], [33]. Human observers are able to make a variety of perceptual inferences from an image using prior knowl- edge and individual and interpersonal experiences, which makes the challenge of automatically predicting human judgments par- ticularly difficult. In this paper, we are interested in examining how people perceive places socially in terms of ambiance. More specifically, using computer vision techniques, we examine the rela- tionships between visual elements of perceived ambiance of places using images shared on social media sites. Ambiance, i.e., the atmosphere of the environment, has been reported to be as influential on customers as the tangible products being sold [22]. Ambiance has the potential to affect people along several dimensions including mood, behavior, and social interaction, and it can have an effect on the perceptions of the service quality and the overall evaluation of dining or socializing experiences [24]. When people go out, they have certain expectations regarding the eating or drinking environment and experience [8]. As a result, understanding how people perceive the physical environment is Permission to make digital or hard copies of all or part of this work for personal or classroom use is granted without fee provided that copies are not made or distributed for profit or commercial advantage and that copies bear this notice and the full citation on the first page. Copyrights for components of this work owned by others than the author(s) must be honored. Abstracting with credit is permitted. To copy otherwise, or republish, to post on servers or to redistribute to lists, requires prior specific permission and/or a fee. Request permissions from [email protected]. MM ’17, , October 23–27, 2017, Mountain View, CA, USA © 2017 Copyright held by the owner/author(s). Publication rights licensed to Associa- tion for Computing Machinery. ACM ISBN 978-1-4503-4906-2/17/10. . . $15.00 https://doi.org/doi.org/10.1145/3123266.3123402 of importance for venue owners. Understanding the visual cues that influence ambiance perception can be helpful for atmospheric planning in order to create appropriate ambiances, whether creative, relaxed, or formal. Deciding if a place is trendy or romantic comes naturally to us humans. However, understanding how one can train computers to arrive to similar outcomes is an active research problem [33]. People combine different sources of information including color, texture, spatial layout, and prior knowledge to form a judgment. In the domain of design and marketing, it has been shown that young people tend to prefer bright, strong colors, while adults prefer weak, unobtrusive colored environments, thus soft colors are often used in restaurants while fast food restaurants tend to use more bright colors [4]. People demographics is another important cue for place ambiance as people choose venues to hang out with others of similar socio-demographic backgrounds [6]. Intuitively speaking, a crowd of younger people are more expected to be found in a trendy place, whereas the likelihood of older people to be present in a conservative venue is high. In this paper, we study ambiance of popular Foursquare places at the object level by using a social media image corpus from our previ- ous work ‘[33]. The dataset consists of 50K user-contributed images as well as place ambiance annotations across 13 ambiance categories (including artsy, romantic, formal, loud and trendy, among others). In the same study, we reported, despite a certain degree of inter- annotator variability that is to be expected when studying subjective qualities, that there was a sufficient degree of consistency among users’ judgments of venue ambiance, to suggest the presence of vi- sual cues within the image content that elicited such judgments [33]. This follows the well known lens model by Brunswik in the context of environmental psychology [15], which posits that visual cues are utilized by observers to infer ambiance. In this paper, we extend this previous work by investigating how automatically parsed objects from venue scenes and machine-extracted demographic attributes of people present in the same venues relate to ambiance perception. Recent advances in deep convolutional neural networks (CNNs) have delivered promising results in object recognition and scene understanding [29, 40]; more recently, the use of CNNs has resulted in progress on semantic scene segmentation methods [42]. Seman- tic segmentation provides a label for every pixel, which plays a crucial role in image understanding. There has recently been great interest in scene semantic parsing for outdoor urban places, with major applications such as self-driving cars [9]. In this paper, we use a state-of-the-art scene parsing algorithm [39], trained on a the recently released scene-centric ADE20K dataset [42] to seg- ment an image into a set of objects. Furthermore, we use a publicly available face detection API [1] to extract information about people
Transcript of Venues in Social Media: Examining Ambiance Perception Through Scene...
Venues in Social Media: Examining Ambiance PerceptionThrough Scene Semantics
Yassir Benkhedda
Idiap Research Institute
Darshan Santani
Idiap Research Institute
Daniel Gatica-Perez
Idiap Research Institute and EPFL
ABSTRACTWe address the question of what visual cues, including scene objects
and demographic attributes, contribute to the automatic inference
of perceived ambiance in social media venues. We first use a state-
of-art, deep scene semantic parsing method and a face attribute
extractor to understand how different cues present in a scene relate
to human perception of ambiance on Foursquare images of social
venues.We then analyze correlational links between visual cues and
thirteen ambiance variables, as well as the ability of the semantic
attributes to automatically infer place ambiance. We study the
effect of the type and amount of image data used for learning, and
compare regression results to previous work, showing that the
proposed approach results in marginal-to-moderate performance
increase for up to ten of the ambiance dimensions, depending on
the corpus.
1 INTRODUCTIONUnderstanding and inferring human perception of images and
places in terms of associated affective and social constructs is a
topic of increasing interest within the vision and multimedia com-
munities [11], [13], [27], [33]. Human observers are able to make a
variety of perceptual inferences from an image using prior knowl-
edge and individual and interpersonal experiences, which makes
the challenge of automatically predicting human judgments par-
ticularly difficult. In this paper, we are interested in examining
how people perceive places socially in terms of ambiance. More
specifically, using computer vision techniques, we examine the rela-
tionships between visual elements of perceived ambiance of places
using images shared on social media sites.
Ambiance, i.e., the atmosphere of the environment, has been
reported to be as influential on customers as the tangible products
being sold [22]. Ambiance has the potential to affect people along
several dimensions includingmood, behavior, and social interaction,
and it can have an effect on the perceptions of the service quality
and the overall evaluation of dining or socializing experiences [24].
When people go out, they have certain expectations regarding the
eating or drinking environment and experience [8]. As a result,
understanding how people perceive the physical environment is
Permission to make digital or hard copies of all or part of this work for personal or
classroom use is granted without fee provided that copies are not made or distributed
for profit or commercial advantage and that copies bear this notice and the full citation
on the first page. Copyrights for components of this work owned by others than the
author(s) must be honored. Abstracting with credit is permitted. To copy otherwise, or
republish, to post on servers or to redistribute to lists, requires prior specific permission
and/or a fee. Request permissions from [email protected].
MM ’17, , October 23–27, 2017, Mountain View, CA, USA© 2017 Copyright held by the owner/author(s). Publication rights licensed to Associa-
tion for Computing Machinery.
ACM ISBN 978-1-4503-4906-2/17/10. . . $15.00
https://doi.org/doi.org/10.1145/3123266.3123402
of importance for venue owners. Understanding the visual cues
that influence ambiance perception can be helpful for atmospheric
planning in order to create appropriate ambiances, whether creative,
relaxed, or formal.
Deciding if a place is trendy or romantic comes naturally to us
humans. However, understanding how one can train computers
to arrive to similar outcomes is an active research problem [33].
People combine different sources of information including color,
texture, spatial layout, and prior knowledge to form a judgment.
In the domain of design and marketing, it has been shown that
young people tend to prefer bright, strong colors, while adults
prefer weak, unobtrusive colored environments, thus soft colors
are often used in restaurants while fast food restaurants tend to use
more bright colors [4]. People demographics is another important
cue for place ambiance as people choose venues to hang out with
others of similar socio-demographic backgrounds [6]. Intuitively
speaking, a crowd of younger people are more expected to be found
in a trendy place, whereas the likelihood of older people to be
present in a conservative venue is high.
In this paper, we study ambiance of popular Foursquare places at
the object level by using a social media image corpus from our previ-
ous work ‘[33]. The dataset consists of 50K user-contributed images
as well as place ambiance annotations across 13 ambiance categories
(including artsy, romantic, formal, loud and trendy, among others).
In the same study, we reported, despite a certain degree of inter-
annotator variability that is to be expectedwhen studying subjective
qualities, that there was a sufficient degree of consistency among
users’ judgments of venue ambiance, to suggest the presence of vi-
sual cues within the image content that elicited such judgments [33].
This follows the well known lens model by Brunswik in the context
of environmental psychology [15], which posits that visual cues are
utilized by observers to infer ambiance. In this paper, we extend this
previous work by investigating how automatically parsed objects
from venue scenes and machine-extracted demographic attributes
of people present in the same venues relate to ambiance perception.
Recent advances in deep convolutional neural networks (CNNs)
have delivered promising results in object recognition and scene
understanding [29, 40]; more recently, the use of CNNs has resulted
in progress on semantic scene segmentation methods [42]. Seman-
tic segmentation provides a label for every pixel, which plays a
crucial role in image understanding. There has recently been great
interest in scene semantic parsing for outdoor urban places, with
major applications such as self-driving cars [9]. In this paper, we
use a state-of-the-art scene parsing algorithm [39], trained on a
the recently released scene-centric ADE20K dataset [42] to seg-
ment an image into a set of objects. Furthermore, we use a publicly
available face detection API [1] to extract information about people

demographics such as gender, age, and ethnicity. We perform a cor-
relation analysis to assess which visual elements have connections
with specific ambiance categories (although of course such studies
do not allow for causal interpretations.) Finally, we train a regressor
to infer ambiance ratings from the most discriminative visual cues,
in order to test the effectiveness of our proposed features, in an
experimental setting that includes an objective comparison with
previous work [34].
Following a significant body of literature in environmental psy-
chology, design, and marketing [3, 10, 15, 22, 34, 37], our hypothesis
is that the presence of certain objects can potentially provide an
indication of place ambiance: flowers might make us think of a ro-
mantic place, while paintings on the wall might help a place appear
more artsy. Background elements such as the type of wall, floor,
and ceiling can also be informative of the spatial layout, as well as
interior design choices such as the allocation of floor space and the
amount of decorations on the walls. Our paper examines how auto-
matically segmented objects and extracted people attributes, both
present in venue-centric social media images, relate to ambiance
perceptions. We address the following three research questions:
RQ1: How do automatically parsed objects from venue scenes
relate to ambiance perception?
RQ2: How do machine-extracted demographic attributes of peo-
ple present in the same venues relate to ambiance percep-
tion?
RQ3: What ambiance categories can be inferred from the above
types of visual cues in a regression setting?
The paper is organized as follows. We begin with a review of
the related work (Section 2). Next, we summarize the Foursquare
venue image corpora as well as the ADE20K image corpus used
to train the scene parsing algorithm (Section 3). In Section 4, we
outline the research methodology including visual feature extrac-
tion and aggregation. In Section 5, we empirically compare the
different image corpora from the perspective of visual content. In
Section 6, we present the correlation analysis connecting visual
cues and perceived ambiance. After the correlation analysis, we
present regression results for all ambiance categories, and com-
pare the performance in terms of RMSE and R2 scores for differentsubsets of Foursquare images, including a comparison with previ-
ous work (Section 7). Finally, we conclude with a summary of our
findings and future research directions in Section 8.
2 RELATEDWORKResearch in computer vision and multimedia is increasingly in-
terested in examining images from a human-centered perspective.
Online collection methods using experts or crowdsourcing has
increased the availability of visual data with annotated human per-
ception. The vast amounts of image data available make it ever
more important for automatic techniques to help automate the
process of analyzing images in terms of subjective qualities.
The availability of geo-tagged images [32] has helped develop
urban datasets to predict human perceptions of outdoor places, like
the work in [27] that studied judgments of wealth, uniqueness and
safety. The work in [26] focused on predicting perceived urban
safety, while [28] looked at places in terms of being beautiful, quiet,
or happy. Other works proposed to discover discriminative elements
to distinguish the identity of a city [12], [41]. Other work was inter-
ested in making pairwise inferences across urban scenes [13]. All
these works can be related to Brunswik’s classic lens model applied
to environments [15], in which a place has a number of visual cues
that are utilized by observers or visitors to infer ambiance.
The field of computational aesthetics has investigated the predic-
tion of intrinsic, aesthetic qualities of images such as memorability
[19], [14], [18], popularity [21], style [20], interestingness [11],
[30], facial attractiveness [23], and importance [5]. The work in
[16] showed that people are partly able to guess place ambiance,
clientele, and activities by observing the Foursquare profile pictures
of visitors. The work in [31] looked at the visual cues that people
may have relied upon from profile pictures. This work examined
facial cues such as demographics, as well as colors.
The effects of atmospherics or physical design and decor ele-
ments on customers is well established, and exposure to a particular
ambiance is used to influence buyers’ purchasing behaviour [22].
Research has studied some of the effects that atmospherics and
ambiance can have on people’s emotions and behaviours. The work
in [3] changed the ambiance of a restaurant to have a distinctive
Italian feel, and meals were rated as more Italian and customers
ordered more pasta. Atmospheric elements like color, lighting and
style impact human impressions of hotel lobbies [10]. The work
in [24] showed that dining atmospherics had significant impact
on customer emotions, as well as influencing their post-dining be-
havioural intentions. The work in [37] highlights the influence of
ambiance on food intake and food choice, which are important
aspects for restaurant owners.
Related work with regard to face features in social media have
looked at the impact of faces on image social engagement [2];
the work in [17] investigated the type of content shared on Insta-
gram and found that the two categories involving faces (selfies and
friends) together account for up to 45% of photos. The work in [36]
studied face features of selfies and found 19% of pictures with faces,
detected using the Face++ tool, while the work in [25] explored
selfie content in 5 cities and found that only 3-5% of images were
selfies.
Our work in [34] automatically inferred ambiance from social
media images using both low-level features such as color, texture,
GIST and a pretrained googleNet classifier to extract deep-learning
features before training a regressor. While the results were gen-
erally poor for low-level features, the results were promising for
several ambiances using deep-learning features. Working with two
datasets (the first one limited to photos of the physical environment
of the places; the second one including all photos available for a
given place), the machine-generated object labels from an Imagenet-
pretrained CNN vary significantly between the two datasets. For
the physical environment corpus, most of the images correspond
to object labels that represent a scene such as restaurant, library,
or cinema, with restaurant representing 65 % of the images. In
contrast, the machine-recognized categories of the full dataset rep-
resent other objects such as plate, beer glass, ice cream, or espresso,
while restaurant images represent only 8 %.
Our paper follows [34] to extract visual features to automatically
predict place ambiance. Our work is different in that we use an
explicit scene segmentation approach, rather than implicit object
detection as in [34], with the assumption that the types of objects

placed in a scene influence the perception of the place. Our rea-
soning also follows previous results from [33] where we found
that human observers perceived images with a clear view of the
physical environment as being more informative of place ambiance.
Following Brunswik’s lens model adapted to environments [15],
our assumption is that there are strong visual cues within scene
images that can be extracted using a scene-centric semantic parser.
Furthermore, our results can provide insights as to which objects
are discriminative since we are dealing with the presence or ab-
sence of objects rather than a probability distribution at the image
level.
3 DATASETSIn order to study how images portray place ambiance we use the
dataset collected as part of our previous work [33]. The dataset
consists of two data sources: user-contributed images collected
using Foursquare, and a subset of manually chosen images used for
crowdsourcing human judgments. We briefly describe these two
data sources as well as the ADE20K dataset which was used to train
the scene segmentation model. In the rest of this paper, we will use
place and venue interchangeably in the context of Foursquare.
3.1 Foursquare 50K DatasetThis dataset consists of user-contributed Foursquare (4SQ) images
collected from 280 venues, for a total of 45,848 images with each
venue having an average of 164 images [33]. The venues include
bars, clubs, restaurants and cafes in six metropolitan cities around
the world – Barcelona, Mexico City, New York City, Paris, Seattle,
and Singapore.
3.2 Foursquare Physical Environment DatasetThis dataset is made up of a subset of 3 images per venue manually
chosen with a clear view of the environment, showing the space
from different angles. In [33], we reported that such images are
deemed by online observers as being more informative of ambiance.
Perception scores were collected via online crowdsourcing using
Amazon Mechanical Turk (MTurk), where each venue was anno-
tated along 13 ambiance dimensions appropriate for indoor places.
10 annotations were collected for each place on a Likert scale of 1 to
7. By examining the inter-annotator agreement, it was found that
online observers were able to judge place ambiance with acceptable
reliability, suggesting that informative visual stimuli are present
in the images. As the selected venues were popular places on 4SQ,
overall the ambiance scores were generally higher for positively
phrased ambiances (e.g., trendy, artsy) and lower for negatively
phrased ambiances (e.g., creepy, dingy). In the rest of the paper, we
refer to the 4SQ physical environment dataset as PhysEnv dataset.
3.3 ADE20K DatasetADE20K is a scene centric image corpus consisting of 22K images
across 900 different scene categories for both outdoors and indoors
scenes [42]. The images are densely annotated at the pixel-level
by a single annotator using an open vocabulary. The presence of
the different objects hence follows a long tail distribution. Training
of the scene segmentation algorithm was done on the 150 most
commonly present object categories in the ADE20K dataset, which
account for 93% of all the pixels. The 150 object categories can be
further split into 35 stuff or background objects such as wall, ceiling,
floor, etc., and 115 discrete objects such as table, plate, drinking glass,
painting, flag, plant, etc. As the list shows, several of these object
categories can potentially be present in bars, cafes, restaurants, and
clubs, which are the type of venues studied in this paper. There are
68 objects from the ADE20K dataset that are also found within the
object categories of the GoogLeNet classifier [38].
In order to get an idea of the similarity between the 4SQ dataset
and the ADE20K dataset, we look at the fraction of images within
the ADE20K dataset that correspond to the type of venues found
within the 4SQ dataset: restaurants, bars, clubs, and cafes. We find
the image labels that directly correspond to the venues: bar (54),
cafeteria/coffee shop (21), nightclub/disco (14), bistro/brewery/pub
(40), restaurant (112) for a total of 241 images, around 1 % of the
ADE20K dataset. By including other scene categories (e.g. casino,
lobby, dining room) that we would expect to resemble 4SQ image
content we find that around 5% of the ADE20K dataset consists of
such images. While the number of ADE images that correspond to
4SQ venue categories is low, we expect the objects to occur within
many other images, and this brings the two datasets closer. As we
show in the next sections, this will be first quantified and then used
for automatic inference of ambiance.
4 METHODOLOGYScene Parser. To obtain an object-level representation, we use a
scene segmentation model to analyze the different objects present
within each image. We use the Dilated Net model [39] trained on
ADE20K dataset, as it has outperformed other state-of-the-art scene
segmentation algorithms on the ADE20K image corpus [42]. The
Dilated Net is a deep learning model that utilizes a CNN module,
dilated convolutions, specifically designed for dense prediction by
aggregating multi-scale, contextual information without losing res-
olution. Its architecture is based on a fully convolutional VGG-16
network [35], where the last two pooling layers are replaced with
dilated convolutions. Images are scaled to 384x384 pixels for pro-
cessing, and the output (also 384x384 pixels) is further scaled to
the original size of the image. Object presence within each image
is then calculated as the fraction of pixels that correspond to each
object thus producing a 150-dimensional feature vector for each
image. We aggregate object presence at the place level by taking
the mean of the feature vectors. This should give us a reasonable
estimate of the objects detected as present in the venue.
Face Features. In order to analyze face demographics, we use a
deep-learning based Face++ platform [1], which has shown promis-
ing results for face recognition and landmark detection [43]. The
platform detects the number of faces found on each image and gen-
erates information with regard to age, gender, race, and presence
or absence of smile for each face. For the 50K dataset, we obtained
a total of 13,901 faces and 7,030 images containing at least one
face (15%). On the 50K dataset, the population of detected people
consists of 51% females, with a majority of faces classified as being
of white ethnicity (73%), 22% classified as Asian and 5% as black.
With respect to the performance of Face++ platform, the work in
[2] reported test accuracy of 97% for face detection, 96% for gender,
and 93% for age detection on a sample of Instagram images. Given
that we are also studying social media images in this paper, we
believe that the Face++ performance on the 4SQ dataset is adequate
for our purposes. The features we extract at the place level are:
the fractions of females, the fractions of white, asian and black
ethnicities, the fraction of people in the age groups: <18, 18-35,
35-45, >45, the fraction of people smiling, the fraction of images
containing at least one person, and the average number of people
per image from the images containing at least one person.
Analysis Procedure.Wefirst conduct a basic statistical analysis
to have a general assessment of how well the pre-trained segmenta-
tion algorithm performs on the 4SQ data (Section 5). In order to do
this, we compute the Spearman rank correlation between the ranks
of the most present objects in the datasets. In a second analysis,
we perform a correlation analysis between the estimated object
presence features (for both the scene parser features and the face
features) for each place and the annotated scores for the 13 different
ambiances, in order to see which objects have any connection with
the different ambiance categories (Section 6). Finally, we automati-
cally infer place ambiance by training a random forest regressor,
robust against overfitting [7], to estimate perceptual scores (Section
7). We perform 10-fold cross-validation using the average ambiance
annotation scores as labels. As parameters in the random forest, we
use 1,000 trees and set the number of features randomly sampled
as candidates at each split as p/3, where p is number of features.
We analyze the performance of the regression models in terms of
R2 scores and RMSE values.
5 COMPARING FOURSQUARE AND ADE20KDATASETS
One basic question is how different the 4SQ and ADE20K dataset
are from the perspective of what objects they depict. To deepen
the understanding of the content differences of the two datasets,
we run the pre-trained segmentation algorithm over both image
corpora.
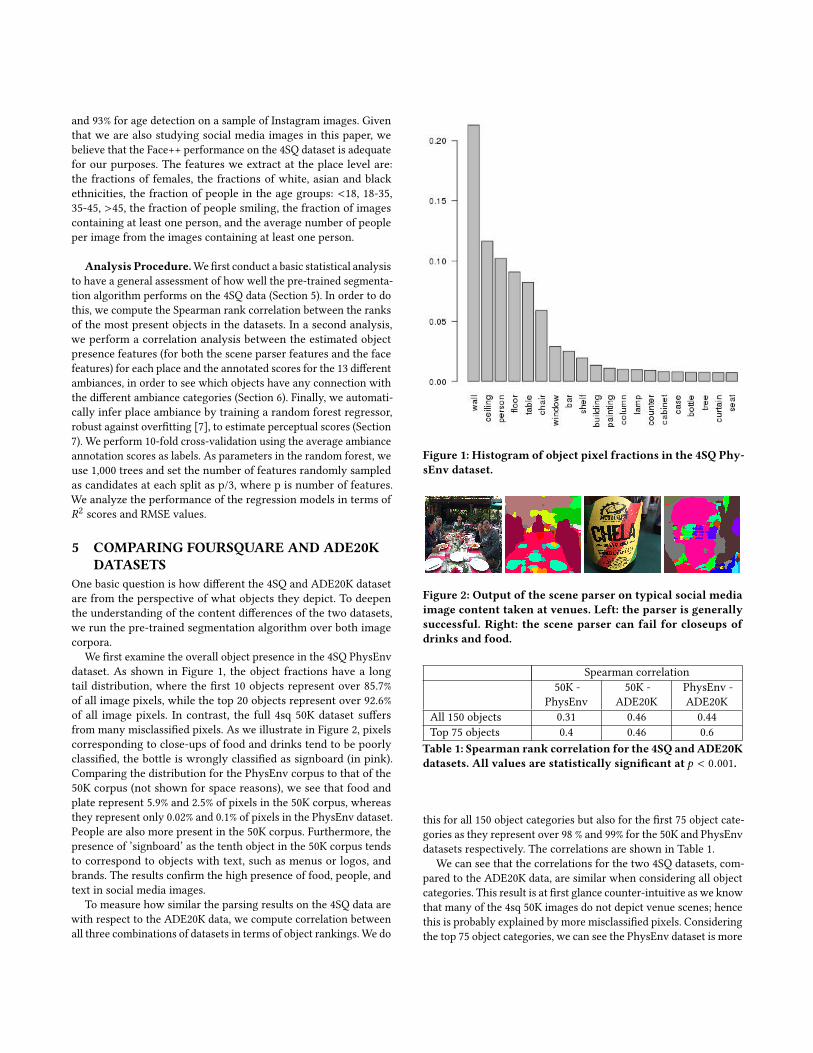
We first examine the overall object presence in the 4SQ PhysEnv
dataset. As shown in Figure 1, the object fractions have a long
tail distribution, where the first 10 objects represent over 85.7%
of all image pixels, while the top 20 objects represent over 92.6%
of all image pixels. In contrast, the full 4sq 50K dataset suffers
from many misclassified pixels. As we illustrate in Figure 2, pixels
corresponding to close-ups of food and drinks tend to be poorly
classified, the bottle is wrongly classified as signboard (in pink).
Comparing the distribution for the PhysEnv corpus to that of the
50K corpus (not shown for space reasons), we see that food and
plate represent 5.9% and 2.5% of pixels in the 50K corpus, whereas
they represent only 0.02% and 0.1% of pixels in the PhysEnv dataset.
People are also more present in the 50K corpus. Furthermore, the
presence of ’signboard’ as the tenth object in the 50K corpus tends
to correspond to objects with text, such as menus or logos, and
brands. The results confirm the high presence of food, people, and
text in social media images.
To measure how similar the parsing results on the 4SQ data are
with respect to the ADE20K data, we compute correlation between
all three combinations of datasets in terms of object rankings.We do
Figure 1: Histogram of object pixel fractions in the 4SQ Phy-sEnv dataset.
Figure 2: Output of the scene parser on typical social mediaimage content taken at venues. Left: the parser is generallysuccessful. Right: the scene parser can fail for closeups ofdrinks and food.
Spearman correlation
50K -
PhysEnv
50K -
ADE20K
PhysEnv -
ADE20K
All 150 objects 0.31 0.46 0.44
Top 75 objects 0.4 0.46 0.6
Table 1: Spearman rank correlation for the 4SQ and ADE20Kdatasets. All values are statistically significant at p < 0.001.
this for all 150 object categories but also for the first 75 object cate-
gories as they represent over 98 % and 99% for the 50K and PhysEnv
datasets respectively. The correlations are shown in Table 1.
We can see that the correlations for the two 4SQ datasets, com-
pared to the ADE20K data, are similar when considering all object
categories. This result is at first glance counter-intuitive as we know
that many of the 4sq 50K images do not depict venue scenes; hence
this is probably explained by more misclassified pixels. Considering
the top 75 object categories, we can see the PhysEnv dataset is more

similar to the ADE20K dataset, which is expected as both datasets
include scene images.
6 CONNECTIONS BETWEEN VISUAL CUESAND AMBIANCE (RQ1, RQ2)
To identify what objects might be correlated with each ambiance
category, we first compute the pairwise correlations between visual
features corresponding to the presence of each of the 150 objects
from the scene parser and the 13 ambiance ratings, over the en-
tire dataset. We find the most discriminative visual elements by
looking at the correlations between the object presence within the
PhysEnv corpus and the 50K corpus and the annotation scores. We
start this analysis on the PhysEnv corpus as it contains the images
which online annotators saw to judge the places for the studied
dimensions [33]. Results are shown in Table 2, where we are only
reporting visual cues having Pearson correlation values of at least
0.2, statistically significant at p < 0.001.
From Table 2, we observe that certain ambiances have clear vi-
sual cues, in particular the presence of people as a cue for a loudvenue with a correlation coefficient over 0.5. The presence of table,
window, and chair seems to be indicative of conservative ambiance.
The presence of people is negatively associated to conservative, ro-mantic, upscale, formal, sophisticated, yet positively correlated with
loud ambiance. A hypothesis for this finding is that loud places
in the studied dataset might correspond more to clubs and bars
but also because the PhysEnv corpus (designed to capture the full
scene) contains many images of these places with no people. Roman-tic ambiance has the presence of additional cues such has plants,
flowerpots, and curtains. Bohemian and artsy places are negatively
associated with light sources, and positively associated with walls.
Painting is a cue for artsy places while offbeat, creepy and dingyplaces are negatively associated with windows. Finally, drinking
glass and chandelier are cues for sophisticated, upscale and formalplaces. To the best of our knowledge, other works do not discuss
relationships between objects within the physical environment and
ambiance perceptions.
As a second step, examining the correlations for the 50K dataset
as shown in Table 2, we observe that many additional associations
can be found for several ambiance categories. For sophisticated, ro-mantic, upscale and formal, we observe that table, chair, and windowno longer correlate strongly yet countertop, drinking glass, and mir-
ror are now visual cues while box, poster, signboard and billboard
are negatively correlated. Bohemian and artsy still correlate with
wall, yet bohemian now also correlates with bookcase and book.
There is a positive association of food and plate for conservativeand old-fashioned venues, while food is negatively associated with
bohemian and creepy places.
Using the face cues from the 50K corpus related to human pres-
ence, age, gender, etc., we also performed a correlation analysis in
order to understand whether any demographic attributes have a
connection with specific ambiance categories. We report signicant
correlations with a Pearson value over 0.2 in Table 2. We see that
some of the associations between people demographics and am-
biance seem intuitive: younger people in trendy places, and older
people in upscale and formal places. Furthermore, our results con-
firm the results reported in [31], which found a higher presence of
females in romantic places.
7 AMBIANCE INFERENCE (RQ3)We investigate the automatic inference of ambiance by training a
regression model (random forest [7], discussed in Section 4). We
use the PhysEnv corpus and several subsets of the 50K corpus in
order to assess how the type and amount of image data affects the
performance of the regressor. Note that in all cases the number of
venues remains the same (P=280) except for Case 2 (P=275), and
what changes from case to case is either the images that represent
each venue or the used features. More specifically, we study six
cases: Case1: We use the object fractions from the PhysEnv cor-
pus (N=840) in order to predict ambiance. Case 2: We expand the
dataset to predict ambiance by adding images that resemble the
PhysEnv corpus in a controlled way. For this, we reproduce a proce-
dure discussed in [34]. We first run a pre-trained CNN, specifically
GoogLeNet trained on 1000-object category ImageNet [38] on the
PhysEnv corpus to identify the 10 most common inferred ImageNet
categories. Restaurant is (unsurprisingly) the most common one.
After this, we apply the pre-trained CNN on the 50K corpus, and use
only those images labelled as restaurant (N=3811) to train/test the
regressor. Case 3: Continuing with the data expansion procedure,
we use the images from the 50K corpus that were inferred by the
CNN to have the labels of the top 10 categories from the PhysEnv
corpus (as discussed in Case 2). The ranked list of labels is: restau-
rant, stage, library, barbershop, cinema, grocerystore, shoeshop,
tobacco shop, bakery, and dining table (N = 7605). Case 4: We use
the entire 50K corpus, which is the most diverse content source.
Case 5: In this case we integrate visual cues, combining the scene
parser features and the face demographic features for the 50K cor-
pus. Case 6: We compare the scene parsing algorithm results to
the results from [34], which is based on pre-trained CNN feature
extraction plus the random forest regressor. Results are compared
for both the PhysEnv and 50K datasets. Results appear in Tables 3
and 4.
Case 1: We infer ambiance using the PhysEnv dataset, in which
three images were manually chosen per venue. We observe high
performance for loud, and R2 values over 0.3 for formal, romantic,sophisticated, and up-scale. In contrast, creepy gets an R2 value
below 0.1.
Case 2: By automatically selecting all images classified as restau-
rants, we observe that the predictive performance outperforms
Case 1 for six ambiances, with improvements mainly for up-scale,trendy, and sophisticated; on the other hand, performance drops for
loud, conservative, and artsy. The drop for loud could be explained
if many of the restaurant images did not match the perception of
loud due to the presence or absence of people. This would have to
be investigated further.
Case 3: Here we consider the top 10 image categories to study
a richer scene-centric dataset. Comparing the R2 scores to Case 1,
we can see the only significant improvement is for trendy, whilethe performance drops for offbeat. Overall, we observe that despitehaving nine times as many images compared to Case 1, there is
little improvement in predictive performance.

Ambiance Positively and negatively correlatedobjects (PhysEnv)
Positively and negatively correlatedobjects (50K)
Correlated face features(50K)
Artsy
Painting (.32), wall (.31), basket (.22), book
(.20), poster (.20)
wall (.31), painting (.30), canopy (.23), lamp
(.23), poster (.21), person (-.24)
Bohemian
wall (.26), basket (.24), poster (.23), light
source (-.21)
wall (.28), bookcase (.27), painting (.25),
book (.23), lamp (.22), poster (.21),
computer (.21), sand (-.22), food (-.20)
Conservative table (.42), chair (.32) and window (.26)
table (.42), countertop (.32), tray (.30), food
(.30), plate (.29), towel (.27), rock (.26), sink
(.26), sand (.26), person (-.34), court screen
(-.34), poster (-.31), wall (-.30), seat (-.26),
stage (-.26)
no. people per image (-.23),
fraction images with people
(-.25)
Creepy poster (.21), earth (.20), window (-.25)
poster (.27), painting (.23), wall (.22), pool
table (.21), person (.20), trade name (.20),
table (-.24), food (-.20)
Dingy
conveyor belt (.26), lake (.23) and
refrigerator (.21), window (.23)
poster (.26), bar (.26), trade name (.24), pool
table (.23), signboard (.22), person (.21),
countertop (-.23), table (-.21), tray (-.20),
window (-.20), railing (-.20)
Formal
table (.33), drinking glass (.31), chandelier
(.26), window (.24), seat (.25), chair (.22),
plate (.20), curtain (.20), person (-.23),
signboard (-.21), bulletin board (-.20)
chandelier (.36), drinking glass (.28), mirror
(.21), box (-.40), signboard (-.33), countertop
(.31), bulletin board (-.27), base (-.23), trade
name (-.22), counter (-.21), painting (-.20)
age 35-45 (.22), age < 18 (-.20)
Loud
people (.58), stage (.43), ceiling (.37), chair
(-.44), table (-.42), window (-.31), cabinet
(-.25), floor (-.24), armchair (-.22), vase
(-.22), mirror(-.20), door (-.20)
person (.62), stage (.49), court screen (.46),
screen (.37), ceiling (.35), flag (.33), poster
(.28), table (-.48), chair (-.40), countertop
(-.37), plate (-.37), window (-.36), vase (-.32),
towel (-.30), cushion (-.29)
no. people per image (.46),
fraction images with people
(.49), fraction females (-.25)
Offbeat wall (.29), ball (.21), flag (.20), window (-.30)
poster (.24), lamp (.22), box (.21), painting
(.20), road (-.23)
Oldfashioned chair (.26) and table (.24)
table (.34), food (.30), plate (.26), oven (.26),
case (.20), bannister (-.33), ceiling (-.30),
court screen (-.29), person (-.28), seat (-.27),
stage (-.23), sky (-.23), airplane (-.22)
no. people per image (-.23),
fraction images with people
(-.24)
Romantic
table (.33), plant (.26), chair (.24), curtain
(.24), flowerpot (.24), window (.24),
armchair (.23), chandelier (.22), flower (.22),
drinking glass (.22), person (-.36),
signboard (-.24) and stool (-.21)
chandelier (.31), countertop (.26), drinking
glass (.24), plant (.23), window (.22), sconce
(.21), chair (.21), box (-.37), signboard (-.35),
poster (-.29), base (-.25), bulletin board
(-.25), trade name (-.23), counter (-.21), flag
(-.21)
fraction females (.20)
Sophisticated
table (.28), window (.25), drinking glass
(.24), chandelier (.22), armchair (.21), seat
(.20), person (-.26), signboard (-.22)
chandelier (.31), countertop (.30), drinking
glass (.23), mirror (.22), plant (.21),
streetlight (.20), vase (.20), box (-.38), poster
(-.35), signboard (-.33), bulletin board (-.26),
base (-.23) trade name (-.23), tank (-.21),
counter (-.20)
Trendy screen door (.21), shower (.21), tray (.20)
bannister (.37), ceiling (.34), land (.26),
person (.26), seat (.25), stage (.23), court
screen(.22), sky (.20), plate (-.31), table
(-.26), food (-.24), counter (-.23), box (-.23),
base (-.22), trade name (-.21)
age 18-35 (.21), no. people per
image (.29), fraction images
with people (.27)
Upscale
window (.28), glass (.28), table (.27), seat
(.26), chandelier (.24), person (-.22),
signboard (-.21) and stool (-.21), poster
(-.20)
chandelier (.35), countertop (.27), drinking
glass (.26), streetlight (.24), ceiling (.22),
window (.20), box (-.42), signboard (-.35),
poster (-.34), bulletin board (-.29), base
(-.26), counter (-.25), trade name (-.22),
painting (-.21), tank (-.20)
age 35-45 (.20), age < 18 (-.22)
Table 2: Correlation between visual cues and ambiance. Positive correlation values are shown in green while negative valuesare shown in red. In the Table, we only report visual cues having correlation values of at least 0.2 (for loud, only top 15 cuesare shown for space reasons). All reported values are statistically significant at p < 0.001.

Case 1 Case 2 Case 3 Case 4 Case 5
Baseline-50K PhysEnv Restaurant Top 10 Categories 50K Images 50K Corpus + Face++(N = 840) (N = 3811) (N = 7605) (N = 45848) (N = 45848)
R2 RMSE R2 RMSE R2 RMSE R2 RMSE R2 RMSE R2 RMSE
Artsy 0.0 0.69 0.20 0.64 0.15 0.65 0.21 0.63 0.23 0.63 0.22 0.63
Bohemian 0.0 0.55 0.14 0.52 0.15 0.52 0.14 0.52 0.19 0.51 0.19 0.51
Conservative 0.0 0.67 0.29 0.58 0.22 0.60 0.26 0.59 0.32 0.56 0.31 0.57
Creepy 0.0 0.29 0.09 0.28 0.06 0.28 0.07 0.28 0.15 0.27 0.14 0.27
Dingy 0.0 0.50 0.14 0.47 0.12 0.46 0.14 0.47 0.21 0.47 0.20 0.45
Formal 0.0 0.82 0.37 0.69 0.38 0.68 0.36 0.70 0.39 0.67 0.41 0.67
Loud 0.0 0.73 0.57 0.50 0.46 0.53 0.57 0.49 0.55 0.50 0.56 0.49
Off the beaten path 0.0 0.61 0.15 0.47 0.11 0.48 0.08 0.48 0.14 0.47 0.14 0.47
Old-fashioned 0.0 0.50 0.17 0.56 0.15 0.57 0.19 0.56 0.26 0.54 0.25 0.54
Romantic 0.0 0.67 0.35 0.56 0.37 0.56 0.36 0.57 0.43 0.54 0.45 0.54
Sophisticated 0.0 0.79 0.31 0.69 0.35 0.68 0.32 0.69 0.39 0.66 0.39 0.66
Trendy 0.0 0.64 0.16 0.60 0.20 0.58 0.26 0.56 0.31 0.56 0.31 0.56
Up-scale 0.0 0.78 0.36 0.66 0.39 0.65 0.34 0.67 0.41 0.63 0.41 0.63
Table 3: Inference results for 13 ambiance dimensions, using R2 and RMSE as evaluation measures. Cells marked in bold cor-respond to the best R2 result obtained for each dimension. The Restaurant case (Case 2) contains 275 venues, while the rest ofcases contain 280 venues.
Case 4: Using the entire 50K dataset, we observe that results
improve compared to Case 1 for creepy, dingy, old- fashioned, ro-mantic, sophisticated, trendy, and up-scale. The R2 values are slighlylower for loud and off-beat. The improvements suggest that discrim-
inative patterns within the 50K dataset are picked up by the scene
parser. This could relate to the objects within the scene, but also
to differences in the types of images that people share, depending
on the type of venue. Overall, image diversity is advantageous for
inference.
Case 5: After adding the face demographic features, we see
that the results compared to Case 4 are similar, with differences
smaller than 0.02 in terms of R2 values. The only improvements
are for romantic, formal, and loud; this can be explained due to
the correlation of the fraction of females with romantic ambiance
scores, and the relationship between the fraction of images with
people, the number of people within images, and the fraction of
females, with respect to the ratings of loud ambiance.
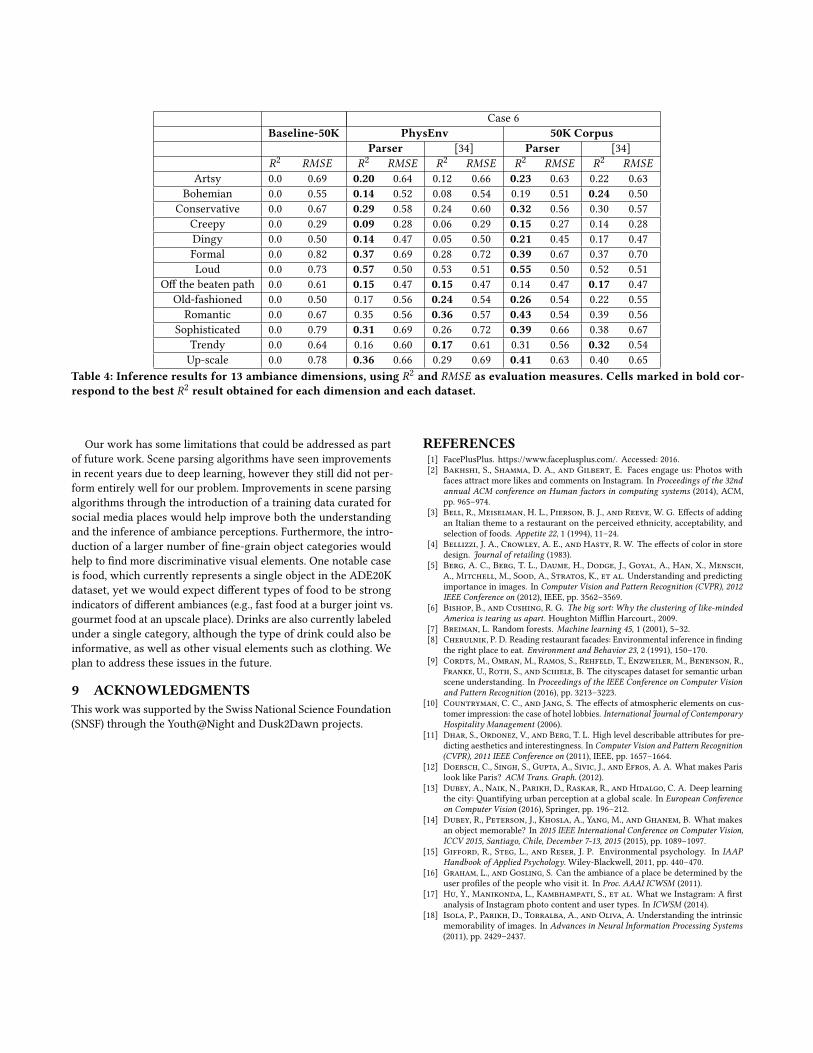
Case 6: In Table 4, we compare the regression results of the
scene parser-derived features with the GoogLeNet CNN-derived
features on the PhysEnv and the 50K datasets. First, by looking
at the R2 values of the PhysEnv dataset, we see that the scene
parser features outperform the GoogLeNet features for 9 ambiances,
with improvements of 0.09 for dingy and formal. The GoogLeNetclassifier outperforms the parser for old-fashioned, while similar
values can be seen for trendy, romantic, and offbeat. For the 50Kdataset, the parser outperforms the GoogLeNet classifier for 10
ambiances, yet the differences in terms of R2 are smaller, the largest
being 0.04 for dingy, old-fashioned, and romantic. The classifier
outperforms the parser for bohemian, off-beat, and trendy. Overall,the moderate improvement on the 50K dataset poses questions on
how the scene parser errors in diverse venue data (see Figure 1,
right) can be playing a role in limiting its performance, and how
the joint advantages of the scene parser and the 1000-object CNN
classifier could be possibly combined to extract more discriminative
visual cues. This is an issue for future work.
8 CONCLUSIONIn this paper, we addressed the question of what visual cues (scene
objects and demographic attributes) contribute to the automatic
inference of perceived ambiance in social media venues. Our study
was based on a database of Foursquare venues, represented both by
curated views of the physical environment and by the full image
content found in each venue. We have shown how a 150-object
category, deep scene parsing algorithm can be used to extract ob-
jects present in venue scenes. We also extracted basic demographic
attributes of people present in venues using a deep learning-based
face recognition platform. With these two kinds of visual cues, we
demonstrated through correlation analyses that a variety of au-
tomatically parsed objects relate to certain ambiance perceptions
(RQ1); furthermore, we found that a few demographic features also
relate to ambiance (RQ2). Taken together, our analysis contributes
new findings (related to objects and ambiance) and confirms recent
results (related to faces and ambiance) in multimedia and social
computing research on ambiance recognition. Moreover, we also
demonstrated that 8 out of 13 ambiance categories can be auto-
matically inferred from these visual cues in a regression task, with
R2 ≥ 0.3 (RQ3). We found that inference results marginally im-
proved for few ambiance categories (e.g. romantic and formal) byadding face features to scene objects. We found our proposed ap-
proach to be competitive with respect to previous work. For the
scene-centric image corpus (PhysEnv corpus), the scene parser
outperformed a GoogLeNet classifier-based approach. For the 50k
corpus, our approach resulted in improved performance for 10 of
the ambiance categories, representing marginal to moderate per-
formance improvement over previous work.
Case 6
Baseline-50K PhysEnv 50K CorpusParser [34] Parser [34]
R2 RMSE R2 RMSE R2 RMSE R2 RMSE R2 RMSE
Artsy 0.0 0.69 0.20 0.64 0.12 0.66 0.23 0.63 0.22 0.63
Bohemian 0.0 0.55 0.14 0.52 0.08 0.54 0.19 0.51 0.24 0.50
Conservative 0.0 0.67 0.29 0.58 0.24 0.60 0.32 0.56 0.30 0.57
Creepy 0.0 0.29 0.09 0.28 0.06 0.29 0.15 0.27 0.14 0.28
Dingy 0.0 0.50 0.14 0.47 0.05 0.50 0.21 0.45 0.17 0.47
Formal 0.0 0.82 0.37 0.69 0.28 0.72 0.39 0.67 0.37 0.70
Loud 0.0 0.73 0.57 0.50 0.53 0.51 0.55 0.50 0.52 0.51
Off the beaten path 0.0 0.61 0.15 0.47 0.15 0.47 0.14 0.47 0.17 0.47
Old-fashioned 0.0 0.50 0.17 0.56 0.24 0.54 0.26 0.54 0.22 0.55
Romantic 0.0 0.67 0.35 0.56 0.36 0.57 0.43 0.54 0.39 0.56
Sophisticated 0.0 0.79 0.31 0.69 0.26 0.72 0.39 0.66 0.38 0.67
Trendy 0.0 0.64 0.16 0.60 0.17 0.61 0.31 0.56 0.32 0.54
Up-scale 0.0 0.78 0.36 0.66 0.29 0.69 0.41 0.63 0.40 0.65
Table 4: Inference results for 13 ambiance dimensions, using R2 and RMSE as evaluation measures. Cells marked in bold cor-respond to the best R2 result obtained for each dimension and each dataset.
Our work has some limitations that could be addressed as part
of future work. Scene parsing algorithms have seen improvements
in recent years due to deep learning, however they still did not per-
form entirely well for our problem. Improvements in scene parsing
algorithms through the introduction of a training data curated for
social media places would help improve both the understanding
and the inference of ambiance perceptions. Furthermore, the intro-
duction of a larger number of fine-grain object categories would
help to find more discriminative visual elements. One notable case
is food, which currently represents a single object in the ADE20K
dataset, yet we would expect different types of food to be strong
indicators of different ambiances (e.g., fast food at a burger joint vs.
gourmet food at an upscale place). Drinks are also currently labeled
under a single category, although the type of drink could also be
informative, as well as other visual elements such as clothing. We
plan to address these issues in the future.
9 ACKNOWLEDGMENTSThis work was supported by the Swiss National Science Foundation
(SNSF) through the Youth@Night and Dusk2Dawn projects.
REFERENCES[1] FacePlusPlus. https://www.faceplusplus.com/. Accessed: 2016.
[2] Bakhshi, S., Shamma, D. A., and Gilbert, E. Faces engage us: Photos with
faces attract more likes and comments on Instagram. In Proceedings of the 32ndannual ACM conference on Human factors in computing systems (2014), ACM,
pp. 965–974.
[3] Bell, R., Meiselman, H. L., Pierson, B. J., and Reeve, W. G. Effects of adding
an Italian theme to a restaurant on the perceived ethnicity, acceptability, and
selection of foods. Appetite 22, 1 (1994), 11–24.[4] Bellizzi, J. A., Crowley, A. E., and Hasty, R. W. The effects of color in store
design. Journal of retailing (1983).
[5] Berg, A. C., Berg, T. L., Daume, H., Dodge, J., Goyal, A., Han, X., Mensch,
A., Mitchell, M., Sood, A., Stratos, K., et al. Understanding and predicting
importance in images. In Computer Vision and Pattern Recognition (CVPR), 2012IEEE Conference on (2012), IEEE, pp. 3562–3569.
[6] Bishop, B., and Cushing, R. G. The big sort: Why the clustering of like-mindedAmerica is tearing us apart. Houghton Mifflin Harcourt., 2009.
[7] Breiman, L. Random forests. Machine learning 45, 1 (2001), 5–32.[8] Cherulnik, P. D. Reading restaurant facades: Environmental inference in finding
the right place to eat. Environment and Behavior 23, 2 (1991), 150–170.[9] Cordts, M., Omran, M., Ramos, S., Rehfeld, T., Enzweiler, M., Benenson, R.,
Franke, U., Roth, S., and Schiele, B. The cityscapes dataset for semantic urban
scene understanding. In Proceedings of the IEEE Conference on Computer Visionand Pattern Recognition (2016), pp. 3213–3223.
[10] Countryman, C. C., and Jang, S. The effects of atmospheric elements on cus-
tomer impression: the case of hotel lobbies. International Journal of ContemporaryHospitality Management (2006).
[11] Dhar, S., Ordonez, V., and Berg, T. L. High level describable attributes for pre-
dicting aesthetics and interestingness. In Computer Vision and Pattern Recognition(CVPR), 2011 IEEE Conference on (2011), IEEE, pp. 1657–1664.
[12] Doersch, C., Singh, S., Gupta, A., Sivic, J., and Efros, A. A. What makes Paris
look like Paris? ACM Trans. Graph. (2012).[13] Dubey, A., Naik, N., Parikh, D., Raskar, R., and Hidalgo, C. A. Deep learning
the city: Quantifying urban perception at a global scale. In European Conferenceon Computer Vision (2016), Springer, pp. 196–212.
[14] Dubey, R., Peterson, J., Khosla, A., Yang, M., and Ghanem, B. What makes
an object memorable? In 2015 IEEE International Conference on Computer Vision,ICCV 2015, Santiago, Chile, December 7-13, 2015 (2015), pp. 1089–1097.
[15] Gifford, R., Steg, L., and Reser, J. P. Environmental psychology. In IAAPHandbook of Applied Psychology. Wiley-Blackwell, 2011, pp. 440–470.
[16] Graham, L., and Gosling, S. Can the ambiance of a place be determined by the
user profiles of the people who visit it. In Proc. AAAI ICWSM (2011).
[17] Hu, Y., Manikonda, L., Kambhampati, S., et al. What we Instagram: A first
analysis of Instagram photo content and user types. In ICWSM (2014).
[18] Isola, P., Parikh, D., Torralba, A., and Oliva, A. Understanding the intrinsic
memorability of images. In Advances in Neural Information Processing Systems(2011), pp. 2429–2437.

[19] Isola, P., Xiao, J., Parikh, D., Torralba, A., and Oliva, A. What makes a
photograph memorable? IEEE Trans. Pattern Anal. Mach. Intell. 36, 7 (2014),
1469–1482.
[20] Jae Lee, Y., Efros, A. A., and Hebert, M. Style-aware mid-level representation
for discovering visual connections in space and time. In Proceedings of the IEEEInternational Conference on Computer Vision (2013), pp. 1857–1864.
[21] Khosla, A., Sarma, A. D., and Hamid, R. What makes an image popular? In 23rdInternational World Wide Web Conference, WWW ’14, Seoul, Republic of Korea,April 7-11, 2014 (2014), pp. 867–876.
[22] Kotler, P. Atmospherics as a marketing tool. Journal of retailing 49, 4 (1973),48–64.
[23] Leyvand, T., Cohen-Or, D., Dror, G., and Lischinski, D. Data-driven enhance-
ment of facial attractiveness. In ACM Transactions on Graphics (TOG) (2008),vol. 27, ACM, p. 38.
[24] Liu, Y., and Jang, S. S. The effects of dining atmospherics: an extended
Mehrabian–Russell model. International Journal of Hospitality Management(2009).
[25] Manovich, L., Stefaner, M., Yazdani, M., Baur, D., Goddemeyer, D., Tifentale,
A., Hochman, N., and Chow, J. Selfiecity. New York, February (2014).
[26] Naik, N., Philipoom, J., Raskar, R., and Hidalgo, C. A. Streetscore - predicting
the perceived safety of one million streetscapes. In IEEE Conference on ComputerVision and Pattern Recognition, CVPR Workshops 2014, Columbus, OH, USA, June23-28, 2014 (2014), pp. 793–799.
[27] Ordonez, V., and Berg, T. L. Learning high-level judgments of urban perception.
In Computer Vision - ECCV 2014 - 13th European Conference, Zurich, Switzerland,September 6-12, 2014, Proceedings, Part VI (2014), pp. 494–510.
[28] Quercia, D., O’Hare, N. K., and Cramer, H. Aesthetic capital: what makes
London look beautiful, quiet, and happy? In Proc. CSCW (2014), ACM.
[29] Razavian, A., Azizpour, H., Sullivan, J., and Carlsson, S. Cnn features off-the-
shelf: an astounding baseline for recognition. In Proceedings of the IEEE Conferenceon Computer Vision and Pattern Recognition Workshops (2014), pp. 806–813.
[30] Redi, M., and Merialdo, B. Where is the beauty?: Retrieving appealing
videoscenes by learning Flickr-based graded judgments. In Proceedings of the20th ACM international conference on Multimedia (2012), ACM, pp. 1363–1364.
[31] Redi, M., Quercia, D., Graham, L. T., and Gosling, S. D. Like partying? your
face says it all. predicting the ambiance of places with profile pictures. In ICWSM(2015), M. Cha, C. Mascolo, and C. Sandvig, Eds., AAAI Press, pp. 347–356.
[32] Salesses, P., Schechtner, K., and Hidalgo, C. A. The collaborative image of
the city: mapping the inequality of urban perception. PloS one 8, 7 (2013), e68400.[33] Santani, D., andGatica-Perez, D. Loud and trendy: Crowdsourcing impressions
of social ambiance in popular indoor urban places. In Proceedings of the 23rdAnnual ACM Conference on Multimedia Conference (2015), ACM, pp. 211–220.
[34] Santani, D., Hu, R., and Gatica-Perez, D. Innerview: Learning place am-
biance from social media images. In Proceedings of the 2016 ACM on MultimediaConference (2016), ACM, pp. 451–455.
[35] Simonyan, K., and Zisserman, A. Very deep convolutional networks for large-
scale image recognition. arXiv preprint arXiv:1409.1556 (2014).[36] Souza, F., de Las Casas, D., Flores, V., Youn, S., Cha, M., Quercia, D., and
Almeida, V. Dawn of the selfie era: The whos, wheres, and hows of selfies on
Instagram. In Proceedings of the 2015 ACM on conference on online social networks(2015), ACM, pp. 221–231.
[37] Stroebele, N., and De Castro, J. M. Effect of ambience on food intake and food
choice. Nutrition (2004).
[38] Szegedy, C., Liu, W., Jia, Y., Sermanet, P., Reed, S., Anguelov, D., Erhan,
D., Vanhoucke, V., and Rabinovich, A. Going deeper with convolutions. In
Proceedings of the IEEE Conference on Computer Vision and Pattern Recognition(2015), pp. 1–9.
[39] Yu, F., and Koltun, V. Multi-scale context aggregation by dilated convolutions.
In ICLR (2016).
[40] Zhou, B., Lapedriza, A., Xiao, J., Torralba, A., and Oliva, A. Learning deep
features for scene recognition using places database. In Advances in neuralinformation processing systems (2014), pp. 487–495.
[41] Zhou, B., Liu, L., Oliva, A., and Torralba, A. Recognizing city identity via
attribute analysis of geo-tagged images. In ECCV. 2014.[42] Zhou, B., Zhao, H., Puig, X., Fidler, S., Barriuso, A., and Torralba, A. Scene
parsing through ADE20K dataset. In Proc. CVPR (2017).
[43] Zhou, E., Fan, H., Cao, Z., Jiang, Y., and Yin, Q. Extensive facial landmark
localization with coarse-to-fine convolutional network cascade. In Proceedings ofthe IEEE International Conference on Computer Vision Workshops (2013), pp. 386–391.