Velocity 2015 building self healing systems (slide share version)
71
Building Self- Healing Systems Todd Minnella and Matt Solnit, SOASTA
-
Upload
soasta -
Category
Data & Analytics
-
view
436 -
download
0
Transcript of Velocity 2015 building self healing systems (slide share version)
Building Self-Healing Systems
Todd Minnella and Matt Solnit, SOASTA
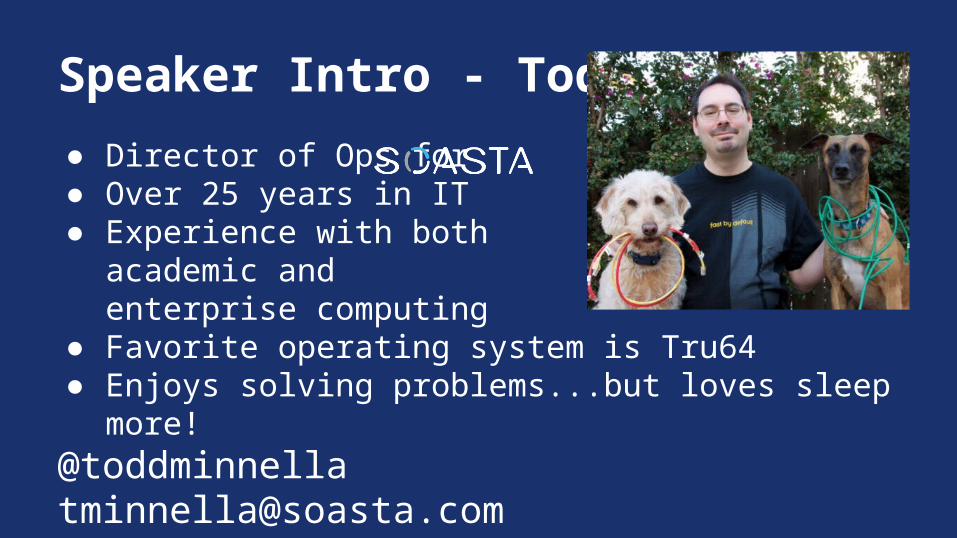
Speaker Intro - Todd
● Director of Ops for● Over 25 years in IT● Experience with both
academic andenterprise computing
● Favorite operating system is Tru64● Enjoys solving problems...but loves sleep more!@[email protected]

Speaker Intro - Matt
● VP of Engineering for ● Started programming with Atari BASIC in
elementary school● Ops on the side :-)● First Velocity presentation!

Who are you? :-)
http://www.cliarthut.com/clip-arts/751/who-are-you-clip-art-751173.jpg
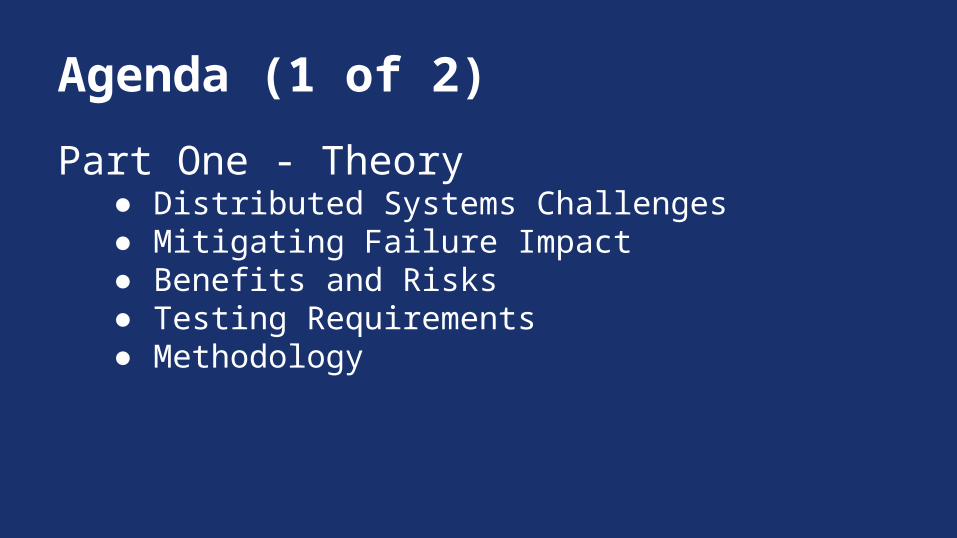
Agenda (1 of 2)
Part One - Theory● Distributed Systems Challenges● Mitigating Failure Impact● Benefits and Risks ● Testing Requirements● Methodology
Agenda (2 of 2)
Part Two - Practice● Description of Demo System● Example #1 - Externally Triggered Full GC● Example #2 - External System Restart● Example #3 - System-initiated Support Case● Tools Demonstrated● Other Ideas for Automation

Part One
Theory

What makes a distributed system?
● Multiple components● Different servers● Different regions (data center or geo)● A component failure != service or app failure● Requires systems thinking

Challenges faced by dist. systems
● Complexity● Uncontrollable elements● Hard to see the whole picture● Impossible for a single person to manage

What can we do about it?
Easy answer:
Add people!But… easy != correct

Better coping strategy
Enable your systems to heal themselves
...which is why we are here!

Benefits of Self-Healing
● Better uptime (at the component level)● Higher service quality● Rapid identification of repeating issues● Improved Ops team morale and productivity
Risk of Self-Healing Systems
● Worse uptime (at the component level)● Lower service quality● Maintenance complexities● Degraded Ops team morale and productivity

Risks

So why take the risks?
Implemented well, self-healing systems can make for happier customers!
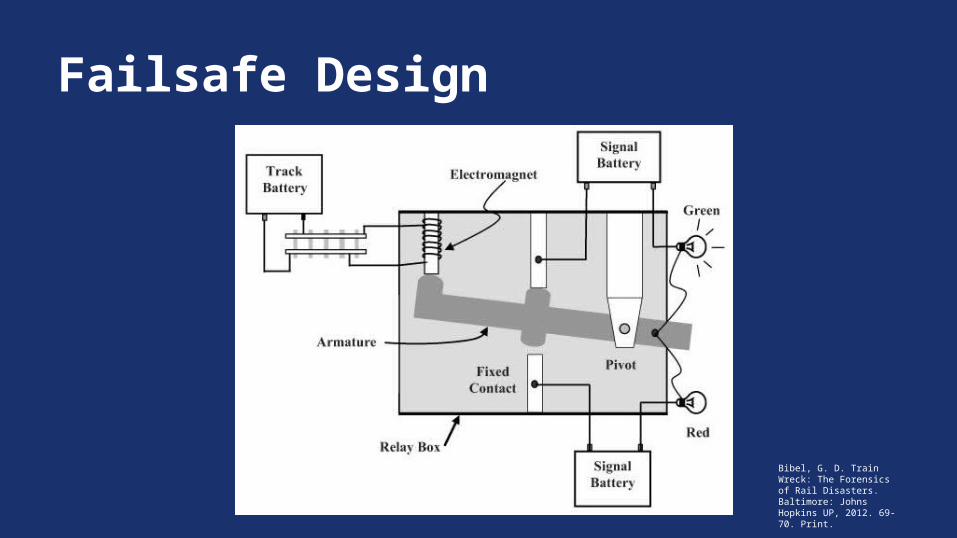
Failsafe Design
Bibel, G. D. Train Wreck: The Forensics of Rail Disasters. Baltimore: Johns Hopkins UP, 2012. 69-70. Print.

Methodology
Identify the ProblemDesign the SolutionExecute by Hand
Automate the solution Watch and adjust
PSHAW!

Part Two
Practice

Demo Application
Java App Server Farm (n = 2)Amazon Linux EC2 InstanceEC2 Elastic IP addressLoad Balanced via DNS (Dyn Traffic Director)Simple Web Application (HTTP/HTTPS)

Example #1Externally Triggered Full GC

Real-life mPulse example
Started reporting Java statistics to monitoring tool in 2013.When investigating outages, often found an exact correlation with large garbage collections (sound familiar?).Set up an alert to fire when heap usage went above 70%Everybody into the war room!

Real-life mPulse example, cont’d
Real-life mPulse example, cont’d
Engineering looks for a possible memory leak.Eventually someone says, “Just force a GC!”Most of the time, this would fix it. JVM isn’t perfect, if we help it then the system remains stable.Occasionally this didn’t fix it, which would indicate an actual bug.Engineering fixes, deploy, repeat!

“Intermittent gratification”90% of the time, there was no need to gather everyone together.
Real-life mPulse example, cont’d

Engineering says…
Ops, can you fix it?
Identify the Problem
1. Java isn’t garbage-collecting efficiently.2. Tuning the JVM is time-consuming and
dangerous.3. Forcing a collection works, but it requires
waking someone up.

Describe a Solution (1 of 2)
Identify a metric for JVM Heap Use that is indicative of the problem:
Java VM Old % UsedStart monitoring/reporting this metric.Specify a threshold for action:
Old % Used > 65%

Describe a Solution (2 of 2)
When the threshold is reached, take an action:Trigger a full garbage collection
After the action, monitor for success:Old % Used < 65%
Execute by Hand
Trigger the condition that causes the problem (or be patient and let it happen).
Once monitoring indicates high old % used, manually execute the full GC.
Automate the Solution, Manually Trigger
Write a script to check for Java old % used.Run the script via cron or similar mechanism.Report when old % used exceeds threshold.A DevOps human will trigger the full GC.

Script SnippetJAVA_PID=`pgrep -f -u tomcat /usr/lib/jvm/jre/bin/java`
RAW_JSTATS=`jstat -gcutil $JAVA_PID | grep -v "S0"`old_pcnt_used=`echo $RAW_JSTATS | cut -f4 -d" "`
integer_old_pcnt_used=`echo $old_pcnt_used | \ awk '{ printf ("%1.0f", $1) }'`
if [ $integer_old_pcnt_used -gt $oldpcnttrigger ]; thenecho "Would trigger full GC here"
fi
https://github.com/SOASTA/velocity-2015-self-healing-systems

DEMO (part 1)

Automate the Solution, Automate the Trigger
Taking the script shown previously, combine the step that:Reports that old % used > 65%with the step that:Triggers the full GC

DEMO (part 2)

Watch and adjust
Set up the automated script to run in as many test environments as are available/applicable.Review the results (script log, metrics graphs).Does it work?Investigate any issues thoroughly.Potentially, install the script in a dry-run mode in production.
Go Live!
We recommend a gradual deployment.Deploy to a subset of production, then assess.Expand the subset, assess again.When all of production is live, enjoy more sleep!

Example #2Externally Triggered Restart

Real-life mPulse example
Real-life mPulse example
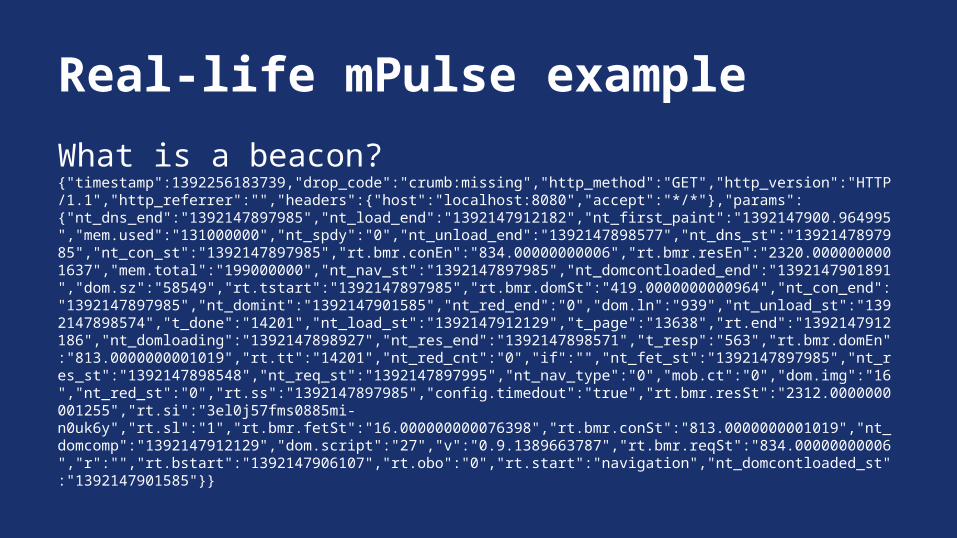
What is a beacon?{"timestamp":1392256183739,"drop_code":"crumb:missing","http_method":"GET","http_version":"HTTP/1.1","http_referrer":"","headers":{"host":"localhost:8080","accept":"*/*"},"params":{"nt_dns_end":"1392147897985","nt_load_end":"1392147912182","nt_first_paint":"1392147900.964995","mem.used":"131000000","nt_spdy":"0","nt_unload_end":"1392147898577","nt_dns_st":"1392147897985","nt_con_st":"1392147897985","rt.bmr.conEn":"834.00000000006","rt.bmr.resEn":"2320.0000000001637","mem.total":"199000000","nt_nav_st":"1392147897985","nt_domcontloaded_end":"1392147901891","dom.sz":"58549","rt.tstart":"1392147897985","rt.bmr.domSt":"419.0000000000964","nt_con_end":"1392147897985","nt_domint":"1392147901585","nt_red_end":"0","dom.ln":"939","nt_unload_st":"1392147898574","t_done":"14201","nt_load_st":"1392147912129","t_page":"13638","rt.end":"1392147912186","nt_domloading":"1392147898927","nt_res_end":"1392147898571","t_resp":"563","rt.bmr.domEn":"813.0000000001019","rt.tt":"14201","nt_red_cnt":"0","if":"","nt_fet_st":"1392147897985","nt_res_st":"1392147898548","nt_req_st":"1392147897995","nt_nav_type":"0","mob.ct":"0","dom.img":"16","nt_red_st":"0","rt.ss":"1392147897985","config.timedout":"true","rt.bmr.resSt":"2312.0000000001255","rt.si":"3el0j57fms0885mi-n0uk6y","rt.sl":"1","rt.bmr.fetSt":"16.000000000076398","rt.bmr.conSt":"813.0000000001019","nt_domcomp":"1392147912129","dom.script":"27","v":"0.9.1389663787","rt.bmr.reqSt":"834.00000000006","r":"","rt.bstart":"1392147906107","rt.obo":"0","rt.start":"navigation","nt_domcontloaded_st":"1392147901585"}}
Real-life mPulse example, cont’d
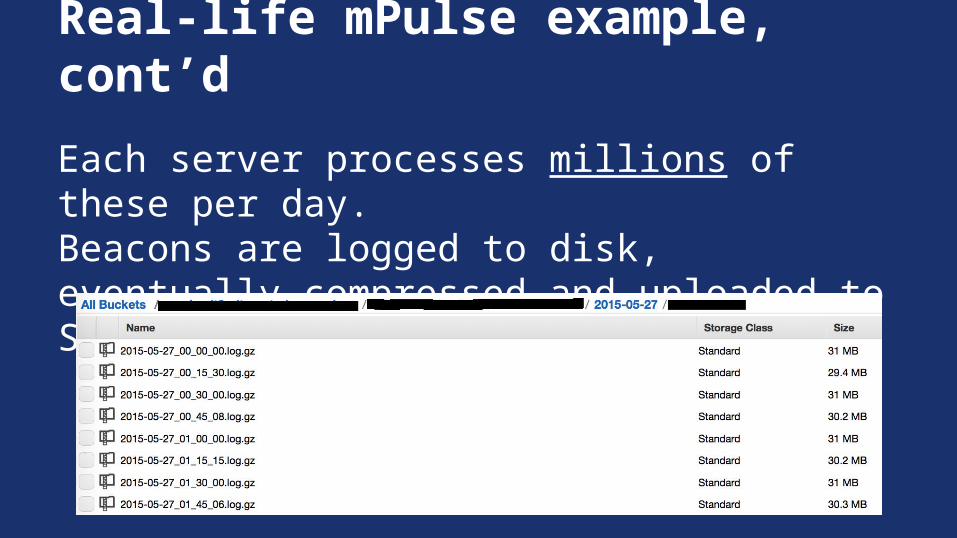
Each server processes millions of these per day.Beacons are logged to disk, eventually compressed and uploaded to S3.
Real-life mPulse example, cont’d
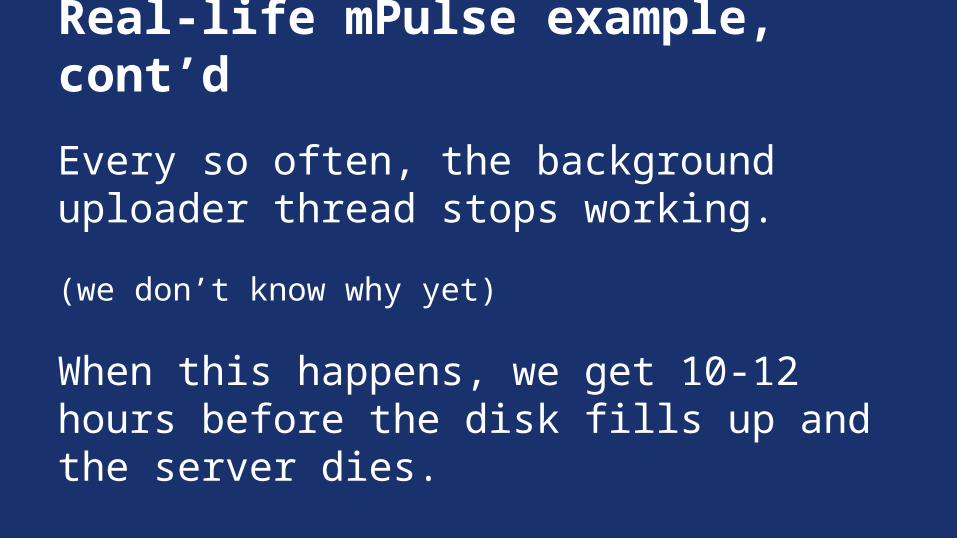
Every so often, the background uploader thread stops working.
(we don’t know why yet)
When this happens, we get 10-12 hours before the disk fills up and the server dies.

Real-life mPulse example, cont’d
A simple re-start fixes it.
SO...
While developers are investigating, Ops is getting paged (and woken up) to re-start boxes.

Ops says…
We can do better!

Identify the Problem (Demo App)
● Lack of activity indicates a failed thread● While the issue goes unresolved, data is
delayed (and the disk may fill)

Describe a Solution
● A restart of the application solves the problem
● The application server needs to be removed from service prior to the restart
● The server hosting the application is an AWS instance, and a reboot is fast and effective
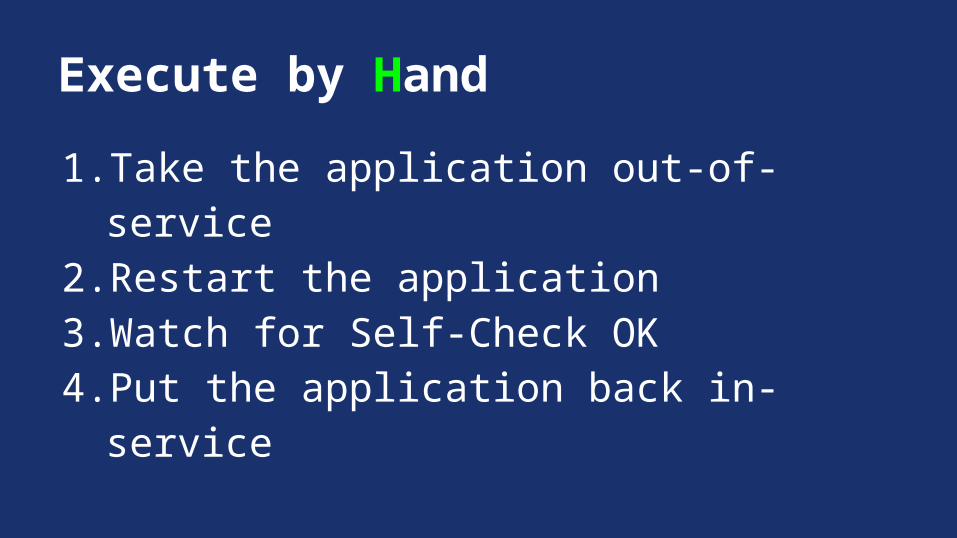
Execute by Hand
1. Take the application out-of-service2. Restart the application3. Watch for Self-Check OK4. Put the application back in-service

Automate the Solution, Manually Trigger
● Log metrics go to AWS CloudWatch● Lack of activity triggers an Alarm● Alarm triggers a SNS notification● Human being makes the DNS changes and
restart the server.

DEMO

Developers say…
We can do better!
Automate the Solution, Automate the Trigger
● EC2 and DynECT both have APIs● DNS changes and reboot can all be
automated● Todd can sleep!

Automate the Solution, Automate the Trigger
AWS LambdaUpload code to Amazon (Node.js)Attach it to a listener (SNS)No instance required!

Automate the Solution, Automate the Trigger
Lambda function listens on “logs are not being uploaded” notification.Uses Dyn REST API to disable the DNS record.Uses EC2 API to re-boot the instance.

Automate the Solution, Automate the Trigger
Lambda function listens on “all OK” notification.Uses Dyn REST API to re-enable the DNS record.
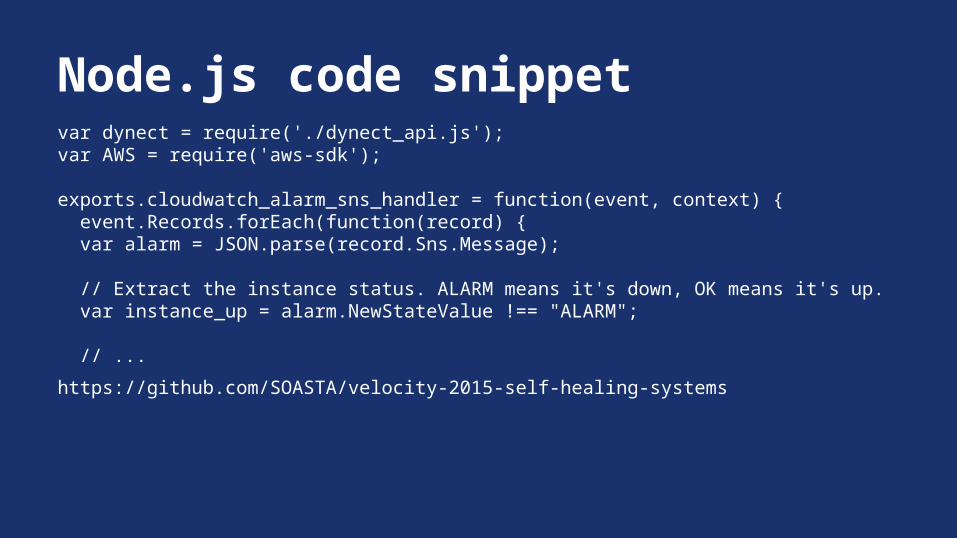
var dynect = require('./dynect_api.js');var AWS = require('aws-sdk');
exports.cloudwatch_alarm_sns_handler = function(event, context) { event.Records.forEach(function(record) { var alarm = JSON.parse(record.Sns.Message);
// Extract the instance status. ALARM means it's down, OK means it's up. var instance_up = alarm.NewStateValue !== "ALARM";
// ...
https://github.com/SOASTA/velocity-2015-self-healing-systems
Node.js code snippet
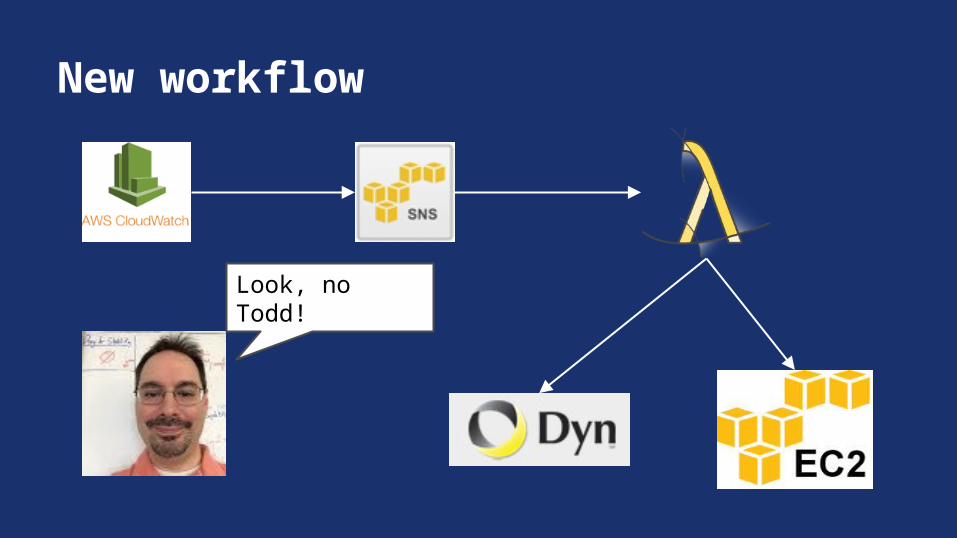
New workflow
Look, no Todd!

DEMO
Watch and adjust
● Include Ops team on ALARM and SELFCHECKOK notifications
● Observe effects - use monitoring tools to assess availability
Example #3Application files support ticket
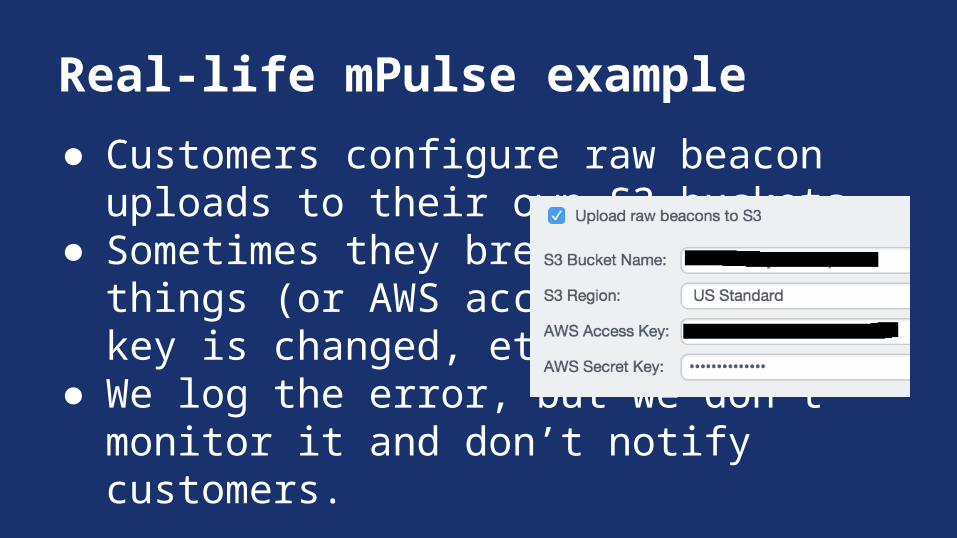
Real-life mPulse example
● Customers configure raw beacon uploads to their own S3 buckets.
● Sometimes they breakthings (or AWS accesskey is changed, etc.)
● We log the error, but we don’t monitor it and don’t notify customers.

Identify the Problem
● Another example: yser connecting to a site can’t authenticate successfully
● Assumption is that this is a limited access site

DevOps says…
Now, let’s help our customers succeed!
Describe a Solution
● Notify the Customer Support team● Provide Support with details so that they can
proactively reach out

Execute by Hand
● Examine the logs for the error● Review the situation with Support● Work with Support to handle a case end-to-
end

Automate the Solution, Manually Trigger
● Log metrics go to AWS CloudWatch● Presence of error triggers an Alarm● Alarm triggers a SNS notification● Human being can then create a Zendesk
case

Automate the Solution, Automate the Trigger
● AWS Lambda listens on SNS notification● Collects information from the notification● Files a Zendesk case categorized to go to
the correct team
AWS Lambda Actions
On Failed Login notification● Create a Zendesk case with user details
Watch and adjust
● Ops reviews logs● Ops meets with Support to review case
frequency and outcomes

Testing Requirements
● Start small● Develop (and verify) in stages● Let run in production-like environment● Verify behavior in “dry-run” mode
Tools Demonstrated - AWS
CloudWatch http://aws.amazon.com/cloudwatch/
EC2 http://aws.amazon.com/ec2/
Lambda http://aws.amazon.com/lambda/
Linux http://aws.amazon.com/amazon-linux-ami/

Tools Demonstrated - Other
Datadog https://www.datadoghq.com/product/
Dyn Traffic Director http://dyn.com/traffic-director/
Monitis http://www.monitis.com/
PagerDuty http://www.pagerduty.com
ZenDesk https://www.zendesk.com
See SOASTA at booth #801